 Jing Liu1
 Shenxin Li
94% of researchers rate our articles as excellent or good
Learn more about the work of our research integrity team to safeguard the quality of each article we publish.
Find out more
ORIGINAL RESEARCH article
Front. Environ. Sci., 06 July 2022
Sec. Atmosphere and Climate
Volume 10 - 2022 | https://doi.org/10.3389/fenvs.2022.934281
This article is part of the Research TopicAir Pollution Remote Sensing and the Subsequent Interactions with Ecology on Regional ScalesView all 31 articles
Assessments of premature deaths caused by PM2.5 exposure have important scientific significance and provide valuable information for future human health–oriented air pollution prevention. PM2.5 concentration data are particularly vital and may cause great uncertainty in premature death assessments. This study constructed an index of deviation frequency to compare differences in premature deaths assessed by five sets of extensively used PM2.5 concentration remote sensing datasets. Then, a preferred combination project of the PM2.5 dataset was proposed by selecting relatively high-accuracy PM2.5 concentration datasets in areas with significant differences. Based on this project, an index of uncertainty was constructed to quantify the effects of using different PM2.5 datasets on premature death assessments. The results showed that there were significant differences in PM2.5 attributable to premature deaths assessed by different datasets from 2000 to 2016, and the differences were most obvious in 2004. Spatially, differences were most significant in Jilin, Fujian, Liaoning, Hebei, Shanxi, Hubei, Sichuan, and Yunnan. The differences were caused by PM2.5 concentration; therefore, in order to reduce uncertainty in subsequent premature death assessments because of using different PM2.5 concentration data, the CGS3 dataset was recommended for Jilin, Sichuan, Yunnan, and Fujian, and the CHAP dataset was recommended for Liaoning, Hebei, Shanxi, and Hubei, and for other regions, CGS3, CHAP, or PHD datasets were more applicable. The CHAP dataset was the best selection for premature death assessments in the whole area. Based on the preferred combination project of the PM2.5 dataset, uncertainty in annual premature death assessments could be reduced by 31 and 159% in the whole and local area, respectively. The research results will provide a scientific basis for a reasonable selection of PM2.5 concentration remote sensing datasets in air pollution premature death assessments in China.
PM2.5 is the primary air pollutant in China, and long-term exposure to high PM2.5 pollution levels will increase the risk of cardiovascular disease, respiratory disease, etc. (Laden et al., 2006; Cohen et al., 2018; Maji et al., 2020; Shen M. et al., 2021). Accurate assessments of health risks caused by PM2.5 pollution are important for the Chinese government to carry out environmental measures for improving people’s health. Air pollution concentration data are critical for assessing the health risks of PM2.5 (Ma et al., 2022).
Traditionally, ground monitoring networks have been the basic method to provide PM2.5 concentration, which were established in late 2012 in China (Wang H. et al., 2021). Although ground monitoring of PM2.5 data is accurate, it is difficult to reveal the spatial distribution of regional-scale PM2.5 concentration due to the limited spatial representation (Gupta et al., 2006; Van Donkelaar et al., 2010). In addition, the lack of historical data has limited the acquisition of longitudinal data on PM2.5 concentration. Health risk assessments deeply depend on large-scale and long-term PM2.5 concentration data. However, the limitation mentioned above has affected the development of the studies on large-scale and long-term health risk assessments.
Fortunately, satellite remote sensing has the advantage of wide spatial-temporal coverage, which can effectively fill the spatial–temporal PM2.5 gaps left by ground monitoring networks (Hu et al., 2014; Hoogh et al., 2018; Stafoggia et al., 2019; He et al., 2021). Hence, it has been widely used to estimate PM2.5 spatial–temporal continuous data in recent years. Also it further provides technical support for large-scale and long-term health risk assessments (Liu et al., 2017; Wang L. et al., 2021). For example, Zou et al. (2019) estimated premature deaths in China were 1.05 million based on PM2.5 concentration refined by a hybrid remote sensing-geostatistical approach. Li et al. (2021) estimated that premature deaths in China were 1.1 million based on PM2.5 concentration simulated by the WRF-Chem. Liang et al. (2020) concluded that premature deaths in China were 2.2 million assessed by PM2.5 concentration simulated by high-performance machine learning models based on satellite data, meteorological conditions, land cover information, and so on. Although the disadvantages of spatial–temporal coverage were remedied by the satellite remote sensing technique, there were differences in PM2.5 concentration and premature death assessments due to differences in parameters and model algorithm of PM2.5 estimation.
In order to reduce differences in premature deaths assessed by different PM2.5 concentration remote sensing data, a large number of researchers focus on proposing a set of standard datasets with large scale and long term assessment. At present, the extensively used datasets in China include three sets of “Geophysical Satellite-Based PM2.5 datasets” (1 km, 5 km, 10 km) with different spatial resolutions released by the Atmospheric Composition Analysis Group (Van Donkelaar et al., 2015; Van Donkelaar et al., 2016; Van Donkelaar et al., 2019; Hammer et al., 2020). The “PM2.5 Hindcast database” (10 km) was released by Xue et al. (2019) as well as the “ChinaHighPM2.5” dataset (1 km) was published by Wei et al. (2020), Wei et al. (2021). However, there are no relevant studies that compare systematically the differences in health risks assessed by these five sets of PM2.5 concentration remote sensing datasets.
In view of this, how to take full advantage of these five sets of PM2.5 concentration remote sensing datasets and reduce the uncertainty in health risk assessments in China is an urgent problem in the cross-research field of remote sensing and health risks. In this study, an index of deviation frequency was constructed to evaluate the differences in PM2.5 attributable premature deaths when choosing various PM2.5 data. Then, in order to reduce uncertainty in premature death assessments caused by various PM2.5 concentration data, the preferred combination project of the PM2.5 dataset was proposed in the areas with significant differences. The preferred combination project of the PM2.5 dataset was proposed for different regions to provide data support for accurately estimating the effects of air pollution in health risk research. Also, it also put forward new ideas for the focus of air quality data simulation in the future. Findings from this study will provide new knowledge for policy-making of “China’s 14th Five-Year Plan” air pollution intervention and health risk prevention.
As an important east–west boundary, cities on each side of the Hu line showed obvious differences both in PM2.5 concentration and population density (Li et al., 2020). The Yangtze River Delta Urban Agglomerations, the urban agglomeration in the middle reaches of the Yangtze River, and other regions, which were located in the east of the Hu Line, were agglomeration areas of cities with high levels of PM2.5 pollution (Shen L. et al., 2021). As an important agglomeration area of population and economy in China, the population in this area reaches 1.2 billion, accounting for 94% of the country (Wang et al., 2019). Therefore, the study area is defined as the mainland of eastern China below the Hu line (excluding Heilongjiang Province, Hong Kong, Macao, and including Ningxia Hui Autonomous Region) and includes 19 provinces, four central government–controlled municipalities, and two autonomous regions, all referred to here as provinces (Figure 1).
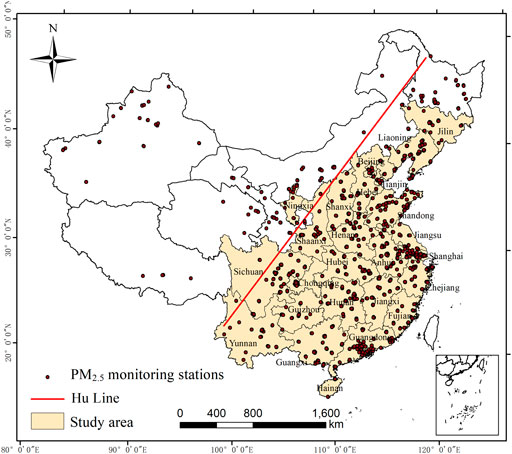
FIGURE 1. Location of the study area.
The technical flowchart of this study is shown in Figure 2. There were three main steps. The first step was to analyze spatial–temporal differences of PM2.5 attributable to premature deaths based on the index of deviation frequency. The second step was to propose a preferred combination project of the PM2.5 dataset based on the accuracy assessment in the areas with significant differences. The third step focuses on identifying uncertainty in health risk assessments by comparing assessments of the preferred combination project of the PM2.5 dataset with assessments of five sets of initial datasets.
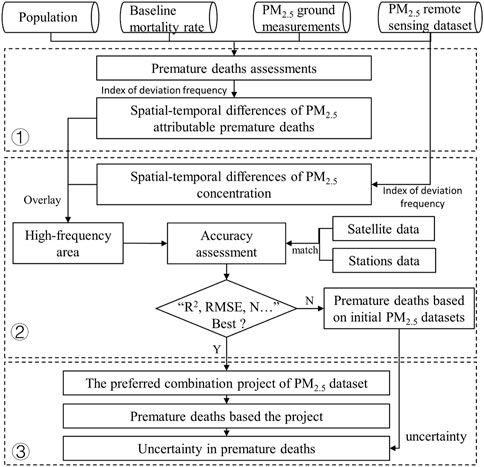
FIGURE 2. Technical flowchart of this study.
PM2.5 concentration remote sensing datasets used in the study mainly include 1) PM2.5 concentration retrieved by the atmospheric chemical transport model, including three sets of datasets: China Geophysical Satellite–Based PM2.5-V4.CH.03 (CGS3), Global Geophysical Satellite–Based PM2.5-V4.GL.03 (GGS3), and China Geophysical Satellite–Based PM2.5-V4.GL.02 (CGS2), with R2 between 0.81–0.92. 2) Using the STET machine learning method to retrieve the ChinaHighPM2.5 (CHAP) dataset, R2 is 0.94. 3) Using the HD-expansion machine learning method to retrieve the PM2.5 Hindcast Database (PHD) with R2 of 0.77. The details of the datasets are shown in Table 1.
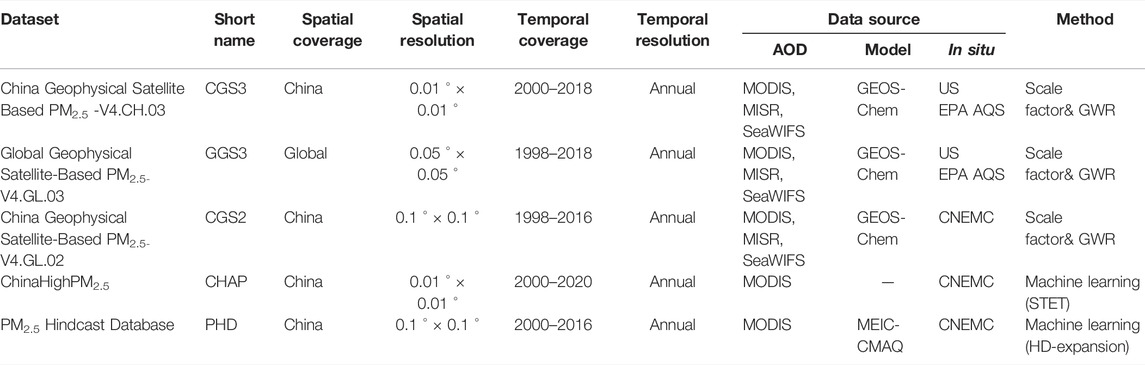
TABLE 1. Five sets of PM2.5 datasets in China.
The station-based annually averaged PM2.5 concentration (μg/m3) data were calculated. Hourly PM2.5 concentration from January 2013 to December 2016 was obtained from the China National Environmental Monitoring Center website (http://106.37.208.233:20035/). According to the Chinese National Ambient Air Quality Standards (CNAAQS), the following preprocessing was performed on data: all missing or invalid data were removed from original observations. Values of observations at stations with fewer than 20 h in a day, fewer than 27 days in a month (25 in February), or fewer than 324 days in a year were eliminated when calculating the annually averaged PM2.5 concentration.
Populations and baseline mortality rates are fundamental parameters for premature death assessments. Population data at 1 km resolution across mainland China were downloaded from Worldpop (https://www.worldpop.org/). The population of adults (aged ≥25 years) was obtained by subtracting the population aged under 25 years old from the total population at 1 km resolution in China. Baseline mortality rate data were derived from Global Burden of Disease (GBD) (http://ghdx.healthdata.org/), including lower respiratory infection and non-communicable diseases.
This study used the Global Exposure Mortality Model (GEMM) to estimate PM2.5 attributable premature deaths. The GEMM is an improved and optimized health risk estimation model based on the Integrated Exposure Response (IER) (Burnett et al., 2014). Compared with IER, the GEMM covers a large number of population samples and PM2.5 concentration data and optimizes the accuracy of PM2.5 health risk assessments at low concentrations (Burnett et al., 2018; Li et al., 2021). Using the GEMM to estimate premature deaths in adults due to long-term exposure to PM2.5, the equation is as follows:
where
The main difference between the IER and GEMM model is the calculation of
where
Deviation frequency was constructed to evaluate the degree of differences in PM2.5 concentration and premature deaths between five sets of datasets. The index of deviation frequency refers to the frequency of occurrence of high deviation between any two datasets. The calculation processing was as follows: PM2.5 concentration data and premature death data were resampled to a resolution of 1 × 1 km from 2000 to 2016 and then the absolute value of relative differences between any two datasets was taken as deviation. The third quartile of all deviation values was the threshold, and values above the threshold were defined as high deviation. The equation is as follows:
where
The deviation equation of PM2.5 concentration or premature deaths between dataset
where
Uncertainty was used to estimate differences in premature deaths between the preferred combination project of the PM2.5 dataset and five sets of initial datasets. The preferred combination project of the PM2.5 dataset was obtained by assessing the PM2.5 concentration accuracy and selecting the dataset with higher accuracies. Through matching of ground monitoring stations and satellite data, satellite data with the same spatial–temporal coverage as station data were screened out. Then, statistical values (R2, RMSE, MAE, Slope, N, etc.) were selected as the quantitative evaluation indicators to evaluate the accuracy of satellite data. Taking the number of premature deaths assessed by the preferred combination project of the PM2.5 dataset as a benchmark, uncertainty was the percentage of differences between the number of premature deaths assessed by five sets of initial PM2.5 datasets and the benchmark data. The equation is as follows:
where
Figure 3 shows the temporal trend of annual premature deaths based on five sets of PM2.5 concentration remote sensing datasets. Generally, the temporal trend of premature deaths assessed by five sets of datasets was consistent, and the number of premature deaths first increased and then decreased. For the number, premature deaths assessed by five sets of PM2.5 datasets were in order of CHAP > PHD > GGS3 > CGS3 > CGS2. Premature death assessed by the CHAP dataset was the largest, ranging from 1.38 million (in 2000) to 1.87 million (in 2013). Premature death assessed by the CGS2 dataset was the lowest, ranging between 0.94 million (in 2000) and 1.51 million (in 2015). On the aspect of growth rate, premature death assessed by the CGS2 dataset was most pronounced at 47%, whereas the CHAP was lowest at 13%. In terms of temporal variation, premature deaths assessed by the CHAP, PHD, GGS3, and CGS3 datasets showed an increasing trend from 2000 to 2011, fluctuated from 2011 to 2013, and decreased from 2013 to 2016. The peak value of premature deaths assessed by the PHD, GGS3, and CGS3 datasets appeared in 2011, while the peak value of CHAP appeared in 2013. However, premature deaths assessed by the CGS2 dataset had decreased since 2011, fluctuated from 2013 to 2015, and peaked in 2015. In addition, differences in premature deaths assessed by five sets of PM2.5 datasets were obvious in 2000–2004 and 2011–2013 and sharply decreased since 2013, which may be related to the improvement in accuracy of PM2.5 concentration data after 2013.

FIGURE 3. Annual premature deaths were assessed by five sets of PM2.5 datasets from 2000 to 2016.
Figure 4 shows the spatial distribution of deviation frequency in premature deaths assessed by different PM2.5 datasets. The obvious differences were in western Sichuan, with deviation frequency in premature deaths assessed by all datasets of 15–17. There were great differences in premature deaths in western and eastern Jilin, northern Hebei, and southwestern Yunnan, with deviation frequency of 15–17 between CHAP and CGS2, CHAP and CGS3, CHAP and GGS3, PHD and CGS2, and PHD and CGS3 datasets. Regions with little differences were mainly concentrated in Shandong, Henan, Anhui, and Jiangsu.
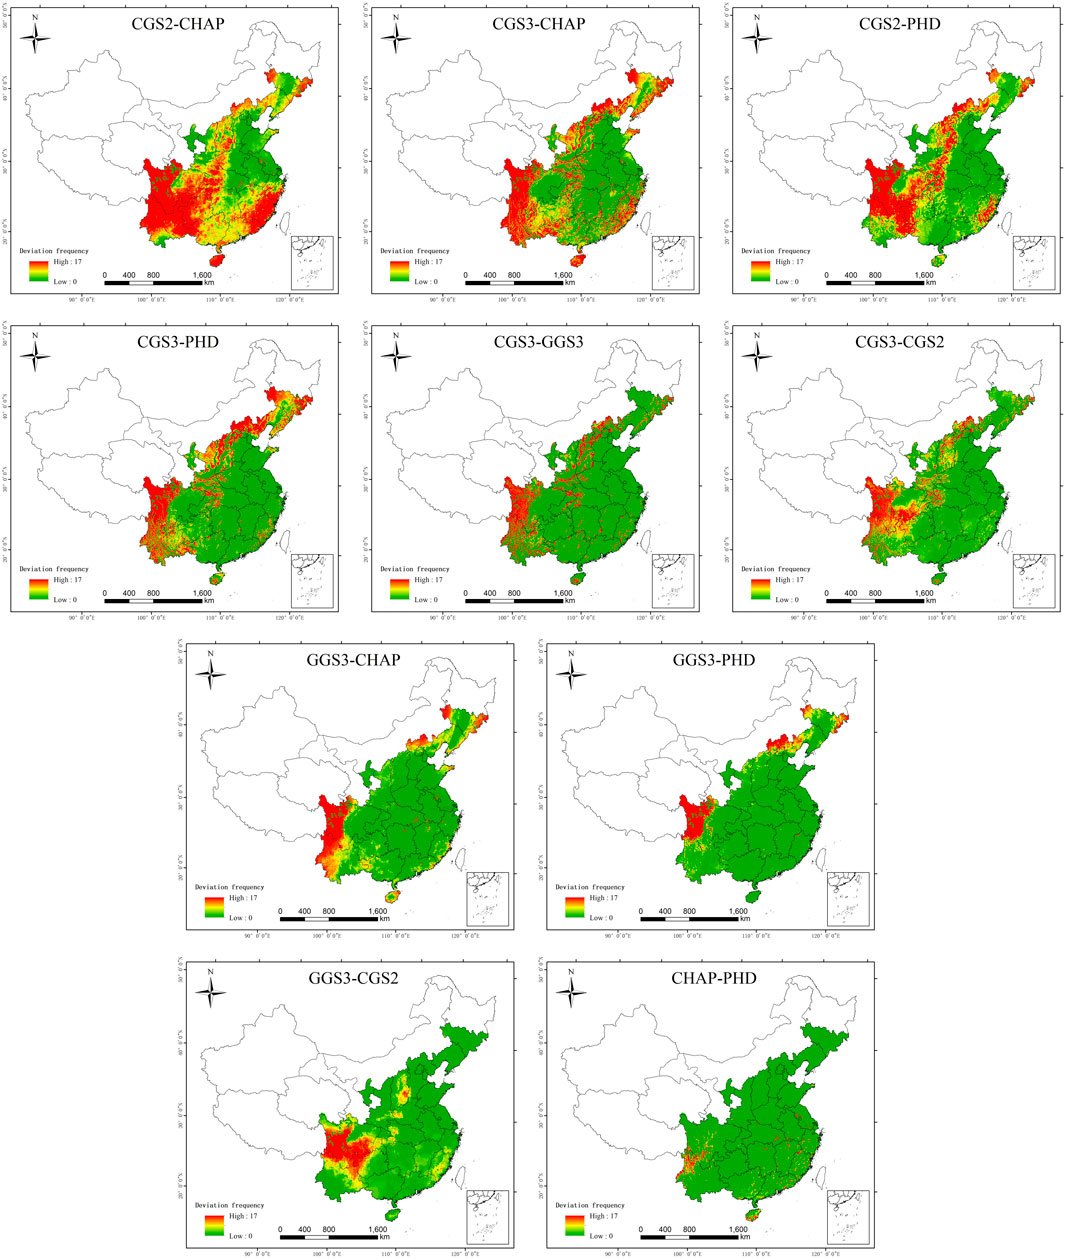
FIGURE 4. Spatial distribution of deviation frequency in premature deaths assessed by any two PM2.5 datasets.
Figure 5 shows the area ratio of the deviation frequency index between different datasets. Differences in premature deaths assessed by the CGS2 and CHAP datasets were the largest, and the area ratio of deviation frequency of 15–17 was 26%. Differences in premature deaths assessed by the CHAP and PHD datasets were minimal, and the area ratio of deviation frequency of 15–17 was less than 1%, while the area ratio of deviation frequency of 0–2 was as high as 94%.

FIGURE 5. Area ratio of deviation frequency in premature deaths was assessed by any two PM2.5 datasets.
Figure 6 shows the temporal trend of annual PM2.5 concentration of five sets of datasets from 2000 to 2016. In general, the temporal trend of PM2.5 concentration of all datasets was the same except for the CGS2 dataset, which first increased and then decreased. For annual PM2.5 concentration, the order of five sets of datasets was CHAP > PHD > GGS3>CGS3>CGS2. PM2.5 concentration of the CGS2 dataset was the lowest, ranging from 25 μg/m3 (in 2000) to 40 μg/m3 (in 2007), with an average PM2.5 concentration of 34 μg/m3. PM2.5 concentration of the CHAP dataset was the highest, ranging from 40 μg/m3 (in 2016) to 60 μg/m3 (in 2013), with an average of 54 μg/m3. From the perspective of temporal variation, the PM2.5 concentration of the CHAP and PHD datasets showed an upward trend from 2000 to 2007, fluctuated from 2007 to 2013, and decreased from 2013 to 2016, and the peak values of PM2.5 concentration appeared in the year of 2011 and 2013. Different from the CHAP and PHD datasets, the PM2.5 concentration of the GGS3 and CGS3 datasets showed a downward trend from 2000 to 2004, fluctuated upward from 2004 to 2011, and then decreased rapidly, peaking in 2011. There were significant differences in PM2.5 concentration temporal variation between the CGS2 dataset and other datasets as its PM2.5 concentration showed a downward trend from 2010 to 2012, and the peak value appeared in 2007.
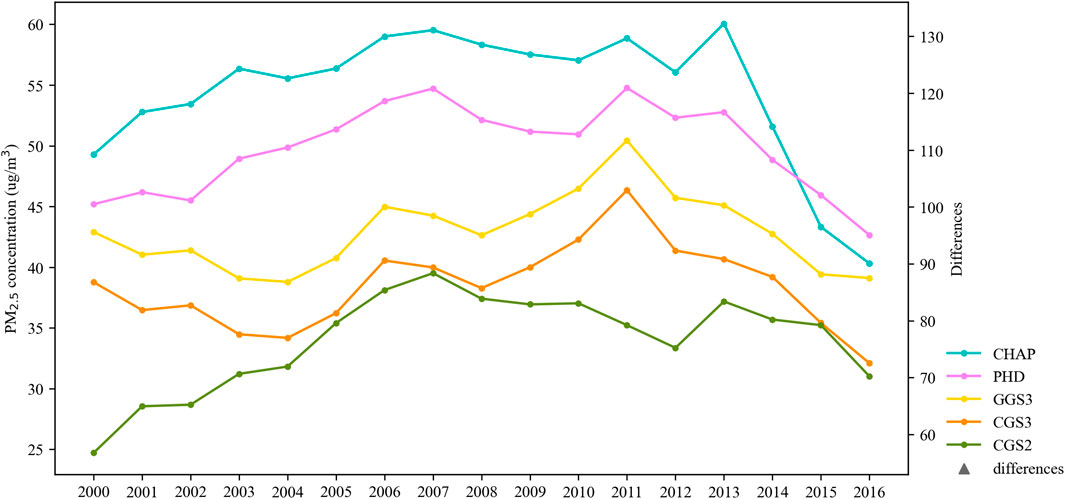
FIGURE 6. Annual PM2.5 concentration of five sets of PM2.5 datasets from 2000 to 2016.
Figure 7 shows the spatial distribution of deviation frequency in the PM2.5 concentration. Generally, differences in PM2.5 concentration of five sets of datasets were few. However, in local areas, similar to the spatial distribution of differences in premature deaths, the significant differences in PM2.5 concentration were found in western Sichuan, with a deviation frequency of 15–17. Then, differences were followed by those in western and eastern Jilin, northern Hebei, and southwestern Yunnan, and few differences were found in Shandong, Henan, Anhui, and Jiangsu.
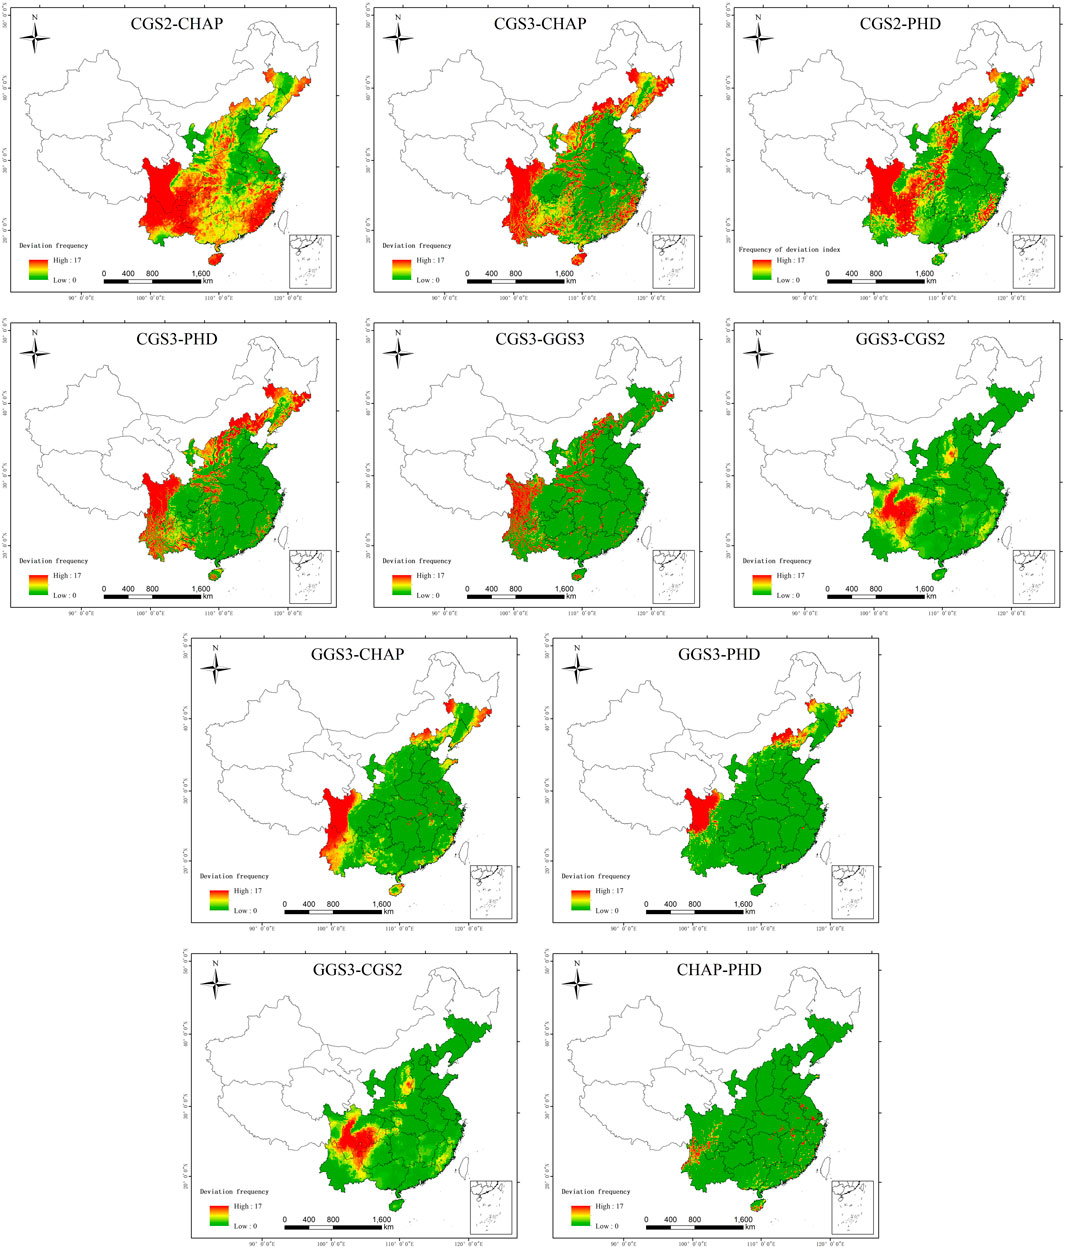
FIGURE 7. Spatial distribution of deviation frequency in PM2.5 concentration between any two PM2.5 datasets.
Figure 8 shows the area ratio of deviation frequency in different PM2.5 concentrations. PM2.5 concentration of the CGS2 and CHAP datasets experienced the largest differences, and the area ratio of deviation frequency of 15–17 accounted for 27%. The CHAP and PHD datasets had little differences in PM2.5 concentration, and the area ratio of deviation frequency of 0–2 accounted for as high as 93%. Comparing the differences in premature deaths with differences in PM2.5 concentration, it could be seen that these were highly consistent in spatial distribution. This result indicated that differences in PM2.5 concentrations may be the important factor leading to differences in premature deaths. Screening and using the higher precision PM2.5 concentration remote sensing data are the key to accurately assessing the PM2.5 attributable premature deaths.
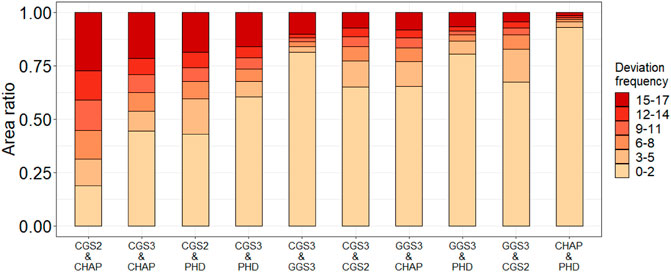
FIGURE 8. Area ratio of deviation frequency in PM2.5 concentration between any two PM2.5 datasets.
In order to evaluate the applicability of PM2.5 datasets in assessments of premature deaths, this study compared the accuracy of PM2.5 concentration remote sensing datasets in the areas with significant differences. To overlay analysis of high-frequency areas of PM2.5 concentration differences (i. e. deviation frequency is 15–17) and high-frequency areas of premature death differences, the areas with significant differences were screened out (Figure 9). Among them, region A mainly includes the northwestern and eastern parts of Jilin, region B mainly includes southwestern Liaoning, northern Hebei, and northern Shanxi, region C mainly includes western Hubei, region D mainly includes Sichuan and western Yunnan, and region E mainly includes Fujian.
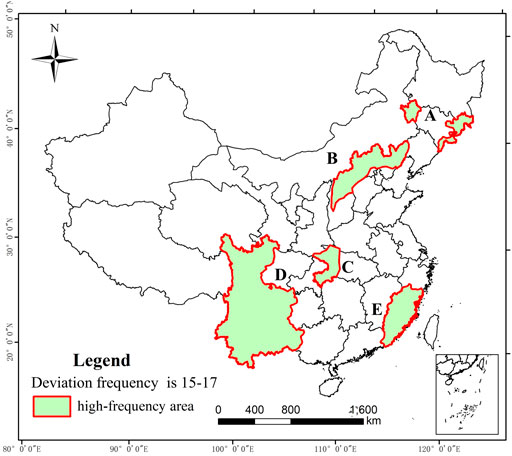
FIGURE 9. Areas with significant differences both in PM2.5 concentration and premature deaths.
The accuracy assessment results of different PM2.5 concentration remote sensing datasets are shown in Figure 10. Five sets of PM2.5 concentration remote sensing datasets in the northwest and eastern Jilin (region A) were inconsistent with ground-based PM2.5 measurements, with the highest R2 of 0.13 (the CGS3 dataset), while the slope of the CHAP dataset was best. In region B, the CHAP dataset worked well, and the cross-validation result was 0.72, while the cross-validation result of the CGS2 dataset was the worst. The CHAP dataset in region C had the best cross-validation result, with an R2 of 0.74. In region D, PM2.5 concentration of the CGS3, CHAP, and PHD datasets agreed well with ground-based PM2.5 measurements, with R2 of 0.77, 0.71, and 0.70, respectively. The CGS3 dataset had the best fitting result in region E, with an R2 of 0.61. In summary, among currently representative PM2.5 concentration remote sensing datasets in China, the model fitting results of the CHAP datasets were better than those of the other datasets by comparing the indicator of R2, MAE, slope, and so on.
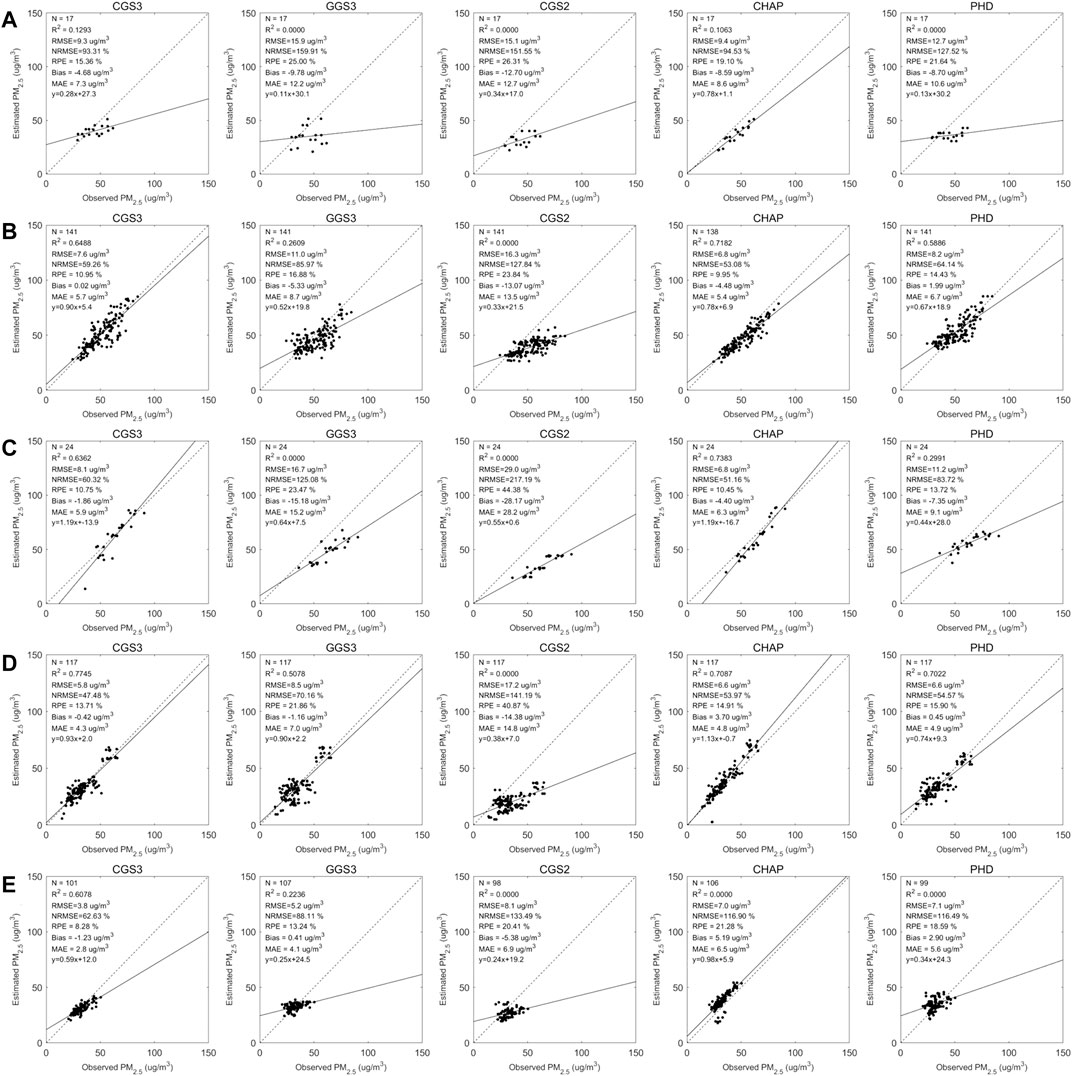
FIGURE 10. Scatterplots of fitting and cross-validating results in the areas with significant differences. P.S. (A–E) are areas with significant differences in Figure 9.
By comparing the accuracy assessment results in PM2.5 concentration of five sets of PM2.5 datasets, the selection suggestions of the PM2.5 dataset for premature deaths were obtained (Table 2). According to the selection suggestions, the preferred combination project of the PM2.5 dataset is as follows: the CGS3 dataset was recommended for Jilin, Sichuan, Yunnan, and Fujian; the CHAP dataset was recommended for Liaoning, Hebei, Shanxi, and Hubei; and for other regions, CGS3, CHAP, or PHD datasets were more applicable. The results showed that, on the one hand, five sets of PM2.5 concentration datasets in Jilin, Liaoning, Fujian, and other regions need to be selected and used carefully due to significant differences in accuracy, and the premature deaths assessed by any single PM2.5 concentration remote sensing dataset in the total area will enlarge the uncertainty of assessment results. On the other hand, the CHAP dataset was the best selection for premature death assessments in the whole area.
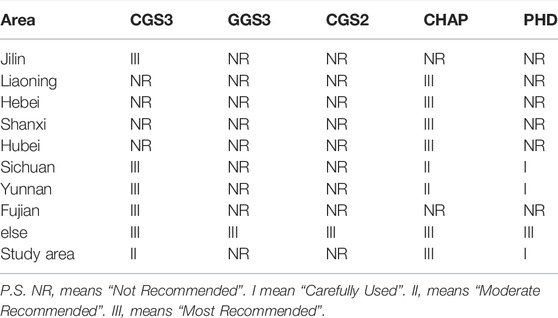
TABLE 2. Selection suggestion of the PM2.5 dataset for premature deaths.
Based on the preferred combination project of the PM2.5 dataset, this study evaluated the spatial distribution of the annual PM2.5 attributable premature deaths from 2000 to 2016 (Figure 11). Over the past 17 years, PM2.5 attributable premature deaths in the mainland of eastern China below the Hu line showed that the eastern coastal areas were higher in concentration than the other areas of China, and provincial capital cities were high-risk centers, with spreading to the surrounding cities. High-risk areas were mainly concentrated in Beijing–Tianjin–Hebei, Yangtze River Delta, Pearl River Delta, and Chengdu–Chongqing urban agglomerations. These areas were densely populated and had high levels of urbanization and industrialization (Ye et al., 2018), which has led to severe health risks of air pollution.
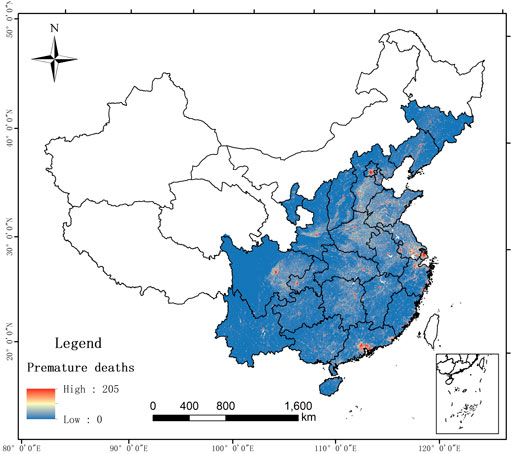
FIGURE 11. Spatial distribution of premature deaths assessed by the preferred combination project of PM2.5 dataset.
Table 3 showed the 17-year average of premature deaths and uncertainty in the study area based on the preferred combination project of the PM2.5 dataset and five sets of initial PM2.5 datasets. In general, compared with the 17-year average premature deaths (1.64 million) assessed by the preferred combination project of the PM2.5 dataset, the assessment result of other arbitrary datasets had a bias, ranging between 1.33 and 1.67 million, with the uncertainty of 19%. For local areas, the uncertainty in premature death assessments was more pronounced. In region A, the degree of overestimation of premature deaths was the largest, with an uncertainty of 38%, while in region C, the degree of underestimation of premature deaths was the largest, with an uncertainty of 29%. There was also more or less uncertainty of premature deaths in regions B, D, and E, ranging from 24 to 29%.
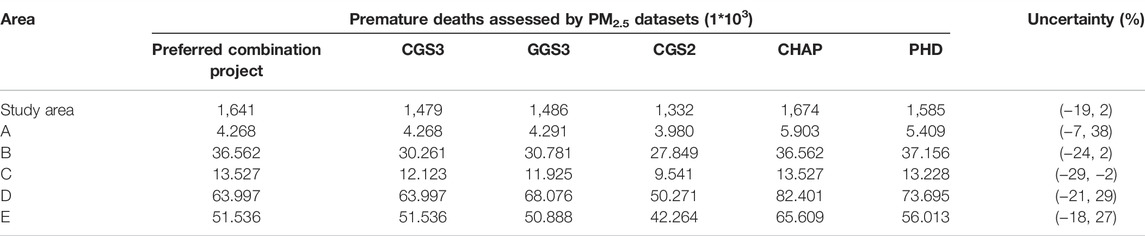
TABLE 3. Uncertainty of the average premature deaths in 17 years in different areas.
Figure 12 showed the uncertainty in annual premature deaths assessed by different PM2.5 datasets. It can be seen that in the whole study area, annual premature death assessments based on five sets of initial PM2.5 datasets were significantly underestimated, with an uncertainty of 31% in 2000. For local areas, the uncertainty in the annual premature deaths based on initial PM2.5 datasets was larger than the uncertainty of 17-year average premature deaths. For region A, the 17-year average uncertainty ranged from -7 to 38%, while the annual uncertainty was as high as 159% in 2001. The uncertainty in annual premature deaths ranged from -42 to 52% and reached the highest in 2004 in region D. The uncertainty interval in regions B, C, and E was (−41% and 40%), reaching the highest in 2000, 2003, and 2004, respectively. Therefore, the selection of PM2.5 datasets should be carried out cautiously when assessing premature deaths in local areas during these periods.
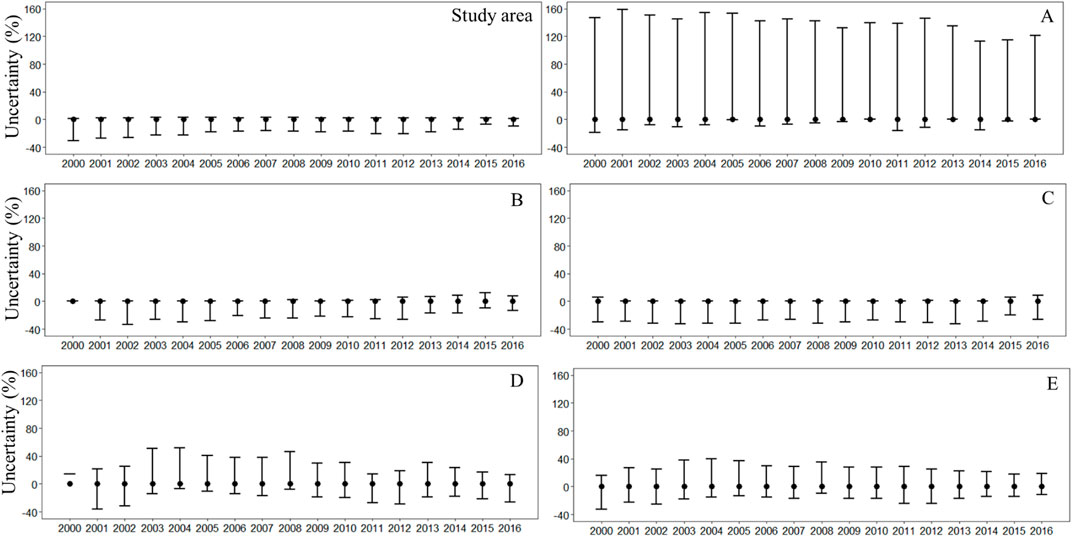
FIGURE 12. Uncertainty of annual premature deaths in different areas. Areas with significant differences both in PM2.5 concentration and premature deaths.
This study estimated spatial–temporal differences in health risk assessments and PM2.5 concentration from 2000 to 2016 in eastern China with five sets of PM2.5 datasets. The preferred combination project of the PM2.5 dataset was proposed to quantitatively analyze spatial–temporal uncertainty in health risk assessments caused by selecting different PM2.5 datasets. To the best of our knowledge, this is the first effort to quantify the effects of concentration data on health risk assessments due to PM2.5 selection in China by using five PM2.5 concentration remote sensing datasets. These results contribute to accurately assessing health risks of air pollution which may be a benefit to formulate policies for preventing and controlling regional-scale health risks by governments.
The results of this study are comparable to those of previous studies. The results show that there were significant differences in premature death assessments using different PM2.5 concentration remote sensing datasets from 2000–2016. PM2.5 attributable premature deaths varied from 0.94 to 1.38 million in 2000 among the five sets of datasets in eastern China and varied from 1.39 to 1.56 million in 2016. A similar finding is observed when comparing those previously reported research studies on premature deaths in China (Rohde and Muller, 2015; Fang et al., 2016). For example, the premature deaths reported were estimated to be 1.38 to 1.47 million in 2014 using the different concentration data in China (Wang C. et al., 2021).
The study shows that differences both in the number and trends of PM2.5 concentration and premature deaths and were significant. The five sets of datasets adopted various algorithms, data sources, and input parameters (Table 1); therefore, there were differences in concentration values and trends. For example, the CGS3 dataset was estimated using advances in satellite observations, chemical transport modeling, and ground-based monitoring (Hammer et al., 2020), while the CHAP dataset was stimulated by the STET model which was improved by using corrected AODs, adding pollutant emissions, updating the feature selection, and improving the determination of spatiotemporal information (Wei et al., 2021). For the difference in premature deaths, because input parameters, methods, and data sources except for PM2.5 concentration data were the same in the process of premature death assessments, the reason causing it was differences in the concentration of five sets of PM2.5 datasets.
The study shows that differences in premature deaths and PM2.5 concentration have decreased rapidly since 2013. The PM2.5 concentration retrieved by satellite remote sensing data takes ground monitoring data as a truth value. To pollution control, the government of China established its PM2.5 ground monitoring networks in late 2012, and data before 2013 have been lacking (Ma et al., 2016; Ma et al., 2019). Therefore, differences in premature deaths and PM2.5 concentration were significant before 2013, which indicated that cities should continue to densify ground measurement networks to enhance accuracy and reduce uncertainty in data.
Spatially, differences in premature deaths and PM2.5 concentration were most obvious in Jilin, Fujian, Liaoning, Hebei, Shanxi, Hubei, Sichuan, and Yunnan. The reason why differences were significant in these areas may lie in the missingness of AOD. The satellite AOD has been used to retrieve air pollution data in five sets of PM2.5 concentration remote sensing datasets. Previous studies indicated that due to cloud/snow cover, high surface reflectance, and extremely high aerosol loading, satellite AOD can be misclassified as a cloud (Van Donkelaar et al., 2011; Tao et al., 2012). The non-random missingness in AOD retrievals may lead to bias in exposure assessment due to potential systematic differences in PM2.5 concentrations when AOD is missing or retrieved (Xiao et al., 2017; He et al., 2019; Liu et al., 2019). Therefore, the selection of PM2.5 concentration data must be carried out cautiously when conducting PM2.5 health risks studies, especially in regions such as Jilin, Liaoning, Hebei, Shanxi, Hubei, Sichuan, Yunnan, and Fujian, with significant differences in premature death assessments.
Many studies have been focused on the impact of resolution in concentration and health risk assessments in recent years (Pugh et al., 2013; Pepe et al., 2016; Korhonen et al., 2019; Liu et al., 2020). Zou et al. found that compared to those research studies at resolutions of approximately 110 km, 45, and 10 km (Lelieveld et al., 2015; Liu et al., 2017; Wang et al., 2018), the accuracy of premature deaths estimated could be theoretically enhanced by combining the air quality data and population data at 1 km resolution (Zou et al., 2019). This study confirmed this theory to some extent, in which the CHAP and CGS3 datasets at 1 km resolution worked well than the GGS3 dataset at 5 km resolution and CGS2 and PHD datasets at 10 km resolution. The high resolution with 1 km could better reflect the spatial–temporal distributions of PM2.5 concentration and health risks. In addition, the CHAP and CGS2 datasets were estimated by two categories of approaches, that is, the statistical approach and scaling approach, which performed well in different areas, so they can be complementary in assessing concentration and health risks.
While this study reduced the uncertainty in health risk assessments by the preferred combination project of the PM2.5 dataset, several limitations remain. First, the baseline mortality rates of different age and sex population are various. The negative health effects of air pollution increase with age as the reduction in physiological processes leads to more age-related diseases (Pope, 2007; Yin et al., 2021). Thus, there was uncertainty in health risk assessments due to the consideration of only baseline mortality rates of adults (aged ≥25 years). To enhance accuracy and reduce uncertainty in health risk assessments because of age and sex structure, future studies should pay attention to assessing premature deaths of different age and sex structure population. Second, health risks of air pollution are not only correlated to air quality and concentration–response relationship considered in the GEMM functions (Xie et al., 2018; Ding et al., 2019; Wang et al., 2020; Li et al., 2021), but it is also a process related to human activity pattern. Spatially different human activity patterns may trigger various exposure scenarios (e.g., respiratory rates) (Zou et al., 2019), and it will theoretically bias the air quality and the GEMM-based premature death assessments. Therefore, the effects of human activity patterns on health risks should be considered in future studies.
The datasets presented in this study can be found in online repositories. The names of the repository/repositories and accession number(s) can be found in the article/Supplementary Material.
All authors participated in the field survey and data collection. JL analyzed the data and drafted the manuscript. SL and YX designed the study. NL and LX revised the manuscript. All authors participated in the field survey and data collection, critically revised the manuscript, and gave final approval to the version submitted for publication.
This research was funded by the National Natural Science Foundation of China (Grant No. 41871317).
The authors declare that the research was conducted in the absence of any commercial or financial relationships that could be construed as a potential conflict of interest.
All claims expressed in this article are solely those of the authors and do not necessarily represent those of their affiliated organizations, or those of the publisher, the editors, and the reviewers. Any product that may be evaluated in this article, or claim that may be made by its manufacturer, is not guaranteed or endorsed by the publisher.
Burnett, R. T., Pope, C. A., Ezzati, M., Olives, C., Lim, S. S., Mehta, S., et al. (2014). An Integrated Risk Function for Estimating the Global Burden of Disease Attributable to Ambient Fine Particulate Matter Exposure. Environ. Health Perspect. 122, 397–403. doi:10.1289/ehp.1307049
Burnett, R., Chen, H., Szyszkowicz, M., Fann, N., Hubbell, B., Pope, C. A., et al. (2018). Global Estimates of Mortality Associated with Long-Term Exposure to Outdoor Fine Particulate Matter. Proc. Natl. Acad. Sci. U.S.A. 115, 9592–9597. doi:10.1073/pnas.1803222115
Cohen, A. J., Brauer, M., and Burnett, R. (2018). Estimates and 25-Year Trends of the Global Burden of Disease Attributable to Ambient air Pollution: An Analysis of Data from the Global Burden of Diseases Study 2015 (vol 389, pg 1907, 2017). Lancet 391, 1576. doi:10.1016/S0140-6736(18)30900-0
Ding, D., Xing, J., Wang, S., Liu, K., and Hao, J. (2019). Estimated Contributions of Emissions Controls, Meteorological Factors, Population Growth, and Changes in Baseline Mortality to Reductions in Ambient [Formula: See Text] and [Formula: See Text]-Related Mortality in China, 2013-2017. Environ. Health Perspect. 127, 067009. doi:10.1289/EHP4157
Fang, D., Wang, Q. G., Li, H., Yu, Y., Lu, Y., and Qian, X. (2016). Mortality Effects Assessment of Ambient PM2.5 Pollution in the 74 Leading Cities of China. Sci. Total Environ. 569-570, 1545–1552. doi:10.1016/j.scitotenv.2016.06.248
Gupta, P., Christopher, S. A., Wang, J., Gehrig, R., Lee, Y., and Kumar, N. (2006). Satellite Remote Sensing of Particulate Matter and Air Quality Assessment over Global Cities. Atmos. Environ. 40, 5880–5892. doi:10.1016/j.atmosenv.2006.03.016
Hammer, M. S., van Donkelaar, A., Li, C., Lyapustin, A., Sayer, A. M., Hsu, N. C., et al. (2020). Global Estimates and Long-Term Trends of Fine Particulate Matter Concentrations (1998-2018). Environ. Sci. Technol. 54, 7879–7890. doi:10.1021/acs.est.0c01764
He, Q., Gu, Y., and Zhang, M. (2019). Spatiotemporal Patterns of Aerosol Optical Depth throughout China from 2003 to 2016. Sci. Total Environ. 653, 23–35. doi:10.1016/j.scitotenv.2018.10.307
He, Q., Gao, K., Zhang, L., Song, Y., and Zhang, M. (2021). Satellite-Derived 1-km Estimates and Long-Term Trends of PM2.5 Concentrations in China from 2000 to 2018. Environ. Int. 156, 106726. doi:10.1016/j.envint.2021.106726
Hoogh, K. D., Héritier, H., Stafoggia, M., Künzli, N., and Kloog, I. (2018). Modelling Daily PM2.5 Concentrations at High Spatio-Temporal Resolution across Switzerland. Environ. Pollut. 233, 1147–1154. doi:10.1016/j.envpol.2017.10.025
Hu, X., Waller, L. A., Lyapustin, A., Wang, Y., Al-Hamdan, M. Z., Crosson, W. L., et al. (2014). Estimating Ground-Level PM2.5 Concentrations in the Southeastern United States Using MAIAC AOD Retrievals and a Two-Stage Model. Remote Sens. Environ. 140, 220–232. doi:10.1016/j.rse.2013.08.032
Korhonen, A., Lehtomäki, H., Rumrich, I., Karvosenoja, N., Paunu, V.-V., Kupiainen, K., et al. (2019). Influence of Spatial Resolution on Population PM2.5 Exposure and Health Impacts. Air Qual. Atmos. Health 12, 705–718. doi:10.1007/s11869-019-00690-z
Laden, F., Schwartz, J., Speizer, F. E., and Dockery, D. W. (2006). Reduction in Fine Particulate Air Pollution and Mortality. Am. J. Respir. Crit. Care Med. 173, 667–672. doi:10.1164/rccm.200503-443OC
Lelieveld, J., Evans, J. S., Fnais, M., Giannadaki, D., and Pozzer, A. (2015). The Contribution of Outdoor Air Pollution Sources to Premature Mortality on a Global Scale. Nature 525, 367–371. doi:10.1038/nature15371
Li, S., Zou, B., Fang, X., and Lin, Y. (2020). Time Series Modeling of PM2.5 Concentrations with Residual Variance Constraint in Eastern Mainland China during 2013-2017. Sci. Total Environ. 710, 135755. doi:10.1016/j.scitotenv.2019.135755
Li, Y., Liao, Q., Zhao, X., Tao, Y., Bai, Y., and Peng, L. (2021). Premature Mortality Attributable to PM2.5 Pollution in China during 2008-2016: Underlying Causes and Responses to Emission Reductions. Chemosphere 263, 127925. doi:10.1016/j.chemosphere.2020.127925
Liang, F., Xiao, Q., Huang, K., Yang, X., Liu, F., Li, J., et al. (2020). The 17-y Spatiotemporal Trend of PM 2.5 and its Mortality Burden in China. Proc. Natl. Acad. Sci. U.S.A. 117, 25601–25608. doi:10.1073/pnas.1919641117
Liu, M., Huang, Y., Ma, Z., Jin, Z., Liu, X., Wang, H., et al. (2017). Spatial and Temporal Trends in the Mortality Burden of Air Pollution in China: 2004-2012. Environ. Int. 98, 75–81. doi:10.1016/j.envint.2016.10.003
Liu, N., Zou, B., Feng, H., Wang, W., Tang, Y., and Liang, Y. (2019). Evaluation and Comparison of Multiangle Implementation of the Atmospheric Correction Algorithm, Dark Target, and Deep Blue Aerosol Products Over China. Atmos. Chem. Phys. 19, 8243–8268. doi:10.5194/acp-19-8243-2019
Liu, T., Wang, C., Wang, Y., Huang, L., Li, J., Xie, F., et al. (2020). Impacts of Model Resolution on Predictions of Air Quality and Associated Health Exposure in Nanjing, China. Chemosphere 249, 126515. doi:10.1016/j.chemosphere.2020.126515
Ma, Z., Hu, X., Sayer, A. M., Levy, R., Zhang, Q., Xue, Y., et al. (2016). Satellite-Based Spatiotemporal Trends in PM 2.5 Concentrations: China, 2004-2013. Environ. Health Perspect. 124, 184–192. doi:10.1289/ehp.1409481
Ma, Z., Liu, R., Liu, Y., and Bi, J. (2019). Effects of air Pollution Control Policies on PM2.5 Pollution Improvement in China from 2005 to 2017: A Satellite-Based Perspective. Atmos. Chem. Phys. 19, 6861–6877. doi:10.5194/acp-19-6861-2019
Ma, Z., Dey, S., Christopher, S., Liu, R., Bi, J., Balyan, P., et al. (2022). A Review of Statistical Methods Used for Developing Large-Scale and Long-Term PM2.5 Models from Satellite Data. Remote Sens. Environ. 269, 112827. doi:10.1016/j.rse.2021.112827
Maji, K. J., Li, V. O., and Lam, J. C. (2020). Effects of China's Current Air Pollution Prevention and Control Action Plan on Air Pollution Patterns, Health Risks and Mortalities in Beijing 2014-2018. Chemosphere 260, 127572. doi:10.1016/j.chemosphere.2020.127572
Pepe, N., Pirovano, G., Lonati, G., Balzarini, A., Toppetti, A., Riva, G. M., et al. (2016). Development and Application of a High Resolution Hybrid Modelling System for the Evaluation of Urban Air Quality. Atmos. Environ. 141, 297–311. doi:10.1016/j.atmosenv.2016.06.071
Pope, C. A. (2007). Mortality Effects of Longer Term Exposures to Fine Particulate Air Pollution: Review of Recent Epidemiological Evidence. Inhal. Toxicol. 19, 33–38. doi:10.1080/08958370701492961
Pugh, T. A. M., Ashworth, K., Wild, O., and Hewitt, C. N. (2013). Effects of the Spatial Resolution of Climate Data on Estimates of Biogenic Isoprene Emissions. Atmos. Environ. 70, 1–6. doi:10.1016/j.atmosenv.2013.01.001
Rohde, R. A., and Muller, R. A. (2015). Air Pollution in China: Mapping of Concentrations and Sources. PLoS One 10, e0135749. doi:10.1371/journal.pone.0135749
Shen, L., Wang, H., Kong, X., Zhang, C., Shi, S., and Zhu, B. (2021a). Characterization of Black Carbon Aerosol in the Yangtze River Delta, China: Seasonal Variation and Source Apportionment. Atmos. Pollut. Res. 12, 195–209. doi:10.1016/j.apr.2020.08.035
Shen, M., Gu, X., Li, S., Yu, Y., Zou, B., and Chen, X. (2021b). Exposure to Black Carbon is Associated with Symptoms of Depression: A Retrospective Cohort Study in College Students. Environ. Int. 157, 106870. doi:10.1016/j.envint.2021.106870
Stafoggia, M., Bellander, T., Bucci, S., Davoli, M., de Hoogh, K., de' Donato, F., et al. (2019). Estimation of Daily PM10 and PM2.5 Concentrations in Italy, 2013-2015, Using a Spatiotemporal Land-Use Random-Forest Model. Environ. Int. 124, 170–179. doi:10.1016/j.envint.2019.01.016
Tao, M., Chen, L., Su, L., and Tao, J. (2012). Satellite Observation of Regional Haze Pollution Over the North China Plain. J. Geophys. Res. 117, D12203. doi:10.1029/2012JD017915
Van Donkelaar, A., Martin, R. V., Brauer, M., Kahn, R., Levy, R., Verduzco, C., et al. (2010). Global Estimates of Ambient Fine Particulate Matter Concentrations from Satellite-Based Aerosol Optical Depth: Development and Application. Environ. Health Perspect. 118, 847–855. doi:10.1289/ehp.0901623
Van Donkelaar, A., Martin, R. V., Levy, R. C., da Silva, A. M., Krzyzanowski, M., Chubarova, N. E., et al. (2011). Satellite-Based Estimates of Ground-Level Fine Particulate Matter during Extreme Events: A Case Study of the Moscow Fires in 2010. Atmos. Environ. 45, 6225–6232. doi:10.1016/j.atmosenv.2011.07.068
Van Donkelaar, A., Martin, R. V., Brauer, M., and Boys, B. L. (2015). Use of Satellite Observations for Long-Term Exposure Assessment of Global Concentrations of Fine Particulate Matter. Environ. Health Perspect. 123, 135–143. doi:10.1289/ehp.1408646
Van Donkelaar, A., Martin, R. V., Brauer, M., Hsu, N. C., Kahn, R. A., Levy, R. C., et al. (2016). Global Estimates of Fine Particulate Matter Using a Combined Geophysical-Statistical Method with Information from Satellites, Models, and Monitors. Environ. Sci. Technol. 50, 3762–3772. doi:10.1021/acs.est.5b05833
Van Donkelaar, A., Martin, R. V., Li, C., and Burnett, R. T. (2019). Regional Estimates of Chemical Composition of Fine Particulate Matter Using a Combined Geoscience-Statistical Method with Information from Satellites, Models, and Monitors. Environ. Sci. Technol. 53, 2595–2611. doi:10.1021/acs.est.8b06392
Wang, Q., Wang, J., He, M. Z., Kinney, P. L., and Li, T. (2018). A County-Level Estimate of PM 2.5 Related Chronic Mortality Risk in China Based on Multi-Model Exposure Data. Environ. Int. 110, 105–112. doi:10.1016/j.envint.2017.10.015
Wang, F., Liu, C., and Xu, Y. (2019). Analyzing Population Density Disparity in China with GIS-Automated Regionalization: The Hu Line Revisited. Chin. Geogr. Sci. 29, 541–552. doi:10.1007/s11769-019-1054-y
Wang, Y., Wild, O., Chen, X., Wu, Q., Gao, M., Chen, H., et al. (2020). Health Impacts of Long-Term Ozone Exposure in China over 2013-2017. Environ. Int. 144, 106030. doi:10.1016/j.envint.2020.106030
Wang, C., Wang, Y., Shi, Z., Sun, J., Gong, K., Li, J., et al. (2021a). Effects of Using Different Exposure Data to Estimate Changes in Premature Mortality Attributable to PM2.5 and O3 in China. Environ. Pollut. 285, 117242. doi:10.1016/j.envpol.2021.117242
Wang, H., Miao, Q., Shen, L., Yang, Q., Wu, Y., and Wei, H. (2021b). Air Pollutant Variations in Suzhou during the 2019 Novel Coronavirus (COVID-19) Lockdown of 2020: High Time-Resolution Measurements of Aerosol Chemical Compositions and Source Apportionment. Environ. Pollut. 271, 116298. doi:10.1016/j.envpol.2020.116298
Wang, L., Chen, G., Pan, Y., Xia, J., Chen, L., Zhang, X., et al. (2021c). Association of Long-Term Exposure to Ambient Air Pollutants with Blood Lipids in Chinese Adults: The China Multi-Ethnic Cohort Study. Environ. Res. 197, 111174. doi:10.1016/j.envres.2021.111174
Wei, J., Li, Z., Cribb, M., Huang, W., Xue, W., Sun, L., et al. (2020). Improved 1 km Resolution PM2.5 Estimates Across China using Enhanced Space-Time Extremely Randomized Trees. Atmos. Chem. Phys. 20, 3273–3289. doi:10.5194/acp-20-3273-2020
Wei, J., Li, Z., Lyapustin, A., Sun, L., Peng, Y., Xue, W., et al. (2021). Reconstructing 1-Km-Resolution High-Quality PM2.5 Data Records from 2000 to 2018 in China: Spatiotemporal Variations and Policy Implications. Remote Sens. Environ. 252, 112136. doi:10.1016/j.rse.2020.112136
Xiao, Q., Wang, Y., Chang, H. H., Meng, X., Geng, G., Lyapustin, A., et al. (2017). Full-Coverage High-Resolution Daily PM2.5 Estimation Using MAIAC AOD in the Yangtze River Delta of China. Remote Sens. Environ. 199, 437–446. doi:10.1016/j.rse.2017.07.023
Xie, Z., Qin, Y., Zhang, L., and Zhang, R. (2018). Death Effects Assessment of PM2.5 Pollution in China. Pol. J. Environ. Stud. 27, 1813–1821. doi:10.15244/pjoes/77077
Xue, T., Zheng, Y., Tong, D., Zheng, B., Li, X., Zhu, T., et al. (2019). Spatiotemporal Continuous Estimates of PM2.5 Concentrations in China, 2000-2016: A Machine Learning Method with Inputs from Satellites, Chemical Transport Model, and Ground Observations. Environ. Int. 123, 345–357. doi:10.1016/j.envint.2018.11.075
Ye, W.-F., Ma, Z.-Y., and Ha, X.-Z. (2018). Spatial-Temporal Patterns of PM2.5 Concentrations for 338 Chinese Cities. Sci. Total Environ. 631-632, 524–533. doi:10.1016/j.scitotenv.2018.03.057
Yin, H., Brauer, M., Zhang, J. F., Cai, W. J., Navrud, S., Burnett, R., et al. (2021). Population Ageing and Deaths Attributable to Ambient PM2.5 Polluyion: A Global of Economic Cost. Lancet 5, E356–E367. doi:10.1016/S2542-5196(21)00131-5
Keywords: PM2.5, premature deaths, spatial–temporal analysis, uncertainty, remote sensing
Citation: Liu J, Li S, Xiong Y, Liu N, Zou B and Xiong L (2022) Uncertainty Analysis of Premature Death Estimation Under Various Open PM2.5 Datasets. Front. Environ. Sci. 10:934281. doi: 10.3389/fenvs.2022.934281
Received: 02 May 2022; Accepted: 18 May 2022;
Published: 06 July 2022.
Edited by:
Honglei Wang, Nanjing University of Information Science and Technology, ChinaReviewed by:
Jing Wei, University of Maryland, United StatesCopyright © 2022 Liu, Li, Xiong, Liu, Zou and Xiong. This is an open-access article distributed under the terms of the Creative Commons Attribution License (CC BY). The use, distribution or reproduction in other forums is permitted, provided the original author(s) and the copyright owner(s) are credited and that the original publication in this journal is cited, in accordance with accepted academic practice. No use, distribution or reproduction is permitted which does not comply with these terms.
*Correspondence: Shenxin Li, c2hlbnhpbjgyM0Bjc3UuZWR1LmNu
Disclaimer: All claims expressed in this article are solely those of the authors and do not necessarily represent those of their affiliated organizations, or those of the publisher, the editors and the reviewers. Any product that may be evaluated in this article or claim that may be made by its manufacturer is not guaranteed or endorsed by the publisher.
Research integrity at Frontiers
Learn more about the work of our research integrity team to safeguard the quality of each article we publish.