 Yuhang Zhao
 Shiqiang Wu
 Jiangyu Dai
 Xiufeng Wu1*
 Yu Zhang
 Chenhui Wu
95% of researchers rate our articles as excellent or good
Learn more about the work of our research integrity team to safeguard the quality of each article we publish.
Find out more
ORIGINAL RESEARCH article
Front. Environ. Sci. , 01 July 2022
Sec. Freshwater Science
Volume 10 - 2022 | https://doi.org/10.3389/fenvs.2022.931642
This article is part of the Research Topic Interconnected River-Lake Systems and Regional Water Security View all 7 articles
Knowledge of the extent of water pollution along a diversion channel is essential for ensuring the security and effectiveness of water diversion projects. Thus, identifying the trends in the water quality and the factors which influence the trends along a diverted river is a prerequisite to ensuring the safety of the water diversion. As an important control unit of the Eastern Route of the South to North Water Diversion Project, the hilly eastern region of Nansi Lake Basin (ENLB) suffers excess water pollution in the water transferred into Nansi Lake during the flood season. The comprehensive pollution index (CPI), the Mann-Kendall trend test and analysis of variances were used to characterize the spatiotemporal variation of water quality in the three main mountainous rivers of the ENLB. The contribution of different factors which influencing the variation of the water quality parameters may be explained using ridge regression analysis. The results showed that the CPI for the three major rivers decreased significantly from 2000 to 2012. The rivers had problems in compliance, and this was most noticeable in the Guangfu River. The main pollutants exceeding the water quality standards were the chemical oxygen demand and total phosphorus. The GDP per capita was the largest factor which influenced the changes in the regional water quality, with the average contribution being 30%. An increase in the water storage capacity was shown to have a positive effect on improving the water quality. The results provided a scientific basis for establishing a regional pollution control strategy and would give support to the planning of future water diversion projects.
Due to the uneven spatial and temporal distribution of freshwater resources (Zhang et al., 2015), inter-basin water diversion projects (IBDPs) are proving to be an increasingly popular solution to the water distribution problem (Rollason et al., 2021). The long distance and wide coverage of IBDPs, however, make the water quality susceptible to the influence of various factors, such as climate change and human activity (Qu et al., 2020). Water diversion projects frequently rely on transforming available rivers and lakes into water channels (Tang et al., 2014), which pose the risk of point and non-point source pollution developing at confluence points thus affecting the quality of the water bodies in question (Zhang et al., 2018). Therefore, the significance of pollutant control along the water courses becomes particularly relevant.
The Eastern Route of the South to North Water Diversion Project (ER-SNWDP) is one of the world’s largest IBDPs and is an essential part of China’s water network artery (Zhuang, 2016). The first phase of the ER-SNWDP was officially put into operation in 2013, and the second phase of the project is already under planning and has been demonstrated (China Ministry of Water Resources, http://nsbd.mwr.gov.cn/). The ER-SNWDP is vulnerable to point source pollution from urban sewage and industrial wastewater, non-point source pollution from agriculture and soil erosion, and endogenous source pollution (Liu et al., 2005). As an important water transmission channel and storage lake of the ER-SNWDP, the status of the water quality of Nansi Lake has been of great concern (Wang et al., 2006; Zhang, 2009). After more than a decade of pollution control of the watershed and ecological protection, the water quality of the lake basically attained the surface water Class III standard before the project commenced operation in 2013 (Guo and Ren, 2014; Zhang et al., 2022). The water quality of the lake is affected mainly by both exogenous and endogenous pollution, and the inflow rivers are one of main sources of pollution (Juan et al., 2016; Zhang et al., 2020). As the primary supplemental water source of Nansi Lake, the inflow rivers are still unable to meet the necessary standards in a stable and controlled manner, and individual sections that flow into the lake can exceed the standards to varying degrees (Zhang and Yang, 2011; Wang et al., 2014), especially the eastern region of the Nansi Lake Basin (ENLB) (Feng et al., 2018). This is an urgent problem that will be addressed in the second phase of the ER-SNWDP, moreover there is also a need to expand the scale of water diversion, increase the time of water transmission and be stricter with respect to attaining the water quality requirements in the flood season.
An awareness of the characteristics of the changes in the water quality and the factors which influence the changes is the premise of scientific pollution control (Yaseen et al., 2018). Current research on Nansi Lake and the inflow rivers has focused mainly on the trends in water quality and evaluation (Gao et al., 2013; Xu et al., 2019; Yao et al., 2021), the water quality response relationships of river-lake (Feng et al., 2022), the sediment distribution (Zhuang et al., 2019; Guo et al., 2021), the evolution of plankton (Tian et al., 2013; Meng et al., 2017), and the nexus between water pollution and the economy (Wang et al., 2015; Liu et al., 2020). The factors which govern the changes in water quality are complex, with multiple factors intertwining and interacting. Critical factors that shape river water quality are diverse and vary greatly across geographical regions; these factors may be categorized as natural and human factors (Huang et al., 2021). The former typically include hydrological regimes (Xia et al., 2012) and are driven mainly by precipitation (Biswas and Mosley, 2018; Nijhawan and Howard, 2022) and landscape features of the waterway (Avigliano and Schenone, 2016; Babayan et al., 2021). The latter have been summarized in terms of socio-economic development (Salerno et al., 2018; Huang et al., 2021), land use type changes (Ding et al., 2016; Mainali and Chang, 2018), construction of projects such as wastewater treatment plants (WWTPs) (Luo et al., 2011; Tong et al., 2020), constructed wetlands (El-Sheikh et al., 2010) and hydraulic control engineering (Zhang et al., 2011; Yuan et al., 2015).
The ENLB is an area with distinct hydrological characteristics and the watershed is heavily influenced by human activities. Typically, the rivers are subject to flash floods in the rainy season and tend to carry large pollution loads, and on entering the lakes are extremely difficult to control, thus posing a great threat to the quality of lakes downstream (Xie et al., 2016). According to the “Water Pollution Prevention Planning of the South-to-North Water Diversion Project (east route) of Shandong Section”, a large number of pollution control projects were instigated to improve water quality and ensure safety during the diversion period, such as constructed wetlands, pollution prevention and water diversion projects (PPWDPs), and reconstruction of plain reservoirs in the collapsed areas. In contrast to the above, there have only been a few studies on the relationships between many different types of engineering capacity and changes in water quality in the region, these generally focusing on the effects of flood gates and dams on water quality. As a consequence, it was proposed that extending the engineering capacity of the hilly areas would contribute to an improvement in water quality.
Multi-year changes and trends in the spatiotemporal characteristics of riverine water quality in the ENLB were analyzed using the Mann-Kendall test, and various mathematical and statistical methods. Using ridge regression analysis, six factors were selected from consideration of the hydrological elements, the engineering capacity and aspects of the social economy to explore the magnitude of contributions to variations in the water quality. In this way, the study aims to provide a scientific basis for the control of pollutants along the inter-basin of a water diversion project.
The ENLB is located in Jining City, Shandong Province (35°8′N-35°49′, 116°32′E-117°36′), has an area of 4143.35 km2, and accounts for about 37% of the total area of Jining City shown in Figure 1. The eastern part of the lake is higher in the northeast section and lower in the southwest section, with an average drop in the slope of 1% ∼ 0.3%. The eastern part of the ENLB is mountainous and hilly with elevation above 50–100 m, the central part is characterized as a pre-hill plain with a ground elevation of 35–60 m, and the western part consists of a lakeside depression. There are three major rivers in the region that feed into the upper Nansi Lake, namely, the Guangfu River (GR), the Si River (SR) and the Baima River (BR), further, six hydrological monitoring stations were selected, and the stations together with specific river parameters are shown in the Supplementary Table S1 and S2. The average annual rainfall is 701.5 mm, of which the rainfall during the flood season (June to September) accounts for 75% of the total rain for the whole year. Due to the features of the terrain, the rivers are typical flash flood water channels, with short sources and high peaks, and 70–80% of the annual runoff occurs in the flood season.
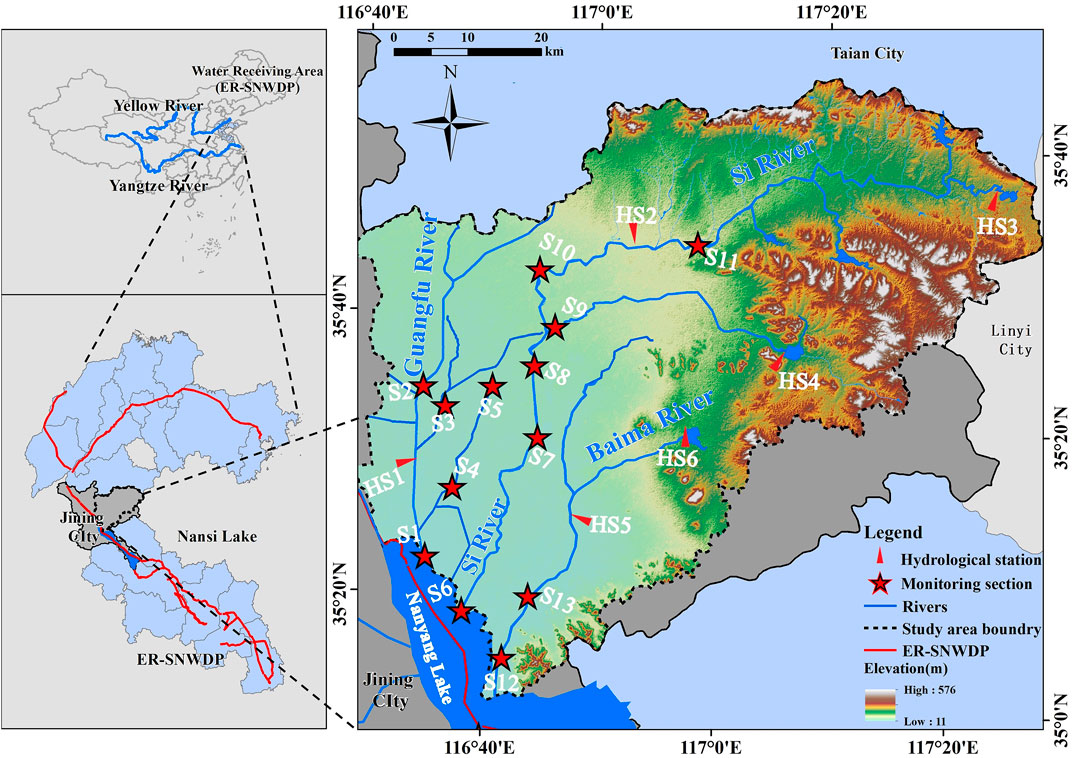
FIGURE 1. Overview of the study area.
With focus being given to flood safety protection at a regional level and optimal allocation of water resources, a large number of water conservancy projects have been established in the ENLB. The ENLB, is one of the regions in China with the largest number of projects per unit area, including 6 large and medium-sized reservoirs and 240 small reservoirs with a total capacity of 0.6 billion m3. The ENLB covers eight administrative counties and urban areas, including Sishui County, Qufu City, Yanzhou District, High-tech Zone, Taibai Lake New District, and parts of Zoucheng City, Rencheng District and Weishan County. The region is fertile, industrially developed and rich in mineral resources; especially there are large coal resources with storage distribution, the area being one of the key national development centers for energy exploitation. The total population of the ENLB exceeds 4 million at the end of 2019, with the total GDP accounting for about 50% of that for Jining city.
The data types, contents, time series, and sources used in the study are listed in Table 1. The statistical information of data is listed in Supplementary Table S3 and S4.
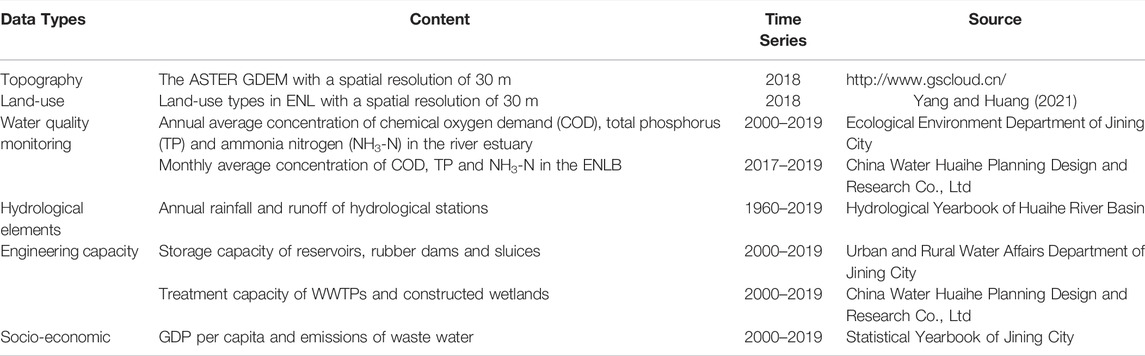
TABLE 1. Information on the data used.
The comprehensive pollution index (CPI) and the single pollution index (PI) are the most common and widely used water quality evaluation indices, and reflect the extent of water pollution on a qualitative basis (Kumar et al., 2021). The CPI is a comprehensive amalgamation of the PIs of different pollution indicators. There are many methods available for calculating the CPI. In this study, the more classical arithmetic average method has been adopted. According to the Chinese “Environmental Quality Standard for Surface Water” (GB3838-2002) and the water quality target requirements for water bodies, Class III is the standard in the area. The CPI has been evaluated to obtain different single PIs for classifying the overall water quality status of the GR, SR and BR at the temporal scale.
The index is expressed mathematically by Eqs 1, 2 as follows:
where, PIi signifies the single PI of the ith parameter, Si signifies the Class III standard of the ith parameter (COD: 20.0 mg/L, TP: 0.2 mg/L, NH3-N: 1.0 mg/L), Ci signifies the observed concentration value of the ith parameter, and n represents the total number of parameters. When the PI or the CPI is less than or equal to 1, it means that the index meets the water quality target requirements; conversely if the indices are greater than 1, then it means that the CPI or the PI exceeds the requirements of water function zone.
Before trend analysis, the homogeneity of the data should be checked (Demir and Keskin, 2020). The standard normal homogeneity test (SNHT) developed by (Alexandersson, 1986) is used to study inhomogeneities in the form of abrupt shifts in the mean value of the observations.
The T0 test statistic is expressed mathematically by Equation (3), (4) and (5) as follows:
where the value of v corresponding to T is the most probable time point of change, n is the number of data, y is years, σ is the sample standard deviation of this series, z is the standardized work series of length n,
Trend analysis was performed to detect whether the values for the data were increasing, decreasing or invariant over time (Kisi and Ay, 2014). The Mann–Kendall (M-K) test (Mann, 1945; Kendall, 1975)is a non-parametric test based on rank correlation. The method does not require the sample to obey a specific statistical distribution and has good fault tolerance for individual observed outliers; the method is frequently used to test the trend of water quality and hydrometeorological variables over a time series (Luo et al., 2019).
The M-K test statistic (S) is calculated in the following Eqs 6, 7
where sgn () is the judgment function, and the expression is
where xj and xk are the data values at times j and k, n indicates the length of the data set. While a positive value of S indicates an increasing trend, negative of S indicates a decreasing trend. According to the data length (n > 10), as an assumption, S is approximately the standard normal distribution. Its mean and variance can be defined as
In this equation, m is the number of tied groups, and tp is the number of data values in the mth group. If there are not the tied groups, this summary process can be ignored. After the calculation of the variance of time series data with Eq. 9, the standard Z value is calculated according to the following Eq. 10.
The calculated standard Z value shows the statistical trend. If Z < 0, it indicates a decreasing trend and if Z > 0, it indicates an increasing trend. Meanwhile, it is compared with the standard normal distribution table with two-tailed confidence levels (α = 10%, α = 5% and α = 1%). The corresponding |Z1-α/2| values are 1.64, 1.96 and 2.58, respectively. If the calculated Z is greater than |Z|>|Z1-α/2|, the null hypothesis (H0) is invalid and the trend is statistically significant. Otherwise, the H0 hypothesis is accepted that the trend is not statistically significant. In this study, two-tailed confidence levels (α = 5% and α = 1%) were used for the M-K trend test.
Although the M-K test is used widely, it still has a basic requirement that the data should be independent, which means the M-K test is not robust against serial correlation (Wasserstein et al., 2019). The existence of positive serial correlation increases the probability that the M-K test detects a trend when no trend exists (Cox and Stuart, 1955). The modified Mann-Kendall (MM-K) test is a modified nonparametric trend method suitable for autocorrelated data based on the modified value in the variance of the test statistic (Yagbasan et al., 2020). Adjusted variance value is calculated as given in Eqs 11, 12 (Hamed and Ramachandra Rao, 1998; Yue et al., 2002).
where n/nS∗ represents a correction due to the autocorrelation in the data, n is the actual number of observations and ρS(i) is the autocorrelation function of the ranks of the observations.
Multiple regression analysis is used mainly to study the interdependence between an explained variable and several explanatory variables. The degree of influence of different explanatory variables is obtained by using statistical analysis methods as well as functions to analyze and interpret the pattern of changes in this relationship, and to describe it formally (Edwards, 1985). However, the problem of collinearity of the independent variables often arises, making the accuracy of the estimation significantly lower than would otherwise be.
Ridge regression is a popular estimation method used to address the collinearity problem frequently arising in multiple linear regression (McDonald, 2009). The regression technique is actually a modified least squares method that obtains more realistic and reliable regression coefficients at the cost of losing some information and reducing accuracy by giving up the unbiased nature of the least square method. The ridge regression method can be usefully applied to the analysis of the factors which influence the water quality parameters.
The homogeneity of trends was tested by SNHT and the results were shown in the Supplementary Table S5. The H0 hypothesis was rejected because T0 for all water quality monitoring stations was lower than the critical T0 value as the data had an inhomogeneous change point. The changes in the single PIs and CPI of the GR, SR and BR estuaries are shown in Figure 2, and the changes were assessed using the M–K test and the MM-K test as outlined in Table 2. The data for the TP index started from 2009, so the CPI from 2000 to 2008 did not include the TP in the calculation. The CPI for all three rivers showed a significant decreasing trend (α < 0.01), and the water quality improvement effect was remarkable from 2000 to 2019. Since the official commissioning of the first phase of the ER-SNWDP in 2013, the CPI for all three rivers was less than 1, meaning that the water quality target requirements were met for the water supply. The pollution of the GR was the most serious at the beginning of water treatment, with the CPI reaching 14.15 in 2000, and accounting for 75% of the three rivers. Overall, there was a great downward trend for all three pollution indicators, from 14.15 to 0.75. However, there were still fluctuations during the period in question, and with slight increases in 2005, 2006 and 2009, due to variations of TP and NH3-N. The SR and BR were relatively less polluted, decreasing from 2.46 to 0.59 and 2.18 to 0.7, respectively. The COD index for the SR has caused some concern in recent years, the Z value being greater than 0 and exhibiting an increasing trend but not outstanding. The BR was slightly different to previous in that the CPI increased and then decreased from 2000 to 2012, reaching a peak of 2.18 in 2007, thereafter from 2013, the CPI decreased significantly as reflected in the TP values (α < 0.05). It can be seen clearly that the pollution control measures implemented after 2013 had a strong impact on the improvement in water quality in the BR.
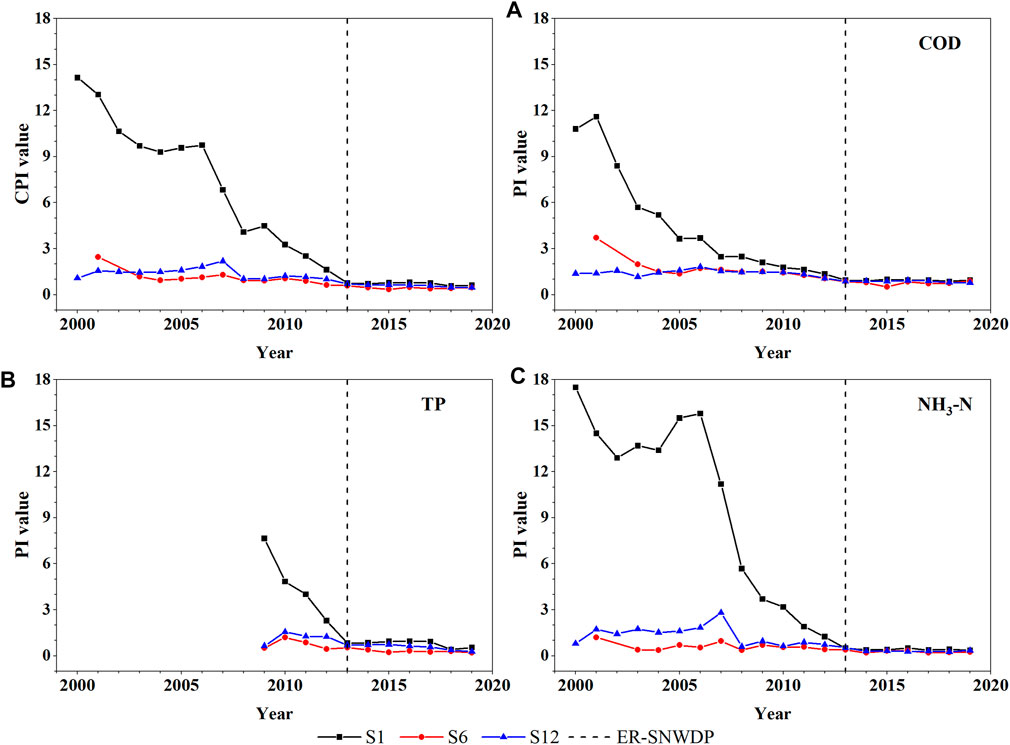
FIGURE 2. Trends for the CPI and single PIs in the river estuaries (S1: GR, S6: SR, S12: BR, (A) COD, (B)TP, (C) NH3-N).
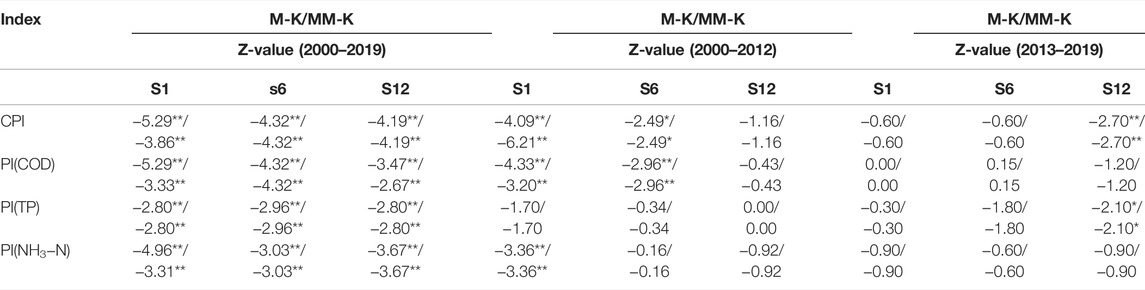
TABLE 2. Mann-Kendall test for the CPI and single PIs in the river estuaries (* and** indicate significant correlation at the α = 0.05 and 0.01 levels, respectively).
To analyze accurately the changes and differences in current water quality for the study area, the water quality parameters may be described on a statistical basis using the monthly data from January 2017 to March 2019 (see Table 3). In addition, the differences in the average concentrations of the water quality parameters at 13 monitoring sites during the flood season (June-September) and non-flood season (October-May) were analyzed by using one-way ANOVA (see Figure 3). S2 was not analyzed because only measured values were available after September 2018 due to upstream disconnection and the fact that less data were available.
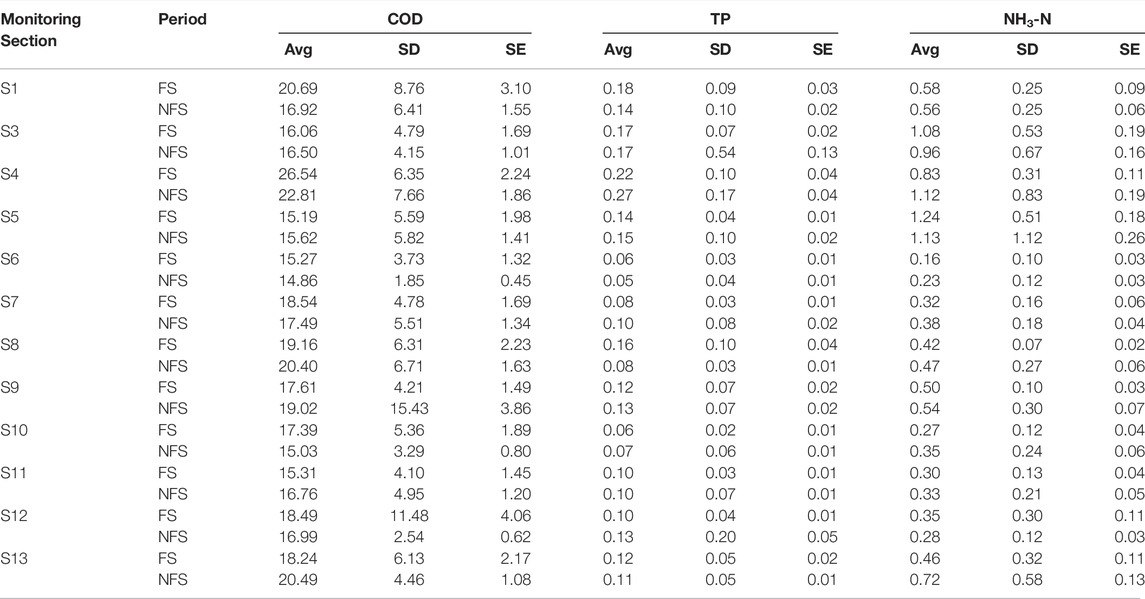
TABLE 3. Variations in the water quality parameters for the study area from 2017 to 2019 (Avg: Average; SD: Standard deviation, SE: Standard error, FS: Flood season, NFS: Non-flood season).
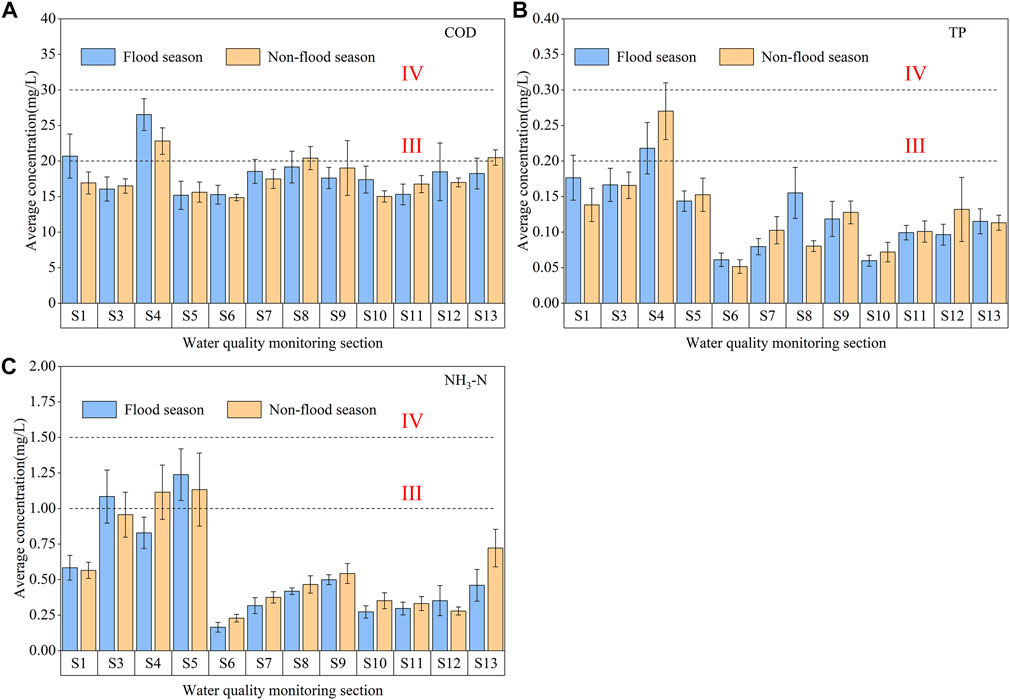
FIGURE 3. Average concentrations and statistically significant differences of water quality parameters at monitoring sections in the different seasons from 2017 to 2019 (One-way ANOVA, p ≤ 0.01; GR Basin: S1-S5; SR Basin: S6-S11; BR Basin: S12-S13, (A) COD, (B) TP, (C) NH3-N).
The overall differences between the mean concentrations of the parameters for the flood and non-flood periods were small, prominent differences at individual locations being located mainly in the GR basin. The COD and the TP values for the different periods of the year was not a rule whereas the NH3-N concentrations for the non-flood periods were greater than those for the flood period at a total of 8 points, accounting for 2/3 of all. The concentrations of NH3-N at all of the monitoring points of the SR showed a clear pattern of higher concentrations in the non-flood period compared with the flood period, indicating that concentrated rainfall in the abundant water period played a dilution role to some extent. As the water quality of the whole river had the most direct impact on the lake, the conditions of water quality at the river estuary deserved particular attention. The COD concentrations exceeded the water quality standard to differing extents at points S1, S6, and S12, and the concentrations in the flood season were greater than those in the non-flood season, that is 22, 4, and 9% higher, respectively, a finding which is consistent with an independent study (Zhang et al., 2022). The maximum concentrations of COD were 32.59 mg/L, 20.65 mg/L and 46.07 mg/L, respectively, for waters collected in June-September 2017.
There was a marked pattern of spatial variability in the water quality conditions in the ENLB (see Figure 4). In general, the problem of non-compliance in meeting the water quality standards in the GR was more apparent; in the main, this watershed accepted industrial and urban sewage, and where there was longstanding structural pollution problems. The degree of urbanization and development was comparatively high, and the proportion of developed land reached 30.3%. Pollution was most concentrated in the upper tributaries of the GR, such as S3, S4 and S5. S4 was located in the Jining high-tech zone, and the site was affected mainly by urban sewage treatment plants, untreated domestic sewage from urban areas and domestic sewage from the surrounding villages and towns. The SR basin was characterized as having better water quality conditions in the upper reaches (S11) and at the entrance to the lake (S6) compared with the middle and lower reaches (S7-S9). The differences in elevation between the upper and lower reaches of the SR basin were large, the upper reaches being recharged by groundwater from springs, which had good water quality. The region was primarily cropland with large areas of forestland and grassland, and the river was affected by non-point pollution sources to a certain extent. The middle and lower reaches of the river flowed through the urban areas of Yanzhou District and Qufu City and took on a large amount of domestic sewage and industrial wastewater, which represented most pollution sources in the river. The maximum COD value for S13 in the BR was 30.15 mg/L which was observed in the non-rainy period; this COD value well exceeded the water quality standard and was caused by sewage discharge from Zoucheng City.
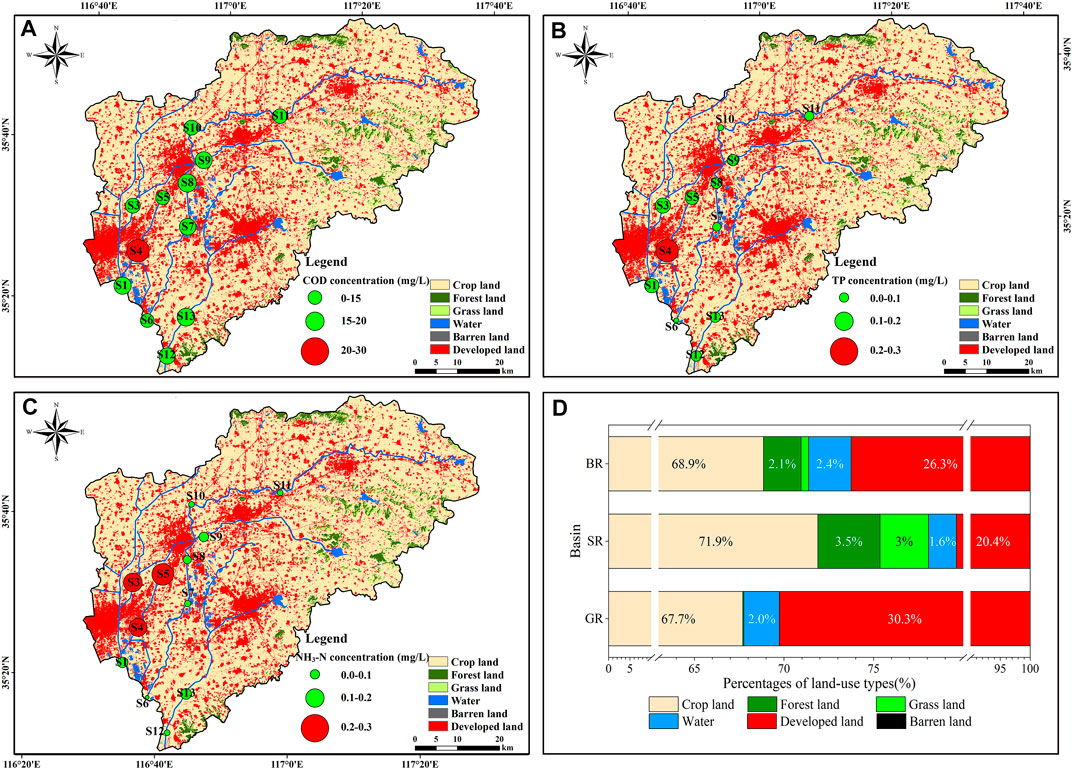
FIGURE 4. Spatial distribution of average concentrations from 2017 to 2019 (A): COD, (B) TP, (C) NH3-N) and percentages of land-use types in 2018 (D).
As the basic elements of the water cycle in the basin, the historical time series for the annual runoff and rainfall at six selected hydrological stations are depicted in Figure 5. Analysis of the SNHT results showed that the data of runoff were inhomogeneous while the data of precipitation were the opposite. According to the results of the M-K test and the MM-K test (see Table 4), rainfall showed a non-significant decreasing trend (α > 0.05) from 1960 to 2019. In contrast, the runoff volume was the opposite, with a highly significant decreasing trend in the runoff volume (α < 0.01) for the same time period. Compared with 1960–1979, the runoff volume of the GR declined from 104 million m3 to 45 million m3 and the runoff volume of the SR decreased from 301 million m3 to 176 million m3 in the last 2 decades, decreasing by 57 and 41%, respectively. The statistics for the average values of the hydrological elements in each of the 2 decades showed that the rainfall at first decreased and then increased, showing a relatively consistent trend with the measured runoff values, indicating that precipitation controlled the evolution of runoff to a certain extent. The rainfall in the last 2 decades did not differ much from the overall trend from 1960 to 2019, while the trend for the runoff volume varied slightly. The considerable decline (α < 0.01) in runoff of the GR was due to the construction of four inflatable rubber dams downstream and the withdrawal of water from the main urban area of Jining City, despite the fact that, the reservoirs of the SR and BR were built in the period 1960 to 1980.
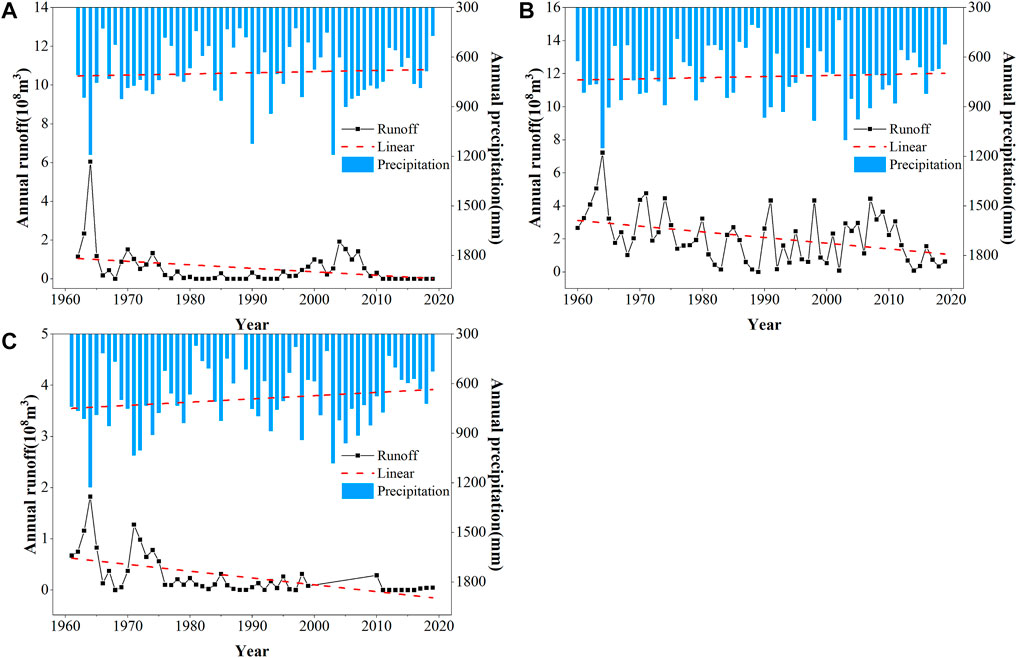
FIGURE 5. Historical precipitation and runoff time series on an annual basis observed at the selected hydrological stations (A): GR, (B) SR, (C) BR).

TABLE 4. Trend analysis for the precipitation and runoff series observed at the hydrological stations (G: GR, S: SR, B: BR, P: Precipitation, R: Runoff).
The regional engineering capacity comprises facilities for water storage, water conservancy and wastewater treatment. By the end of 2019, 246 water storage reservoirs, 34 sluices and rubber dams were constructed in the ENLB. For the purposes of studying changes in the past 20 years, only the storage capacity of sluices and rubber dams were considered in this paper. Given the requirements for navigation in the BR, no control engineering facility was built except for a barrage upstream, so the factor concerning the water storage capacity was not considered. The water storage capacity of the rivers rose year by year (see Figure 6), and it was most apparent in the SR basin, which had grown by about 3.6 times. The pollution prevention and water diversion project (PPWDP) of Jining City built in 2010 was the driving force in the GR basin. The total storage capacity of the project was 13 million m3, which can effectively store and reuse the recycled water discharged to the standard, so that it did not enter or much less water entered the water transfer trunk line to ensure water quality.
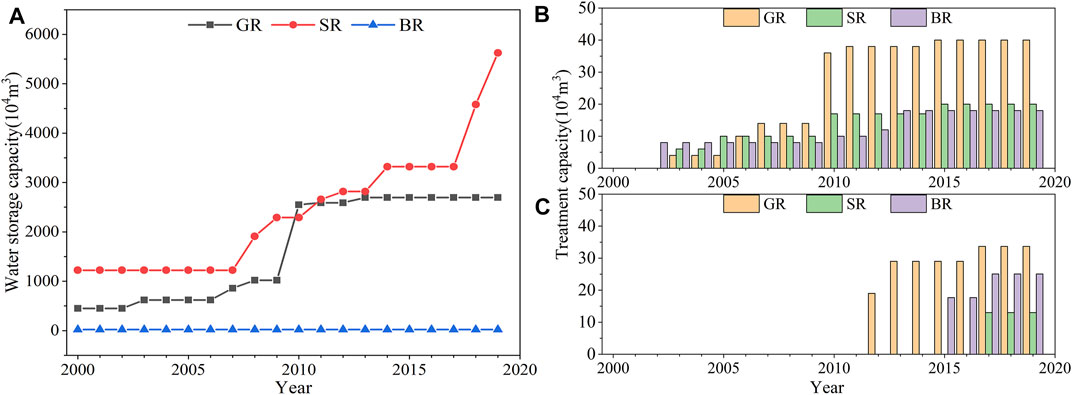
FIGURE 6. Capacity of water storage and water treatment from 2000 to 2019 in each basin of the ENLB (A): sluices and rubber dams, (B) waste water treatment plants, (C) constructed wetlands).
Wastewater treatment plants (WWTPs) reduced the concentration of industrial and domestic wastewater pollutants that were discharged; moreover, and wetlands were constructed to further improve the quality of water entering the river. As of the end of 2018, 15 domestic WWTPs and 3 industrial WWTPs had been built in the region, and conformed to the Class A of the “Discharge standard of pollutants for municipal wastewater treatment plant” (GB18918-2002); the treatment plants had a daily treatment capacity of nearly 780,000 m3. The constructed wetlands covered a total area of 33.8 km2 and ensured the protection of the water quality.
The GDP per capita is one of the most reflective indicators of the social economy in the area of interest, the metric reflecting the combination of the size of the population and the regional GDP. The ENLB is a centralized area of human activity and industrial production with 48% of the population and 50% of the GDP originating in 37% of the area of Jining City. By the end of 2019, the GDP per capita grew from 7,032 CNY to 52,331 CNY, a 6.4-fold increase. The local wastewater emissions included domestic wastewater and industrial wastewater, which were closely related to the size of the population and the magnitude of industrial development, as well as economic parameters that had a direct impact on the water quality of the water bodies. There was a rising trend in the volume of domestic wastewater year by year as a result of the continuous increase in population; with respect to industrial wastewater, there was an upward and then a downward trend, the peak discharge occurring in 2011, which was inseparable from the adjustment of industrial structure (see Figure 7). At the beginning of the 21st century, the ENLB was dominated by secondary industries that caused high pollution levels, such as coal mining, and the chemicals and paper industries (Wang et al., 2015), which reached a peak output of 53.8% in 2008 and then declined to 40.3% in 2019. The proportion of tertiary industry tended at first to be relatively low but then began to increase, as can be seen in the regional industrial structure becoming tilted towards the tertiary industries; 2008 was the inflection point for this structural adjustment.
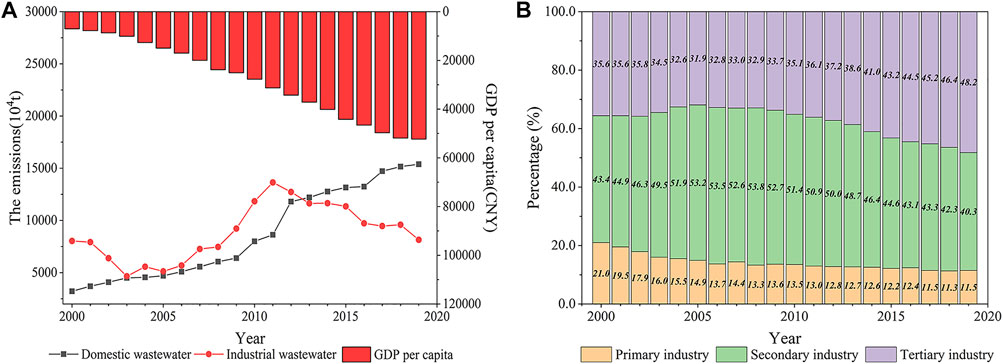
FIGURE 7. (A) GDP per capita, industrial and domestic wastewater emissions and (B) industrial structural change in the study area (2000–2019).
Ridge regression analysis was used to test quantitatively the response relationship between the changes in the water quality and the six factors in the ENLB; the weight contribution of each factor was calculated by taking the ratio of the absolute value of each factor to the sum of the absolute value of the total standardized regression coefficient (see Table 5 and Figure 8). In fitting the model, it was found that the TP and the NH3-N indices in the SR and the NH3-N index in the BR did not pass the F-test (p > 0.05), which meant that six factors could not reasonably explain the changes in the water quality from a statistical standpoint, thus these three parameters are not included in the subsequent discussion and analysis. Conversely, it can be seen that the changes in the different indicators for the different watersheds were subject to a variety of factors, and these were required to be further explored and studied. The rest of the regression model for each influencing factor and the results for the regression calculation of a single PI indicated that the adjusted R2 values of the model were above 0.6 (p < 0.05), indicating that the six influencing factors can better explain the trend of the PIs and can impact on their changes.
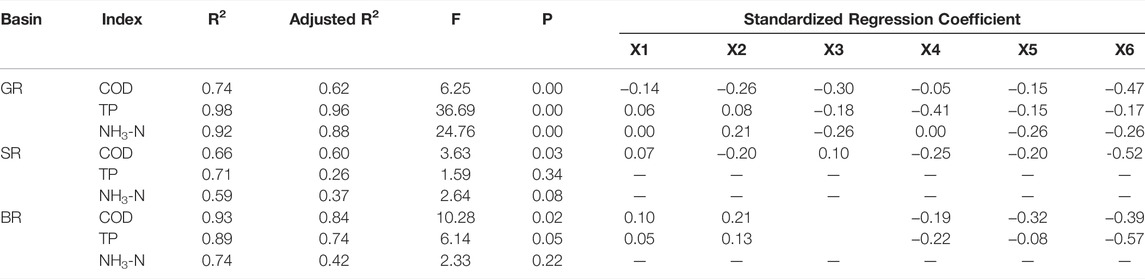
TABLE 5. Ridge regression of the PIs and influencing factors (— indicates the model is not applicable: p > 0.05).
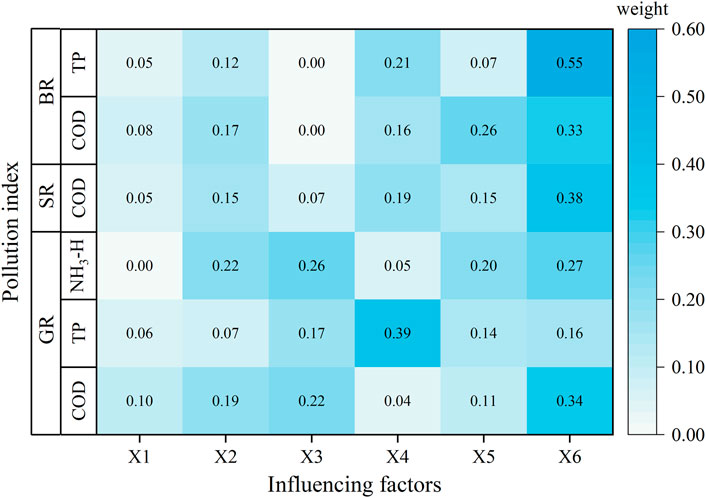
FIGURE 8. Evaluation of the contribution weight of the six influencing factors (X1: rainfall, X2: runoff, X3: water storage capacity, X4: sewage treatment capacity, X5: wastewater emissions and X6: GDP per capita).
Overall, the GDP per capita, the wastewater treatment capacity, and the water storage capacity were the main factors influencing the water quality, followed by wastewater discharge and runoff effects, and to a lesser extent, regional precipitation effects. Precipitation can determine the inflow of water from urban areas or from agricultural lands through surface and subsurface processes and may significantly regulate the extent of nutrient loading from nonpoint sources (Stockwell et al., 2020). Runoff as the most direct manifestation of rainfall at the surface was not evident in this region; however, it was impacted by changes in the underlying surface, by regulation as a result of water conservation projects, and by withdrawal of water in urban locations, with some variations in the amount of water entering the lake and from rainfall. In this study, it was found that the contribution of rainfall and runoff to water quality conditions showed a weak positive correlation. The trend of the variation in precipitation in the last 2 decades was not clear and in a normal year there was periodic variation in the precipitation patterns. Recent studies have shown that climate change is not a prominent factor in influencing water quality, but the occurrence of extreme climates, such as drought, flooding or heavy rainfall events, can have a strong impact on the water quality (Biswas and Mosley, 2018). A negative correlation was seen in the COD index of the GR. The runoff was maintained at a high level from 2003 to 2007, which was twice the average annual runoff, indicating that for high flow cases, organic pollution was further diluted. Such a conclusion was also observed for the COD index in the SR, while the BR exhibited a different pattern mainly due to the absence of runoff data from 2000 to 2009.
The factors, the water storage capacity and the wastewater treatment capacity, which are a focus of research in this study, were well presented in the regression model, especially in the GR. The water storage capacity had a large impact on the reduction of COD and NH3-N concentrations, with contributions of 22 and 26%, respectively. In the early stage of pollution control, the rivers remained the main destination for the flow of wastewater. Although controlling the source of pollution is the most effective measure to reduce pollutants, it takes a long time for its effect to have impact. Reasonable scheduling through existing gates and dams and the construction of new control projects can go some way towards improving water quality downstream, as evidenced in other areas of the Huaihe River Basin which have the similar pollution control challenges (Xia et al., 2011; Yuan et al., 2015). In particular, the implementation of the PPWDP has played an indispensable role in improving water quality at the GR estuary and even in the eventual operation of the ER-SNWTP. As a neighbor of the GR, a different outcome was realized for the SR, a positive correlation occurring between the water storage and the PI for the COD. This was mainly due to the relatively light pollution of the SR and the fact that development of water resources in the basin had mostly commenced after 2013. As shown in Table 2, even though the quality of water bodies in recent years had steadily reached the Class III standard, the concentration of COD has had a tendency to increase, which to some extent may be associated with unreasonable scheduling of the stepped gates and dams, an insufficient ecological flow and the concentrated release of pollutants during the flood season (Jiang et al., 2011).
The wastewater treatment capacity was another predictor considered to reproduce the variability of the riverine quality, particularly in the TP index of the GR and the BR. Given that the engineering capacity of the BR was limited, the construction of the WWTPs played an influential role in improving the water quality standards, and where the first WWTP was established in the ENLB. It was the epitome of China’s vigorous construction of WWTPs, reaching a daily treatment capacity of nearly 200 million m3/d (Qu et al., 2019). The constructed wetlands has been shown to be a proven method for treating wastewater and ecological restoration (Zhang et al., 2008; Ge et al., 2012), and having the beneficial effect of removing N and P (Woltemade, 2000), which was reflected in the TP index of the GR. The dramatic reduction of COD and NH3-N differed from the time taken to complete the wetlands project, with 2010 as the split point, thus the corresponding relationship was weak.
Contrary to the relatively minor role played by the hydrological factors, the GDP per capita was clearly the factor that most influenced riverine water quality in the ENLB, negative correlation effect being exhibited, with an average contribution of 30%. Following the launch of the ER-SNWDP and the “Water Pollution Prevention Planning of the South-to-North Water Diversion Project (east route) of Shandong Section”, a series of the strictest policies and measures to control pollution were implemented, such as “treatment, recycling, and restoration” of the basin pollution control strategy (Wang et al., 2015). Between 2003 and 2010, heavily polluting enterprises in Nansi Lake Basin were shut down and transferred to compliance management to address the source of pollution. Accordingly, people became more aware of the importance of protecting the water environment for the purposes of improving living standards (Ren et al., 2014). The impact of the government’s policy for management of riverine water quality, such as the River Chief Policy (RCP), has been striking, hence it is imperative to consolidate the pollution control achievements (She et al., 2019). Meanwhile, the optimization of industrial structure and progress in environmentally-based technologies has led to an enhancement of the aquatic and lakes environment in spite of the continuous increase in wastewater emissions (Sheng and Tang, 2021).
It has been evident that the overall condition of the rivers in the ENLB noticeably improved from 2000 to 2019, and the status of pollution control has shifted from concentrated attack to consolidation and improvement. However, it was worth noting that while our description of the general trend based on the annual averages paints a good picture on the water quality of the three rivers, the reality is that there are often cases where pollutant concentrations have been too high to consistently meet the water quality standards.
The water environment is a complex and challenging system, and trends in the changes in water quality can only be explained to some extent by consideration of the six factors examined in this paper. Some of the drivers have certain problems and risks along with positive impacts. The construction of gates and dams is a double-edged sword for the water environment. The first flood in the abundant water period will carry the pollutants which accumulated in the river downstream to the lakes, and this process is highly susceptible to risking water pollution. Due to the limitations of engineering design and the lack of effective utilization pathways, the PPWDP is faced with the threat of recycled water entering the water transmission trunk line of the ER-SNWDP. Therefore, it is vital to reduce the amount of pollutants entering the river from source in order to fundamentally solve the problem of pollutants entering the rivers and lake during the rainy season. While this finding briefly addressed the importance of treatment capacity of the WWTPs, it could also reflect the fact that high leakage rate of sewer network, overload operation in the flood season, disparity between the effluent discharge standards and the local conditions and environmental protection demands. Substantive improvement in the treatment capacity and the setting of appropriate discharge standards are considered to be one of the next water management priorities. In addition, the issues of constructed wetlands that mitigate and reduce the effects of pollution spikes, low efficiency of wetland land use, poor wetland operation and management maintenance need to be addressed. The results of relevant studies have shown that the natural wetlands can generate better biodiversity and are suitable to use as artificial means to promote the restoration of wetlands when farmlands are converted in the Nansi Lake region (Ge et al., 2012).
The changes in water quality and the factors associated with inflow rivers which influence pollutant control in the ENLB have been studied. The main conclusions are as follows:
1) In the past 20 years, the water quality of the GR, the SR and the BR in the ENLB has improved significantly. With the opening of the ER-SNWDP as a time separation point, the most obvious reduction in pollutant concentrations occurred before 2013, and after that the main focus has been on consolidation and improvement. Improvement in the water quality of the GR was most apparent with a great downward trend for CPI from 14.15 to 0.75, whereas improvements in the SR and the BR pollution were relatively modest. The water quality condition of the three rivers which flowed into the lake was basically stable and met the Class III standard after water diversion.
2) All three rivers exceeded, to varying degrees, the water quality standards for COD and TP which were the key pollutants examined. Non-compliant results were most noticeable for the GR basin, and these were located mainly in sections of the upper tributaries. The average concentration of COD at river estuaries was higher in the flood season than in the non-flood season, that is 22, 4, and 9% higher, respectively in the GR, SR and BR. The NH3-N index in the SR basin was more sensitive to the incoming water on a seasonal basis and exhibited a characteristic pattern in the non-flood period. Spatially, the overall water quality of the upper reaches and the lake inlet was better than that of middle reaches, and this was closely related to land use types and pollution control projects.
3) The GDP per capita was the most striking driver of changes in the regional water quality. Enhancement of the water storage capacity proved to be most important for securing an improvement in the COD and NH3-N in the GR with contributions of 22 and 26%, respectively, and the TP was more influenced by the wastewater treatment capacity. The construction of WWTPs and constructed wetlands were shown to be essential, in the case of sites with limited water storage capacity. The influencing factors selected in this study had some limitations and hence these factors do not account for all the changes observed in the pollutant indicators.
4) To ensure further improvements in water quality along the diversion routes, it is necessary to focus on the existing problems associated with the pollution control projects, such as capacity limitation of the PPWD project, high leakage rate of the sewer network and the unstable pollution reduction effects of the constructed wetlands.
The original contributions presented in the study are included in the article/Supplementary Material, further inquiries can be directed to the corresponding authors.
All authors listed have made a substantial, direct and intellectual contribution to the work and approved it for publication.
This work was jointly funded by the Nation Key R & D Program of China (2018YFC0407200) and the Projects of the National Natural Science Foundation of China (52179073).
The authors declare that the research was conducted in the absence of any commercial or financial relationships that could be construed as a potential conflict of interest.
All claims expressed in this article are solely those of the authors and do not necessarily represent those of their affiliated organizations, or those of the publisher, the editors and the reviewers. Any product that may be evaluated in this article, or claim that may be made by its manufacturer, is not guaranteed or endorsed by the publisher.
The Supplementary Material for this article can be found online at: https://www.frontiersin.org/articles/10.3389/fenvs.2022.931642/full#supplementary-material
Alexandersson, H. (1986). A Homogeneity Test Applied to Precipitation Data. J. Climatol. 6 (6), 661–675. doi:10.1002/joc.3370060607
Avigliano, E., and Schenone, N. (2016). Water Quality in Atlantic Rainforest Mountain Rivers (South America): Quality Indices Assessment, Nutrients Distribution, and Consumption Effect. Environ. Sci. Pollut. Res. 23 (15), 15063–15075. doi:10.1007/s11356-016-6646-9
Babayan, G., Reshetnyak, O., and Zakrutkin, V. (2021). A Comparative Assessment of River Water Quality in Mountain Regions of Russia and Armenia. Water Resour. 48 (1), 102–110. doi:10.1134/s0097807821010115
Biswas, T. K., and Mosley, L. M. (2018). From Mountain Ranges to Sweeping Plains, in Droughts and Flooding Rains; River Murray Water Quality over the Last Four Decades. Water Resour. Manage 33 (3), 1087–1101. doi:10.1007/s11269-018-2168-1
Cox, D. R., and Stuart, A. (1955). Some Quick Sign Tests for Trend in Location and Dispersion. Biometrika 42 (1/2), 80–95. doi:10.2307/2333424
Demir, V., and Keskin, A. Ü. (2020). Water Level Change of Lakes and Sinkholes in Central Turkey under Anthropogenic Effects. Theor. Appl. Climatol. 142 (3-4), 929–943. doi:10.1007/s00704-020-03347-5
Ding, J., Jiang, Y., Liu, Q., Hou, Z., Liao, J., Fu, L., et al. (2016). Influences of the Land Use Pattern on Water Quality in Low-Order Streams of the Dongjiang River Basin, China: A Multi-Scale Analysis. Sci. Total Environ. 551-552, 205–216. doi:10.1016/j.scitotenv.2016.01.162
Edwards, A. L. (1985). Multiple Regression and the Analysis of Variance and Covariance. New York, NY, US: W H Freeman/Times Books/Henry Holt & Co.
El-Sheikh, M. A., Saleh, H. I., El-Quosy, D. E., and Mahmoud, A. A. (2010). Improving Water Quality in Polluated Drains with Free Water Surface Constructed Wetlands. Ecol. Eng. 36 (10), 1478–1484. doi:10.1016/j.ecoleng.2010.06.030
Feng, N., Wu, Z. H., Guo, Q., and Yue, T. X. (2018). Comprehensive Evaluation and Analysis on Improvement Effect of Water Quality for Rivers Entering Nansi Lake. J. Green Sci. Technol. 2018 (10), 55–59. (in Chinese with English abstract). doi:10.16663/.cnki.lskj.2018.10.021
Feng, L., Zhang, J., Fan, J., Wei, L., He, S., and Wu, H. (2022). Tracing Dissolved Organic Matter in Inflowing Rivers of Nansi Lake as a Storage Reservoir: Implications for Water-Quality Control. Chemosphere 286 (Pt 1), 131624. doi:10.1016/j.chemosphere.2021.131624
Gao, X. P., Li, W. M., Zhang, C., and Zhao, S. X. (2013). Impact of Inflowing Rivers on Water Quality of Nansi Lake. Water Resour. Prot. 29 (2), 1–5. (in Chinese with English abstract). doi:10.3969/j.issn.1004-6933.2013.02.001
Ge, X. L., Wang, R. Q., and Liu, J. (2012). The Comparison of the Community Features between the Constructed Wetland and the Natural Wetland in Nansi Lake. Adv. Mater. Res. 518-523, 5238–5243. doi:10.4028/www.scientific.net/amr.518-523.5238
Guo, P., and Ren, J. (2014). Variation Trend Analysis of Water Quality along the Eastern Route of South-To-North Water Diversion Project. South North Water Transfers Water Sci. Technol. 12 (1), 60–64. (in Chinese with English abstract). doi:10.3724/SP.J.1201.2014.01059
Guo, S., Zhang, Y., Xiao, J., Zhang, Q., Ling, J., Chang, B., et al. (2021). Assessment of Heavy Metal Content, Distribution, and Sources in Nansi Lake Sediments, China. Environ. Sci. Pollut. Res. 28 (24), 30929–30942. doi:10.1007/s11356-021-12729-9
Hamed, K. H., and Ramachandra Rao, A. (1998). A Modified Mann-Kendall Trend Test for Autocorrelated Data. J. Hydrol. 204 (1), 182–196. doi:10.1016/S0022-1694(97)00125-X
Huang, J., Zhang, Y., Bing, H., Peng, J., Dong, F., Gao, J., et al. (2021). Characterizing the River Water Quality in China: Recent Progress and On-Going Challenges. Water Res. 201, 117309. doi:10.1016/j.watres.2021.117309
Jiang, Y., Peng, Q., Luo, H., and Ma, W. (2011). Analysis of Spatial and Temporal Variation of Water Quality in Huaihe River Basin. J. Hydraulic Eng. 42 (11), 1283–1288. (in Chinese with English abstract). doi:10.13243/j.cnki.slxb.2011.11.010
Juan, Y., Xu, F., Feng, X., Yi, G., Long, X., and Xinwei, M. (2016). Variations of Water Quality of the Major 22 Inflow Rivers since 2007 and Impacts on Lake Taihu. J. Lake Sci. 28 (6), 1167–1174. (in Chinese with English abstract). doi:10.18307/2016.0602
Khaliq, M. N., and Ouarda, T. B. M. J. (2007). On the Critical Values of the Standard Normal Homogeneity Test (SNHT). Int. J. Climatol. 27 (5), 681–687. doi:10.1002/joc.1438
Kisi, O., and Ay, M. (2014). Comparison of Mann-Kendall and Innovative Trend Method for Water Quality Parameters of the Kizilirmak River, Turkey. J. Hydrol. 513, 362–375. doi:10.1016/j.jhydrol.2014.03.005
Kumar, A., Taxak, A. K., Mishra, S., and Pandey, R. (2021). Long Term Trend Analysis and Suitability of Water Quality of River Ganga at Himalayan Hills of Uttarakhand, India. Environ. Technol. Innovation 22, 101405. doi:10.1016/j.eti.2021.101405
Liu, Y. N., Wan, Y., and Xu, Y. D. (2005). Water Quality Analysis for the First Stage of South-To-North Water Transfer East Line Project. J. Hohai Univ. Nat. Sci. 33 (3), 264–268. (in Chinese with English abstract). doi:10.3321/j.issn:1000-1980.2005.03.007
Liu, Y., Yang, L., and Jiang, W. (2020). Qualitative and Quantitative Analysis of the Relationship between Water Pollution and Economic Growth: A Case Study in Nansi Lake Catchment, China. Environ. Sci. Pollut. Res. 27 (4), 4008–4020. doi:10.1007/s11356-019-07005-w
Luo, P., He, B., Takara, K., Razafindrabe, B. H. N., Nover, D., and Yamashiki, Y. (2011). Spatiotemporal Trend Analysis of Recent River Water Quality Conditions in Japan. J. Environ. Monit. 13 (10), 2819–2829. doi:10.1039/c1em10339c
Luo, P., Kang, S., ApipZhou, M., Zhou, M., Lyu, J., Aisyah, S., et al. (2019). Water Quality Trend Assessment in Jakarta: A Rapidly Growing Asian Megacity. PLoS One 14 (7), e0219009. doi:10.1371/journal.pone.0219009
Mainali, J., and Chang, H. (2018). Landscape and Anthropogenic Factors Affecting Spatial Patterns of Water Quality Trends in a Large River Basin, South Korea. J. Hydrol. 564, 26–40. doi:10.1016/j.jhydrol.2018.06.074
Mann, H. B. (1945). Nonparametric Tests against Trend. Econometrica 13 (3), 245–259. doi:10.2307/1907187
Meng, J., Yu, Z., Miao, M., Kong, Q., Zhang, Y., and Liu, J. (2017). Differentiated Responses of Plankton and Zoobenthos to Water Quality Based on Annual and Seasonal Analysis in a Freshwater Lake. Pol. J. Environ. Stud. 26 (2), 755–764. doi:10.15244/pjoes/66713
Nijhawan, A., and Howard, G. (2022). Associations between Climate Variables and Water Quality in Low- and Middle-Income Countries: A Scoping Review. Water Res. 210, 117996. doi:10.1016/j.watres.2021.117996
Qu, J., Wang, H., Wang, K., Yu, G., Ke, B., Yu, H.-Q., et al. (2019). Municipal Wastewater Treatment in China: Development History and Future Perspectives. Front. Environ. Sci. Eng. 13 (6), 88. doi:10.1007/s11783-019-1172-x
Qu, X., Chen, Y., Liu, H., Xia, W., Lu, Y., Gang, D.-D., et al. (2020). A Holistic Assessment of Water Quality Condition and Spatiotemporal Patterns in Impounded Lakes along the Eastern Route of China's South-To-North Water Diversion Project. Water Res. 185, 116275. doi:10.1016/j.watres.2020.116275
Ren, L., Cui, E., and Sun, H. (2014). Temporal and Spatial Variations in the Relationship between Urbanization and Water Quality. Environ. Sci. Pollut. Res. 21 (23), 13646–13655. doi:10.1007/s11356-014-3242-8
Rollason, E., Sinha, P., and Bracken, L. J. (2021). Interbasin Water Transfer in a Changing World: A New Conceptual Model. Prog. Phys. Geogr. Earth Environ. 46, 371–397. doi:10.1177/03091333211065004
Salerno, F., Gaetano, V., and Gianni, T. (2018). Urbanization and Climate Change Impacts on Surface Water Quality: Enhancing the Resilience by Reducing Impervious Surfaces. Water Res. 144, 491–502. doi:10.1016/j.watres.2018.07.058
She, Y., Liu, Y., Jiang, L., and Yuan, H. (2019). Is China's River Chief Policy Effective? Evidence from a Quasi-Natural Experiment in the Yangtze River Economic Belt, China. J. Clean. Prod. 220, 919–930. doi:10.1016/j.jclepro.2019.02.031
Sheng, J., and Tang, W. (2021). Spatiotemporal Variation Patterns of Water Pollution Drivers: The Case of China's South-North Water Transfer Project. Sci. Total Environ. 761, 143190. doi:10.1016/j.scitotenv.2020.143190
Stockwell, J. D., Doubek, J. P., Adrian, R., Anneville, O., Carey, C. C., Carvalho, L., et al. (2020). Storm Impacts on Phytoplankton Community Dynamics in Lakes. Glob. Change Biol. 26 (5), 2756–2784. doi:10.1111/gcb.15033
Tang, C., Yi, Y., Yang, Z., and Cheng, X. (2014). Water Pollution Risk Simulation and Prediction in the Main Canal of the South-To-North Water Transfer Project. J. Hydrol. 519, 2111–2120. doi:10.1016/j.jhydrol.2014.10.010
Tian, C., Pei, H., Hu, W., and Xie, J. (2013). Phytoplankton Variation and its Relationship with the Environmental Factors in Nansi Lake, China. Environ. Monit. Assess. 185 (1), 295–310. doi:10.1007/s10661-012-2554-8
Tong, Y., Wang, M., Peñuelas, J., Liu, X., Paerl, H. W., Elser, J. J., et al. (2020). Improvement in Municipal Wastewater Treatment Alters Lake Nitrogen to Phosphorus Ratios in Populated Regions. Proc. Natl. Acad. Sci. U.S.A. 117 (21), 11566–11572. doi:10.1073/pnas.1920759117
Wang, C., Wang, Y.-y., and Wang, P.-f. (2006). Water Quality Modeling and Pollution Control for the Eastern Route of South to North Water Transfer Project in China. J. Hydrodyn. 18 (3), 253–261. doi:10.1016/s1001-6058(06)60001-2
Wang, L., Yang, L., Cao, F., Zhu, J., and Wang, Y. (2014). Water Quality Comprehensive Evaluations for the Estuary Areas of Typical Inflow Rivers of Nansi Lake. Trans. Oceanol. Limnol. 2014 (4), 84–90. (in Chinese with English abstract). doi:10.13984/j.cnki.cn37-1141.2014.04.012
Wang, W., Liu, X., Wang, Y., Guo, X., and Lu, S. (2015). Analysis of Point Source Pollution and Water Environmental Quality Variation Trends in the Nansi Lake Basin from 2002 to 2012. Environ. Sci. Pollut. Res. 23 (5), 4886–4897. doi:10.1007/s11356-015-5625-x
Wasserstein, R. L., Schirm, A. L., and Lazar, N. A. (2019). Moving to a World beyond “p<0.05”. Am. Stat. 73 (Suppl. 1), 1–19. doi:10.1080/00031305.2019.1583913
Woltemade, C. J. (2000). Ability of Restored Wetlands to Reduce Nitrogen and Phosphorus Concentrations in Agricultural Drainage Water. J. Soil Water Conservation 55 (3), 303–309.
Xia, J., Zhang, Y.-Y., Zhan, C., and Ye, A. Z. (2011). Water Quality Management in China: The Case of the Huai River Basin. Int. J. Water Resour. Dev. 27 (1), 167–180. doi:10.1080/07900627.2010.531453
Xia, X., Wu, Q., and Mou, X. (2012). Advances in Impacts of Climate Change on Surface Water Quality. Adv. Water Sci. 23 (1), 124–133. (in Chinese with English abstract). doi:10.14042/.cnki.32.1309.2012.01.020
Wenjing, X., Wang, S., Song, W., Shanchong, L., Shengle, C., Xiuling, S., et al. (2016). Evaluation of Temporal Water Quality Change (2008-2014) and the Cause Analysis in the Upper-Reach Lakes of Lake Nansi, Shandong Province. J. Lake Sci. 28 (3), 513–519. (in Chinese with English abstract). doi:10.18307/2016.0306
Xu, H., Sang, G., Yang, L., Yan, F., and Liu, Y. (2019). Temporal and Spatial Distribution Characteristics of Water Quality in Nansi Lake in Recent Ten Years. Trans. Oceanol. Limnol. 2019 (2), 47–52. (in Chinese with English abstract). doi:10.13984/j.cnki.cn37-1141.2019.02.007
Yagbasan, O., Demir, V., and Yazicigil, H. (2020). Trend Analyses of Meteorological Variables and Lake Levels for Two Shallow Lakes in Central Turkey. Water 12 (2), 414. doi:10.3390/w12020414
Yang, J., and Huang, X. (2021). The 30 M Annual Land Cover Dataset and its Dynamics in China from 1990 to 2019. Earth Syst. Sci. Data 13 (8), 3907–3925. doi:10.5194/essd-13-3907-2021
Yao, J., Wang, G., Wang, L., Zhang, X., and Wang, P. (2021). Assessing the Spatiotemporal Variability of Lake Water Quality Using A Novel Multidimensional Shape - Position Similarity Cloud Model. J. Hydrol. 599, 126379. doi:10.1016/j.jhydrol.2021.126379
Yaseen, Z. M., Ramal, M. M., Diop, L., Jaafar, O., Demir, V., and Kisi, O. (2018). Hybrid Adaptive Neuro-Fuzzy Models for Water Quality Index Estimation. Water Resour. Manage 32 (7), 2227–2245. doi:10.1007/s11269-018-1915-7
Yuan, D., Zhang, Y., Liu, J., Gao, S., and Song, X. (2015). Water Quantity and Quality Joint-Operation Modeling of Dams and Floodgates in Huai River Basin, China. J. Water Resour. Plan. Manag. 141 (9). doi:10.1061/(asce)wr.1943-5452.0000516
Yue, S., Pilon, P., Phinney, B., and Cavadias, G. (2002). The Influence of Autocorrelation on the Ability to Detect Trend in Hydrological Series. Hydrol. Process. 16 (9), 1807–1829. doi:10.1002/hyp.1095
Zhang, W., and Yang, L. (2011). Water Quality Evalution for the Main Inflow Rivers of Nansihu Lake. Trans. Oceanol. Limnol. 2011 (1), 141–146. (in Chinese with English abstract). doi:10.13984/j.cnki
Zhang, J., Meng, F., Lu, Y., Jing, Y., Zhang, H., Zhang, B., et al. (2008). Ecological Assessment of Lakeshore Wetland Rehabilitation on Eastern Route of South-To-North Water Transfer Project. Front. Environ. Sci. Eng. China 2 (3), 306–310. doi:10.1007/s11783-008-0057-1
Zhang, Y., Xia, J., Chen, J., and Zhang, M. (2011). Water Quantity and Quality Optimization Modeling of Dams Operation Based on SWAT in Wenyu River Catchment, China. Environ. Monit. Assess. 173 (1-4), 409–430. doi:10.1007/s10661-010-1396-5
Zhang, L., Li, S., Loáiciga, H. A., Zhuang, Y., and Du, Y. (2015). Opportunities and Challenges of Interbasin Water Transfers: A Literature Review with Bibliometric Analysis. Scientometrics 105 (1), 279–294. doi:10.1007/s11192-015-1656-9
Zhang, B.-l., Cui, B.-h., Zhang, S.-m., Wu, Q.-y., and Yao, L. (2018). Source Apportionment of Nitrogen and Phosphorus from Non-point Source Pollution in Nansi Lake Basin, China. Environ. Sci. Pollut. Res. 25 (19), 19101–19113. doi:10.1007/s11356-018-1956-8
Zhang, M., Shi, X., Yang, Z., and Chen, K. (2020). The Variation of Water Quality from 2012-2018 in Lake Chaohu and the Mitigating Strategy on Cyanobacterial Blooms. J. Lake Sci. 32 (1), 11–20. (in Chinese with English abstract). doi:10.18307/2020.0102
Zhang, T., Yang, G., Zhang, J., Wang, P., Yali, C., and Zeng, F. (2022). Changes in the Quality of Water Flowing through the First Phase of the Eastern Route of the South-To-North Water Transfer Project. J. Hydroecol. 43 (1), 8–15. (in Chinese with English abstract). doi:10.15928/j.1674-3075.202106290208
Zhang, Q. (2009). The South-To-North Water Transfer Project of China: Environmental Implications and Monitoring Strategy. J. Am. Water Resour. Assoc. 45 (5), 1238–1247. doi:10.1111/j.1752-1688.2009.00357.x
Zhuang, W., Ying, S. C., Frie, A. L., Wang, Q., Song, J., Liu, Y., et al. (2019). Distribution, Pollution Status, and Source Apportionment of Trace Metals in Lake Sediments under the Influence of the South-To-North Water Transfer Project, China. Sci. Total Environ. 671, 108–118. doi:10.1016/j.scitotenv.2019.03.306
Keywords: eastern region of Nansi lake basin, mountainous inflow rivers, water quality, trend variation, spatiotemporal characteristics, influencing factors
Citation: Zhao Y, Wu S, Dai J, Wu X, Zhang Y, Yang R, Wu C and Feng K (2022) Growth in the Economic and Hydraulic Engineering Capacities Drives Water Quality Improvement in the Eastern Region of Nansi Lake, China. Front. Environ. Sci. 10:931642. doi: 10.3389/fenvs.2022.931642
Received: 29 April 2022; Accepted: 06 June 2022;
Published: 01 July 2022.
Edited by:
Yuankun Wang, North China Electric Power University, ChinaReviewed by:
Vahdettin Demir, KTO Karatay University, TurkeyCopyright © 2022 Zhao, Wu, Dai, Wu, Zhang, Yang, Wu and Feng. This is an open-access article distributed under the terms of the Creative Commons Attribution License (CC BY). The use, distribution or reproduction in other forums is permitted, provided the original author(s) and the copyright owner(s) are credited and that the original publication in this journal is cited, in accordance with accepted academic practice. No use, distribution or reproduction is permitted which does not comply with these terms.
*Correspondence: Shiqiang Wu, c3F3dUBuaHJpLmNu; Jiangyu Dai, anlkYWlAbmhyaS5jbiYjeDAyMDBhOw==; Xiufeng Wu, eGZ3dUBuaHJpLmNu
Disclaimer: All claims expressed in this article are solely those of the authors and do not necessarily represent those of their affiliated organizations, or those of the publisher, the editors and the reviewers. Any product that may be evaluated in this article or claim that may be made by its manufacturer is not guaranteed or endorsed by the publisher.
Research integrity at Frontiers
Learn more about the work of our research integrity team to safeguard the quality of each article we publish.