
94% of researchers rate our articles as excellent or good
Learn more about the work of our research integrity team to safeguard the quality of each article we publish.
Find out more
ORIGINAL RESEARCH article
Front. Environ. Sci., 29 June 2022
Sec. Atmosphere and Climate
Volume 10 - 2022 | https://doi.org/10.3389/fenvs.2022.931529
This article is part of the Research TopicAtmospheric Dust: How it affects climate, environment and life on Earth?View all 7 articles
 Wen Huo1,2,3
 Fan Yang1,2,4*Ye Wu1,2,4
 XieFei Zhi1,4MeiQi Song1,2,4*ChengLong Zhou1,2,5
 XingHua Yang1,3Ali MamtiMin1,5,6
 Qing He1,2Cong Wen1,2JiaCheng Gao1,2Lu Meng1,2,4Shunqi Hu7*
Dust storms and dust aerosols seriously affect environmental variation and climate change at regional and global scales. Accordingly, these hazards are the current focus in studies related to Earth science. The near-surface layer is an important link for the upward transmission of dust aerosols. However, the difficulty associated with obtaining real-time observation data from this layer has markedly hindered the progress of related research. In sand source areas, the topographic relief of natural dunes is easily ignored, despite serving as an essential factor affecting wind-driven dust emission, transport, and deposition. In this study, we explored the similarities and differences in horizontal dust flux (Q) between Xiaotang and Tazhong using observation data. In Xiaotang, the variation in the Q value with height was found to fit a power function; however, in Tazhong, the Q value did not show a significant gradient change. Such phenomena are caused by the secondary sand source generated by the undulation of natural dunes. The median particle diameter of the dust lifted from the ground during dust storms was essentially the same between Xiaotang and Tazhong, ranging from 74 to 82 μm in Tazhong and from 53 to 81 μm in Xiaotang. The maximum wind speed in Xiaotang was greater than that in Tazhong, resulting in a larger Q value for each particle size range in Xiaotang. The coarse sediment grain was identified as the main factor controlling the vertical variation trend of Q. Further, fine particles were found to have a minor impact.
Dust storms are serious meteorological hazards. In fact, the process of dust transport has exacerbated land desertification. Sand transport has had significant impacts on atmospheric radiation balance, climate change (Coakley et al., 1983; Sokolik and Toon, 1996; Ramanathan et al., 2001; Gautam et al., 2010; Spyrou et al., 2013), environment, air quality, and human health (Chen et al., 2004; Prospero et al., 2014; Viana et al., 2002) and has become an important part of the global biogeochemical cycle.
The Taklimakan Desert is the largest mobile desert in China and is one of the main sources of sand material transmission in China (Gong et al., 2003; Wang et al., 2005). Owing to the joint influence of the topography of the Tarim Basin and Tibetan Plateau (Zhang and Wang, 2008; Xu et al., 2014), dust storms lift dust aerosols into the air, resulting in a unique phenomenon known as persistent floating dust (He and Zhao, 1997; Zhang et al., 2007; Ma et al., 2007; Nan and Wang, 2018; Meng et al., 2019). Under the westerlies, dust aerosols diffuse to eastern China and other parts of East Asia (Liu et al., 2015; Chen et al., 2017). This diffusion has a significant impact on the climate and environment in East Asia and the entire world (Iwasaka et al., 1983; Huang et al., 2009). Since the 1980s, Nickovic and Dobricic, 1996 has focused on the long-range transport of dust in the western Mediterranean, and for the first time, divided the dust transport process into two stages: dust mobilisation at the surface and dust lifting by turbulence. Genthon (1992) investigated the characteristics of dust storms and sea salt aerosols in Antarctica using the atmospheric circulation model. Notably, they found that the vertical distribution of atmospheric aerosols is an important parameter in numerical modelling and the stability of the boundary layer has a considerable influence on the vertical distribution of near-surface aerosols. Based on studies performed by scholars worldwide, we sought to explore how the vertical uplift of dust aerosols in sand source areas can be realistically reflected and how the topographic relief of dunes affects the vertical transport of dust aerosols in the near-surface layer.
Since the beginning of this century, studies on dust storms and dust aerosols have become the focus of scientists in many countries; these studies have led to fruitful achievements (Zhang et al., 2005; Zhang et al., 2009; Park and In, 2003; Tegen et al., 2002; Murayama et al., 2001; Tratt et al., 2001; Xuan et al., 2000; Che et al., 2005). With advancements in observation and analysis methods, significant progress has been made in studies on dust storms and dust aerosols from various aspects, such as synoptic analysis, climatic causes, numerical simulation, climatic effects, and environmental impacts (Zhou et al., 2002; Shen et al., 2003; Sun et al., 2003; Wang et al., 2003; Zhou and Zhang, 2003; Lei et al., 2005; Huang and Zheng, 2006; Yue et al., 2008; Chen et al., 2017; Zhou et al., 2017; Hu et al., 2019). Investigations regarding dust emission, transport, and deposition during dust storms mainly focus on: 1) estimating the amount of dust emission at the ground surface and analysing the mechanisms of dust emission and its influencing factors; and 2) simulating the processes and calculating the total amount of dust transport at high levels and dust deposition (Zhao et al., 2011). Beside, for the near-surface layer, as an important link between dust mobilisation at the ground surface and dust transport within the boundary layer, the evolution patterns of the horizontal dust transport flux and the sediment particle size parameters during dust storms are unknown. Unfortunately, related studies are rare as observation data are difficult to collect. Thus, the variations in dust transport parameters in the near-surface layer under natural conditions are unclear. Little attention has been paid to the effects of topographic relief in the Taklimakan Desert on the vertical structure of the near-surface layer during dust storms owing to the existence of different research perspectives. However, these scientific problems must be urgently addressed. Thus, this study sought to explore the influence of topographic relief on sand transport in the near-surface layer during dust storms. By employing a new perspective, this study aimed to provide new scientific information on the material exchange between ground and atmosphere affected by a non-flat, uniform underlying surface and a basis for improving numerical forecasting models of dust storms.
In this study, we innovatively designed an observational experiment to evaluate the variability of near-surface vertical gradient of dust storms at two sites in the Taklimakan Desert. Accordingly, this study sought to reveal the vertical distribution characteristics of horizontal dust fluxes and particle size parameters under different topographic conditions based on the invaluable observation data. The rest of the paper is arranged as follows: Section 2 describes the observation area and the design of the observational experiment; Section 3 presents the characteristics of horizontal dust fluxes (Q) and grain-size components and the analysis of wind dynamics based on the experimental data; and Section 4 and Section 5 discusses and concludes the study, respectively.
To study and demonstrate the influence of undulating dunes on the key dust particle parameters in the near-surface layer under natural conditions, we innovatively designed an observational experiment to evaluate the variability of the near-surface vertical gradient of dust storms at two sites in the Taklimakan Desert. The 80-m gradient observation system in Tazhong is at the centre point of the desert, hereinafter referred to as TZ, and the topography of its surrounding observation environment is dominated by naturally undulating dunes. The 100-m gradient system in Xiaotangis at the northern edge of the Taklimakan Desert, hereinafter referred to as XT, and its surrounding observation region has a nearly flat terrain, as shown in Figure 1.
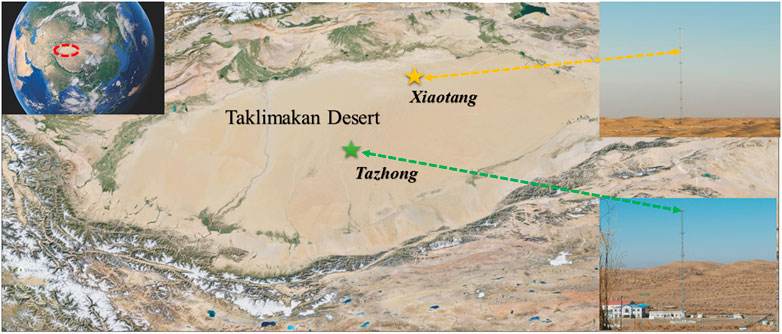
FIGURE 1. Locations of the main station (TZ) and auxiliary station (XT) in the Taklimakan Desert and images of the flux observation systems.
Key observation parameters, such as the gradient wind speed, temperature, wind direction, and horizontal dust flux during dust storms, were obtained using the 80-m near-surface micrometeorological gradient observation system in TZ, the 100-m system in XT, and the BSNE sand collectors installed at different heights. Combined with the particle-size determination work performed in the laboratory, the particle size parameters of the dust samples, including the median particle diameter and grain-size component data, were obtained.
Dust samples were collected between January 2018 and August 2018, the spring-to-summer dust storm season in the Taklimakan Desert. The flux observation system in TZ was 80 m high, while that in XT was 100 m high (Figure 2).
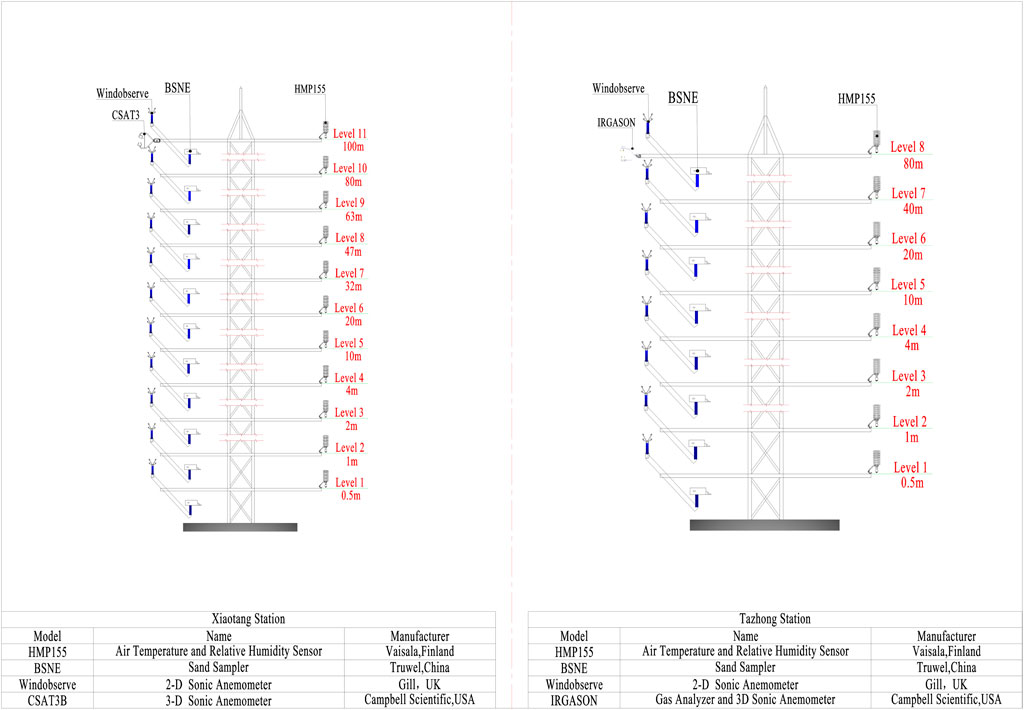
FIGURE 2. Schematic of the flux observation systems in the Taklimakan Desert.
In TZ, the meteorological parameters were monitored, and the dust samples were collected at ten levels (1, 2, 5, 8, 16, 24, 32, 47, 63, and 80 m).
In XT, the meteorological parameters were monitored, and the dust samples were collected at ten levels (1, 2, 5, 10, 24, 32, 47, 63, 80, and 100 m).
The BSNE sand collectors that conform to international standards were adopted to measure the horizontal dust transport flux. The volume, appearance, and sand inlet size of these BSNE sand collectors were designed in accordance with international standards, and the sand inlet was 2 cm wide and 5 cm high. At the beginning of the experiment, professionals were hired to inspect the BSNE sand collection systems installed at different height levels and clean the sand collectors. On the day after each dust storm, the professionals retrieved the dust aerosol samples collected at different levels, placed the samples in sealed bags, and cleaned the sand collectors when the wind speed was less than 5 m/s (to ensure personnel safety). In the measure step,in order to reduce the error, we first measured and recorded the weight of the sealable bags. Then the samples were weighed at the TZ and XT observation stations to avoid weighing errors caused by the wear and tear of sample bags during the transportation and ensure data accuracy (The sampling staff was qualified to work at the required heights).
In general, the dust samples can be approximated as uniform particles (Such as sand and dust particles), and their grain size can be measured using the dry method for convenience. However, the content of the dust samples collected using the gradient BSNE collection system was small. Therefore, the wet method was employed for the subsequent particle size tests in the laboratory to ensure measurement accuracy. The differences between the dry and wet methods were compared in a previous study (Huo et al., 2016), and the error range of the results was found to be minimal.
Initially, our research team focused on the ground surface (e.g., Yang et al., 2011; 2012; 2013; 2015), while Dong et al. (2010) had measured the flux of dust sediments in the near-surface layer in 2010. Huo et al. (2016) conducted a study on the characteristics of near-surface dust flux in the Taklimakan Desert. The sediment fluxes of ten dust storm events during the study period have been reported, and detailed information on the proportions of grain-size components comprising these fluxes has been provided. In this section, the variations in horizontal dust flux for all dust storm processes in TZ and XT during the observational experiment are presented.
Figure 3 demonstrates the variations in horizontal dust flux with height for eleven dust storm events in XT and eight dust storm events in TZ. First, the Q value in XT gradually decreased with height, reflecting a power function; this feature was shared by the eleven dust storm processes. Second, the Q value variation in TZ differed from that in XT as described below. The Q value decreased with height at the level of two to eight m; Q increased with height in the range of 8–48 m; the horizontal dust flux Q did not exhibit a significant variation trend with height at the level of 48–60 m. The eight dust storm processes displayed these three characteristics.
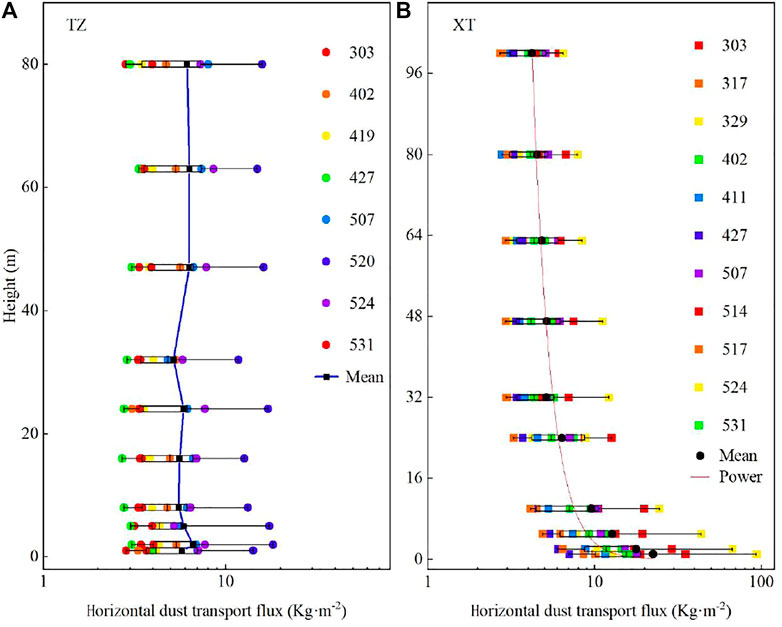
FIGURE 3. Horizontal dust fluxes varying with height in (A) XT and (B) TZ (The legends indicate the dates of the dust storms).
It should be noted that among the samples of all dust storms, five processes were widespread dust storms triggered by the same weather processes, and they occurred on March 3, April 2, April 27, May 24, and May 31 (as shown in Figure 3), which increases the comparability of the two observation sites.
As shown in Figure 4, the eight dust storm processes in 2018 were compared with the ten processes in 2016 in TZ. These two sets of dust storm processes had almost the same characteristics, except that the near-surface (one to eight m) observations were absent for the 2016 events. The data of XT in 2018 shows a good power function fitting relationship, with a coefficient of determination (R2) as high as 0.9434. Therefore, the differences in the dust storm processes characterised by the variations in horizontal dust flux Q with height between XT and TZ in the Taklimakan Desert are of particular interest.
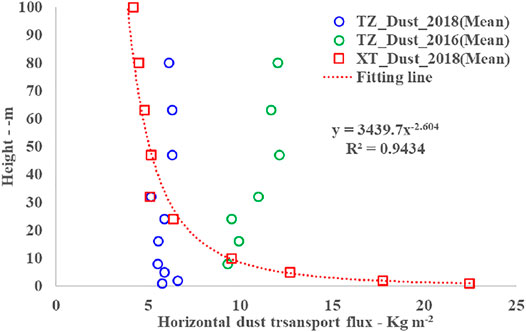
FIGURE 4. Comparison of the variations in horizontal dust flux with height in 2016 and 2018.
The factors that influence the variation in horizontal dust flux during a dust storm include the physical properties of the underlying surface (grain-size components of the sand source) and the dynamic condition (wind speed). Thus, we opted to focus on these two critical factors. The three-dimensional variation patterns for the average median particle diameter and mean horizontal dust flux with height during multiple dust storms in XT and TZ are presented in Figure 5. First, in XT, the median particle diameter decreased with height, from 81 μm at 1 m to 53 μm at 100 m, and this trend was similar to the variation trend observed by Dong et al. (2010) in the flat sandy land in Minqin. Second, the median particle diameter at 1 m above ground was 82 μm in TZ and 81 μm in XT, indicating similar physical properties of their dust sources, consistent with the results of Huo et al., 2011. Third, no significant variation in the median particle diameter with height was found in TZ, with only minor fluctuations (74–82 μm) in the entire vertical profile of d (0.5). d (0.5) means the corresponding particle size when the cumulative particle size distribution percentage of the sample reaches 50% (Huo et al., 2016). Evidently, the horizontal dust flux is influenced by horizontally moving dust particles. Further, greater dynamic support is required to transport the coarser and heavier dust grains as the height and particle weight increase.
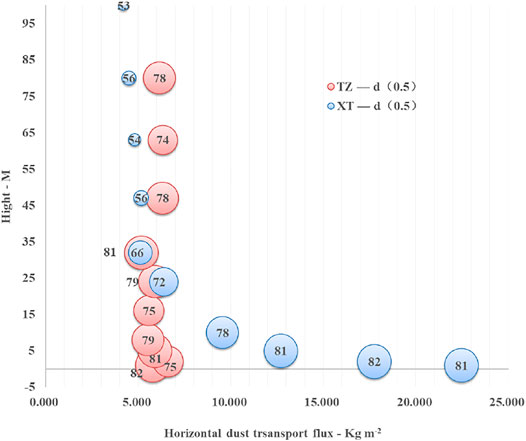
FIGURE 5. Three-dimensional diagram of the average median particle diameter and mean horizontal dust flux varying with height in XT and TZ (the values in the spheres represent the d (0.5) median particle diameters).
As shown in Figure 5, the average median particle diameter d (0.5) of multiple dust storm processes in XT and TZ was extremely close. Thus, the dust sources of the samples collected during the dust storms can be concluded to be the same. Combined with the laboratory-determined particle size of the dust storm samples from a sequence of height levels, the coarse and fine-grained components of the dust samples were further investigated to obtain the percentages of the particles with a diameter less than 1, 2.5, 10, 20, 50, and 100 μm in the samples, respectively. Thereafter, the Q values of the particle size ranges can be calculated. Four additional large-scale dust storm processes that affected both TZ and XT were included to perform a thorough analysis (Figures 6, 7). Warm colour spheres were used to represent the data for TZ, while cold colour spheres represented the data for XT to enable easy distinction of the results. It can be seen from Figures 6, 7 that the cold colour spheres were larger than the warm colour spheres in each of the particle size ranges (i.e., <1 μm, <2.5 μm, <10 μm, <20 μm, <50 μm, and <100 μm). Such findings indicate that the Q value obtained for each particle size range in XT is greater than that in TZ. Moreover, the vertical profile of the Q value for the particle size range close to d (0.5) (i.e., <100 μm) was consistent with the average results shown in Figures 3, 4, indicating relatively stable accumulation of the coarse particles with height. Coarse particle is the main factor controlling the variation in Q value with height. The distribution of the fine particles is highly random, and the contribution of the fine particles to the variation trend of the Q value is minimal.
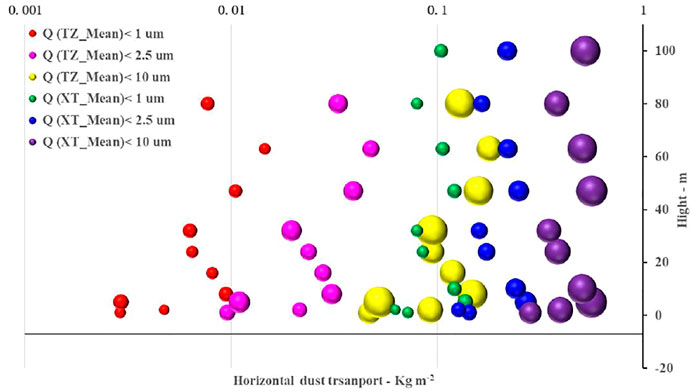
FIGURE 6. Three-dimensional diagram of the mean horizontal dust fluxes (<1 μm, <2.5 μm, and <10 μm) varying with height in XT and TZ (the size of the spheres represents the magnitude of Q).
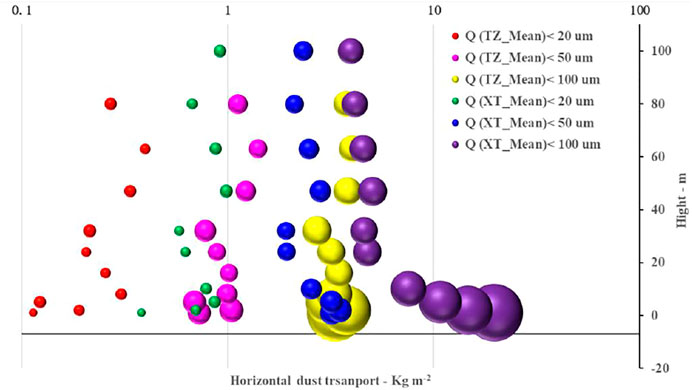
FIGURE 7. Three-dimensional diagram of the mean horizontal dust fluxes (<20 μm, <50 μm, and <100 μm) varying with height in XT and TZ (the size of the spheres represents the magnitude of Q).
The curve in Figure 8 (Huo et al., 2016) has a very similar pattern to the fitted curve for the wind speed across the flux tower. Following a logarithmic profile that is normally expected for the atmospheric boundary layer, the wind speed exhibits a remarkable increase with height in the lower part of the surface boundary but does not display significant vertical variations at the upper levels. This pattern reflects the nature of a well-mixed middle and upper boundary layer. Accordingly, the average sediment fluxes share the same property as the wind speed, revealing the nature of wind-driven sand-dust transport during dust storms. As shown in Figure 9, the maximum wind speed values at the two observation sites (XT and TZ) during four dust storms were selected to explore the variation in the maximum wind speed with height. First, the maximum wind speed increased with height at the two observation sites, which was consistent with the pattern of the universal wind profile. Second, the maximum wind speed values in XT were evidently higher than those in TZ during the four typical dust storm processes. Such findings indicate XT had better wind dynamic conditions than TZ during the dust storms and the dust particles had greater dynamic support in XT than in TZ. Such finding also explains the greater Q value of each customised particle size range in XT than in TZ, as demonstrated in the previous section.
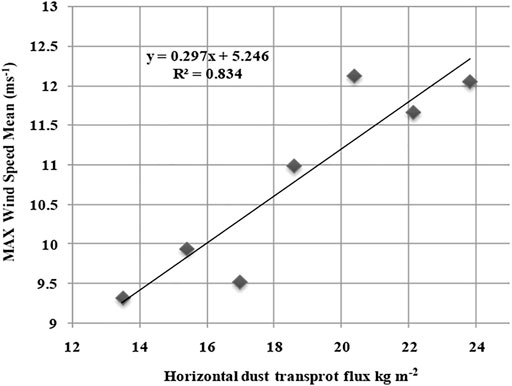
FIGURE 8. Scatter diagram of the average maximum wind speed across the seven levels versus the horizontal dust transport flux (kg m−2) (Huo et al., 2016) Figure 8 cites the results of 2016, from the 10 dust storm processes in TZ, with both Q and maximum wind speed taken as an average of the 7-level observed heights of the 10 dust storm processes. The wind speeds during the four dust processes are used for comparative analysis in Figure 9. These four processes are systemic weather-induced dust storms, and the dust storms occur at the same time period at XT station and TZ station, so they are more representative.
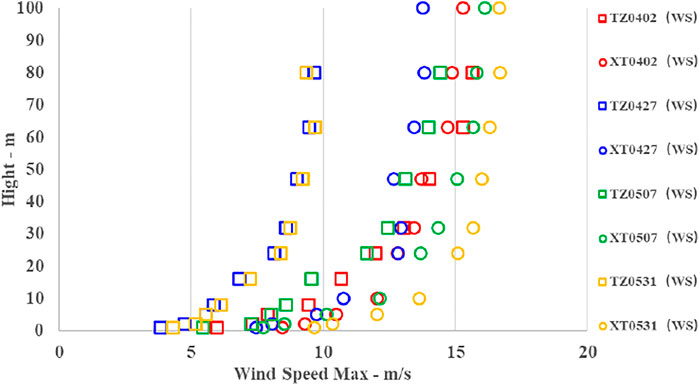
FIGURE 9. Variation in the maximum wind speed with height during four typical dust storm processes in XT and TZ.
(The number after legend represent the date of dust storm. For example, TZ0402 represents the dust storm in TZ station on April 2. XT0402 represents the dust storm in XT station on April 2.)
The Taklimakan Desert is one of the critical sand source regions for the upstream weather zones in China. However, the lack of a clear and systematic understanding of the dust transport conditions in the Taklamakan Desert due to scarce observation data has limited the localisation and effective application of numerical simulation of dust storms in this region. Further, owing to a lack of consideration and understanding of the topographic relief in the desert, the differences in dust transport parameters under terrain undulations are ignored, resulting in uncertainties regarding the dust transport parameters. Thus, the horizontal and vertical transport of dust particles during dust storm events must be quantified. During dust storms under natural conditions in the Taklimakan Desert, the horizontal dust flux decreases with height in XT; however, no significant change occurs with height in TZ. Notably, our observations in XT are highly consistent with those of Dong et al. (2010). The most remarkable feature leading to this commonality between the two studies is the flat sandy land employed as the observation area by Dong et al. (2010). This area has a topography similar to that of XT at the northern edge of the Taklamakan Desert (Figure 1). The main factors controlling the variation in Q include the wind dynamics W, surface sand source (material basis) M, and topography of the observation environment E. The M of XT was equivalent to that of TZ. The W of XT was greater than that of TZ; however, the variation trend of W with height in XT and TZ was consistent. The larger W value in XT leads to an increased proportion of coarse particles in the dust storm processes. However, as shown in Figure 6, the d (0.5) value in XT decreases with height during multiple dust storms, and the d (0.5) value in TZ stabilises in the range, 74–82 μm. Meanwhile, the Q value in TZ increases with height at 8–48 m, and Q does not show significant variation with height at 48–60 m. The reasons for these contradictory phenomena may be related to E. Huo et al. (2016) pointed out that grain size actually increases in the lower surface layer between 8 and 24 m, decreases in the middle levels, and slightly increases at the top of the tower. This pattern is partly caused by the wind-driven sand-dust transport from the nearby natural dunes. This process is called the “secondary sand source” to illustrate the sand-dust transport process during dust storms in the desert where large dunes and valleys exist. The previous work lacks comparability; however, in this study, combined with the observation results in XT, the observation results in TZ is caused by “secondary sand source” is consistant with the results in 2016. (Figures 10, 11). Yang et al., 2015 pointed out that at the top of the dune Q all showed a significant decreasing trend with height; therefore, assuming that the tall tower is located at the top of the dune, the variation of Q with height may be similar to the results of our study in XT. Because, firstly, from the TZ (50–80 m) observations, there is a slight Q decreasing with height. Secondly, if the top of the dune is considered as a flat surface, the variation of Q will no longer be influenced by the “secondary sand source”. On the contrary, if the tower is at the edge of the dune, Q below the dune height may still appear as a uniform mode, and Q above the dune height will be influenced by the “secondary sand source”. In the numerical model calculation of dust storms, Q is an important parameter, and the vertical dust flux F is also calculated based on Q. We use tower observations, unlike the observations of Q near the ground or in ideal flat sand (Yang et al., 2011; 2013), to break away from localities. Therefore, our results can provide a new basis and reference for the calculation of parameterization in the model.
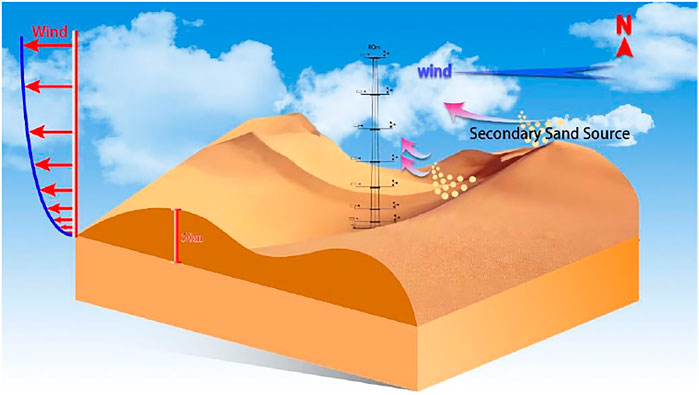
FIGURE 10. Conceptual diagram of dust transport from multiple sand sources during a dust storm in TZ.
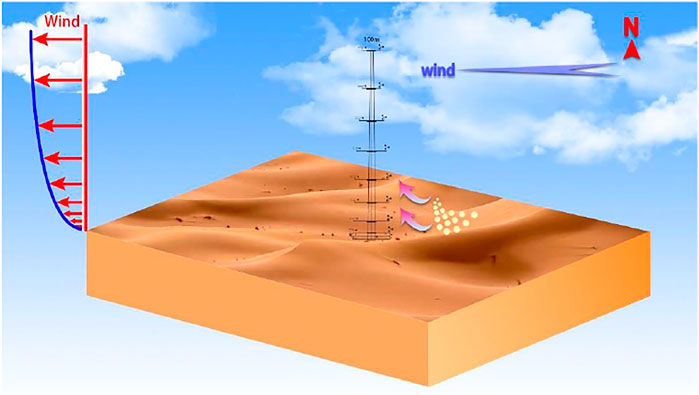
FIGURE 11. Conceptual diagram of dust transport from multiple sand sources during a dust storm in XT.
Of note, dust particles at the top of the dunes are coarser than at the bottom of the dunes owing to long-term sorting (Lin et al., 2021; 2022). Due to the presence of the secondary sand source, more coarse particles are easily collected, which affects the variation in Q with height in TZ. The environmental factor E of undulating dunes is also a decisive element influencing the transport of dust particles. Secondary sand source leads to an increase in <20 μm fine particles, and we calculated the mean Q values for multiple sandstorm samples <20 μm for TZ and XT above 80 m height, TZ: 0.015 kg m−2 and XT: 0.080: kg m−2. It is clear that XT is larger than TZ in the fine particle collection, so the topographic undulating conditions may affect the long-distance transmission of fine particles. This may also affect the internal cycle in the Taklamakan Desert and its surrounding areas, the effect of which on the long-range transport of sand fine particles needs to be corroborated by a combination of large-scale experiments and numerical models.
At present, the parameterisation schemes of dust emission mainly consider the effects of wind speed, dust particle size, surface roughness length, soil moisture, and vegetation cover. Topographic relief is also one of the important factors affecting dust emission. However, the underlying surface is assumed to be a flat desert surface in the current parameterisation schemes of dust emission, and the impacts of an undulating underlying surface in a desert on the dust emission flux are ignored, leading to considerable uncertainty in the simulation results of these parameterisation schemes for the Taklimakan Desert (Marticorena and Bergametti, 1995; Shao et al., 1996; Shao et al., 2004; Shao et al., 2010; Lu and Shao, 1999; Ginoux et al., 2001; Shen et al., 2003; Klose and Shao, 2012; 2013). Therefore, this study provides a good experimental basis and data support for the localisation improvement of the parameterisation schemes of dust emission, the accurate assessment of the regional and global contribution of local sand emission, and the development of dust storm forecasting.
The scarcity of observations in dust source areas constrains the development of dust storm models. However, we have made great efforts to record valuable observation data in environments with extremely harsh dust storms. Although the collected samples are not large enough, this task has been ongoing since 2016, and will continue. We wish to provide a good prospect for future experiments and observations and anticipate the performance of similar experiments in other deserts or dust source regions. In addition, we are delighted to share our observation data and analysis results for collaborative research on dust storm monitoring and modelling.
The variation in the horizontal dust flux with height during dust storms at the XT station at the edge of the desert was found to fit a power function. At the TZ station located at the centre of the desert, the Q value was found to increase with height at 8–48 m; however, no significant gradient change in the horizontal dust flux Q was found between 48 and 60 m. Such different distribution patterns are caused by the secondary sand source derived from the tall dunes nearby.
The median particle diameter of the dust lifted from the ground was essentially the same between XT and TZ during large-scale dust storms. The vertical distribution of wind speed at the two observation sites conforms to the typical patterns of wind speed varying with height; however, the maximum wind speed in XT was greater than that in TZ, resulting in a larger Q value for each particle size range in XT than in TZ. The Q values for the particle size ranges of <1 μm, <2.5 μm, <10 μm, <20 μm, <50 μm, and <100 μm, were provided herein. This information is crucial for evaluating the long-range transport of dust aerosols and their impacts on weather and climate (Shao, 2004; Alpert et al., 2006; Gong et al., 2006; Yue et al., 2010; Ghan et al., 2012; Kim et al., 2013; Feng et al., 2015; Yang et al., 2015).
Coarse particle is the main factor controlling the variation trend of Q in the vertical direction. Further, the effect of fine particles is relatively minor. The trend of coarse particles with height (as in Figure 7) is similar to the total trend (as in Figure 5), for example, for particles <100 μm, and in addition, fine particles <20 μm will be more involved in long-distance transmission. Therefore, the contribution of fine particles to the change trend is relatively small. The observation results in TZ show that the dust samples collected at observation levels with the same height as the nearby dunes were derived from multiple sand sources and contained large proportion of coarse grains, which reflects the real variation pattern of the horizontal dust flux Q under natural conditions in the desert centre. Compared with the ideal flat sand or 2 m observations close to the ground, our observations using high tower can truly and objectively reflect the transmission pattern of Q under undulating terrain conditions of dune, which can improve the calculation of Q in sandstorm forecasting models, especially in important dust source areas.
The data that support the findings of this study are available from the authors upon reasonable request.
WH: Conceptualization, Writing-original draft, Data analysis. FY: Writing-review and editing, Validation, Investigation. YW: Funding acquisition, Scientific tests, Advice. XFZ: Methodology, Advice. Meiqi Song: Conceptualization; Writing-Reviewing and Editing. Chenglong Zhou: Scientific tests, Data Curation. Xinghua Yang:Scientific tests, Data Curation. AMM: Scientific tests, Advice. QH:Scientific tests, Data Curation. CW:Scientific tests, Data Curation. JCG:Scientific tests, Data Curation. LM:Scientific tests, Data Curation. SH: Writing-review and editing, Validation, Investigation.
This research was funded by the Xinjiang Natural Science Funds of China (2021D01A197), National Natural Science Foundation of China (41905009, 42030612, and 41875023), and Strategic Priority Research Program of the Chinese Academy of Sciences (XDA20100306).
The authors declare that the research was conducted in the absence of any commercial or financial relationships that could be construed as a potential conflict of interest.
All claims expressed in this article are solely those of the authors and do not necessarily represent those of their affiliated organizations, or those of the publisher, the editors and the reviewers. Any product that may be evaluated in this article, or claim that may be made by its manufacturer, is not guaranteed or endorsed by the publisher.
We thank everyone who participated in the experiment and all members of the desert meteorological boundary layer research team for their support.
Alpert, P., Barkan, J., and Kishcha, P. (2006). A Potential Climatic Index for Total Saharan Dust: the Sun Insolation. J. Geophys. Res. 111, D01103-1–D01103-8. doi:10.1029/2005JD006105
Che, H., Zhang, X., Li, Y., Mei, F., and Shi, G. (2005). Calculations of Dust Emission Flux in Northern Deserts of China by DPM Model. J. Arid Land Resour. Environ., 19-45. doi:10.3969/j.issn.1003-7578.2005.05.012
Chen, S., Huang, J., Li, J., Jia, R., Jiang, N., Kang, L., et al. (2017). Comparison of Dust Emissions, Transport, and Deposition between the Taklimakan Desert and Gobi Desert from 2007 to 2011. Sci. China Earth Sci. 60, 1338–1355. doi:10.1007/s11430-016-9051-0
Chen, Y., Sheen, P., Chen, E., Liu, Y., Wu, T., and Yang, C. (2004). Effects of Asian Dust Storm Events on Daily Mortality in Taipei, Taiwan. Environ. Res. 95, 151–155. doi:10.1016/j.envres.2003.08.008
Coakley, J., Cess, J., and Yurevich, F. (1983). The Effect of Tropospheric Aerosols on the Earth’s Radiation Budget: a Parameterization for Climate Models. J. Atmos. Sci. 40, 116-138. doi:10.1175/1520-0469(1983)040<0116:teotao>2.0.co;2
Dong, Z., Man, D., Luo, W., Qian, G., Wang, J., Zhao, M., et al. (2010). Horizontal Aeolian Sediment Flux in the Minqin Area, a Major Source of Chinese Dust Storms. Geomorphology 116, 58-66. doi:10.1016/j.geomorph.2009.10.008
Feng, Q., Cui, S., and Zhao, W. (2015). Effect of Particle Shape on Dust Shortwave Direct Radiative Forcing Calculations Based on MODIS Observations for a Case Study. Adv. Atmos. Sci. 32, 1266-1276. doi:10.1007/s00376-015-4235-3
Gautam, R., Hsu, N., and Lau, K. (2010). Premonsoon Aerosol Characterization and Radiative Effects over the Indo-Gangetic Plains: Implications for Regional Climate Warming. J. Geophys. Res. 115, D17208-1–D17208-15. doi:10.1029/2010jd013819
Genthon, C. (1992). Simulations of Desert Dust and Sea-Salt Aerosols in Antarctica with a General Circulation Model of the Atmosphere. Tellus B Chem. Phys. Meteorology 44, 371-389. doi:10.3402/tellusb.v44i4.15464
Ghan, S., Liu, X., Easter, R., Zaveri, R., Rasch, P., Yoon, J., et al. (2012). Toward a Minimal Representation of Aerosols in Climate Models: Comparative Decomposition of Aerosol Direct, Semidirect, and Indirect Radiative Forcing. J. Clim. 25, 6461-6476. doi:10.1175/jcli-d-11-00650.1
Ginoux, P., Chin, M., Tegen, I., Prospero, J., Holben, B., Dubovik, O., et al. (2001). Sources and Distributions of Dust Aerosols Simulated with the GOCART Model. J. Geophys. Res. 106, 20255‐20273. doi:10.1029/2000jd000053
Gong, D., Mao, R., and Fan, Y. (2006). East Asian Dust Storm and Weather Disturbance: Possible Links to the Arctic Oscillation. Int. J. Climatol. 26, 1379‐1396. doi:10.1002/joc.1324
Gong, S. L., Zhang, X. Y., Zhao, T. L., Mckendry, I. G., Jaffe, D. A., and Lu, N. M. (2003). Characterization of Soil Dust Aerosol in China and its Transport and Distribution during 2001 ACE-Asia: 2. Model Simulation and Validation. J. Geophys. Res. 108, ACH 4-1‐ACH 4-19. doi:10.1029/2002JD002633
He, Q., and Zhao, J. (1997). The Studies on the Distribution of Floating Dusts in the Tarim Basin and its Effects on Environment. J. Desert Res. 17, 119‐126.
Hu, Z., Huang, J., Zhao, C., Ma, Y., Jin, Q., Qian, Y., et al. (2019). Trans-Pacific Transport and Evolution of Aerosols: Analysis of Characteristics and Source Contributions. Atmos. Chem. Phys. 19 (19), 12709–12730. doi:10.5194/acp-19-12709-2019
Huang, J., Fu, Q., Su, J., Tang, Q., Minnis, P., Hu, Y., et al. (2009). Taklimakan Dust Aerosol Radiative Heating Derived from CALIPSO Observations Using the Fu-Liou Radiation Model with CERES Constraints. Atmos. Chem. Phys. 9, 4011‐4021. doi:10.5194/acp-9-4011-2009
Huang, N., and Zheng, X. (2006). The Numerical Simulation of the Evolution Process of Wind-Blown Sand Saltation and Effects of Electrostatical Force. Chin. J. Theor. Appl. Mech., 38, 145‐152. doi:10.3321/j.issn:0459-1879.2006.02.001
Huo, W., He, Q., Yang, F., Yang, X., Yang, Q., Zhang, F., et al. (2016). Observed Particle Sizes and Fluxes of Aeolian Sediment in the Near Surface Layer during Sand-Dust Storms in the Taklimakan Desert. Theor. Appl. Climatol. 130, 735–746. doi:10.1007/s00704-016-1917-4
Huo, W., He, Q., Yang, X., Liu, X., Ding, G., and Cheng, Y. (2011). The Research on Grain Size Characteristic of Desert in North of China. Res. Soil Water Conservation 18, 6-11.
Iwasaka, Y., Minoura, H., and Nagaya, K. (1983). The Transport and Spatial Scale of Asian Dust-Storm Clouds: a Case Study of the Dust-Storm Event of April 1979. Tellus B Chem. Phys. Meteorology 35, 189-196. doi:10.1111/j.1600-0889.1983.tb00023.x
Kim, D., Chin, M., Bian, H., Tan, Q., Brown, M., Zheng, T., et al. (2013). The Effect of the Dynamic Surface Bareness on Dust Source Function, Emission, and Distribution. J. Geophys. Res. 118, 871‐886. doi:10.1029/2012JD017907
Klose, M., and Shao, Y. (2013). Large-eddy Simulation of Turbulent Dust Emission. Aeolian Res. 8, 49‐58. doi:10.1016/j.aeolia.2012.10.010
Klose, M., and Shao, Y. (2012). Stochastic Parameterization of Dust Emission and Applicationto Convective Atmospheric Conditions. Atmos. Chem. Phys. 12, 7309‐7320. doi:10.5194/acp-12-7309-2012
Lei, H., Lin, C., and Sun, J. (2005). An Improved Dust Storm Prediction System and its Simulation Experiments. Clim. Environ. Res., 10, 669‐683. doi:10.3878/j.issn.1006-9585.2005.03.33
Lin, Y., Mu, G., Chen, L., Wu, C., and Xu, L. (2022). Sorting Characteristics and its Implication of the Grain Size of Modern Atmospheric Dust Deposition Near the Surface of the Cele Oasis, Xinjiang, China. J. Desert Res. 42, 139-146. doi:10.7522/j.issn.1000-694X.2021.00140
Lin, Y., Mu, G., Xu, L., and Chen, L. (2021). Spatial Differentiation Characteristics of Aeolian Deposit Grain Size at the Oasis Scale. J. Arid Land Resour. Environ. 35, 149-154. doi:10.13448/j.cnki.jalre.2021.282
Liu, Y., Zuo, T., Jia, R., Xie, Y., Huang, J., and Zhong, D. (2015). “Simulation Study on Optical Characteristics and Transport Process of Summer Sand Dust and Man-Made Aerosol in Qinghai Xizang Plateau,” in The 32nd annual meeting of China Meteorological Society S9 atmospheric composition and weather and climate change China Meteorological Society, 61-62.
Lu, H., and Shao, Y. (1999). A New Model for Dust Emission by Saltation Bombardment. J. Geophys. Res. 104, 16827‐16842. doi:10.1029/1999JD900169
Marticorena, B., and Bergametti, G. (1995). Modeling the Atmospheric Dust Cycle: 1. Design of a Soild-Erived Dust Emission Scheme. J. Geophys. Res. 100, 16415‐16430. doi:10.1029/95JD00690
Ma, Y., Wang, X., and Kang, F. (2007). Intensity Variation of Influence Factors on Floating Dust in the Tarim Basin. Acta Sci. Nat. Univ. Pekin. 43, 375‐382. doi:10.13209/j.0479-8023.2007.06210.1358/dot.2007.43.10.1148059
Meng, L., Yang, X., Zhao, T., He, Q., Lu, H., Ali, M., et al. (2019). Modeling Study on Three-Dimensional Distribution of Dust Aerosols during a Dust Storm over the Tarim Basin, Northwest China. Atmos. Res. 218, 285‐295. doi:10.1016/j.atmosres.2018.12.006
Murayama, T., Sugimoto, N., Uno, I., Kinoshita, K., Aoki, K., Hagiwara, N., et al. (2001). Ground‐based Network Observation of Asian Dust Events of April 1998 in East Asia. J. Geophys. Res. 106, 18345‐18359. doi:10.1029/2000JD900554
Nan, Y., and Wang, Y. (2018). De-coupling Interannual Variations of Vertical Dust Extinction over the Taklimakan Desert during 2007-2016 Using CALIOP. Sci. Total Environ., 633, 608‐617. doi:10.1016/j.scitotenv.2018.03.125
Nickovic, S., and Dobricic, S. (1996). A Model for Long-Range Transport of Desert Dust. Mon. Weather Rev. 124, 2537‐2544. doi:10.1175/1520-0493(1996)124<2537:AMFLRT>2.0.CO;2
Park, S., and In, H. (2003). Parameterization of Dust Emission for the Simulation of the Yellow Sand (Asian Dust) Event Observed in March 2002 in Korea. J. Geophys. Res. 108, ACH 9-1‐ACH 9-21. doi:10.1029/2003JD003484
Prospero, J., Collard, F., Molinie, J., and Jeannot, A. (2014). Characterizing the Annual Cycle of African Dust Transport to the Caribbean Basin and South America and its Impact on the Environment and Air Quality. Glob. Biogeochem. Cycles 28, 757‐773. doi:10.1002/2013GB004802
Ramanathan, V., Crutzen, P., Kiehl, J., and Rosenfeld, D. (2001). Aerosols, Climate and the Hydrological Cycle. Science 294, 2119‐2124. doi:10.1126/science.1064034
Shao, Y. (2004). Simplification of a Dust Emission Scheme and Comparison Withdata. J. Geophys. Res. 109, D10202-1‐D10202-6. doi:10.1029/2003JD004372
Shao, Y., Fink, A., and Klose, M. (2010). Numerical Simulation of a Continental-Scale Saharan Dust Event. J. Geophys. Res. 115, D13205-1‐D13205-19. doi:10.1029/2009JD012678
Shao, Y., Raupach, M., and Leys, J. (1996). A Model for Predicting Aeolian Sand and Drift and Dust Entrainment on Scales from Paddock to Region. Austrain J. Soil Res. 34, 309‐342. doi:10.1071/SR9960309
Shen, Y., Shen, Z., Du, M., and Wang, W. (2003). Variational Characteristics of Some Parameters and Factors during Dusty Weather in Spring of Dunhuang. Plateau Meteorol. 22, 378‐384.
Sokolik, I., and Toon, O. (1996). Direct Radiative Forcing by Anthropogenic Airborne Mineral Aerosols. Nature 381, 681‐683. doi:10.1038/381681a0
Spyrou, C., Kallos, G., Mitsakou, C., Athanasiadis, P., Kalogeri, C., and Iacono, M. (2013). Modeling the Radiative Effects of Desert Dust on Weather and Regional Climate. Atmos. Chem. Phys. 13, 5489‐5504. doi:10.5194/acp-13-5489-2013
Sun, D., An, Z., Su, R., Lu, H., and Sun, Y. (2003). Wind Dust Deposition Records of the Evolution of Monsoon Circulation and Westerly Circulation in Northern China in Recent 2.6 Ma. Sci. China (Series D), 33, 494–504. doi:10.3321/j.issn:1006-9267.2003.06.001
Tegen, I., Harrison, S., Kohfeld, K., Prentice, I., Coe, M., and Heimann, M. (2002). Impact of Vegetation and Preferential Source Areas on Global Dust Aerosol: Results from a Model Study. J. Geophys. Res. 107, AAC 14-1‐AAC 14-27. doi:10.1029/2001JD000963
Tratt, D., Frouin, R., and Westphal, D. (2001). April 1998 Asian Dust Event: A Southern California Perspective. J. Geophys. Res. 106, 18371‐18379. doi:10.1029/2000JD900758
Viana, M., Querol, X., Alastuey, A., Cuevas, E., and Rodriguez, S. (2002). Influence of African Dust on the Levels of Atmospheric Particulates in the Canary Islands Air Quality Network. Atmos. Environ. 36, 5861‐5875. doi:10.1016/S1352-2310(02)00463-6
Wang, S., Wang, J., Zhou, Z., Shang, K., Yang, D., and Zhao, Z. (2003). Regional Characteristics of Dust Events in China. Acta Geogr. Sin. 58, 193‐200. doi:10.11821/xb20030200510.1007/bf02873145
Wang, S., Wang, J., Zhou, Z., and Shang, K. (2005). Regional Characteristics of Three Kinds of Dust Storm Events in China. Atmos. Environ. 39, 509–520. doi:10.1016/j.atmosenv.2004.09.033
Xuan, J., Liu, G., and Du, K. (2000). Dust Emission Inventory in Northern China. Atmos. Environ. 34, 4565‐4570. doi:10.1016/S1352-2310(00)00203-X
Xu, X., Zhao, T., Lu, C., and Shi, X. (2014). Characteristics of the Water Cycle in the Atmosphere over the Tibetan Plateau. Acta Meteorol. Sin., 72, 1079–1095. doi:10.11676/qxxb2014.091
Yang, H., Xiao, H., and Guo, C. (2015). Impacts of Two Ice Parameterization Schemes on the Cloud Microphysical Processes and Precipitation of a Severe Storm in Northern China. Atmos. Ocean. Sci. Lett. 8, 301–307. doi:10.3878/AOSL20150023
Yang, X., He, Q., Ali, M., Huo, W., and Liu, X. (2013). Near-surface Sand-Dust Horizontal Flux in Tazhong-The Hinterland of the Taklimakan Desert. J. Arid Land 5, 199–206. doi:10.1007/s40333-013-0159-x
Yang, X., He, Q., Ali, M., Huo, W., Liu, X., and Strake, M. (2012). A Field Experiment on Dust Emission by Wind Erosion in the Taklimakan Desert. J. Meteorological Res. 26. 241–249. doi:10.1007/s-13351-012-0209-x10.1007/s13351-012-0209-x
Yang, X., Shen, S., Yang, F., He, Q., Ali, M., Huo, W., et al. (2015). Spatial and Temporal Variations of Blowing Dust Events in the Taklimakan Desert. Theor. Appl. Climatol. 125, 669‐677. doi:10.1007/s00704-015-1537-4
Yang, X., Xu, X., He, Q., Ali, M., Yu, B., and Tang, S. (2011). Sand Flux Estimation during a Sand-Dust Storm at Tazhong Area of Taklimakan Desert, China. J. Arid Land 3, 199‐205. doi:10.3724/SP.J.1227.2011.00199
Yue, P., Niu, S., and Liu, X. (2008). Dust Emission and Transmission during Spring Sand-Dust Storm in Hunshandake Sand-Land. J. Desert Res., 28, 227‐230.
Yue, X., Wang, H., Liao, H., and Fan, K. (2010). Direct Climatic Effect of Dust Aerosol in the NCAR Community Atmosphere Model Version 3 (CAM3). Adv. Atmos. Sci. 27, 230‐242. doi:10.1007/s00376-009-8170-z
Zhang, J., Zhao, M., Fang, E., Zhan, K., Yang, Z., Zhang, Y., et al. (2009). Seasonal Variations of Sandstorm-Aerosol Concentration Near the Ground Surface Around Minqin. Acta Sci. Circumstantiae, 29, 496‐504. doi:10.13671/j.hjkxxb.2009.03.009
Zhang, K., Qu, J., Zu, R., and Fang, H. (2005). Environmental Characteristics of Sandstorm in Minqin Oasis in China for Recent 50 Years. J. Environ. Sci. 17, 857‐860. doi:10.2190/ES.31.4.E
Zhang, Q., and Wang, S. (2008). A Study on Atmospheric Boundary Layer Structure on a Clear Day in the Arid Region in Northwest China. Acta Meteorol. Sin., 66, 599‐608. doi:10.3321/j.issn:0577-6619.2008.04.013
Zhang, X. (2007). Review on Sources and Transport of Loess Materials on the Chinese Loess Plateau. Quat. Sci., 27, 181‐186. doi:10.3321/j.issn:1001-7410.2007.02.003
Zhao, M., Zhan, K., Yang, Z., and Fang, E. (2011). Characteristics of the Lower Layer of Sandstorms in the Minqin Desert-Oasis Zone. Sci. China Earth Sci. 54. 703–710. doi:10.1007/s11430-010-4104-y
Zhou, X., Xu, X., Yan, P., Weng, Y., and Wang, J. (2002). Dynamic Characteristics of Dust Storm in Spring of 2000. Sci. China (Series D) 32, 327‐334. doi:10.3321/j.issn:1006-9267.2002.04.008
Zhou, X., Zhang, L., Guo, Q., Yi, N., Tian, P., and Chen, L. (2017). Numerical Simulation of a Strong Dust Storm and the Spatial-Temporal Distribution of PM10 Concentration. China Environ. Sci. 37, 1-12. doi:10.3969/j.issn.1000-6923.2017.01.001
Keywords: dust storm, Taklimakan desert, sediment grain sizes, vertical profiles, horizontal dust flux
Citation: Huo W, Yang F, Wu Y, Zhi X, Song M, Zhou C, Yang X, MamtiMin A, He Q, Wen C, Gao J, Meng L and Hu S (2022) Influence of Topographic Relief on Sand Transport in the Near-Surface Layer During Dust Storms in the Taklimakan Desert. Front. Environ. Sci. 10:931529. doi: 10.3389/fenvs.2022.931529
Received: 29 April 2022; Accepted: 17 May 2022;
Published: 29 June 2022.
Edited by:
Chen Siyu, Lanzhou University, ChinaReviewed by:
Jean-Baptiste Renard, UMR7328 Laboratoire de physique et chimie de l’environnement et de l'Espace (LPC2E), FranceCopyright © 2022 Huo, Yang, Wu, Zhi, Song, Zhou, Yang, MamtiMin, He, Wen, Gao, Meng and Hu. This is an open-access article distributed under the terms of the Creative Commons Attribution License (CC BY). The use, distribution or reproduction in other forums is permitted, provided the original author(s) and the copyright owner(s) are credited and that the original publication in this journal is cited, in accordance with accepted academic practice. No use, distribution or reproduction is permitted which does not comply with these terms.
*Correspondence: Fan Yang, eWFuZ2ZhbjMwOUB5ZWFoLm5ldA==; MeiQi Song, c29uZ21xQGlkbS5jbg==; Shunqi Hu, aHVzaHVucWkyMTVAMTYzLmNvbQ==
Disclaimer: All claims expressed in this article are solely those of the authors and do not necessarily represent those of their affiliated organizations, or those of the publisher, the editors and the reviewers. Any product that may be evaluated in this article or claim that may be made by its manufacturer is not guaranteed or endorsed by the publisher.
Research integrity at Frontiers
Learn more about the work of our research integrity team to safeguard the quality of each article we publish.