 Yiwei Zhen
 Shuguang Liu1,2,3*
 Zhengzheng Zhou
94% of researchers rate our articles as excellent or good
Learn more about the work of our research integrity team to safeguard the quality of each article we publish.
Find out more
ORIGINAL RESEARCH article
Front. Environ. Sci., 15 June 2022
Sec. Water and Wastewater Management
Volume 10 - 2022 | https://doi.org/10.3389/fenvs.2022.931029
This article is part of the Research TopicInterconnected River-Lake Systems and Regional Water SecurityView all 7 articles
In southwest China, flash floods occur frequently and often cause severe damage to residential building areas, especially in mountainous rural settlements. Risk assessment is crucial in the hazard mitigation policies and measures. However, the study on the quantitative assessment of flash flood risk for buildings is still less explored. In this study, an indicator-based assessment approach is proposed to assess the risk of buildings threatened by flash floods. The flood hazard is first simulated with 1D/2D hydrodynamic model to determine the buildings exposed to the flood and flood inundation indicators. Then, a combination of virtual surveys and building census information is used to collect information on indicators of exposed buildings and their surroundings. The indicator scores are calculated using the building flash flood risk indicator system constructed in this study which includes the flood hazard and building vulnerability indicators. A flood risk index (FRI) combining flood hazard index (FHI) and building vulnerability index (VI) is developed by weighted aggregation of indicators using combination weights calculated by the game theory approach. Based on FRI, the flash flood risk of mountainous buildings is quantitatively assessed. Taken a key mountainous rural settlement in southwest China as an example, the proposed methodological framework enables the quantitative calculation and assessment of the risk of rural buildings to flash flood. The overall framework can provide an applicable approach for flood mitigation decisions in mountainous settlements.
Flash flood is one of the main challenges to the regional water security. Especially in the rural settlements in the mountainous area, flash flood can huge casualties and building damages to the local resident community, making the flood risk assessment an important issue for flood mitigation and decision-making (Petrow et al., 2006; Totschnig and Fuchs, 2013). The flood risk assessment of buildings is a fundamental issue in the flood risk assessment which provides important information for the safety of local residents and property.
The indicator-based method is one of the typical methods in flood risk assessment. (Papathoma-Köhle et al., 2017). The method carries out quantitative risk assessment by selecting and quantifying appropriate indicators and weighting them together into a composite index. It is widely used by decision-makers worldwide because of its simplicity and efficiency (Papathoma-Köhle et al., 2019a; Fuchs et al., 2019; Malgwi et al., 2020). Although the studies based on indicators to evaluate the physical risk of buildings to natural hazards are gradually increasing, the risk of village buildings to flash flood is less explored (Romanescu et al., 2018; Leal et al., 2021). The current research on the indicator-based method mainly focuses on the vulnerability characteristics of the buildings without the consideration of the hazard intensity that plays a key role in disaster risk. Previous studies used water depth and sediment height as flood hazard intensity indicators (Dall'Osso et al., 2016; Papathoma-Köhle et al., 2019b; Papathoma-Köhle et al., 2022), which cannot describe comprehensively the risk characteristics of flash flood (such as flow velocity and solid debris) to buildings. Therefore, there exists a need to further examine the physical risks of flash floods for buildings.
The indicator method includes steps such as indicators selection, weighting, and aggregation into a final index. Indicator weighting is the most sensitive step in constructing the index, because indicator weights may have a great impact on the final index results and thus on decision making (Becker et al., 2017; Papathoma-Köhle et al., 2019b). Indicator weighting methods can be divided into two categories: subjective weighting method and objective weighting method (Zou et al., 2020). The most commonly used weighting methods in current natural disaster risk evaluation studies are subjective weights represented by the expert scoring method and analysis hierarchical process (AHP) (Beccari, 2016). The subjectivity is the biggest shortcoming of the method, which relies heavily on the experience of decision-makers (Cutter et al., 2008; Yankson et al., 2017). The different judgment criteria of decision-makers lead to large differences in indicator weights between different studies, for example, Leal (2021) considers building materials as the most important indicator affecting flood vulnerability, while Romanescu et al. (2018) assigns a higher weight to the distance of buildings from the river. The objective weight method relies on the characteristics of the objective data sample to determine the weights, which includes principal component analysis (PCA) (Thouret et al., 2014), factor analysis (Ettinger et al., 2016), etc. With the continuous application of machine learning algorithms in various fields, another new objective weighting method based on machine learning algorithms has been increasingly studied. For example, Papathoma-Köhle et al. (2019a) relied on historical storm event disaster damage data, used random forests algorithm to select key indicators, and assigned indicator weights based on factor importance analysis. However, objective weights tend to ignore the effects of the randomness of sample data and their own differences, thus yielding results that may deviate more from the actual situation. In a word, both the subjective weighting method and the objective weighting method have certain limitations, therefore, a feasible combination method should be proposed to combine the two weights to solve the above problem.
In this paper, the main purpose of this study is to quantitative evaluation of flash flood risk for buildings in mountainous rural settlements. The novelty of this paper is to develop a hybrid flood risk index (FRI) which combines the flood hazard index (FHI) and the building vulnerability index (VI). The index is obtained by weighting the flood risk indicators using the game-theoretic combination weights. Taken Jiecun Village, Southwest China as an example, the new index-based approach is used for flash flood risk of buildings. The approach provides a comprehensive risk assessment of buildings in the mountainous area and provide a scientific basis for spatial planning and flood risk management. The proposed method can be applied to other areas facing similar problems.
The Jiecun village is located in the Shouxi River basin within Wenchuan County in southwest China (Figure 1). After the 2008 Sichuan earthquake (magnitude 8.2), flash floods in the Shouxi River basin erupted more intensely and are often accompanied by secondary hazards such as debris flows, which seriously threatened the safety of local residential areas. Especially two major flash floods occurred on 20 August 2019 and 17 August 2020 (referred to as the “8.20” flood and “8.17” flood), causing severe damage. The Jiecun village is one of the most severely affected villages in the “8.20” flood. It is a typical mountainous rural settlement in southwest China, which has a resident population of more than 600 people and 230 buildings The Jiecun village is located in the heavy rain center in the Longmen Mountain rainfall area, where heavy rainfall occurs frequently. And the village area is the confluence area of three major tributaries of Shouxi River-Xi River, Zhong River, and Heishi River, it is vulnerable to flood disasters. Meanwhile, since the village is located in Sanjiang township and the national 4 A scenic spot-Sanjiang Ecological Tourism Zone, the relatively dense distribution of houses and population also make Jiecun village face the threaten of severe flood damage. Therefore, the extreme rainfall conditions, special topographic environment, and the severity of the flood response contribute to the flash flood in this area. And there is an urgent need to carry out a quantitative assessment of the flash flood risk of buildings in this area.
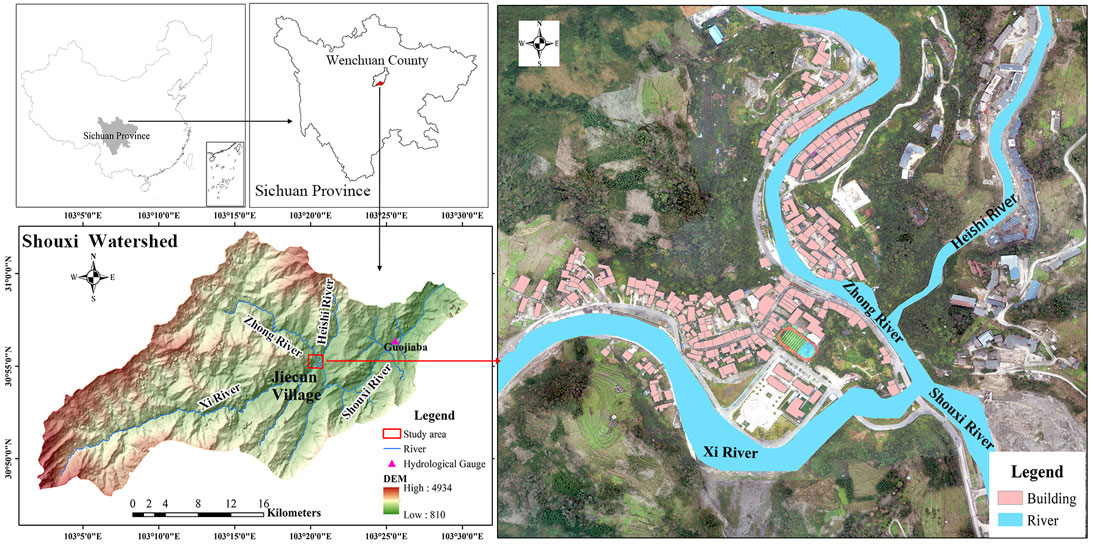
FIGURE 1. Location of the Jiecun village and the distribution of buildings in the area.
Figure 2 represents the flowchart of the build risk assessment in this study. The main processes include flood hazard modeling, building vulnerability analysis, and building flood risk assessment.

FIGURE 2. Flowchart of flood risk assessment of buildings.
In this study, the hydrological-hydraulic model is used to calculate water depth and velocity for flood inundation indicators of buildings and to identify the number of buildings exposed to flooding. The 1D/2D hydrodynamic models included in the MIKE FLOOD software package are used to simulate the flood inundation scenarios in the study area. Flooding is simulated with a combination of 1D and 2D elements. The river channel is modeled as a 1D element, and the overland flooding is modeled as a 2D process. In the flood simulation, the DEM (2 m spatial resolution) generated from LiDAR data is used as the topography of the floodplain, and the building hole method is used to consider the effect of building water retention (Tsubaki and Fujita, 2010). More details of the model can be found in the Supplementary Material.
After the “8.20” flood in 2019, the dike of local river sections in this area have been renovated and the flood protection standard of the river has been raised to 20-years return period. The inundation scenarios of the study area are simulated with two flood events under the return periods of 50- and 100- year. Due to the lack of field-observed data from gauging stations, the discharge process of the selected return period was generated by the empirical formula method including the hydrologic analogy method and the rational formula method (Chin, 2019).
A critical part of building vulnerability analysis is the creation of building vulnerability dataset. Building vulnerability dataset includes information of building features and surrounding environment. The conventional method is based on a manual survey which usually takes a lot of time. In this study, a combination of virtual survey and existing building census dataset in the study area is used to improve the efficiency. Based on the 3D real scene model of the study area and remote sensing images obtained from the survey by unmanned aerial vehicle, the virtual survey is conducted to extract information of building footprints and building attributes such as number of stories (NF), building openings (OP), rows towards river (RO), and fence type (FT). Some attributes that are difficult to identify in the 3D real scene model, such as material structure type (MS) and age (AG), can be obtained through building census information provided by the Housing and Urban Development Bureau of Wenchuan County. There is an example of building information collection in Figure 3. Building footprint and building attribute data are linked together based on unique identifiers and stored in an ArcGIS geodatabase to facilitate further analysis.
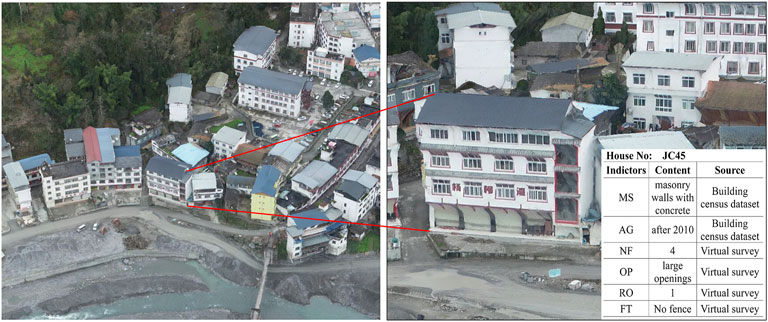
FIGURE 3. An example of building information collection via virtual survey.
An indicator-based flood risk used in this study includes the three steps: 1) indicator selection, 2) indicator weighting, and 3) indicator aggregation (Malgwi et al., 2020). A hybrid flood risk index is proposed to evaluate the building risk. The specific process for the development of the flood risk index of buildings is shown in Figure 4.
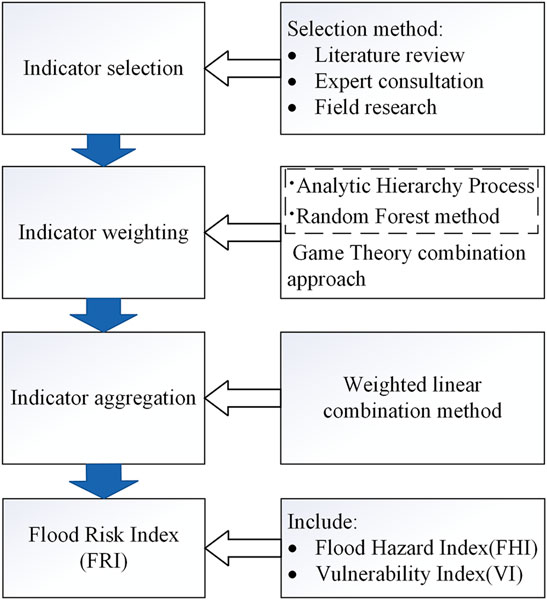
FIGURE 4. The process of indicator-based flood risk assessment.
The selection of relevant indicators is based on literature review, empirical observation from the field study, and expert consultation. Following the definition of risk “Risk = Hazard × Vulnerability” (UNDHA, 1992), an indicator system of the flash flood risk of buildings is proposed with 8 indicators and can be divided into two parts: 1) flood hazard (flood intensity and debris factor), and 2) building vulnerability (material structure type, age, number of floors, openings, rows towards river, and fence type), which are described in detail below.
The damage to buildings by flash floods is mainly affected by floodwater flow and the debris it carries (Leal et al., 2021). Therefore, flood intensity and debris factor are determined as indicators of the flood hazard.
To facilitate the use of indicators to simplify the assessment, a mathematical expression as Eq. 1 with water depth and flow velocity as independent variables is established based on Defra’s recommended average size-based damage scale (DS) matrix (Defra, 2006), which is adapted from Kelman’s research on building flood vulnerability (Kelman, 2002). The mathematical expression is named as the flood intensity (FI) indicator, representing the intensity of the action of floodwater flow on buildings. This indicator is based on the physical concept of flood momentum (Pistrika and Jonkman 2010), while the form of this indicator is a reference to the Defra human flood hazard formula (Defra, 2006).
Where
Logistic fitting in the non-linear fit function of Oringin software is used to analyze the relationship between flood intensity (FI) and damage scale (DS). According to the fitting analysis (Figure 5), when a = 3, the best fit is obtained with the fitting correlation R2 of 0.969, and the following fitting equation can be obtained.
Where DS is the house damage scales (1–5) defined by Kelman (Kelman, 2002).
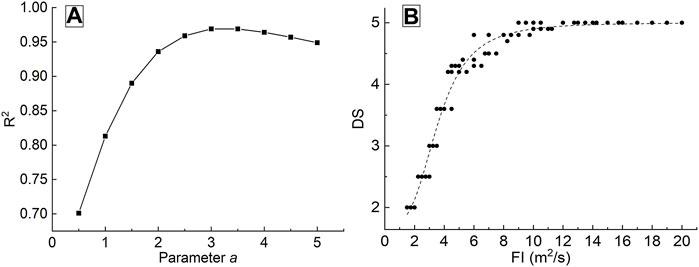
FIGURE 5. Logistic fitting correlation result (A) the fitting correlation R2 corresponding to different values of parameter a, and (B) fitting curve of damage scale DS and flood intensity FI (a = 3)
Therefore,

TABLE 1.
In the Shouxi River watershed with active tectonics and poor geological conditions, debris flows are likely to occur along with flash floods. The occurrence of debris flow will greatly increase the content of solid debris materials in the flood, increasing the destructive power of the flood, which in turn will cause more serious damage to the buildings. Therefore, it is necessary to propose a new indicator—debris factor (DF)—to measure the degree of increased flood hazard of debris flow occurrence.
With the consideration of the quantity of the debris and the probability of its occurrence (Defra, 2006), the debris factor is calculated as:
The quantity of the debris can be expressed in terms of the bulk density of debris flow Cd, and the probability of occurrence can be expressed in terms of the probability of debris flow occurrence Pd. The debris factor (DF) can be calculated by the following equation.
In this study, the table look-up method which is commonly used in the previous studies is used to calculate the values of Cd and Pd parameters [the readers can refer to Specification of geological investigation for debris flow stabilization (China Geological Disaster Prevention Engineering Association 2006) for the details]. According to the specification, the Cd parameter is calculated based on watershed parameters, and the Pd parameter is calculated based on precipitation in 10 min, 1 h, and 24 h. The Cd and Pd can be divided into four classes. The ordinal scale method was used to assign a score from 0 to 1 to each class of Cd and Pd (Table 2). Then through Eq. 4 and the matrix method, the Cd and the Pd were combined to calculate the DF, and the debris factor hazard class is classified (Tables 3, 4).
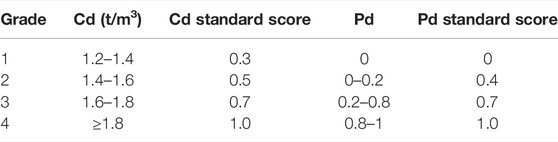
TABLE 2. Classification of Cd and Pd.
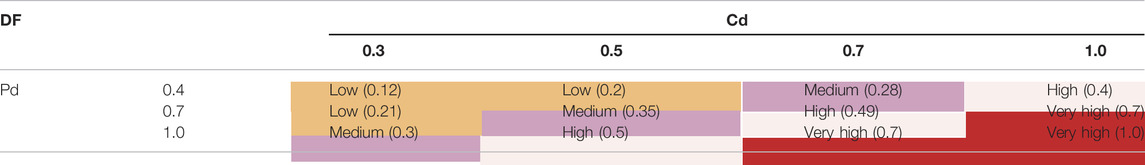
TABLE 3. Debris factor hazard matrix.
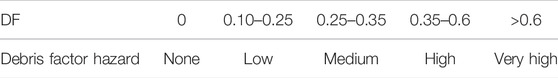
TABLE 4. Classification of debris factor hazard class.
Referring to the Papathoma tsunami vulnerability assessment model framework (PTVA) (Dall'Osso et al., 2010; Dall'Osso et al., 2016; Papathoma-Kohle et al., 2019b), building vulnerability indicators consist of the physical characteristics of buildings (including material structure type, age, number of floors, and openings) and the environment surrounding buildings (including rows towards river, and fence type). The details are as follows.
MS represents the material used in the building structure and is the main factor influencing the vulnerability of the building (Fuchs et al., 2007; Müller et al., 2011; Guillard-Gonçalves et al., 2016). According to the survey, MS in Wenchuan County mainly includes wood, adobe and wood mixed, brick and wood mixed, masonry walls with concrete, and reinforced concrete structures.
AG refers to the year of construction of the building, and the age of the building. It has an influence on the expected structural damage from flooding. The degradation and technology level of the building is related to the age of the building (Leal et al., 2021). It can be assumed that newer buildings have higher resistance to flood damage. According to the building census information, AG is divided into five categories: before 1980, 1981–1990, 1991–2000, 2001–2010, and after 2010.
FL can affect building vulnerability from different perspectives. On the one hand, more floors increase the vertical load on the ground floor, which leads to a greater resistance of the building to lateral loads of floods and is less likely to be destroyed and damaged (Kelman, 2002). On the other hand, the more floors, the smaller the proportion of exposure and the smaller the vulnerability (Papathoma-Köhle et al., 2010; Papathoma-Köhle, 2016; Leal et al., 2021). FL can be divided into three categories: one floor, two floor, and three or more floors.
OP measures the presence and location of doors, windows, or other openings. According to the post-disaster field survey in Wenchuan, it can be observed that buildings with large openings (e.g., roll-up doors, floor-to-ceiling windows) on the exterior walls exposed to floodwater are significantly more severely damaged than buildings with small openings (e.g., single doors or windows) or no openings. Understandably, the presence of large openings on the exterior walls facilitates the entry of water into the building, and the entry of floodwater will greatly increase the damage to the interior of the building (Fuchs, 2009; Papathoma-Köhle, 2016; Leal et al., 2021). Therefore, OP can be classified into 3 categories: large openings, small openings, and no exposed openings or openings above the flood level.
RO can affect direct damage to buildings from flooding. The study shows that the front row of buildings in a row layout has a sheltering effect on the back row of buildings (Dall'Osso et al., 2010; Dall'Osso et al., 2016). Buildings in the back row, protected by the front row of buildings, have relatively little flood damage. RO can be divided into first row, second row, and third or more rows.
FT can affect the effectiveness of the fence on the protection of the house (Dall'Osso et al., 2010; Dall'Osso et al., 2016). According to field research, there are mainly two types of house fences in Wenchuan County: semi-enclosed fences and fully enclosed fences. Obviously, the protection effect of fully enclosed fences is stronger than that of semi-enclosed ones. Therefore, according to the fence protection effect, FT can be divided into three cases: fully enclosed fences, semi-enclosed fences, and no fences.
To quantify the impact of indicator attributes on risk, an indicator scaling system should be developed. The indicator values are classified according to their influence on flood risk, and the ordinal scale method is used to assign a standard score of 10–100 to each category of indicator attributes. In the scaled system, 10 indicates the lowest contribution to flood risk and 100 indicates the highest contribution to flood risk. The scaling system is shown in Figure 7.
Each indicator considered in this study has a different impact on the flood risk of buildings, so each indicator should be given a different weight. To correct the one-sidedness of the single weighting method, this paper first used analysis hierarchical process (AHP) and random forests (RF) method to generate indicators weight, and then adopted game theory (GT) method to integrate the two weights to determine the combined weights.
Analysis hierarchical process (AHP) is an important tool developed by Satty to support decision making. It constructs a judgment matrix by comparing indicators in pairs and calculates the weights (Saaty, 1988). We invited 30 experts from different professions and organizations to participate in the work of judging the importance of indicators. Among the experts, 50% 15) are researchers from research institutions, 30% 9) are engineers from front-line production units, and 20% 6) are staff from water/construction-related management agencies. The experts judged the importance of the indicators based on their understanding and experience on flood risk. Finally, the experts’ feedback is aggregated using an arithmetic averaging method.
The main process of the AHP method is as follows.
1) Constructing the hierarchical model. The decision objectives are decomposed into several levels according to the different attributes of each factor. The uppermost level is the objective level, the middle level is the criterion level and sub-criterion level, and the bottom level is the indicator level, as shown in Figure 6.
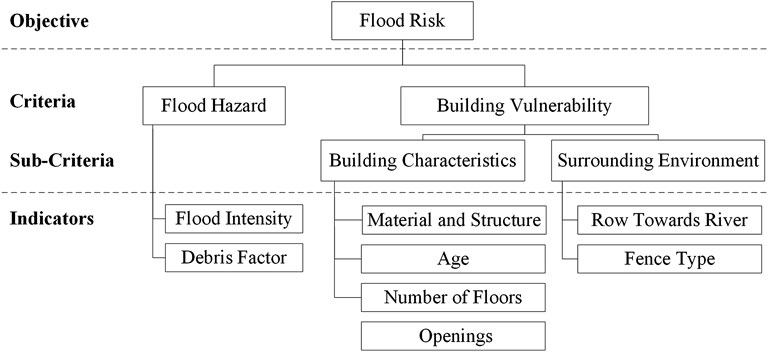
FIGURE 6. Hierarchical structure of building flood risk indicators.
2) Constructing a judgment matrix, starting from the second level of the structural model, and comparing the factors in the same level in pairs according to the experts’ judgment.
3) Calculating the weight vector. The eigenvectors and the maximum eigenvalue λmax of the judgment matrix are calculated. The consistency ratio (CR) is calculated using Eq. 5 to validate the AHP results, where: CI is the consistency index, n is the matrix dimension, and RI is the random index.
When CR < 0.1, the judgment matrix has satisfactory consistency; otherwise, the judgment matrix should be reconstructed until it is satisfactory.
In this study, the CRs of all pairwise comparisons are less than 0.1 (see Table 5), which shows that the judgment matrix is consistent. The weights of each indicator calculated by AHP are shown in Table 6.
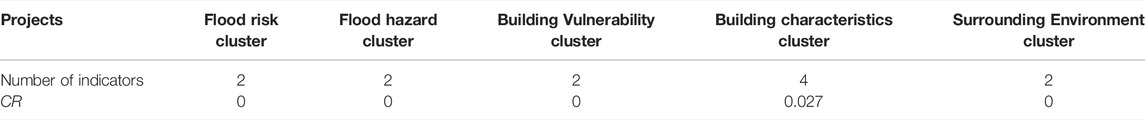
TABLE 5. Inconsistences index result of the AHP.
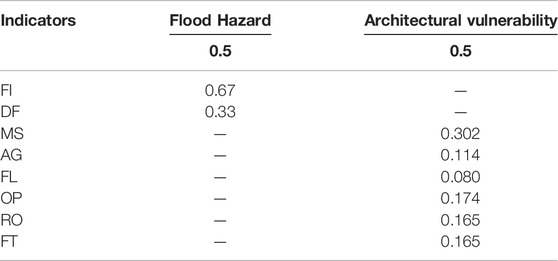
TABLE 6. Weights calculated by AHP.
The Random Forest algorithm (RF) is a machine learning algorithm proposed by Leo Breiman that combines the bagging idea and the random selection of features (Breiman, 2001). RF can provide estimates regarding the importance of variables, which in our case can help decision-makers to assess the contribution of each indicator in representing the damage process. There are two variable importance metrics: mean squared error reduction (MSER) and the Gini importance. Most researchers recommend the former as the method of choice (Genuer 2010; Gromping, 2009). Thus we adopted MSER to measure the importance of indicators.
Indicator weights are defined as the relative contribution of each indicator to the total importance of all indicators (Papathoma-Kohle et al., 2019a), i.e., the ratio of the MSER of each indicator to the sum of the MSER of all indicators (Eq. 7).
We collected data from a sample of 117 buildings affected by the “8.20″ flood of 2019 and “8.17″ flood of 2020 in Wenchuan County through post-disaster field research. Each building is classified according to the classification of mountain torrent damage to the building (Table 7) to determine the damage class (Zhen et al., 2022). Since flood hazard indicators (flood intensity and debris factor) could not be collected from the field survey, we only analyzed the contribution of building vulnerability indicators to the building damage class. Each building vulnerability indicator is assigned a standard score according to the indicator scaling system (Figure 7), which is taken as a predictor variable. Taking the damage class as the dependent variable, the importance of each indicator is obtained using random forest classification algorithm.
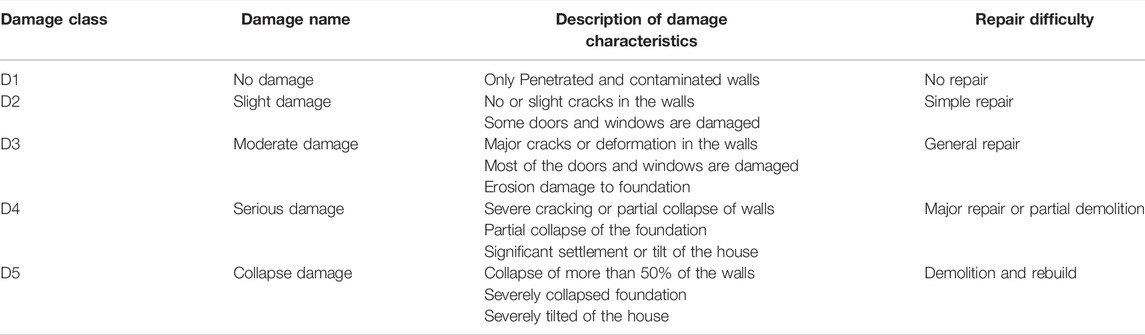
TABLE 7. Classification of mountain torrent damage to building (Zhen et al., 2022).
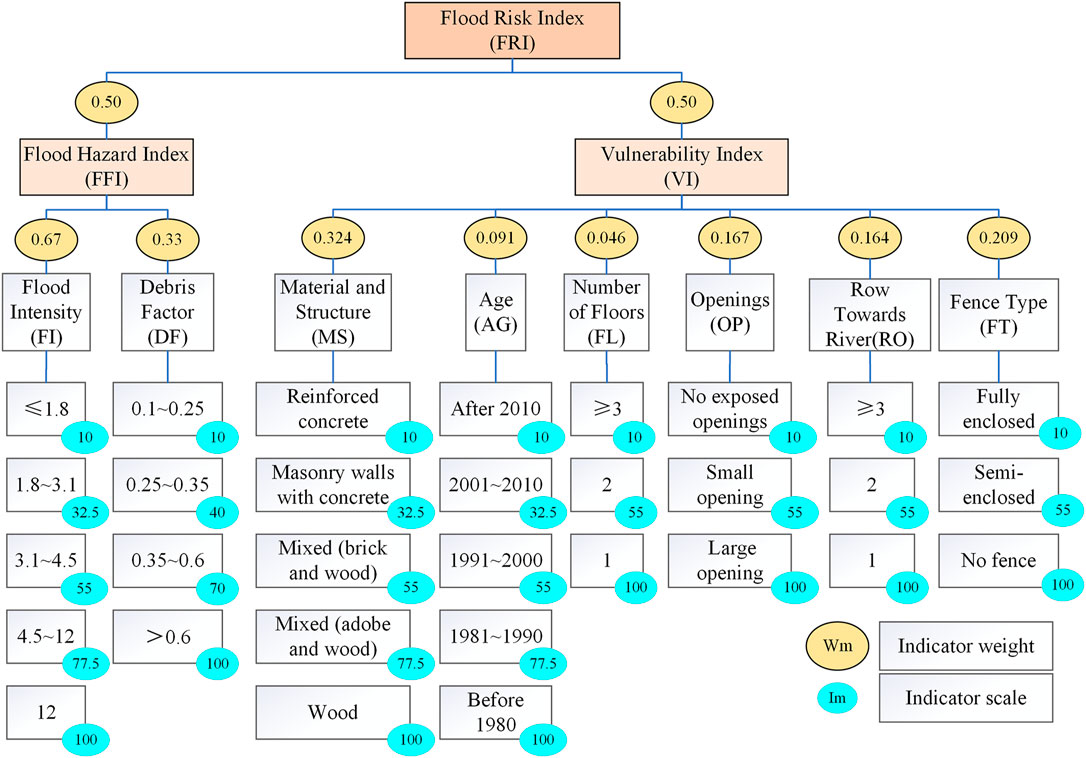
FIGURE 7. Computation framework for flood risk index (Adapted from Kappes et al., 2012)
The random forest classification model is constructed using the R-packages randomForest. The main model parameters that need to be set include the number of trees (ntree) and the number of candidate variables randomly selected for each split in each tree (mtry). In this paper, based on the bootstrap method, the optimal parameters are obtained by comparing the Out-of-Bag (OOB) errors of random forest models with different parameter settings. The final value of the model parameters ntree is 1900, and mtry is 2. The importance (MSERi) and weights of each vulnerability indicator calculated by the RF model are shown in Table 8.
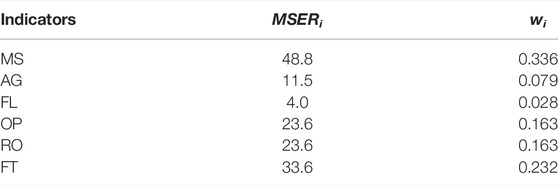
TABLE 8. Importance and weights of vulnerability indicators.
Game theory (GT) is the mathematical modeling of strategic interactions between intelligent rational decision-makers, specifically addressing conflicts between two or more participants (Zou et al., 2020). The weights obtained by AHP and the weights obtained by RF are considered as the two participants of the game, while the combined weights are the outcome of the game. The GT approach aims at Nash equilibrium to achieve agreement and compromise between the two weights, so that the respective deviations between the combined weights and the AHP and RF weights are minimized. The steps for calculating the GT-based combination weights are as follows.
Step 1 Assuming that n weights are calculated using L methods, a basic weight vector set denoted as
Step 2 The most satisfactory weights can be determined by finding the coordination and compromise between various weighting methods. A most satisfactory linear combination coefficient
According to the differential properties of the matrix, the optimal first-order derivative condition equivalent to Eq. 9 is
which corresponds to the following system of linear equations.
Step 3 Calculate the weight coefficient
Step 4 Calculate the game theory portfolio weight vector.
Based on Eqs 8–12, the combination coefficients of AHP weights and RF weights are calculated as
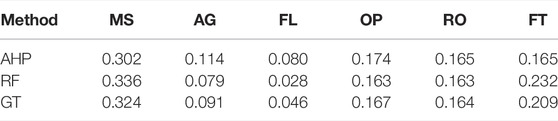
TABLE 9. Combination weights of vulnerability indicators.
The weighted linear combination (WLC) method is used to further integrate the indicator scale values and indicator weights to create a single composite index. Due to data limitations, the calculation of building vulnerability index (VI) is based on the GT combination weights, and the flood hazard index (FHI) and flood risk index (FRI) is calculated based on the AHP weights. Figure 7 illustrates the computation framework of the flood risk index.
Combining flood intensity and debris factor indicators, the flood hazard index (FHI) is calculated as follows.
The building vulnerability index (VI) is computed by weighting building indicators.
The flood risk index (FRI) is determined by combining the flood hazard index (FHI) and the building vulnerability index (VI).
To allow for comparison of buildings in different locations under different flood scenarios, buildings are classified into five risk classes based on FRI using the equal interval method: very low (10–28), low (28–46), medium (46–64), high (64–82), and very high (82–100). The flood risk class is mapped using GIS.
By hydraulic model calculation, flood inundation results (including flood extent, water depth, and flow velocity) are derived for the flood scenarios with the 50- and 100-year return periods (RT) in the study area (See Figure 8). The analysis of these flood characteristic indicators allows us to make a preliminary judgment on the magnitude of flood events and their impact on the buildings.
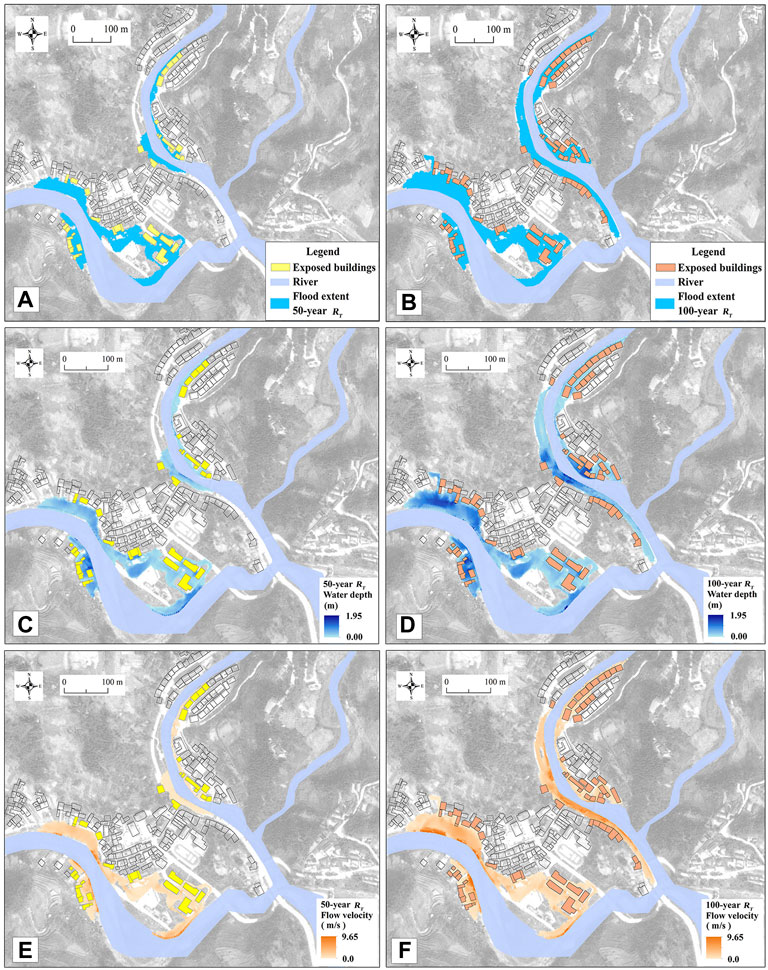
FIGURE 8. Flood inundation results. (A) and (B) are the maximum inundation extent of flood with 50-year and 100-year RT, (C) and (D) are the maximum water depth of flood with 50-year and 100-year RT, (E) and (F) are the maximum flow velocity of flood with 50-year and 100-year RT.
Based on the flood extent, the buildings exposed to flood water are identified and the potential exposure of the buildings (the part of the building in contact with flood water) is estimated to determine how the buildings are affected by floodwater. Table 10 shows the statistics of inundation indicators of buildings in the two flood scenarios. In the 50-year flood scenario, 39 buildings in the study area are affected by flooding, of which 7 (18%) buildings are potentially exposed to more than 50%, and only 2 buildings are fully exposed. In the 100-years flood scenario, 72 buildings in the study area are affected by flooding, of which 26 (36%) buildings are potentially exposed to more than 50% and 7 are fully exposed. And this indicates that buildings will be generally severely affected by flooding in the 100-years flood scenario. In the 50-year and 100-year flood scenarios, the average maximum inundation depth of flood-affected buildings is 0.38 and 0.62 m, and the average maximum flood flow velocity on the building surface is 0.86 m/s and 1.88 m/s respectively. The changes in the number of inundated buildings and building exposure as well as flood action (water depth, flow velocity) on exposed buildings indicated that compared to the 50-year flood scenario, the adverse effects of flooding on buildings in the study area would increase dramatically in the 100-year flood scenario.
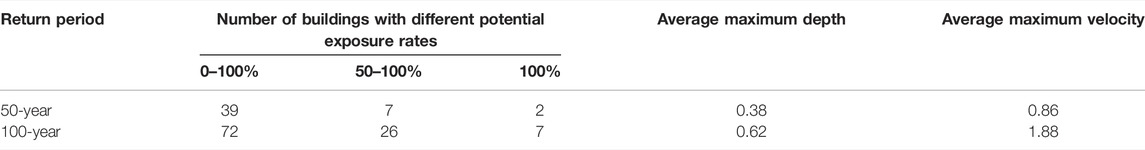
TABLE 10. Flood inundation indicators statistics.
The water depth and flow velocity simulation results are processed using a processing program developed by the authors to generate a maximum flood intensity (FI) layer (see Figures 9A,B). Based on the flood intensity layer, the maximum flood intensity (FI) near the building is extracted to represent the intensity of flood action on the building. The maximum FI on the building surface ranges from 0.2 to 6.5 m2/s in the flood scenario with 50-years RT and from 0.3 to 9.2 m2/s in the flood scenario with 100-years RT. According to the calculation method described in Section 3.3.1, the value of debris factor (DF) is calculated by Eq. 4. Applying the debris hazard matrix, the debris factor hazard class is determined based on the DF value. In the two flood scenarios, the DF of the buildings on both sides of the Xi River is 0.49, which belongs to the high debris factor hazard, while the DF of the buildings on both sides of the Zhong River is 0.35, which belongs to the medium debris factor hazard (see Figures 9C,D).
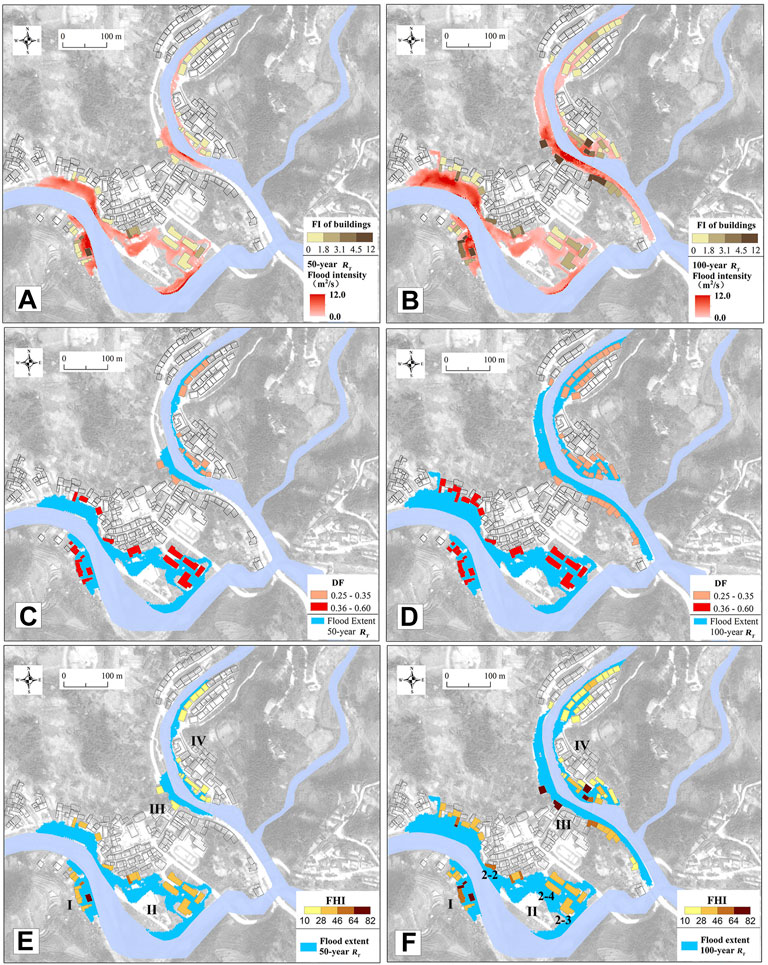
FIGURE 9. Flood hazard results. (A) and (B) are maximum FI in flood scenarios with 50-year and 100-year RT, (C) and (D) are DF in flood scenarios with 50-year and 100-year RT, and (E) and (F) are distribution of FHI in flood scenarios with 50-year and 100-year RT.
The calculation results of FI and DF indicators are assigned standard scores, and the flood hazard index (FHI) values are calculated according to Eq. 14. Figures 9E,F shows the distribution of FHI of the building. Based on the location of the buildings to the river, the flooded building areas can be roughly divided into four zones (see Figure 9): the left bank of the XI River (Zone I), the right bank of the XI River (Zone II), the right bank of the Zhong River (Zone III), and the left bank of the Zhong River (Zone IV). It can be seen that the distribution of FHI is basically consistent with the distribution of FI, which is also influenced by DF. The high debris factor hazard in Zone I and Zone II increases the FHI value of buildings in the area to different degrees. For example, after combining the DF values, the FHI values of buildings 2–2, 2–3, and 2–4 (Figure 9F) in Zone II of the Xi River for the 100-years flood scenario increase by 5, 13, and 20, respectively, compared to the FI standard score. This indicates that considering the influence of the debris factor (DF) indicator will increase the flood hazard of buildings to different degrees, which is important for a comprehensive understanding of flash flood hazard in mountainous areas.
The FHI of the building is between 20 and 75 for both flood scenarios. With reference to the flood risk classification, the FHI is also divided into the same five intervals, corresponding to five hazard classes. No buildings belong to very high hazard class, and the statistics of the number of buildings with the remaining flood hazard classes are shown in Table 11. In the flood scenarios with 50- and 100-year RT, the hazard of buildings to flash floods ranges mainly from very low to low, which account for 92% and 76% of the exposed buildings respectively. The distribution of flood hazard classes indicates that the overall flood hazard of the flooded buildings is low. Compared with the buildings in the 50-years RT flood scenario, the number and proportion of the buildings of Medium- and high-hazard class increased significantly in the 100-years RT flood scenario, with the number of Medium-hazard buildings in flash floods increasing from 2 (5%) to 9 (13%) and the number of high-hazard buildings increasing from 1 (3%) to 8 (11%). The overall flood hazard of buildings increased significantly. According to the distribution of FHI, the overall flood hazard of buildings in Zones I & II is higher than that of buildings in Zones III & IV (Figure 9 and Figure 13), indicating that buildings on both sides of the Xi River are more vulnerable to flood damage, which is also generally consistent with the building damage observed in the post-flood survey of “8.20” flood.
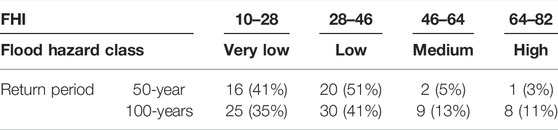
TABLE 11. Number of buildings in each flood hazard class.
Before carrying out a more detailed analysis of the vulnerability results, the statistics of the vulnerability indicators can help to better understand the building vulnerability results. With this aim in view, Figure 10 shows the frequency distribution of vulnerability indicators for exposed buildings in the 50-year and 100-year flood scenarios. In both scenarios, the material and structural types of flooded buildings are mainly masonry walls with concrete and reinforced concrete structure, and the buildings are mainly constructed after 2000, with most buildings of 3 floors and above. This is due to the fact that most of the buildings in the area were rebuilt after the Great Wenchuan Earthquake (Wang, 2008), and the housing safety was fully considered during the construction process. Therefore, the distribution of the structure type, building age and number of floors of the flooded buildings tends to be concentrated, and the buildings generally show a strong disaster resistance. However, due to the canyon topography of the area and the commercial function of the buildings (stores, restaurants, etc.), the flooded buildings are mostly large openings located in the front row of the river, which implies a potentially higher vulnerability. Also, most of the buildings in the area are open-sided, with no fence protection to reduce building vulnerability, while individual buildings having fully or semi-enclosed fence. It can be seen that building vulnerability is influenced by multiple indicators, and some indicators have even opposite effects on building vulnerability. Therefore, a comprehensive vulnerability index is established by integrating building vulnerability indicators, which can help to better reflect the comprehensive performance of building resistance to flood damage.
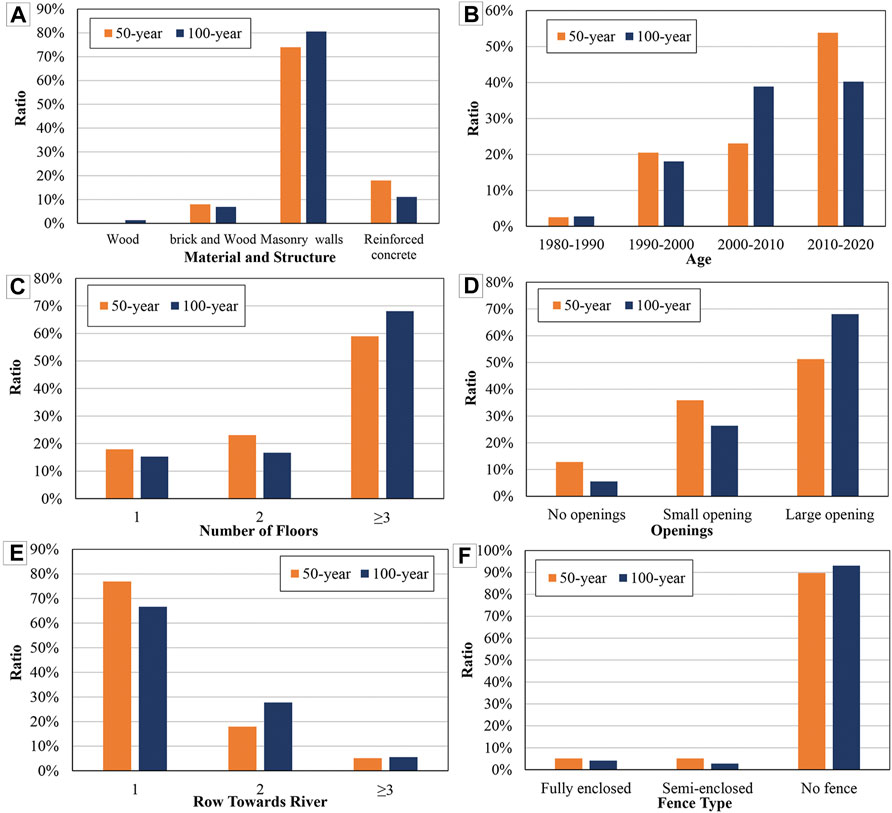
FIGURE 10. Frequency distribution of vulnerability indicators of exposed buildings (A) material structure type (B) age, (C) number of floors (D) openings, (E) rows towards river, and (F)fence type.
Based on the combined weights, the vulnerability index (VI) of buildings is calculated by weighting the building attribute indicators. Figure 11 shows the distribution of the VI of the exposed buildings in two scenarios. The vulnerability of non-flooded buildings is equal to zero because flooding does not pose a threat to these buildings. The VI ranges from 44 to 74 in both scenarios. Referring to the flood risk classification, the VI is divided into the same five intervals corresponding to the five vulnerability classes. There are no buildings in the extreme classes very low or very high, and the statistics of the number of buildings in the remaining vulnerability classes are shown in Table 12. The interval distribution of VI is consistent for the 50-year and 100-year flood scenarios, with medium-and-high vulnerability buildings dominating, of which medium-vulnerability buildings accounted for 56% and 50% respectively, and high-vulnerability buildings accounted for 36% and 47% respectively, showing an overall high building vulnerability.
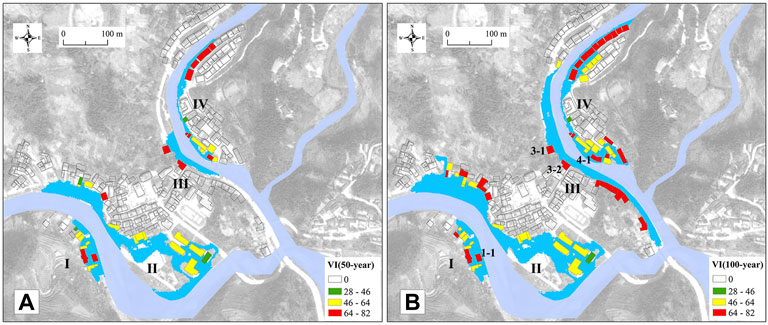
FIGURE 11. Distribution of VI in flood scenarios with (A) 50-year and (B) 100-year RT.
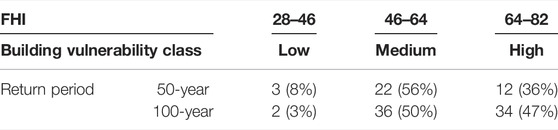
TABLE 12. Number of buildings by building vulnerability classes.
It is noteworthy that Figure 11 show that the vulnerability of buildings partially exposed to flooding in both scenarios change, which is mainly caused by the different building openings exposed to different flood levels. In the inundation level of flood with 50-years RT, buildings have no exposed openings, while in the inundation level of flood with 100-years RT, buildings have exposed large window and door openings or small openings, which proves the importance of the location of the building openings. Comparing the distribution of FHI and VI (Figure 9 and Figure 11), it can be found that some buildings with high vulnerability are also buildings with high flood hazard (e.g., 3–1 and 3–2 in Zone III, 1–1 building in Zone I and 4–1 in Zone IV), which implies extremely high potential damage, and these buildings should be the focus of attention.
The flood risk index (FRI) of each building is calculated by combining the FHI and VI. The FRI of the exposed buildings is between 33 and 71 for both flood scenarios. According to the flood risk classification criteria described in 3.3.4, the flood risk of buildings in the study area in both scenarios is concentrated in three risk classes: low, medium, and high (Figure 12). There are no buildings in the very low and very high classes, and the statistics of the number of buildings in the remaining flood risk classes are shown in Table 13. The two flood scenarios are dominated by low and medium-risk buildings, which account for more than 92% of the buildings, and the overall risk level is low. Compared to the 50-years RT flood scenario, the number and percentage of medium and high-risk buildings increased significantly in the 100-years flood scenario, with the medium risk buildings increasing significantly from 11 (28%) to 34 (47%) and the high-risk buildings increasing from 1 (3%) to 6 (8%). Thus, there is a significant increase in the overall building risk.
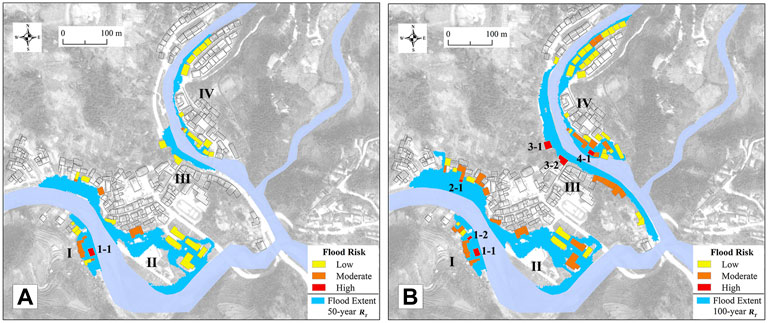
FIGURE 12. The flood risk of buildings in the flood scenarios with (A) 50-year and (B) 100-year RT.
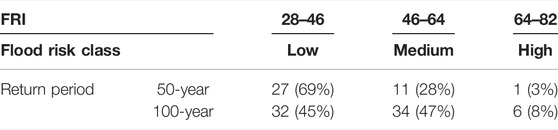
TABLE 13. Number of buildings in each flood risk class.
The overall flood hazard, vulnerability and flood risk of buildings is analyzed at zone level, based on average values of FHI, VI, and FRI in each zone (Figure 13). For the 50-years flood scenario, the average value of FRI in each zone from high to low is Zone I > Zone II > Zone III > Zone IV. For the 100-years flood scenario, the average FRI value of each zone from high to low is Zone I > Zone III > Zone II > Zone IV. The ranking of the mean FRI values for each zone in the two scenarios is consistent with the FHI values and differs significantly from the ranking of the VI values. It can be stated that the high flood risk of buildings in the study area is mainly driven by high flood hazard. And high VI values of buildings also increase the overall flood risk of buildings in the zone to some extent (e.g., Zone III and IV). The area with the highest flood risk of buildings is Zone I. According to the field research, it can be seen that there are relatively low gap sections of the dike of the river in Zone I, which has not formed a closed dike protection. When the floods overflow the dike, a large amount of floodwater enters the building area from the gap section of the dike, which will cause serious flooding and impact damage to the buildings in the area. Therefore, when implementing regional flood prevention and mitigation measures, priority should be given to improving the construction of flood prevention measures in Zone I to control the flood risk in this subzone.
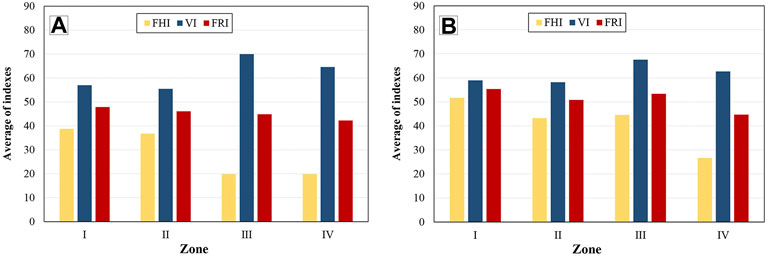
FIGURE 13. Average FHI, VI, FRI of each zone in the flood scenarios with (A) 50-year and (B) 100-year RT.
High risk buildings may be of greater concern in building risk mitigation efforts. As shown in Figure 12 and Table 13, there is only one high-risk building in the 50-years RT scenario, which is building 1–1 in Zone I of the Xi River. And there are six high risk buildings in the 100-years RT scenario, which are building 1–1 and 1–2 in Zone I, building 2–1 in Zone II, building 3–1 and 3–2 in Zone III, and building 4–1 in Zone IV, respectively. The building with the largest FRI value is building 1–1. When planning building mitigation measures, it is clear that priority should be given to these high-risk buildings, especially building 1–1.
The FRI is derived quantitatively using an indicator-based method, which requires awareness of its applicability, limitations, and challenges. Some key steps in the methodological process are discussed further below, including 1) selection of indicators, 2) aggregation of indicators, and 3) data acquisition.
The selection of indicators is the first step in creating a flood risk index, which depends on the characteristics of flood damage to buildings and the building features of the affected area (Kappes et al., 2012). In this study, flood intensity (FI) indicator consisting of inundation depth and flow velocity and debris factor (DF) indicator consisting of the quantity of debris and probability of occurrence are established as flood hazard indicators for mountainous areas. The determination of flood hazard indicators took into account the theoretical mechanisms of building damage caused by floodwater flow and the actual characteristics of combined disaster caused by flood and debris flow in this area. Compared with the previous studies, which directly used the inundation depth as flood risk indicators, the introduction of flood intensity (FI) and debris factor (DF) indicators is an innovation of this paper, which can better reflect the disaster-causing characteristics of flash floods on buildings in mountainous areas. As to the selection of the building vulnerability indicators, we took into account the disaster resistance characteristics of the buildings and the surrounding environment of the buildings in the study area as well as the accessibility of the indicators. After expert evaluation, six building vulnerability indicators are finally determined, including the material structure type, age, number of floors, openings, rows toward river, and fence type, which are generally accepted by many studies (Godfrey et al., 2015; Miranda and Ferreira, 2019; Chao et al., 2021; Leal et al., 2021). However, due to the lack of historical disaster data, flash flood scenarios are difficult to accurately recreate and simulate, and the validity of the indicators still needs further validation.
The weight assignment is the most critical part of the indicator aggregation and the most sensitive step in the construction of the risk index. In this paper, the weights based on analysis hierarchical process (AHP) and random forest algorithm (RF) (Figure 14) are analyzed and compared. The AHP method considers building material structure type and openings as the two relatively most important indicators with the greatest impact on flood risk, while the least important ones are age and number of floors. However, influenced by experts’ experience, the AHP method has strong subjectivity and does not depend on the objective data law, which may lead to unreasonable results. According to the RF method, building material structure type (MS) and enclosure type (FT) are relatively most important, while building age (AG) and number of building stories (FL) are relatively least important. Compared with AHP method, the RF method presents polarized weight values, i.e., the important indicators have larger weight values, such as MS and FT, while the unimportant ones have smaller weight values, such as FL. The analysis results of the RF method are easily affected by the quality of collected samples. The small number of samples used in this study as well as the concentration of building types may affect the results of variable importance, which may lead to a deviation between the calculated importance of the indicators and the actual importance. The shortage of sample size is a limitation of this study, and more sample data of the affected buildings need to be collected in the future to improve the results. In addition, the field survey data set does not contain data of flood intensity and debris factor indicator, and only the importance analysis of building vulnerability indicators has been carried out. Further disaster data should be collected. The flood inundation characteristics can be obtained by accurate restoration simulation of flood scenarios, and relevant indicators data in disaster data sets can be supplemented to carry out a more comprehensive analysis.
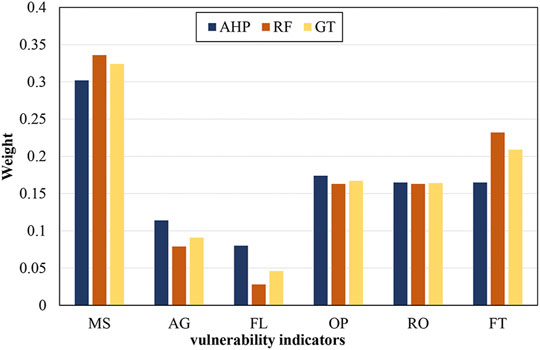
FIGURE 14. Vulnerability indicator weights obtained by the three methods.
The two methods, AHP and RF, have less divergence in judging the importance ranking of indicators, and the main differences are reflected in the specific weight values. The combination weight result obtained by the game theory method (GT) is more similar to that of RF, because the ratio of AHP to RF is determined by the weight combination coefficient reaching Nash equilibrium, and the combination coefficient corresponding to RF weight is greater than that of AHP. GT method makes some abnormal values more reasonable by increasing the weight of the MS and FT indicator of AHP, as well as increasing the weight of the AG and FL indicators of RF. Thus, the combined weights based on the GT method overcome the problem of the one-sidedness of single weights and the results are more reasonable.
In addition, the way of acquiring and processing indicator data will affect the accuracy of risk calculation results and the efficiency of the whole evaluation process. In the flood hazard modeling of this study, hydrological and hydrodynamic methods are used to obtain parameters such as inundation extent, water depth, and flow velocity in the assumed flood scenario. The flood simulation adopted high-precision terrain and generalizes the water blocking effect of individual buildings by building hole method, which can more accurately simulate the effect of flood on buildings on the microscopic scale. The modeling approach provides more accurate values for flood hazard indicators, which in turn improves the accuracy and rationality of the risk calculation results. In the process of building vulnerability dataset creation, the data of building vulnerability indicators are mainly collected through the combination of virtual survey based on unmanned aerial survey and remote sensing technology as well as building census data. Although the 3D real scene model may have the problem of the low resolution of local images and needs to be verified with the aid of some field research photos, the building information collection time is greatly reduced and the efficiency is significantly improved compared with manual field collection, which proves the feasibility of this data collection method, and is conducive to the promotion of risk assessment methods in this study.
The analysis of the flood risk results shows that the risk of flash flood to buildings can be reduced by controlling the flood hazard and reducing the vulnerability of buildings. For the first approach, flood control engineering measures such as reinforcing some substandard dike in the Xi River and Zhong River are required to reduce the extent and frequency of flood inundation of building areas. For the second method, measures to reduce the vulnerability of buildings include relocation, optimization, and improvement of building structures and construction of protective facilities attached to buildings such as fences (Wei et al., 2021) to increase the resilience of buildings to flooding.
This study proposed an indicator-based methodological framework to assess the flood risk of rural buildings in mountainous areas. The main findings are as follows.
In the flood risk indicators, the flood hazard indicators which combines flood intensity (FI) and debris factor (DF) performs better than the traditional indicator of flood hazard such as water depth used in the previous studies. The FI and DF indicators can better reflect the disaster-causing characteristics of floods to buildings in mountainous areas of southwest China. Another contribution of this paper is to combine analysis hierarchical process weights with random forest algorithm weights through game theory, which solves the subjectivity problem of previous indicators and makes the weights of indicators more reasonable.
The quantitative calculation method proposed in this study is applied to assess the flash flood risk of buildings in Jiecun Village, a typical mountainous rural settlement in southwest China. The results showed that in the flood scenarios with the 50- and 100-year return period, 97% and 92% of the flooded buildings in the study area are at low and medium risk, signifying an overall low risk level. The inundation zone with the highest overall flood risk of buildings is Zone I on the right bank of the Xi River. The results highlight this method can not only achieve quantitative assessment of the overall risk of buildings in the inundation area, but also manage to identify buildings with different risks, providing reference for implementing different disaster response measures.
Despite some limitations and uncertainties in the risk assessment process, the methodological framework still has good application value for flood mitigation decisions to buildings. The effective management of flood risk of buildings will be achieved through the implementation of both hazard risk mitigation and vulnerability reduction measures, such as raising the standard of the dike, renovating building structures, and constructing building accessory protection facilities, to ensure that the FRI of buildings is below a certain threshold value.
The original contributions presented in the study are included in the article/Supplementary Material, further inquiries can be directed to the corresponding authors.
All authors listed have made a substantial, direct, and intellectual contribution to the work and approved it for publication.
This work was supported by the National Key Research and Development Plan during the 13th Five-Year plan period (Grant No. 2018YFD1100401); the National Natural Science Foundation of China (51909191).
The authors declare that the research was conducted in the absence of any commercial or financial relationships that could be construed as a potential conflict of interest.
All claims expressed in this article are solely those of the authors and do not necessarily represent those of their affiliated organizations, or those of the publisher, the editors and the reviewers. Any product that may be evaluated in this article, or claim that may be made by its manufacturer, is not guaranteed or endorsed by the publisher.
We would like to thank Professor Yu Yang of Wuhan University for providing the 3D real scene model and related materials used in this dataset. We also thank the helpful inputs from the editor and reviewers.
The Supplementary Material for this article can be found online at: https://www.frontiersin.org/articles/10.3389/fenvs.2022.931029/full#supplementary-material
Beccari, B. (2016). A Comparative Analysis of Disaster Risk, Vulnerability and Resilience Composite Indicators. Plos Curr. 8. doi:10.1371/currents.dis.453df025e34b682e9737f95070f9b970
Becker, W., Saisana, M., Paruolo, P., and Vandecasteele, I. (2017). Weights and Importance in Composite Indicators: Closing the Gap. Ecol. Indic. 80, 12–22. doi:10.1016/j.ecolind.2017.03.056
Chao, S. R., Ghansah, B., and Grant, R. J. (2021). An Exploratory Model to Characterize the Vulnerability of Coastal Buildings to Storm Surge Flooding in Miami-Dade County, Florida. Appl. Geogr. 128, 102413. doi:10.1016/j.apgeog.2021.102413
Chin, D. A. (2019). Estimating Peak Runoff Rates Using the Rational Method. J. Irrig. Drain. Eng. 145 (6), 04019006. doi:10.1061/(Asce)Ir.1943-4774.0001387
China Geological Disaster Prevention Engineering Association (2006). Specification of Geological Investigation for Debris Flow Stabilization. China: Ministry of Land and Resources of the People’s Republic of China.
Cutter, S. L., Barnes, L., Berry, M., Burton, C., Evans, E., Tate, E., et al. (2008). A Place-Based Model for Understanding Community Resilience to Natural Disasters. Glob. Environ. Change 18 (4), 598–606. doi:10.1016/j.gloenvcha.2008.07.013
Dall'Osso, F., Maramai, A., Graziani, L., Brizuela, B., Cavalletti, A., Gonella, M., et al. (2010). Applying and Validating the PTVA-3 Model at the Aeolian Islands, Italy: Assessment of the Vulnerability of Buildings to Tsunamis. Nat. Hazards Earth Syst. Sci. 10 (7), 1547–1562. doi:10.5194/nhess-10-1547-2010
Dall’Osso, F., Dominey-Howes, D., Tarbotton, C., Summerhayes, S., and Withycombe, G. (2016). Revision and Improvement of the PTVA-3 Model for Assessing Tsunami Building Vulnerability Using "international Expert Judgment": Introducing the PTVA-4 Model. Nat. Hazards 83 (2), 1229–1256. doi:10.1007/s11069-016-2387-9
Defra (2006). Flood and Coastal Defence R&D Programme, R&D Outputs: Flood Risks to People (Phase 2). London, UK: Defra.
Ettinger, S., Mounaud, L., Magill, C., Yao-Lafourcade, A.-F., Thouret, J.-C., Manville, V., et al. (2016). Building Vulnerability to Hydro-Geomorphic Hazards: Estimating Damage Probability from Qualitative Vulnerability Assessment Using Logistic Regression. J. Hydrology 541, 563–581. doi:10.1016/j.jhydrol.2015.04.017
Fuchs, S., Heiss, K., and Hübl, J. (2007). Towards an Empirical Vulnerability Function for Use in Debris Flow Risk Assessment. Nat. Hazards Earth Syst. Sci. 7, 495–506. doi:10.5194/nhess-7-495-2007
Fuchs, S., Keiler, M., Ortlepp, R., Schinke, R., and Papathoma-Köhle, M. (2019). Recent Advances in Vulnerability Assessment for the Built Environment Exposed to Torrential Hazards: Challenges and the Way Forward. J. Hydrology 575, 587–595. doi:10.1016/j.jhydrol.2019.05.067
Fuchs, S. (2009). Susceptibility versus Resilience to Mountain Hazards in Austria - Paradigms of Vulnerability Revisited. Nat. Hazards Earth Syst. Sci. 9, 337–352. doi:10.5194/nhess-9-337-2009
Godfrey, A., Ciurean, R. L., van Westen, C. J., Kingma, N. C., and Glade, T. (2015). Assessing Vulnerability of Buildings to Hydro-Meteorological Hazards Using an Expert Based Approach - an Application in Nehoiu Valley, Romania. Int. J. Disaster Risk Reduct. 13, 229–241. doi:10.1016/j.ijdrr.2015.06.001
Grömping, U. (2009). Variable Importance Assessment in Regression: Linear Regression Versus Random Forest. The American Statistician 63, 308–319. doi:10.1198/tast.2009.08199
Guillard-Gonçalves, C., Zêzere, J. L., Pereira, S., and Garcia, R. A. C. (2016). Assessment of Physical Vulnerability of Buildings and Analysis of Landslide Risk at the Municipal Scale: Application to the Loures Municipality, Portugal. Nat. Hazards Earth Syst. Sci. 16 (2), 311–331. doi:10.5194/nhess-16-311-2016
Kappes, M. S., Papathoma-Köhle, M., and Keiler, M. (2012). Assessing Physical Vulnerability for Multi-Hazards Using an Indicator-Based Methodology. Appl. Geogr. 32 (2), 577–590. doi:10.1016/j.apgeog.2011.07.002
Kelman, I. (2002). Physical Flood Vulnerability of Residential Properties in Coastal. Eastern England: University of Cambridge.
Leal, M., Reis, E., Pereira, S., and Santos, P. P. (2021). Physical Vulnerability Assessment to Flash Floods Using an Indicator‐based Methodology Based on Building Properties and Flow Parameters. J. Flood Risk Manag. 14 (3). doi:10.1111/jfr3.12712
Malgwi, M. B., Fuchs, S., and Keiler, M. (2020). A Generic Physical Vulnerability Model for Floods: Review and Concept for Data-Scarce Regions. Nat. Hazards Earth Syst. Sci. 20 (7), 2067–2090. doi:10.5194/nhess-20-2067-2020
Miranda, F. N., and Ferreira, T. M. (2019). A Simplified Approach for Flood Vulnerability Assessment of Historic Sites. Nat. Hazards 96 (2), 713–730. doi:10.1007/s11069-018-03565-1
Müller, A., Reiter, J., and Weiland, U. (2011). Assessment of Urban Vulnerability Towards Floods Using an Indicator-Based Approach - a Case Study for Santiago de Chile. Nat. Hazards Earth Syst. Sci. 11 (8), 2107–2123. doi:10.5194/nhess-11-2107-2011
Papathoma-Köhle, M., Cristofari, G., Wenk, M., and Fuchs, S. (2019a). The Importance of Indicator Weights for Vulnerability Indices and Implications for Decision Making in Disaster Management. Int. J. Disaster Risk Reduct. 36, 101103. doi:10.1016/j.ijdrr.2019.101103
Papathoma-Köhle, M., Schlögl, M., and Fuchs, S. (2019b). Vulnerability Indicators for Natural Hazards: an Innovative Selection and Weighting Approach. Sci. Rep. 9 (1), 15026. doi:10.1038/s41598-019-50257-2
Papathoma-Köhle, M., Gems, B., Sturm, M., and Fuchs, S. (2017). Matrices, Curves and Indicators: A Review of Approaches to Assess Physical Vulnerability to Debris Flows. Earth-Science Rev. 171, 272–288. doi:10.1016/j.earscirev.2017.06.007
Papathoma-Köhle, M., Kappes, M., Keiler, M., and Glade, T. (2010). Physical Vulnerability Assessment for Alpine Hazards: State of the Art and Future Needs. Nat. Hazards 58 (2), 645–680. doi:10.1007/s11069-010-9632-4
Papathoma-Köhle, M., Schlögl, M., Dosser, L., Roesch, F., Borga, M., Erlicher, M., et al. (2022). Physical Vulnerability to Dynamic Flooding: Vulnerability Curves and Vulnerability Indices. J. Hydrology 607, 127501. doi:10.1016/j.jhydrol.2022.127501
Papathoma-Köhle, M. (2016). Vulnerability Curves vs. Vulnerability Indicators: Application of an Indicator-Based Methodology for Debris-Flow Hazards. Nat. Hazards Earth Syst. Sci. 16 (8), 1771–1790. doi:10.5194/nhess-16-1771-2016
Petrow, T., Thieken, A. H., Kreibich, H., Merz, B., and Bahlburg, C. H. (2006). Improvements on Flood Alleviation in Germany: Lessons Learned from the Elbe Flood in August 2002. Environ. Manag. 38 (5), 717–732. doi:10.1007/s00267-005-6291-4
Pistrika, A. K., and Jonkman, S. N. (2010). Damage to Residential Buildings Due to Flooding of New Orleans After Hurricane Katrina. Natural Hazards 54, 413–434. doi:10.1007/s11069-009-9476-y
Romanescu, G., Hapciuc, O. E., Minea, I., and Iosub, M. (2018). Flood Vulnerability Assessment in the Mountain-Plateau Transition Zone: a Case Study of Marginea Village (Romania). J. Flood Risk Manage 11, S502–S513. doi:10.1111/jfr3.12249
Saaty, T. L. (1988). “What Is the Analytic Hierarchy Process?,” in Mathematical Models for Decision Support (Springer), 109–121. doi:10.1007/978-3-642-83555-1_5
Thouret, J.-C., Ettinger, S., Guitton, M., Santoni, O., Magill, C., Martelli, K., et al. (2014). Assessing Physical Vulnerability in Large Cities Exposed to Flash Floods and Debris Flows: the Case of Arequipa (Peru). Nat. Hazards 73 (3), 1771–1815. doi:10.1007/s11069-014-1172-x
Totschnig, R., and Fuchs, S. (2013). Mountain Torrents: Quantifying Vulnerability and Assessing Uncertainties. Eng. Geol. 155, 31–44. doi:10.1016/j.enggeo.2012.12.019
Tsubaki, R., and Fujita, I. (2010). Unstructured Grid Generation Using LiDAR Data for Urban Flood Inundation Modelling. Hydrol. Process. 24 (11), 1404–1420. doi:10.1002/hyp.7608
UNDHA (1992). Internationally Agreed Glossary of Basic Terms Related to Disaster Management. Geneva: United Nations Department of Humanitarian Affairs.
Wang, Z. (2008). A Preliminary Report on the Great Wenchuan Earthquake. Earthquake engineering and engineering vibration 7, 225–234. doi:10.1007/s11803-008-0856-1
Wei, L., Hu, K., and Liu, J. (2021). Quantitative Analysis of the Debris Flow Societal Risk to People inside Buildings at Different Times: A Case Study of Luomo Village, Sichuan, Southwest China. Front. Earth Sci. 8, 627070. doi:10.3389/feart.2020.627070
Yankson, P. W. K., Owusu, A. B., Owusu, G., Boakye-Danquah, J., and Tetteh, J. D. (2017). Assessment of Coastal Communities' Vulnerability to Floods Using Indicator-Based Approach: a Case Study of Greater Accra Metropolitan Area, Ghana. Nat. Hazards 89 (2), 661–689. doi:10.1007/s11069-017-2985-1
Zhen, Y., Liu, S., Zhong, G., Zhou, Z., Fang, Q., Zhen, W., et al. (2022). Characterization and Impact Factors of the Damage to Village Buildings by Mountain Torrent Disasters in Wenchuan County. J. Disaster Prev. Mitig. Eng. 42 (01), 1–11. doi:10.13409/j.cnki.jdpme.20210416004
Keywords: indicator-based methodology, risk assessment, flash flood, buildings, mountainous rural settlements, southwest china
Citation: Zhen Y, Liu S, Zhong G, Zhou Z, Liang J, Zheng W and Fang Q (2022) Risk Assessment of Flash Flood to Buildings Using an Indicator-Based Methodology: A Case Study of Mountainous Rural Settlements in Southwest China. Front. Environ. Sci. 10:931029. doi: 10.3389/fenvs.2022.931029
Received: 28 April 2022; Accepted: 09 May 2022;
Published: 15 June 2022.
Edited by:
Jiangyu Dai, Nanjing Hydraulic Research Institute, ChinaReviewed by:
Yu Zhang, Nanjing Hydraulic Research Institute, ChinaCopyright © 2022 Zhen, Liu, Zhong, Zhou, Liang, Zheng and Fang. This is an open-access article distributed under the terms of the Creative Commons Attribution License (CC BY). The use, distribution or reproduction in other forums is permitted, provided the original author(s) and the copyright owner(s) are credited and that the original publication in this journal is cited, in accordance with accepted academic practice. No use, distribution or reproduction is permitted which does not comply with these terms.
*Correspondence: Shuguang Liu, bGl1c2dsaXVAdG9uZ2ppLmVkdS5jbg==; Guihui Zhong, MDQwOThAdG9uZ2ppLmVkdS5jbg==; Zhengzheng Zhou, MTkwNThAdG9uZ2ppLmVkdS5jbg==
Disclaimer: All claims expressed in this article are solely those of the authors and do not necessarily represent those of their affiliated organizations, or those of the publisher, the editors and the reviewers. Any product that may be evaluated in this article or claim that may be made by its manufacturer is not guaranteed or endorsed by the publisher.
Research integrity at Frontiers
Learn more about the work of our research integrity team to safeguard the quality of each article we publish.