
95% of researchers rate our articles as excellent or good
Learn more about the work of our research integrity team to safeguard the quality of each article we publish.
Find out more
ORIGINAL RESEARCH article
Front. Environ. Sci. , 08 August 2022
Sec. Environmental Economics and Management
Volume 10 - 2022 | https://doi.org/10.3389/fenvs.2022.929707
This article is part of the Research Topic Artificial Intelligence-Based Forecasting and Analytic Techniques for Environment and Economics Management View all 21 articles
 Saman Maroufpoor1
 Saad Sh. Sammen2
 Nadhir Alansari3*
 S.I. Abba4,5
 Anurag Malik6
 Shamsuddin Shahid7
 Ali Mokhtar8
 Eisa Maroufpoor9
Dissolved oxygen (DO) is one of the main prerequisites to protect amphibian biological systems and to support powerful administration choices. This research investigated the applicability of Shannon’s entropy theory and correlation in obtaining the combination of the optimum inputs, and then the abstracted input variables were used to develop three novel intelligent hybrid models, namely, NF-GWO (neuro-fuzzy with grey wolf optimizer), NF-SC (subtractive clustering), and NF-FCM (fuzzy c-mean), for estimation of DO concentration. Seven different input combinations of water quality variables, including water temperature (TE), specific conductivity (SC), turbidity (Tu), and pH, were used to develop the prediction models at two stations in California. The performance of proposed models for DO estimation was assessed using statistical metrics and visual interpretation. The results revealed the better performance of NF-GWO for all input combinations than other models where its performance was improved by 24.2–66.2% and 14.9–31.2% in terms of CC (correlation coefficient) and WI (Willmott index) compared to standalone NF for different input combinations. Additionally, the MAE (mean absolute error) and RMSE (root mean absolute error) of the NF model were reduced using the NF-GWO model by 9.9–46.0% and 8.9–47.5%, respectively. Therefore, NF-GWO with all water quality variables as input can be considered the optimal model for predicting DO concentration of the two stations. In contrast, NF-SC performed worst for most of the input combinations. The violin plot of NF-GWO-predicted DO was found most similar to the violin plot of observed data. The dissimilarity with the observed violin was found high for the NF-FCM model. Therefore, this study promotes the hybrid intelligence models to predict DO concentration accurately and resolve complex hydro-environmental problems.
The evaluation of water assets and the administration of water quality and quantity have become a debated issue in hydroecology with population growth and environmental changes. Water pollution rather than water availability is often the main challenge due to its multifaced impact ranging from biodiversity to public health. Therefore, water-quality monitoring is one of the most emphasized topics in water research. Numerous chemical, physical, and biological parameters determine river water quality. All the water quality parameters directly or indirectly affect dissolved oxygen (DO) concentration in water bodies, and thus DO is considered an integrated water-quality indicator (Ahmed and Shah, 2017; Hameed et al., 2017). Therefore, precise forecasts of DO are prerequisites to protect amphibian biological systems and support powerful administration choices (Wen et al., 2013; Elkiran et al., 2019; Nourani et al., 2019).
Traditionally, physically based models are used for DO prediction (Radwan et al., 2003; Wu and Yu, 2021). The models generally use advection and dispersion theories to simulate the biological and chemical processes in water for DO prediction. For example, Radwan et al. (2003) used Mike11 for modeling DO in river water. Wu and Yu (2021) used a modified version of the Streeter–Phelps model coupled with the shallow water equation model to simulate mass transportation and DO distribution. The studies indicated the need for a large amount of data and computational time to predict DO reliability. Radwan et al. (2003) reported that a simplified conceptual model can provide a similar DO prediction with much less resources and time. In addition, statistical models can be used to predict DO with less amount of data and resources. Pham et al. (2020) developed several generalized linear models to predict DO. They showed that statistical models can predict DO with reasonable errors. However, conceptual models simplify real physical processes and fail to provide accurate predictions when river water DO concentration follows a non-linear and complex pattern. The linear statistical models experience similar drawbacks when DO is non-linearly related to its controlling factors (Chen and Liu, 2014; Elkiran et al., 2018).
Artificial Intelligence (AI)-based models have been utilized in recent decades in various hydro-natural investigations (Abba et al., 2017; Yavari et al., 2018; Maroufpoor et al., 2019b; Seyedzadeh et al., 2020; Meidute-Kavaliauskiene et al., 2021). The rapid evolution of AI techniques also helped in accurate DO simulations to resolve complex hydro-environmental problems. Artificial neural networks (ANNs) have helped hydrologists in predicting variations in water quality accurately. The other AI models also showed promising results in predicting water quality and DO (Zaher et al., 2015; Elkiran et al., 2018; Nourani et al., 2018; Pham et al., 2019; Banadkooki et al., 2020; Abba et al., 2021; Pham et al., 2021a; Pham et al., 2021b). For example, Chen and Liu (2014) used neuro-fuzzy (NF), back propagation neural network (BPNN), and multiple linear regression (MLR) approaches to estimate DO in the reservoir. The outcomes indicated that the NF model outperformed BPNN. Xiao et al. (2017) employed BPNN to simulate DO in Beihai, Guangxia aquaculture, using various inputs. The prediction results showed the superiority of BPNN against autoregression (AR), curve fitting (CF), grey model (GM), and SVR models. Elkiran et al. (2018) employed the combinations of NF, feedforward neural network (FFNN), and MLR to predict DO at multiple locations in India using different input combinations. Their results showed a slight prediction increment of NF over FFNN. Other recent DO prediction studies using AI-based models include Antanasijević et al. (2019), Cao et al. (2019), Liu et al. (2019), Kisi et al. (2020), and Rahman et al. (2020). The studies revealed AI-based models as promising tools owing to their capability to handle non-linear systems.
The literature overview revealed no specific AI-based models tend to be incomparable to others due to the anthropogenic nature of complex aquaculture in different geographical locations. According to Abba et al. (2020), Hadi et al. (2019), and Yaseen et al. (2020), the estimation outcomes produced by some computational models were still grieving from the degree of inadequacy, particularly when a highly chaotic hydro-environmental system is employed. Therefore, hydrologists continuously explored better AI models for DO prediction more efficiently. NF integrates neural networks and fuzzy systems to join their advantages for a better solution to complex problems. The capability of NF to learn data patterns using fuzzy rules has made it highly adaptable to different kinds of data and thus superior to many other AI algorithms in solving a wide range of problems from different fields (Atmaca et al., 2001). However, the major drawback of NF is that its performance significantly is susceptible to the selection and optimization of the input variable’s fuzzy membership function. The state-of-the-art hybrid AI model displayed promising prediction results over standalone models in different hydrological studies (Maroufpoor et al., 2019a; Pham et al., 2019; Maroufpoor et al., 2020; Mohammadi et al., 2020; Ebtehaj et al., 2021; Malik et al., 2021; Sammen et al., 2021). Therefore, such models may be a suitable alternative to standalone models in DO prediction. The optimizations and chemometric approaches were introduced in several fields of science and engineering, for instance Shojaei et al. (2019), Shojaei and Shojaei, (2019), Pourabadeh et al. (2020), Shojaei et al. (2021), and Yang et al. (2022).
In order to overcome the inherent limitations established by standalone models. This research aims to predict the DO concentration using three hybrid models, namely, NF-GWO, NF-SC, and NF-FCM, and compare them with the standalone NF model. The entropy method was used to evaluate each input variable’s effect and uncertainty on the models’ performance to select the best prediction model structure. The entropy theory, developed by Shannon (1948), has been used in a wide range of studies (Singh, 2013a; Singh, 2013b; Ellenburg et al., 2018; Maroufpoor et al., 2020). There is no technical research in which the aforementioned techniques are used for predicting DO concentration to the best of the author’s knowledge.
This research aimed to develop an intelligent hybrid paradigm for predicting DO concentration in river water using three hybrid models, NF-GWO (neuro-fuzzy with grey wolf optimizer), NF-SC (subtractive clustering), and NF-FCM (fuzzy c-mean). The newly proposed models’ efficacy was established by comparing their performance with the standalone neuro-fuzzy (NF) model.
In this study, four water quality parameters, namely, specific conductance (SC, μS.cm-1), water temperature (TE,°C), pH of the water, and turbidity (Tu, Formazin Nephelometric Units: FNU) were used as inputs for the prediction of DO. Two stations (i.e., Station-A and Station-B) in California were selected for the case study (Figure 1). Hourly water quality data at these two stations for the period 1 January 2019–31 December 2019 were collected from the United States Geological Survey (USGS). The descriptive statistics of the data are shown in Table 1. Furthermore, the entropy theory, based on statistical measurements introduced by Shannon (1948), was used to evaluate the significant input variables. Seven different input combinations of water quality variables, including water temperature (TE), specific conductivity (SC, turbidity (Tu), and pH, were used to develop the prediction models at two stations in California. Finally, data were randomly divided into two parts: training (70%) and test (30%).
The entropy theory, based on statistical measurements introduced by Shannon (1948), was used to evaluate the significant input variables. In this theory, “information” indicates the level of stochastic. The entropy is calculated based on the following steps:
The G matrix is introduced as:
where N (i = 1, 2, 3 … … N) and M (j = 1, 2, 3 … M) represent the number of samples in each variable and the number of variables, respectively. Eq. 2 applied to normalize the G matrix:
where Oij, (Yij)Max, and (Yij)Min are the normalized, maximum, and minimum parameters, respectively. The next step is to calculate the probability of each parameter:
where Kij is the probability of each parameter.
where Ej is the information entropy and EW is the entropy weight (relative importance). A variable with a weight close to one indicates more importance.
Seven scenarios of inputs were investigated to assess their influence on DO concentration prediction, as described in Table 2. The input combinations are termed C1 to C7 in Table 2. The comparison of model performance for different input combinations helped find a suitable model based on data availability. Absolute correlation coefficient and entropy weight were used to select the input combinations (Figure 2). The first combination includes the four variables (TE, SC, pH, and Tu). Other combinations include fewer inputs to find a parsimonious model for its easy application in the data scarcity regions. For Station-A, the highest correlation coefficient and entropy were found for TE, 0.85 and 0.75, respectively. The SC showed the second-highest correlation of 0.46, but a low entropy of 0.11. The lowest entropy was recorded for Tu (0.03), which showed a correlation coefficient of 0.24. For Station B, the highest correlation coefficient and entropy were also noticed for TE, 0.88 and 0.72, respectively. The pH showed the second-highest correlation, 0.54, and the entropy of 0.17. In this study, data were randomly divided into two parts: training (70%) and test (30%). It should be noted that outlier data were removed by statistical methods, and also raw data were normalized for modeling.
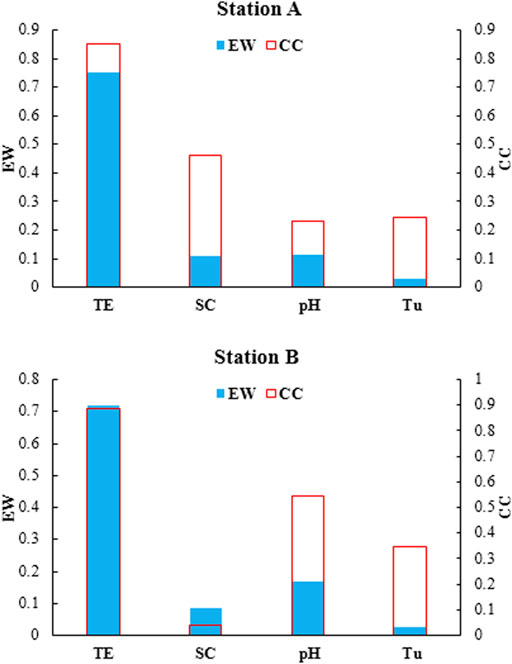
FIGURE 2. Absolute correlation coefficient and entropy weight for the input variables at Station-A and Station-B.
The NF model, which combines ANN and fuzzy logic, was designed by Jang (1993). The most important benefit of fuzzy logic is that it can give an intermediate answer to zero-one programming problems. It can be used when there is no complete understanding of the system’s physical and fundamental relationships. The NF structure is formed based on the membership functions of input and output, fuzzy rules, and the number of membership functions (Tanaka, 1997). Parameters related to membership functions need to be selected so that they are most consistent with the input–output data. Three algorithms, including SC, FCM, and GWO were used in this research to optimize the rules in the model training process. The flowchart of the proposed methodology is shown in Figure 3.
In the NF model, the number of rules to determine the optimal system increases with the number of membership functions and parameters of the model. Therefore, it is necessary to optimize the NF rules to reduce computational costs. To this end, the subtractive cluster is integrated with the NF system, where the modeling process consists of two stages. First, the fuzzy inference system is determined using the subtractive clustering method. Then, NF is used to adjust the fuzzy inference system and train it based on input–output data.
In subtractive clustering, each cluster’s center represents the behavior of a part of the data and represents a rule. Therefore, to determine the optimal structure, cluster information is used to determine the number of basic rules and membership functions. Choosing a small radius increase the number of rules and make the computations more complicated. In this study, the effective radius within the range of zero to one was selected based on the least root mean square error (RMSE).
FCM is a clustering technique where each point belongs to a cluster with a certain degree. Bezdek (1973) introduced this technique to improve the efficiency of previous clustering methods. In FCM, a certain number of different clusters describe the data clustering in multi-dimensional space. The FCM starts from an initial hypothesis as the centers of the clusters. Usually, this initial hypothesis is incorrect and does not specify the correct location of the centers. The FCM tries to link each point to one of the clusters by the level of its membership. The centers gradually move to their actual position in the data-set through repeated updating of the cluster centers and membership levels for clusters. These updates are based on decreasing the distance between each point to the center of the clusters. The least RMSE was the basis for selecting the optimal number of clusters in the FCM.
GWO is an evolutionary algorithm introduced by Mirjalili et al. (2014). This algorithm follows the leadership hierarchy structure, which consists of an average of 5–12 wolves. The leadership hierarchy is based on four types of grey wolves, namely, alpha (α), beta (β), delta (δ), and omega (ω). The order of the solutions in this algorithm after alpha is considered β, δ, and ω. Therefore, the major stages of grey wolf hunting are as follows. The alpha wolf (α) plays the main role which includes hunting, sleeping, and waking hours. The β is responsible for performing alpha commands over the pack. On the other hand, ω is seen as a victim in the group and therefore follows other wolves and can eat after all of them. Finally, δ wolves must follow β and α wolves, while they dominate ω wolves. Figure 4 shows the diagram of GWO.
Grey wolf hunting behavior modeling assumes that alpha, beta, and delta have sufficient knowledge of prey position. Therefore, three optimal solutions, including alpha, beta, and delta are obtained, and the other solutions (wolves) must change their position based on the optimal solutions.
The coupled NF and GWO were developed as NF-GWO to predict the DO concentration. In the NF-GWO model, GWO optimizes NF parameters for best performance. NF-GWO consists of five layers. The first layer’s nodes represent the input variables. The second and third layers represent the membership functions for the input variables and the fuzzy logic rules, respectively. In the fourth layer, Takagi-Sugeno-Kang’s model adjusts the performance of the nodes. Finally, the DO concentration is predicted in the last layer (output layer). During the training phase, the GWO generates the initial population of wolves and updates the solutions based on the DO concentration prediction accuracy. The solutions are continuously updated unless the algorithm reached the maximum number of iterations or errors less than the sill value. The parameters found in the last step are transferred to the structure of the NF model. The initial population and the number of iterations for each combination were determined through the trial-and-error method. The initial population and the number of iterations are listed in the structure row of the results table. Population values ranged from 20 to 40 and iterations from 1,000 to 1,500.
Four statistical metrics named root mean squared error (RMSE), mean absolute error (MAE) correlation coefficient (CC), and Willmott Index (WI), were applied to assess the performance of the applied models in predicting DO. Among the four metrics, two (MAE and RMSE) were used to evaluate the error in the models, and two (CC and WI) were utilized to assess the models’ ability to simulate the temporal pattern of observed DO. They are defined as:
where Oi and Pi are observed, and the predicted DO value for ith observations.
In order to assess the performance of the proposed hybrid model, its results have been compared with the results of the standalone NF model. The hybrid models are adopted in order to adjust the hyper-parameters of the standalone model. In this study, different optimization algorithms including GWO, SC, and FCM are used to adjust the parameters of the NF model where these algorithms examine different regions of the search space which has several local minima, and then minimize the range of search to the region that includes the global minima.
Obtained results at Station-A and Station-B are presented in Tables 3 and 4, respectively. The results at Station-A showed large variability in model performance for different input combinations. All the models, except NF-GWO, also showed different performances in terms of different metrics. For example, NF for input combination, C7 showed the best performance based on MAE and RMSE, while it showed the best performance in terms of CC and WI with input combination C4. Similar inconsistency was noticed for NF-SC and NF-FCM. However, NF-GWO performed best in terms of all metrics for first input combination, C1 (MAE = 0.250 mg/L, RMSE = 0.320 mg/L, CC = 0.869, and WI = 0.908). Comparison model performance revealed the better performance of NF-GWO for all input combinations compared to other models. Therefore, NF-GWO for the input combination of C1 can be considered the best model for predicting DO at Station-A. Different models showed the worst performance for different input combinations. For example, NF-SC performed the worst for C1 while NF-FCM performed the worst for C5. Overall, NF-SC performed the worst for most of the input combinations and in terms of different metrics.
The performance of the models at Station-B was found very similar to that at Station-A (Table 4). Large variability in model performance for different input combinations was also noticed at this station. Only NF-GWO showed consistent performance in terms of all metrics. It also showed better performance compared to other models for all input combinations. Comparison of model performance for different input combinations revealed best performance of NF-GWO for C1 (MAE = 0.346 mg/L, RMSE = 0.413 mg/L, CC = 0.563, and WI = 0.713) at this station. Like Station-A, NF-SC showed the worst performance at this station for most of the input combinations. The C1 scenario considers all variables (TE, SC, Tu, and pH) as inputs, while other scenarios omit one to more variables. The better performance of NF-GWO for C1 indicates all variables are required to consider for better prediction of DO because the use of a few water quality parameters may drive to missing the required information about the effect of these parameters on dissolved oxygen concentration. Therefore, to obtain more realistic results and in order to investigate the effect of each water quality parameter on DO concentration, all possible input combinations should be considered.
The observed and predicted DO by different models for different input combinations at Station-A and Station-B are presented using box–-whisker plots in Figures 5, 6, respectively. A box with a whisker presents mean (horizontal line within the box), 25th and 75th percentiles (lower and upper bound of the box), range without outliers (spread of the whiskers), and outliers (dots). Therefore, a comparison of the whisker–boxes provides a model performance assessment in terms of median, range, and outliers. The box plot of different models was found similar to the observed one for different input combinations. For example, the whisker–box of NF-GWO for C1 was found more similar to the observed one, while the whisker–box of NF was found more similar to the observed one for C5. A comparison of whisker–box plots of all models for all input combinations revealed the best performance of NF-GWO for C1. The results were found a bit different at Station-B. The best performance was noticed for NF-FCM with C4. It was able to replicate the median, interquartile range, and the range of the data more accurately. However, the simulated data by NF-FCM for C4 was found a bit right-skewed compared to observed data. The NF-GWO for C1, which showed the best performance at Station-A, also performed well at this station but underestimated the DO values.
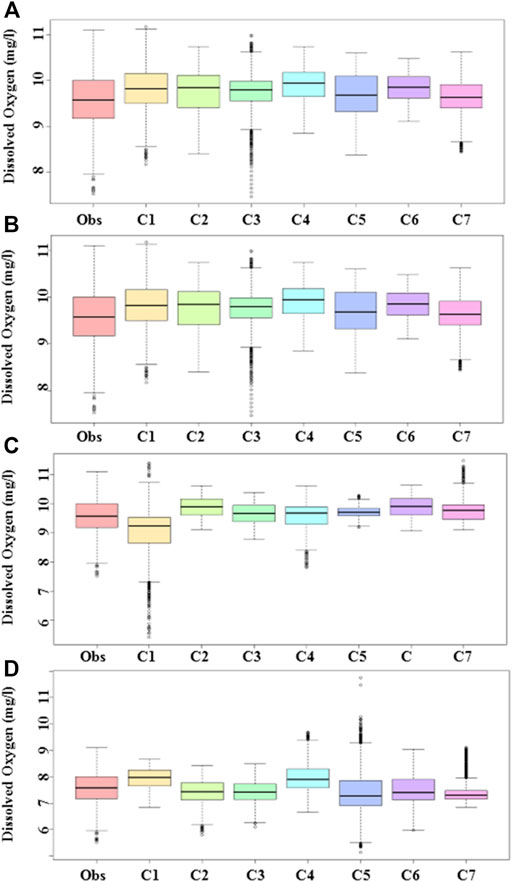
FIGURE 5. Box-whisker plot showing the relative performance of (A) NF-GWO; (B) NF; (C) NF-SC; and (D) NF-FCM models in the test phase at Station-A.
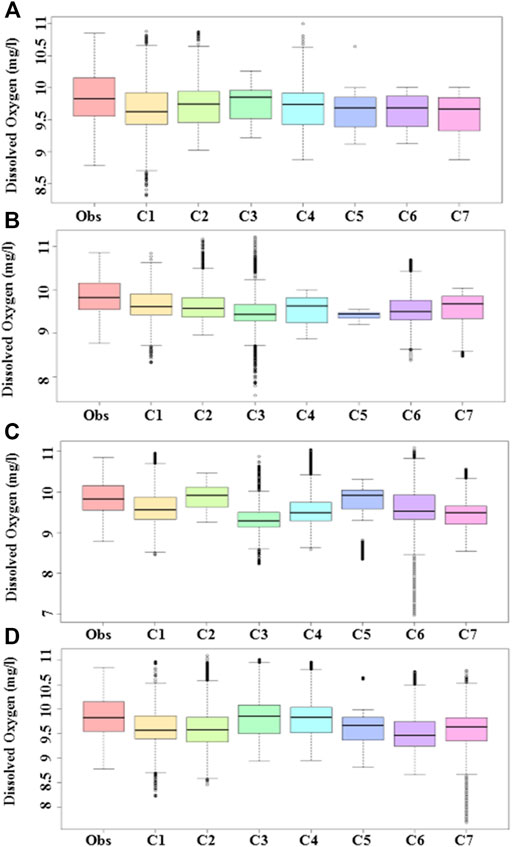
FIGURE 6. Box-whisker plot showing the relative performance of (A) NF-GWO; (B) NF; (C) NF-SC; and (D) NF-FCM models in the test phase at Station-B.
The scatter plots of observed and predicted DO are presented in Figures 7, 8, respectively. Different plots in each figure show the performance of a model for different input combinations. Different colors are used to show the model performance for different input combinations. The scatter plots at Station-A (Figure 7) showed better performance of NF-GWO for C1, NF for C1, NF-SC for both C1 and C2, and NF-FCM for C2. Overall, most of the models showed better performance for the input combination (C1). The performance comparison of the models revealed a much higher performance of NF-GWO compared to other models. The NF-GWO for C1 replicated the observed DO with R2 (determination coefficient) = 0.75. The NF-GWO predicted DO for C1 was found more aligned to the plots’ diagonal line compared to other models. Though an underprediction for high values and overprediction for low values was noticed, the model could still predict most of the high and low values.
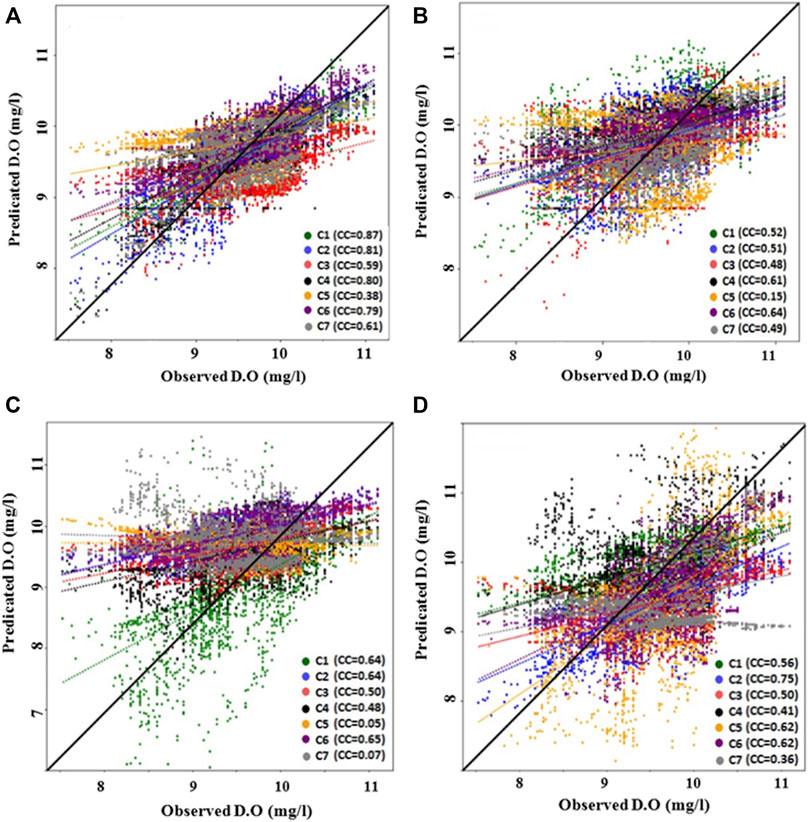
FIGURE 7. Scatter plot of observed and predicted dissolved oxygen by (A) NF-GWO; (B) NF; (C) NF-SC; and (D) NF-FCM models during the testing phase at Station-A.
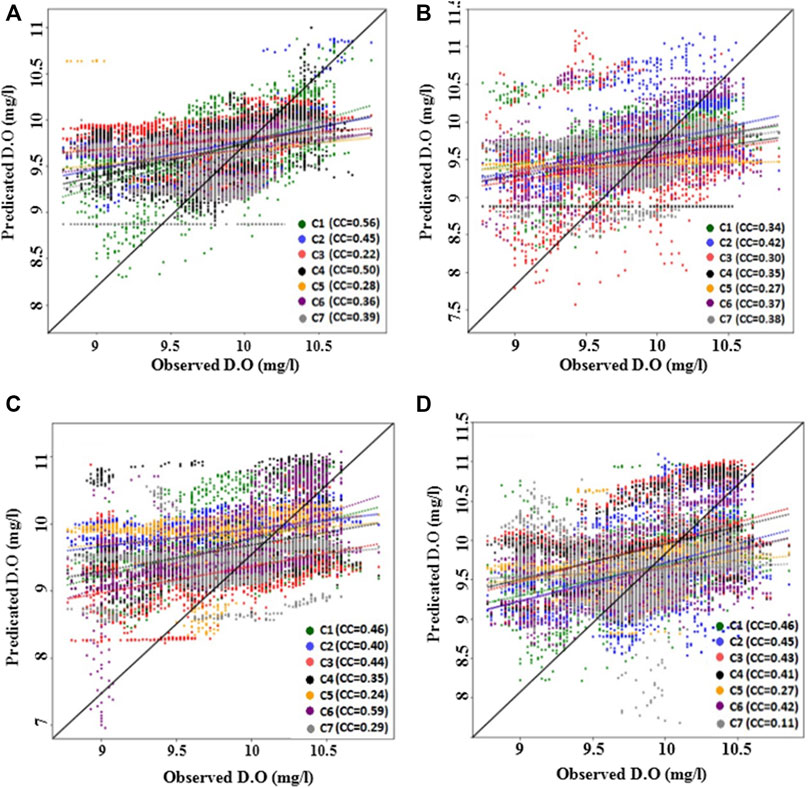
FIGURE 8. Scatter plot of observed and predicted dissolved oxygen by (A) NF-GWO; (B) NF; (C) NF-SC; and (D) NF-FCM models during the testing phase at Station-B.
The scatter plots of the models’ predictions at Station-B (Figure 8) showed more inconsistency than at Station-A. The NF-GWO performed best for C1, NF for C2, NF-SSC for C6, and NF-FCM for C1 at this station. All models showed a lower performance at this station compared to that found at Station-A. However, NF-GWO for C1 showed the best performance at this station like Station-A. Though it underestimated many observed values, it was most aligned to the scatter plot’s diagonal line compared to other models for different input combinations.
The capability of the models to reconstruct the distribution of observed DO was estimated using violin plots. The plots for the models at Station-A and Station-B are presented in Figures 9, 10, respectively. If the shape of a model’s violin is similar to the violin of observed DO, the model is considered good. The violins of different models’ predicted DO showed large variability in shape and size (Figure 9). None of the models was able to replicate the shape of the observed violin accurately. Overall, the violin of NF-GWO for C1 was most similar to the violin of the observed data. The dissimilarity with the observed violin was more for NF-FCM. The dissimilarity between models’ predicted and observed violins was more at Station-B (Figure 10) than that noticed at Station-A. In most of the cases, the models failed to reconstruct the distribution of observed DO. Overall, NF-GWO for C1 has the best performance at this station.
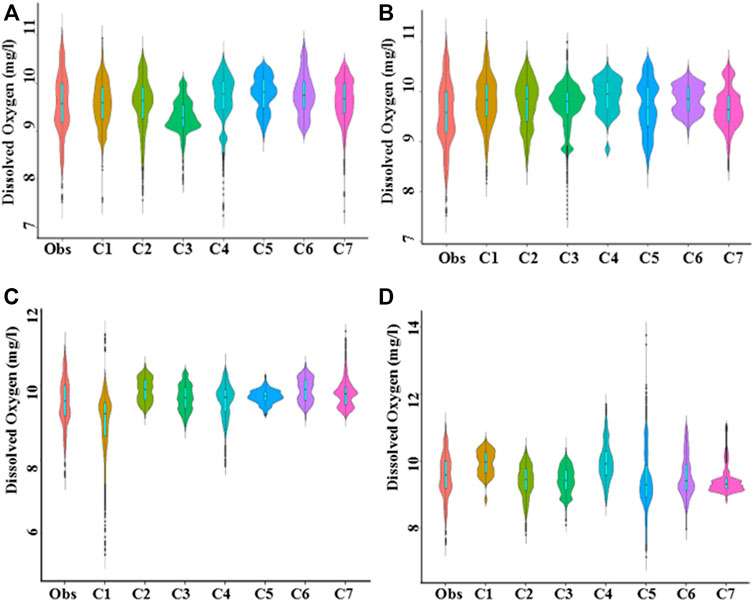
FIGURE 9. Split–violin plot showing the relative performance of (A) NF-GWO; (B) NF; (C) NFSC; and (D) NF-FCM models in replicating probability distribution of observed data during testing phase at Station-A.
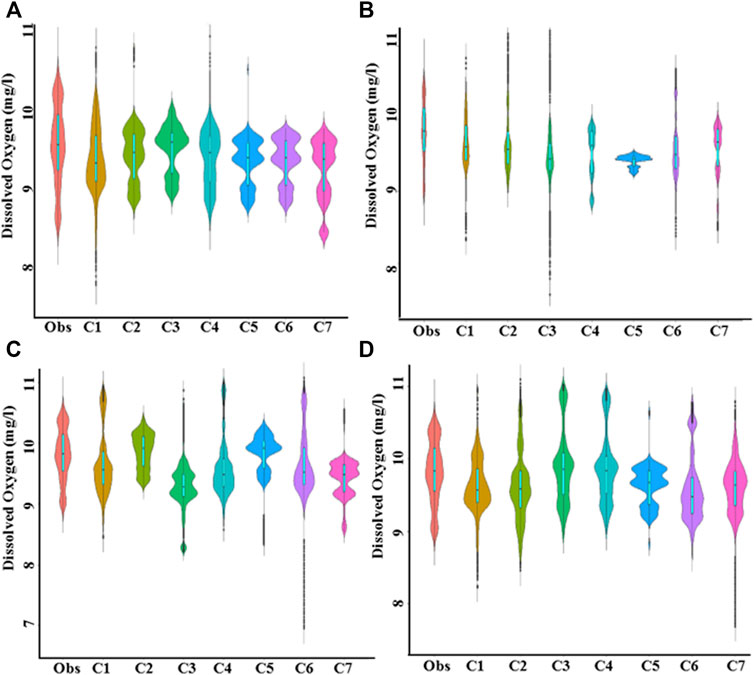
FIGURE 10. Split–violin plot showing the relative performance of (A) NF-GWO; (B) NF; (C) NF-SC; and (D) NF-FCM models in replicating the probability distribution of observed data during the testing phase at Station-B.
Finally, the Taylor diagram was developed to show the relative accuracy of model predictions. Taylor diagram graphically compared association, the similarity invariance, and the mean difference between observed and model output. Therefore, it is considered a composite way to compare model performance. Taylor diagrams of the models for Station-A and Station-B are presented in Figures 11, 12, respectively. The black dot on the diagram’s x-axis represents observed data, while different colors present model performance for different input combinations. A model nearest to the observed point indicates better performance. The Taylor diagram also showed large variability in models’ performance for different input combinations at Station-A (Figure 11). However, all the models, except NF-FCM, performed best for the first input combination (C1). The NF-FCM performed best for C6. The NF-GWO models were nearest to the observation compared to other models for different input combinations. Overall, the results identified NF-GWO for C1 as the best model at Station-A. Inconsistency in model performance was noticed at Station-B (Figure 12), similar to that noticed using the scatter plot and the box plot. The NF-GWO showed the best performance for C1, NF for C2, NF-SC for C6, and NF-FCM for C1. The performance of the models at Station-B was poor compared to that found at Station-A. However, the best model was still NF-GWO for C1 at this station. It showed a correlation of 0.58 and an RMSE of less than 0.40. The variability of predicted DO by NF-GWO for C1 was 0.38, which was very near the observed DO variability (0.44).
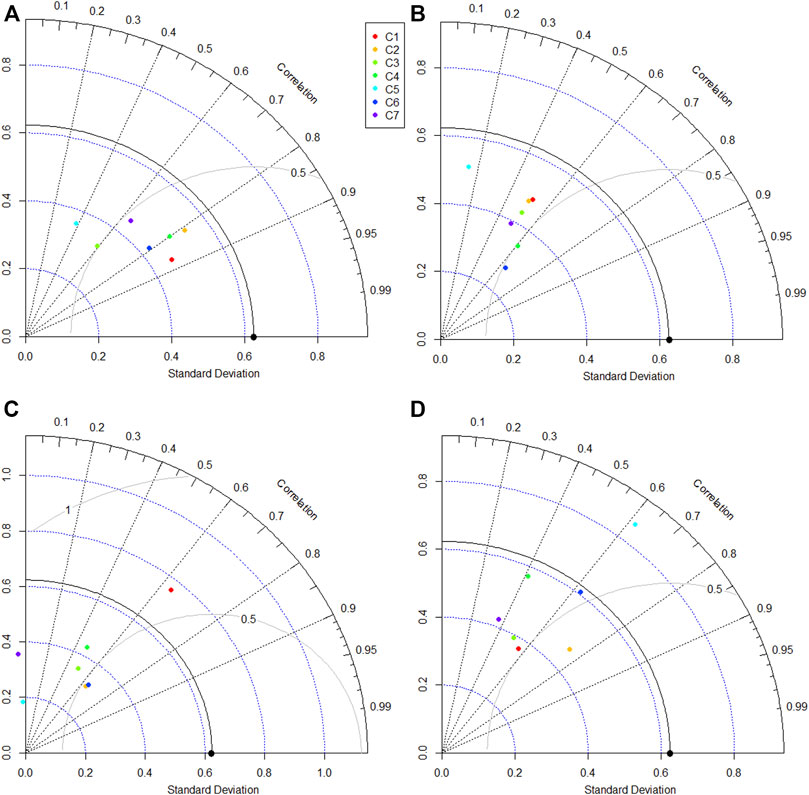
FIGURE 11. Taylor diagram of the models used to compare the capability of (A) NF-GWO; (B) NF; (C) NF-SC; and (D) NF-FCM models in the testing phase at Station-A.
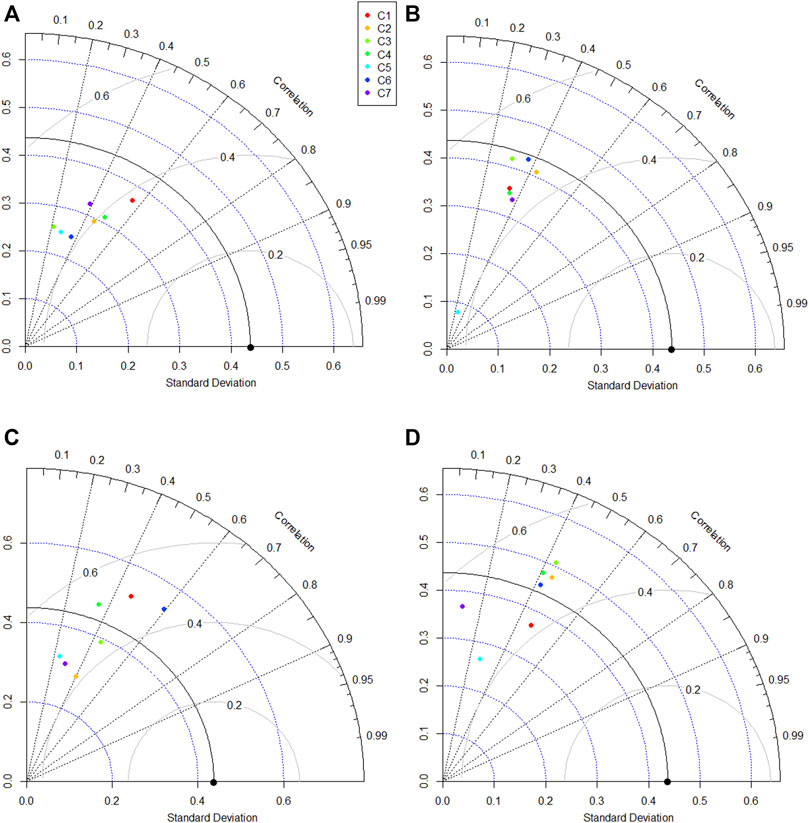
FIGURE 12. Taylor diagram of the models used to compare the capability of (A) NF-GWO; (B) NF; (C) NF-SC; and (D) NF-FCM models in the testing phase at Station-B
The performance of NF-GWO compared to standalone NF was improved by 24.2–66.2% and 14.9–31.2% in terms of CC and WI for different input combinations. The MAE and RMSE of the NF model were reduced using the NF-GWO model by 9.9–46.0% and 8.9–47.5%, respectively. A similar improvement in DO concentration prediction was achieved using NF-GWO models compared to NF-SC and NF-FCM for most input combinations. However, the improvement was not consistent in terms of all statistics, as mentioned earlier. The performance of NF-GWO compared to NF-SC was improved for all input combinations except for C3 at Station-A. The improvement in MAE and RMSE was in the range of 7.7–60.7 and 6.8 to 60.4, respectively. However, MAE and RMSE were decreased for C3 by 5.7% and 2.7%. Significant improvement in NF-GWO prediction compared to NF-FCM was also noticed for all input combinations, except C3 and C5 at Station-A. The MAE and RMSE were reduced by 3.4–50.3% and 10.1–49.5%, while CC and WI were increased by 7.9–94.6% and 4.6–40.8%. The most significant improvement in NF-GWO performance was for C1. The MAE, RMSE, CC, and WI values of NF-GWO prediction were improved by 46.0, 47.5, 66.1, and 31.2% compared to standalone NF, 60.7, 60.3, 35.9, and 32.9% compared to NF-SC, and 50.4, 49.5, 54.4 and 40.5% compared to NF-FCM at Station-A.
Improvement in DO prediction using NF-GWO was also noticed compared to other models for most of the input combinations at Station-B. However, the improvement was not as great as it was noticed for Station-A. For the best input combination (C1), the improvement in NF-GWO prediction compared to NF was 14.9, 15.7, 66.1, and 22.9% in MAE, RMSE, CC, and WI, respectively. Those values were 20.3, 21.5, 21.3 and -5.2%, respectively for NF-SC, and 12.4, 11.9, 21.1, and 11.1%, respectively, for NF-FCM. Here, it should be noted that, like Station-A, the biggest improvement in the NF-GWO model was not for C1 for all input combinations. For example, the most significant improvement in NF-GWO compared to NF in MAE, RMSE, and WI were for C4. However, the highest improvement in CC was for C1.
Overall, the results revealed that only NF-GWO for C1 showed consistent DO concentration prediction improvement in all statistics. It means all the statistical metrics used in this study showed better performance of NF-GWO for C1. The NF-GWO also showed improvement in prediction for almost all input combinations. The best performance of NF-GWO for C7 was also consistent for both locations. Therefore, the results presented in this study revealed the ability of the GWO to enhance the performance of the standalone NF model and this agrees with results obtained by Ewees and Elaziz (2018) and (Dehghani et al., 2019). In addition, the results of the proposed model undoubtedly establish the efficacy of the NF-GWO model in predicting DO concentration.
NF integrates neural networks and fuzzy systems to join their advantages for a better solution to complex problems. The capability of NF to learn data patterns using fuzzy rules has made it highly adaptable to different kinds of data, and thus, superior to many other AI algorithms in solving a wide range of problems from different fields (Atmaca et al., 2001). However, the major drawback of NF is that its performance significantly is susceptible to the selection and optimization of the input variable’s fuzzy membership function. In this study, it was solved by integrating NF with optimization algorithms. Therefore, the performance of NF-GWO was found better than the other version of NFs (Sremac et al., 2019). The major challenge in selecting and adjusting NF hyperparameters is finding the global optimum solution (Negi et al., 2021).
Among varieties of optimization algorithms developed so far, the GWO, a metaheuristics optimization technique developed based on wolf behavior for preying, has shown its capability in solving complex optimization problems. This population-based or trajectory-based algorithm can search for a solution over a large complex space, thus less susceptible to being trapped in local minima. The recent review of GWO by Negi et al. (2021) showed the capability of GWO in optimizing a wide variety of engineering problems. The optimization of NF intern parameters using GWO has made the NF-GWO highly capable of predicting DO concentration.
It should be noted that an AI algorithm’s performance depends on the problem to be solved and the kinds of input data used as predictors. Similarly, a particular optimization algorithm is always not the best for the optimization of an AI model hyperparameters. Different optimization algorithms can perform differently in the optimization of an AI algorithm in solving different problems. In this study, optimization of NF parameters using GWO made it highly capable in DO prediction. However, it does not guarantee that the NF-GWO model performs well in predicting other hydrological variables or the prevision of DO in other regions. Therefore, it is always suggested to compare different AI and optimization algorithms’ performance to find the best empirical model for selecting the best model.
The sensitivity analysis of different input variables was conducted through the evaluation of best models’ (NF-GWO) performance for different input combinations. First, the performance for C1 with the three input models (C2 to C4) was analyzed. The model performance for C2 to C4 was reduced due to the drop of an input variable. The highest drop in prediction accuracy was for C3 when the pH was dropped from the input combination. The MAE and RMSE of C3 were 90 and 76.6% higher, and CC and WI were 32.1 and 27.6% lower than C1 at Station-A. A similar result was also obtained at Station-B. The increase in prediction error was the highest for C3 compared to the other three-input models. This could be attributed to that the pH has a valuable impact on DO concentration and the absence of pH in C3 caused a large drop in model prediction accuracy. Therefore, pH can be considered the most sensitive input after TE in predicting DO concentration. The analysis of two input NF-GWO models’ performance (C5 to C7) with the NF-GWO model for C1 showed the highest decrease in model performance for C5 at both stations. The results indicate that the reduction of prediction accuracy was due to the absence of Tur as input. This indicates Tur is the third most crucial variable for the prediction of DO concentration. Overall and according to the sensitivity of DO prediction accuracy to different input variables, it can be said that the TE has the highest influence on DO, followed by the pH, Tur, and SC variables, respectively.
The present study assessed the ability of hybrid NF models in predicting DO concentration at two stations located in California. Different combinations of water quality parameters including temperature, specific conductivity, turbidity, and pH parameters were formulated and used as input to these models. Entropy and the correlation coefficient were used to evaluate these parameters in order to obtain the optimum input combination. The result showed that the best-input combinations are four input variables, namely, TE, SC, Tu, and pH. Among the four models developed in this study, only the NF-GWO showed consistent performance for all input combinations at both stations in terms of all metrics. The NF-GWO attained the highest performance (MAE = 0.256 mg/L, RMSE = 0.320 mg/L, CC = 0.869, and WI = 0.908) at Station-A and (MAE = 0.346 mg/L, RMSE = 0.413 mg/L, CC = 0.563, and WI = 0.713) at Station B. Also, the performance of NF-GWO compared to standalone NF was improved by 24.2–66.2% and 14.9–31.2% in terms of CC and WI for different input combinations and the MAE and RMSE of the NF model were reduced using the NF-GWO model by 9.9–46.0% and 8.9–47.5%, respectively, for Station-A, while for Station B, the improvement in NF-GWO prediction compared to NF was 14.9, 15.7, 66.1, and 22.9% in MAE, RMSE, CC, and WI, respectively. The sensitivity analysis of input parameters revealed that water temperature followed by pH and specific conductivity is the most important for DO concentration prediction in the study area. Using direct methods to measure DO concentration is costly and time-consuming. The hybrid AI models can be used for reliable estimation of DO concentration in such a situation. Finally, although the developed hybrid AI models in this study achieve high performance, there are still some limitations due to practical factors. The most important one is the data used, where the data of only 1 year was used in the study. Therefore, the capability of the suggested model should be evaluated using long-term data. In addition, other metaheuristics optimization algorithms can be used for the optimization of the NF model to evaluate their relative performance in improving prediction accuracy.
The original contributions presented in the study are included in the article/Supplementary Material; further inquiries can be directed to the corresponding authors.
All the authors contributed to conceptualizing and designing of the study. Data were gathered by SSS; the modeling was carried out by SM, AM, and SS; an initial draft of themanuscript was prepared by SSS, AM, SA, and the manuscript was repeatedly revised to generate the final version by SS and EM; the work was supervised by NA.
The authors declare that the research was conducted in the absence of any commercial or financial relationships that could be construed as a potential conflict of interest.
All claims expressed in this article are solely those of the authors and do not necessarily represent those of their affiliated organizations, or those of the publisher, the editors, and the reviewers. Any product that may be evaluated in this article, or claim that may be made by its manufacturer, is not guaranteed or endorsed by the publisher.
Abba, S., Hadi, S. J., and Abdullahi, J. (2017). River water modelling prediction using multi-linear regression, artificial neural network, and adaptive neuro-fuzzy inference system techniques. Procedia Comput. Sci. 120, 75–82. doi:10.1016/j.procs.2017.11.212
Abba, S., Hadi, S. J., Sammen, S. S., Salih, S. Q., Abdulkadir, R., Pham, Q. B., et al. (2020). Evolutionary computational intelligence algorithm coupled with self-tuning predictive model for water quality index determination. J. Hydrol. 587, 124974. doi:10.1016/j.jhydrol.2020.124974
Abba, S. I., Abdulkadir, R. A., Sammen, S., S., Usman, A. G., Meshram, S G., Malik, A., et al. (2021). Comparative implementation between neuro-emotional genetic algorithm and novel ensemble computing techniques for modelling dissolved oxygen concentration. Hydrol. Sci. J. 66 (10), 1584–1596. doi:10.1080/02626667.2021.1937179
Ahmed, A. M., and Shah, S. M. A. (2017). Application of adaptive neuro-fuzzy inference system (ANFIS) to estimate the biochemical oxygen demand (BOD) of Surma River. J. King Saud Univ. - Eng. Sci. 29 (3), 237–243. doi:10.1016/j.jksues.2015.02.001
Antanasijević, D., Pocajt, V., Perić-Grujić, A., and Ristić, M. (2019). Multilevel split of high-dimensional water quality data using artificial neural networks for the prediction of dissolved oxygen in the Danube River. Neural comput. Appl. 32, 3957–3966. doi:10.1007/s00521-019-04079-y
Atmaca, H., Cetisli, B., and Yavuz, H. S. (2001). “The comparison of fuzzy inference systems and neural network approaches with ANFIS method for fuel consumption data,” in Second international conference on electrical and electronics engineering papers ELECO.
Banadkooki, F. B., Ehteram, M., Panahi, F., Sammen, S. S., Othman, F. B., El-Shafie, A., et al. (2020). Estimation of total dissolved solids (TDS) using new hybrid machine learning models. J. Hydrol. 587, 124989. doi:10.1016/j.jhydrol.2020.124989
Bezdek, J. C. (1973). Cluster validity with fuzzy sets. J. Cybern. 3 (3), 58–73. doi:10.1080/01969727308546047
Cao, W., Huan, J., Liu, C., Qin, Y., and Wu, F. (2019). A combined model of dissolved oxygen prediction in the pond based on multiple-factor analysis and multi-scale feature extraction. Aquac. Eng. 84, 50–59. doi:10.1016/j.aquaeng.2018.12.003
Chen, W.-B., and Liu, W.-C. (2014). Artificial neural network modeling of dissolved oxygen in reservoir. Environ. Monit. Assess. 186 (2), 1203–1217. doi:10.1007/s10661-013-3450-6
Dehghani, M., Riahi-Madvar, H., Hooshyaripor, F., Mosavi, A., Shamshirband, S., Zavadskas, E. K., et al. (2019). Prediction of hydropower generation using grey wolf optimization adaptive neuro-fuzzy inference system. Energies 12, 289. doi:10.3390/en12020289
Ebtehaj, I., Sammen, S. S., Lariyah, M. S., Malik, A., Sihag, P., Al-Janabi, A. M. S., et al. (2021). Prediction of daily water level using new hybridized GS-GMDH and ANFIS-FCM models. Eng. Appl. Comput. Fluid Mech. 15 (1), 1343–1361. doi:10.1080/19942060.2021.1966837
Elkiran, G., Nourani, V., Abba, S., and Abdullahi, J. (2018). Artificial intelligence-based approaches for multi-station modelling of dissolve oxygen in river. Glob. J. Environ. Sci. Manag. 4 (4), 439–450. doi:10.22034/GJESM.2018.04.005
Elkiran, G., Nourani, V., and Abba, S. (2019). Multi-step ahead modelling of river water quality parameters using ensemble artificial intelligence-based approach. J. Hydrol. 577, 123962. doi:10.1016/j.jhydrol.2019.123962
Ellenburg, W. L., Cruise, J., and Singh, V. P. (2018). The role of evapotranspiration in streamflow modeling–An analysis using entropy. J. Hydrol. 567, 290–304. doi:10.1016/j.jhydrol.2018.09.048
Ewees, A. A., and Elaziz, M. A. (2018). Improved adaptive neuro-fuzzy inference system using gray wolf optimization: A case study in predicting biochar yield. J. Intell. Syst. 29 (1), 924–940. doi:10.1515/jisys-2017-0641
Hadi, S. J., Abba, S. I., Sammen, S. S., Salih, S. Q., Al-Ansari, N., and Yaseen, Z. M. (2019). Non-linear input variable selection approach integrated with non-tuned data intelligence model for streamflow pattern simulation. IEEE Access 7, 141533–141548. doi:10.1109/ACCESS.2019.2943515
Hameed, M., Sharqi, S. S., Yaseen, Z. M., Afan, H. A., Hussain, A., and Elshafie, A. (2017). Application of artificial intelligence (AI) techniques in water quality index prediction: a case study in tropical region, Malaysia. Neural comput. Appl. 28 (1), 893–905. doi:10.1007/s00521-016-2404-7
Jang, J.-S. (1993). ANFIS: adaptive-network-based fuzzy inference system. IEEE Trans. Syst. Man. Cybern. 23 (3), 665–685. doi:10.1109/21.256541
Kisi, O., Alizamir, M., and Gorgij, A. D. (2020). Dissolved oxygen prediction using a new ensemble method. Environ. Sci. Pollut. Res. 27, 9589–9603. doi:10.1007/s11356-019-07574-w
Liu, Y., Zhang, Q., Song, L., and Chen, Y. (2019). Attention-based recurrent neural networks for accurate short-term and long-term dissolved oxygen prediction. Comput. Electron. Agric. 165, 104964. doi:10.1016/j.compag.2019.104964
Malik, A., Tikhamarine, Y., Al-Ansari, N., Shahid, S., Sekhon, H. S., Pal, R. K., et al. (2021). Daily pan-evaporation estimation in different agro-climatic zones using novel hybrid support vector regression optimized by Salp swarm algorithm in conjunction with gamma test. Eng. Appl. Comput. Fluid Mech. 15, 1075–1094. doi:10.1080/19942060.2021.1942990
Maroufpoor, S., Bozorg-Haddad, O., and Maroufpoor, E. (2020). Reference evapotranspiration estimating based on optimal input combination and hybrid artificial intelligent model: Hybridization of artificial neural network with grey wolf optimizer algorithm. J. Hydrol. 588, 125060. doi:10.1016/j.jhydrol.2020.125060
Maroufpoor, S., Maroufpoor, E., Bozorg-Haddad, O., Shiri, J., and Yaseen, Z. M. (2019a). Soil moisture simulation using hybrid artificial intelligent model: Hybridization of adaptive neuro fuzzy inference system with grey wolf optimizer algorithm. J. Hydrol. 575, 544–556. doi:10.1016/j.jhydrol.2019.05.045
Maroufpoor, S., Sanikhani, H., Kisi, O., Deo, R. C., and Yaseen, Z. M. (2019b). Long-term modelling of wind speeds using six different heuristic artificial intelligence approaches. Int. J. Climatol. 1, 3543–3557. doi:10.1002/joc.6037
Meidute-Kavaliauskiene, I., Jabehdar, M. A., Davidavičienė, V., Ghorbani, M. A., and Sammen, S. S. (2021). A simple way to increase the prediction accuracy of hydrological processes using an artificial intelligence model. Sustainability 13, 7752. doi:10.3390/su13147752
Mirjalili, S., Mirjalili, S. M., and Lewis, A. (2014). Grey wolf optimizer. Adv. Eng. Softw. 69, 46–61. doi:10.1016/j.advengsoft.2013.12.007
Mohammadi, B., Linh, N. T. T., Pham, Q. B., Ahmed, A. N., Vojtekova, J., Guan, Y., et al. (2020). Adaptive neuro-fuzzy inference system coupled with shuffled frog leaping algorithm for predicting river streamflow time series. Hydrol. Sci. J. 65 (10), 1738–1751. doi:10.1080/02626667.2020.1758703
Negi, G., Kumar, A., Pant, S., and Ram, M. (2021). GWO: a review and applications. Int. J. Syst. Assur. Eng. Manag. 12 (1), 1–8. doi:10.1007/s13198-020-00995-8
Nourani, V., Elkiran, G., and Abba, S. (2018). Wastewater treatment plant performance analysis using artificial Intelligence–an ensemble approach. Water Sci. Technol. 78 (10), 2064–2076. doi:10.2166/wst.2018.477
Nourani, V., Elkiran, G., and Abdullahi, J. (2019). Multi-station artificial Intelligence based ensemble modeling of reference evapotranspiration using pan evaporation measurements. J. Hydrology 577, 123958. doi:10.1016/j.jhydrol.2019.123958
Pham, D. T., Ho, L., Espinoza-Palacios, J., Arevalo-Durazno, M., Van Echelpoel, W., and Goethals, P. (2020). Generalised linear models for prediction of dissolved oxygen in a waste stabilisation pond. Water 12, 1930. doi:10.3390/w12071930
Pham, Q. B., Abba, S. I., Usman, A. G., Linh, N. T. T., Gupta, V., Malik, A., et al. (2019). Potential of hybrid data-intelligence algorithms for multi-station modelling of rainfall. Water Resour. manage. 33 (15), 5067–5087. doi:10.1007/s11269-019-02408-3
Pham, Q. B., Mohammadpour, R., Linh, N. T. T., Mohajane, M., Pourjasem, A., Sammen, S. S., et al. (2021a). Application of soft computing to predict water quality in wetland. Environ. Sci. Pollut. Res. 28, 185–200. doi:10.1007/s11356-020-10344-8
Pham, Q. B., Sammen, S. S., Abba, S. I., Mohammadi, B., Shahid, S., and Abdulkadir, R. A. (2021b). A new hybrid model based on relevance vector machine with flower pollination algorithm for phycocyanin pigment concentration estimation. Environ. Sci. Pollut. Res. 28, 32564–32579. doi:10.1007/s11356-021-12792-2
Pourabadeh, A., Baharinikoo, L., Shojaei, S., Mehdizadeh, B., Davoodabadi Farahani, M., Shojaei, S., et al. (2020). Experimental design and modelling of removal of dyes using nano-zero-valent iron: a simultaneous model. Int. J. Environ. Anal. Chem. 100 (15), 1707–1719. doi:10.1080/03067319.2019.1657855
Radwan, M., Willems, P., El‐Sadek, A., and Berlamont, J. (2003). Modelling of dissolved oxygen and biochemical oxygen demand in river water using a detailed and a simplified model. Int. J. River Basin Manag. 1 (2), 97–103. doi:10.1080/15715124.2003.9635196
Rahman, A., Dabrowski, J., and McCulloch, J. (2020). Dissolved oxygen prediction in prawn ponds from a group of one step predictors. Inf. Process. Agric. 7 (2), 307–317. doi:10.1016/j.inpa.2019.08.002
Sammen, S. S., Ehteram, M., Abba, S. I., Abdulkadir, R. A., Ahmed, A. N., and El-Shafie, A. (2021). A new soft computing model for daily streamflow forecasting. Stoch. Environ. Res. Risk Assess. 35, 2479–2491. doi:10.1007/s00477-021-02012-1
Seyedzadeh, A., Maroufpoor, S., Maroufpoor, E., Shiri, J., Bozorg-Haddad, O., and Gavazi, F. (2020). Artificial intelligence approach to estimate discharge of drip tape irrigation based on temperature and pressure. Agric. Water Manag. 228, 105905. doi:10.1016/j.agwat.2019.105905
Shannon, C. E. (1948). A mathematical theory of communication. Bell Syst. Tech. J. 27 (3), 623–656. doi:10.1002/j.1538-7305.1948.tb00917.x
Shojaei, S., Shojaei, S., Nouri, A., and Baharinikoo, L. (2021). Application of chemometrics for modeling and optimization of ultrasound-assisted dispersive liquid-liquid microextraction for the simultaneous determination of dyes. Npj Clean. Water 4, 23. doi:10.1038/s41545-021-00113-6
Shojaei, S., and Shojaei, S. (2019). Optimization of process variables by the application of response surface methodology for dye removal using nanoscale zero-valent iron. Int. J. Environ. Sci. Technol. (Tehran). 16 (8), 4601–4610. doi:10.1007/s13762-018-1866-9
Shojaei, S., Shojaei, S., and Pirkamali, M. (2019). Application of box–behnken design approach for removal of acid black 26 from aqueous solution using zeolite: Modeling, optimization, and study of interactive variables. Water Conserv. Sci. Eng. 4 (1), 13–19. doi:10.1007/s41101-019-00064-7
Singh, V. P. (2013a). Entropy theory and its application in environmental and water engineering. Oxford, United Kingdom: John Wiley & Sons. doi:10.1002/9781118428306
Singh, V. P. (2013b). SCS-CN method revisited using entropy theory. Trans. ASABE 56 (5), 1805–1820. doi:10.13031/trans.56.10236
Sremac, S., Kazimieras Zavadskas, E., Matić, B., Kopić, M., and Stević, Ž. (2019). Neuro-fuzzy inference systems approach to decision support system for economic order quantity. Econ. research-Ekonomska istraživanja 32 (1), 1114–1137. doi:10.1080/1331677X.2019.1613249
Tanaka, K. (1997). An introduction to fuzzy logic for practical applications. New York, NY: Springer.
Wen, X., Fang, J., Diao, M., and Zhang, C. (2013). Artificial neural network modeling of dissolved oxygen in the Heihe River, Northwestern China. Environ. Monit. Assess. 185 (5), 4361–4371. doi:10.1007/s10661-012-2874-8
Wu, J., and Yu, X. (2021). Numerical investigation of dissolved oxygen transportation through a coupled SWE and Streeter–Phelps model. Math. Probl. Eng. 2021, 6663696. doi:10.1155/2021/6663696
Xiao, Z., Peng, L., Chen, Y., Liu, H., Wang, J., and Nie, Y. (20172017). The dissolved oxygen prediction method based on neural network. Complexity, 1–6. doi:10.1155/2017/4967870
Yang, J., Shojaei, S., and Shojaei, S. (2022). Removal of drug and dye from aqueous solutions by graphene oxide: Adsorption studies and chemometrics methods. Npj Clean. Water 5 (1), 5. doi:10.1038/s41545-022-00148-3
Yaseen, Z. M., Faris, H., and Al-Ansari, N. (20202020). Hybridized extreme learning machine model with salp swarm algorithm: a novel predictive model for hydrological application. Complexity, 1–14. doi:10.1155/2020/8206245
Yavari, S., Maroufpoor, S., and Shiri, J. (2018). Modeling soil erosion by data-driven methods using limited input variables. Hydrology Res. 49 (5), 1349–1362. doi:10.2166/nh.2017.041
Keywords: neuro-fuzzy, grey wolf optimizer, dissolved oxygen, turbidity, California
Citation: Maroufpoor S, Sammen SS, Alansari N, Abba SI, Malik A, Shahid S, Mokhtar A and Maroufpoor E (2022) A novel hybridized neuro-fuzzy model with an optimal input combination for dissolved oxygen estimation. Front. Environ. Sci. 10:929707. doi: 10.3389/fenvs.2022.929707
Received: 27 April 2022; Accepted: 06 July 2022;
Published: 08 August 2022.
Edited by:
Shaolong Sun, Xi’an Jiaotong University, ChinaReviewed by:
Siroos Shojaei, University of Sistan and Baluchestan, IranCopyright © 2022 Maroufpoor, Sammen, Alansari, Abba, Malik, Shahid, Mokhtar and Maroufpoor. This is an open-access article distributed under the terms of the Creative Commons Attribution License (CC BY). The use, distribution or reproduction in other forums is permitted, provided the original author(s) and the copyright owner(s) are credited and that the original publication in this journal is cited, in accordance with accepted academic practice. No use, distribution or reproduction is permitted which does not comply with these terms.
*Correspondence: Nadhir Alansari, bmFkaGlyLmFsYW5zYXJpQGx0dS5zZQ==
Disclaimer: All claims expressed in this article are solely those of the authors and do not necessarily represent those of their affiliated organizations, or those of the publisher, the editors and the reviewers. Any product that may be evaluated in this article or claim that may be made by its manufacturer is not guaranteed or endorsed by the publisher.
Research integrity at Frontiers

Learn more about the work of our research integrity team to safeguard the quality of each article we publish.