
95% of researchers rate our articles as excellent or good
Learn more about the work of our research integrity team to safeguard the quality of each article we publish.
Find out more
ORIGINAL RESEARCH article
Front. Environ. Sci. , 04 July 2022
Sec. Toxicology, Pollution and the Environment
Volume 10 - 2022 | https://doi.org/10.3389/fenvs.2022.929449
This article is part of the Research Topic Air Pollution and Climate Change: Interactions and Co-mitigation View all 18 articles
 Karim Acuña Askar1
 Lucy T. González2*
 Alberto Mendoza2
 Oxana V. Kharissova3Andrea Rodríguez-Garza2Eleazar M. Lara4Alfredo Campos5D. López-Serna4Lilia M. Bautista-Carrillo6
 J. M. Alfaro-Barbosa4
 F. E. Longoria-Rodríguez6
Here, we report the chemical composition and optical properties of the fine particles (PM2.5) and water-soluble organic carbon (WSOC) of these particles. Additionally, the potential sources of WSOC emission were determined through the study on fluorescence excitation–emission matrix spectra and parallel factor analysis (EEM-PARAFAC). Samples were collected in an urban site of the Monterrey Metropolitan Area in Mexico during summer and winter and characterized using attenuated total reflectance-Fourier-transform infrared spectroscopy (ATR-FTIR), ultraviolet-visible-near infrared-diffuse reflectance spectroscopy (UV–Vis-NIR-DRS), fluorescence spectroscopy, X-ray photoelectron spectroscopy (XPS), and X-ray diffraction (XRD) techniques. The ATR-FTIR analyses allowed the identification of inorganic ions (e.g., CO32−, SO42−, and NO3−), organic functional groups [e.g., carbonyls (C=O), organic hydroxyl (C-OH), carboxylic acid (COOH)], and aromatic and unsaturated aliphatic hydrocarbons. The results obtained by XRD and XPS revealed the presence of organic and inorganic chemical species in PM2.5. The diffuse reflectance spectra of PM2.5 provided the absorption bands in the UV region for CaSO4, CaCO3, and aluminosilicates. The absorption coefficient at 365 nm (Abs365) and Ångström absorption exponent (AAE) values obtained for the aqueous extracts suggest that many of the water-soluble organic compounds corresponded to brown carbon (BrC) chromophores. The mass absorption efficiency values at 365 nm (MAE365) were higher in the winter than summer samples, suggesting the presence of more BrC compounds in the winter samples. The fluorescence indices combined with EEM-PARAFAC analysis showed that the WSOC fraction was mainly composed of humic-like substances (HULIS) which are both of terrestrial and microbial origin.
The extensive atmospheric pollution occurring in large cities as a result of fast-growing urban and industrial development has caused an increase in the number of people to be continuously exposed to low-quality ambient air. Particulatematter (PM) is a common atmospheric pollutant, which has been widely studied because of its adverse effects on both the public health and global climate. Particularly, fine PM (PM2.5) has been considered more dangerous because it is able to penetrate the deep parts of the human lung. Indeed, numerous studies have associated the components of PM2.5 to many respiratory (e.g., lung cancer) and cardiovascular diseases. These components have also been found to cause genetic mutations in animals (Lippmann et al., 2006; Happo et al., 2010). In addition to the adverse effects on animal and human health, PM2.5 influences both local and global climates. Several PM2.5 components have been shown to cause the dispersion and absorption of light (including infrared light). These effects on light disturb the radiation balance of the atmosphere, which may then cause unexpected variations in the atmospheric heating-cooling cycles (Jacobson, 2004; Huo et al., 2016; Chen et al., 2019). Our present knowledge related to the influence of PM2.5 on radiative forcing (change in energy flux in the atmosphere) and climate change is still limited. Moreover, there are difficulties associated with the current atmospheric models, which are used to measure the magnitude of both capture and release of radiation by PM2.5. For example, different types of aerosols may exert a large range of contrasting effects on the net cooling or heating of an atmosphere. This is caused by the high variability of the PM2.5 properties in the atmospheric aerosols as a function of the region.
PM2.5 is composed of a wide variety of chemical substances of both organic and inorganic origin, being carbonaceous material the component that have attracted the most attention because they contribute between 10% and 70% of the total mass of PM2.5, with concentrations found in selected areas ranged from a few pg/m3 to hundreds of ng/m3 (Tsapakis et al., 2002; Hecobian et al., 2010; Khare et al., 2011). Black carbon (BC) is the main light-absorbing carbonaceous material in the range from visible to near infrared light. However, the fraction of organic carbon (OC) that is often called “Brown Carbon (BrC)” has also been found to significantly absorb ultraviolet (UV) and shorter wavelength visible (Vis) light (Jacobson, 2001; Bond et al., 2004). The contribution of BrC to climate change is not limited to its impact to the atmosphere due to its ability and capacity to absorb solar radiation. Recent studies have shown that BrC has accelerated the melting of snow and decreased the Earth’s albedo (Andreae and Ramanathan, 2013; Qian et al., 2015; Yan et al., 2018; Leskinen et al., 2020). Some researchers have classified OC based on its water solubility, i.e., the water-soluble organic carbon (WSOC) and water-insoluble organic carbon (Kondo et al., 2007; Miyazaki et al., 2009). The analyses of the optical properties of WSOC have allowed the identification of its probable emission sources, and thus provided helpful strategies to control emission. In the literature it has been reported that WSCOC originate from either primary sources (biomass burning, fossil fuel combustion) or atmospheric secondary processes, including gas-to-particle conversion and gas deposition onto the surface of a PM (Graber and Rudich, 2006; Sullivan and Weber, 2006; Duarte et al., 2007).
The study of the optical properties of atmospheric particles requires a variety of analytical techniques, including Fourier-transform infrared (FTIR) and UV–Vis spectroscopy, fluorescence, mass spectrometry (MS), and chromatography. Hecobian et al. (2010) characterized the optical properties of the water-soluble fraction of PM2.5 samples using various analytical techniques. Their samples were collected in the southeastern United States throughout different seasons of a year. They found that the WSOC absorption was higher in the samples obtained during the cold months. The WSOC content was closely related to the presence of levoglucosan in the sample, suggesting that biomass burning was the main source of the emission. Moreover, Chen et al. (2016a) studied the relationship between the optical properties and chemical composition of total suspended PM in samples using FTIR, UV-Vis, fluorescence spectroscopy, electrospray ionization mass spectrometry (ESI-MS) and high-resolution accurate mass spectrometry (HR-AMS). They found that the mass absorption efficiency (MAE) was higher for the less polar organic compounds in the sample. In addition, the nitrogen and oxygen containing organic compounds contributed significantly to the total absorption of light and fluorescence of PM.
The Monterrey Metropolitan Area (MMA) has been considered the most polluted city in Mexico and one of the most polluted cities in Latin America (Clean Air Institute, 2012; INECC, 2014). The elevated emissions in the MMA originate mainly from the high industrial activity and vehicle traffic. However, studies on the chemical composition of atmospheric PM and optical properties of PM2.5 in the MMA have been limited (Mancilla et al., 2015; Mancilla et al., 2016; Mancilla et al., 2019; González et al., 2016; González et al., 2017; González et al., 2018; López-Ayala et al., 2019; Longoria-Rodríguez et al., 2020; Longoria-Rodríguez et al., 2021). There is also limited information on the absorption response and light emission of PM2.5 in Mexico after exposure to variable wavelengths of radiation (Liñán-Abanto et al., 2019; Carmona et al., 2021). Furthermore, studies on the chemical and optical characteristics of WSOC in PM2.5 in Mexico and other Latin American countries have not been done. Therefore, this research focuses on three main objectives; 1) determine the chemical composition and optical properties of PM2.5 collected in the MMA during winter and summer, 2) determine the effect of seasonal variation on the chemical composition and optical properties of the PM2.5, and 3) establish possible sources of WSOC emissions in MMA by applying the parallel factor analysis (PARAFAC) model. The analytical techniques including attenuated total reflection (ATR)-FTIR, UV/VIS-diffuse reflectance spectroscopy (DRS), fluorescence, x-ray diffraction (XRD), and x-ray photoelectron spectroscopy (XPS) were used to determine the optical properties and chemical composition of the PM2.5 samples.
The sampling site was in the northwestern region of the MMA in Nuevo Leon, Mexico. PM2.5 sampling was performed at the routine monitoring station of the Integral Environmental Monitoring System [Sistema Integral de Monitoreo Ambiental (SIMA), the initials in Spanish] located in the San Bernabé suburb (25° 45' 24.86"N, 100° 21' 56.95"W, 551 m. a.s.l.) near the Talleres subway station. This station is surrounded by a highly populated urban area and located alongside the westward winds, which is coming from the highest density industrial area of MMA. In addition, it lies near a natural reserve Mount del Topo Chico. PM2.5 samples were collected during July to August 2019 and January to February 2020 following the Method IO-2.1 USEPA method (U.S. EPA. Environmental Protection Agency Methods, 1999), where sampling temperature, relative humidity, and atmospheric pressure conditions were recorded (Table 1). The samples were collected every 6 days, collecting a total of 8 samples in each period.
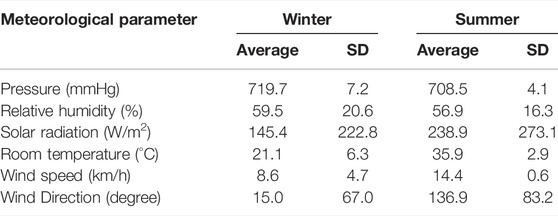
TABLE 1. Statistical summary of the meteorological variables recorded during both study periods. SD: Standard deviation.
A high-volume sampler HiVol 3000 from Ecotech, which was previously calibrated according to Method IO-2.1 USEPA (U.S. EPA. Environmental Protection Agency Methods, 1999) was placed at the SIMA station. PM2.5 samples were collected for 24 h on fiberglass filters (EPM 2000 of 8″ × 10″), with a mean airflow of 67 m3/h. For the sampling, glass fiber filters were chosen instead of quartz filters since glass is a material that does not interfere with the analyzes by the XRD technique. The mass of a loaded filter was determined using an analytical balance XS205 dual range from Mettler Toledo under a controlled relative humidity. The filter was stored at−15°C when not in use.
Chemical functional groups present in the PM2.5 were identified by ATR-FTIR using a Nicolet omnic iS50 FTIR spectrophotometer from Thermo Fisher Scientific. Measurements were made in ATR mode using an ATR Smart Orbit accessory supplied with a diamond crystal. All spectra were recorded at a resolution of 4 cm−1 over the spectral range from 4,000 to 400 cm−1. The absorption path length and total data points were 1 cm and 7,468, respectively. A scan was performed with the sample placed upside down on the ATR crystal (diameter = 3 mm). The background correction was performed by subtracting the absorption spectrum of the filter without sample from that obtained for the loaded filters. Samples did not require any pre-treatment and were analyzed directly on the fiberglass filters. The resulting set of data with baseline correction was analyzed using the SpectraGryph 1.2 Spectroscopy software (Menges, 2020).
PM2.5 samples were characterized using the UV–Vis-NIR-DRS technique. The UV–Vis-NIR-DRS spectra were obtained with an Agilent Model Cary 5000 spectrometer equipped with an external integration sphere DRA 2500 from Agilent Technologies. The analysis was carried out directly on a filter at an area of 0.3 cm2. The absorption path length was 1 nm. The filter blank was measured before the analysis. Prior to each measurement, baseline corrections were performed at both 0% and 100% transmittance. Samples were analyzed over the range from 200 to 2,500 nm with a resolution of 2 nm, which resulted in 2,301 data points.
For WSOC fraction extraction, 10% of the total area of a filter (and filter blanks) was extracted with 30 ml of purified water in an ultrasonic bath for 15 min. The purified water was obtained from a Milli-Q system from Merck Millipore (Burlington, MA, United States). The extraction procedure was repeated twice. The extract was filtered through a 25-mm outer diameter polytetrafluoroethylene (PTFE) syringe filter of 0.22 µm pore size from Tisch Scientific. Approximately 3 ml of the filtered extract (WSOC solution) was placed in a 1-cm quartz cuvette and scanned from 200 to 800 nm in 1 nm increments using the Agilent Model Cary 5000. Purified water was used as both blank reference and baseline source of data.
The light absorption coefficient (Absλ, Mm−1) was determined by Eq. 1 (Teich et al., 2017):
where Aλ and A700 corresponded to the absorption of the extracts at the wavelengths of λ and 700 nm, respectively. Vl was the volume of the solvent that the sample extract removed from the filter, Va was the air volume, and L was the absorption path length (i.e., 1 cm). The light absorption coefficient at 365 nm (Abs365) was used as the indicator of BrC (Wu et al., 2019; Mo et al., 2021). Furthermore, the mass absorption efficiency at 365 nm (MAE365, m2g−1C) was measured. MAE is a parameter that described the light absorbing ability of WSOC. This parameter was determined by Eq. 2 (Chen et al., 2018):
where Cwsoc represented the WSOC concentration in µgC/m3. The WSOC concentration was determined using a total organic carbon (TOC) analyzer model TOC-VCSH from Shimadzu (Kyoto, Japan). During the analysis, the supply gas pressure, carrier gas flow, and furnace temperature were set at 200–250 kPa, 150 ml min-1, and 680°C, respectively. The sample was acidified and injected into the analyzer oven. In the oven, the carbon was catalytically oxidized to CO2 at 680°C and the produced CO2 was detected by the sensitive Nondispersive Infrared (NDIR) detector (2,500 cm−1). Moreover, the wavelength dependence and light absorption of a water extract was investigated by the Ångström absorption exponent (AAE) in the wavelength range from 300 to 600 nm by Eq. 3 (Moosmüller et al., 2011).
The fluorescence of PM2.5 particles was measured by placing a small portion of a filter (0.5 cm2) in the sample holder of a spectrofluorometer Model FluoroMax-4 from Horiba, which was supplied with a vertically assembled xenon-arc lamp set at 150 W without ozone. The excitation wavelength was 355 nm and the emission wavelength ranged from 400 to 700 nm, with slit set to 5 nm for both the excitation and emission monochromators and using a 0.1 s integration time. The detected signals were provided by a photon-counting detector R928P PMT (185–850 nm). A photodiode array was used to monitor the lamp output.
The excitation–emission matrices (EEMs) of the WSOC fractions were measured in the range from 200 to 600 nm for excitation and 220–600 nm for emission. The band passes for excitation and emission were 20 and 1 nm, respectively. Three fluorescence indices were evaluated including the fluorescence index (FI), biological index (BIX), and humification index (HIX). These indexes have been implemented in studies involving DOM in both soil and aquatic systems and aerosol due to the similarities in the optical aspects of WSOC and aquatic DOM. Indeed, these indexes have been shown to provide some information on the nature of the organic compounds present in the water-soluble fraction of aerosols (McKnight et al., 2001; Huguet et al., 2009; Birdwell and Engel, 2010). The fluorescence parameters FI, BIX, and HIX were evaluated by Eqs 4–6, respectively.
where F represents the fluorescence intensity and Ex and Em the excitation and emission wavelengths, respectively. In the literature, FI <1.4 has been attributed to the fluorophores of terrestrial fulvic acid with greater aromaticity, while values higher than 1.9 correspond to fluorophores from microbial emissions of lower aromaticity (McKnight et al., 2001; Wu et al., 2021). The BIX value is used to assess the contributions from microbial activities, BIX >1 indicates the predominant biological or microbial formation, while BIX <0.6 corresponds to an autochthonous component with smaller contribution from biological materials (Huguet et al., 2009; Wen et al., 2021; Wu et al., 2021). HIX value represents the degree of humification of organic matter, higher values (HIX ˃10) are attributed to more humic or aromatic organic matter associated with terrestrial sources, while lower values (HIX ˂5) are associated with organic matter freshly formed (Yang et al., 2020). Finally, to support the information provided by the fluorescence indices, the PARAFAC model was applied. Recently, some researchers have reported the importance of using fluorescence indices and the PARAFAC model to establish possible sources of emission of carbonaceous material in the aqueous fraction. PARAFAC is a statistical model approach that extracts independent fluorophores from EEMs under ideal conditions (Bro, 1997). The determination of the component number and the treatment of the spectroscopic data, which included the biases correction, scattering remove and normalization, was carried out by applying the staRdom software [“spectroscopic analysis of dissolved organic matter (DOM) in R”]. (Pucher et al., 2019).
The XPS technique was used to determine the surface chemical composition of PM2.5. For this purpose, a Thermo Scientific Escalab 250Xi spectrometer with both a six-channel (channeltron) detector and a monochromatic X-ray Al Kα source (1486.68 eV) was used. A selected 1 cm2 piece from the center of each filter was cut and placed on the sample holder using carbon tape. Measurements were read while keeping ultrahigh vacuum conditions (10–10 torr). Survey spectra for all the samples were collected over the 1100 eV range at a resolution of 1 eV per step, 100 ms, and 150 eV of pass energy. For the chemical species of interest, high-resolution spectra were collected at a resolution of 0.1 eV per step and 20 eV of pass energy. For data treatment, Avantage software (Thermo Scientific version 5.9) was used, and the assignment of signals was made based on the literature reports and the standards database of the National Institute of Standards and Technology (NIST).
The mineralogical composition of PM2.5 was determined through XRD by using a PANalytical Empyrean X-ray diffractometer with Cu radiation (Kα = 1.5405 Å), and an X’Celerator ultra-fast detector based on real-time multiple-step technology with Bragg–Brentano geometry. The diffractometer (operating at 45 kV and 40 mA) collected the scans in the 2θ range of 5°–90° with a step size of 0.016° and 59 s per step. For structural refinements, both the Rietveld method and the crystalline phase identification approach were performed by using the High Score Plus software version 3.0.5 and the ICDD PDF+4 plus database as well (ICDD, International Center for Diffraction Data, Newtown Square, PA, United States).
The daily variation of PM2.5 concentrations found in the MMA during the two study periods is shown in Figure 1. The average concentrations of PM2.5 in winter were much higher (three times higher) than in summer. The concentrations found in winter and summer were 84.39 ± 11.67 and 25.04 ± 3.05 μg/m3, respectively. A similar seasonal trend has been observed in other studies, which were conducted in different cities (Zhou et al., 2020; Duan et al., 2021). According to the regulation by Mexican Norm NOM-025-SSA1-2014 (SSA, 2014), the maximum allowed limit of PM2.5 in the air is 45 μg/m3 (24 h average). Therefore, the levels found in the winter samples from the San Bernabé station was above the maximum allowed limit, suggesting the poor air quality and potential health risk to the exposed population. The high levels found during the winter season was attributed to the increase in both fossil fuels and biomass burning, which was from the high energy demands by both industries and residences during this season. Similar results have been reported by different researchers (Ravindra et al., 2022; Wang et al., 2022). In addition, low wind speeds and rainfalls were registered during the winter (Table 1). These conditions favored the stagnation of particles in the area.
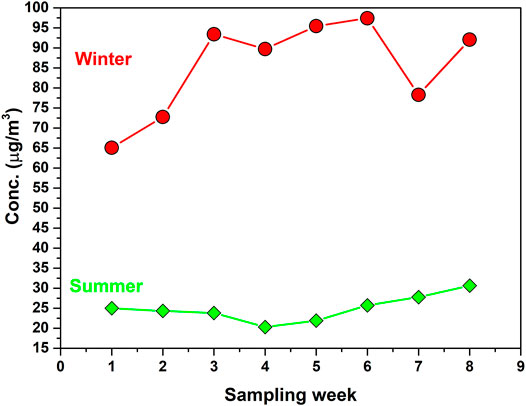
FIGURE 1. Temporal evolution of PM2.5 during the summer and winter seasons at the San Bernabé station.
The infrared spectra of the PM2.5 samples that were collected in winter and summer are shown in Figure 2. In the two study period, the absorption bands between 612 and 615 cm−1and 1,080 and 1,135 cm−1was attributed to the sulfate ions, which were likely as CaSO4 (Allen et al., 1994; Maria et al., 2002; Radulescu et al., 2017; Yu et al., 2018; Zeb et al., 2018). It is of further importance to notice that CaSO4 particles has a cooling effect on the atmosphere, which causes a negative radiative forcing and alters the troposphere temperature balance (Buseck and Pósfai, 1999; Martin et al., 2004). A summary of the chemical species that were found in the samples is found in Table 2. In majority of the collected samples, CO32−signals (i.e., at 1,412 cm−1 and 872 cm−1) were predominant in the PM2.5 samples (Shaka’ and Saliba, 2004; Bahadur et al., 2010; Siciliano et al., 2018). Moreover, the band found between 710 and 719 cm−1 was related to the asymmetric vibrations of CaCO3 (Varrica et al., 2019). Recent studies indicated that both carbonate ion and its products from atmospheric aging can affect the climate directly by dispersing and absorbing solar and terrestrial radiation (Crowley et al., 2010; Tang et al., 2015). They can affect the climate indirectly by changing the microphysics, albedo, and useful life of clouds.
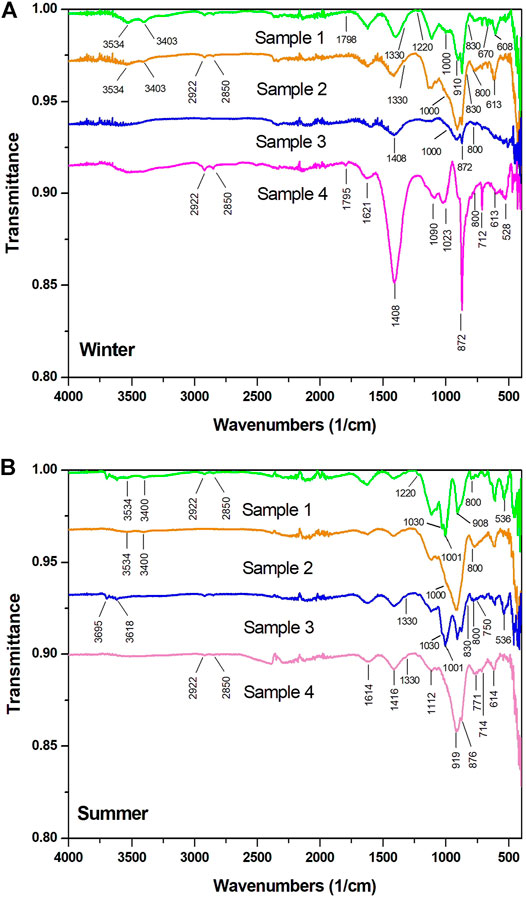
FIGURE 2. ATR-FTIR spectrum of selected PM2.5 samples collected on fiberglass filters, (A) winter, samples: 1(W6), 2(W5), 3(W3), 4(W8) and (B) summer, samples: 1(S1), 2(S3), 3(S6), 4(S8).
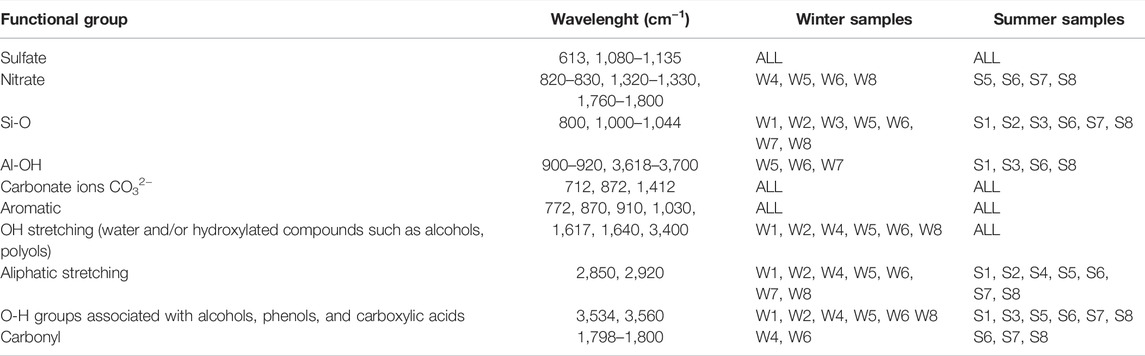
TABLE 2. Summary of the functional groups identified by FT-IR on the PM2.5 samples collected in both seasons.
The weak shoulder signals between the ranges from 1,320 to 1,330 cm−1 and 820–830 cm−1 in some samples suggested the presence of NO3− species (Figure 2B). These signals overlapped with the strong CO32− signals between 1,412 and 870 cm−1. In addition, in some summer and winter samples, the absorption signals between 1,760 and 1,800 cm−1 were observed, which indicated the presence of inorganic nitrate Previous studies on the MMA have reported the presence of NO3− in PM2.5 (Martinez et al., 2012; Mancilla et al., 2019). Meanwhile, the peaks between 1,000 and 1,044 cm−1 and peak at 800 cm−1 were due to Si-O bonds (samples: S1, S3, S6, W6, W5, and W3) The peak between 1,000 and 1,044 cm−1was due to the asymmetric stretching vibrations of the O-Si-O, while the peak at 800 cm−1was due to bending vibrations of the O-Si-O bond in the silicates (Maria et al., 2002; Shaka’ and Saliba, 2004; Simonsen et al., 2009; Radulescu et al., 2017; Zeb et al., 2018). In addition, in both summer and winter samples, a peak was observed between 900 and 920 cm−−1, which was indicative of Al-(OH) bond vibrations. Compounds with Al-(OH) are usually present in aluminosilicate minerals such as kaolinite (Al2Si2O5(OH)4) (Ravisankar et al., 2010). It should be noted that this peak appeared more intense in the summer samples and in some cases this peak overlapped with the carbonate band at ∼877 cm−1. The absorption signals found between 3,618 and 3,700 cm−1as well as 3,695 and 3,700 cm−1 corresponded to the vibrations of the OH functional groups, which are typically located between the tetrahedral and octahedral layers of clay minerals (aluminosilicates). These functional groups have been shown to interact with the Si-O-Si layers to produce bonds, which produce characteristic absorptions at 3,620 and 3,695 cm−1 (Davarcioglu, 2011; Varrica et al., 2019). Additionally, the absorption bands at lower frequencies of around 540 cm−1 and the small peak at 750 cm−1, which appeared in some samples were attributed to the Al-O-Si bonds in silicates (Chou et al., 2005; Coury and Dillner, 2008).
The OH stretching vibrations around 3,400 cm−1observed in our samples (Figure 2) indicated the presence of water and/or hydroxylated compounds such as alcohols and polyols from biogenic sources and biomass burning (Gipson et al., 2015; Siciliano et al., 2018; Zapata-Hernandez et al., 2020). The broad band observed between 1,617 and 1,640 cm−1confirmed the presence of water in the samples. The broad band signal between 1,617 and 1,640 cm−1 indicated of an overlap of the signals from different chemical functional groups including the stretching vibration absorptions for C=C aromatic and C=O bonds. Some authors have attributed this broad band signal to the functional groups found in organonitrates, aromatic amides, and organic amines (Ji et al., 2015; Radulescu et al., 2017; Siciliano et al., 2018; Zapata-Hernandez et al., 2020). Meanwhile, the appearance of the weak shoulder signals at around 1,220 cm−1 in most of the samples supported the presence of organ nitrated compounds (Shaka’ and Saliba, 2004).
The broad band observed between 3,534 and 3,560 cm−1 in our samples (Figure 2) were due to the vibrations of the O-H groups in alcohols, phenols, and carboxylic acids (Allen et al., 1994; Coury and Dillner, 2008; Shaka’ and Saliba, 2004). A weak peak between 1,798 and 1,800 cm−1 was observed in three and five of the summer and winter samples, respectively. This peak corresponded to the vibrations of the carbonyl functional group (C=O) in carboxylic acids. The amounts of carboxylic acids seemed to be higher in the winter samples suggested in Figure 2A (Siciliano et al., 2018). In most of the collected samples, peaks were observed between 2,920 and 2,850 cm−1, which were associated to the CH2 in aliphatic compounds (Shaka’ and Saliba, 2004; Zapata-Hernández et al., 2020).
The XRD diffractograms obtained for the PM2.5 samples in the two study periods are shown in Figure 3. Several reflections with different intensities were observed in the diffractograms. Most of the signals corresponded to the crystalline phases of CaCO3 (index number or ICDD No. 010721937), SiO2 (ICDD No. 010781252), and CaSO4·2H2O (ICDD No. 010741433). Signals with lower intensities corresponded to the aluminosilicates including kyanite (ICDD No. 000110046), albite (ICDD No. 010831658), leucite (ICDD No. 010768736), sillimanite (ICDD No. 000380471), pyrophyllite dehydroxylated (ICDD No. 010734051), and NaCl (ICDD No. 010763457). In the literature it is reported that in the study region there are some mineral deposits related to these crystalline phases (such as muscovite, sillimanite, kaolin, albite, quartz, plagioclase, feldspars, and micas), only some of them are commercially exploited (nl.gob.mx, 2020). On the other hand, it is known that these mineral phases are used in the refractory and ceramic industry, which are abundant in the area and therefore it is not ruled out that they also contribute to the emission of these crystalline compounds (Bradt, 2008). Adjustments on the reflection profiles were carried out by the Rietveld method, which allowed us to perform semiquantitative analysis on each of the crystalline phases detected (Rietveld, 1969). The refinement of the signals provided the mass percentage of each crystalline phase in the diffractograms. The results showed that the most abundant crystalline phases were CaCO3 and SiO2 (Table 3). CaSO4 was also abundant while aluminosilicates and NaCl were the least abundant. These phases have been extensively reported in the literature (Ahmady-birgani et al., 2015; Zarasvandi et al., 2011). The average percentage of CaCO3 was slightly higher in summer (73.9%) than in winter (71.1%). These findings were consistent with the ATR-FTIR results, which showed the carbonate absorption bands at 1,412, 872, and 710–719 cm−1, in all samples collected in both seasonal periods. These crystalline phases may have emerged from natural sources (resuspension of crust material) and anthropogenic sources. We note that MMA is a semiarid region with many ceramic, glass and, cement industrial facilities, as well as quarries inserted within the expanding metropolitan area.
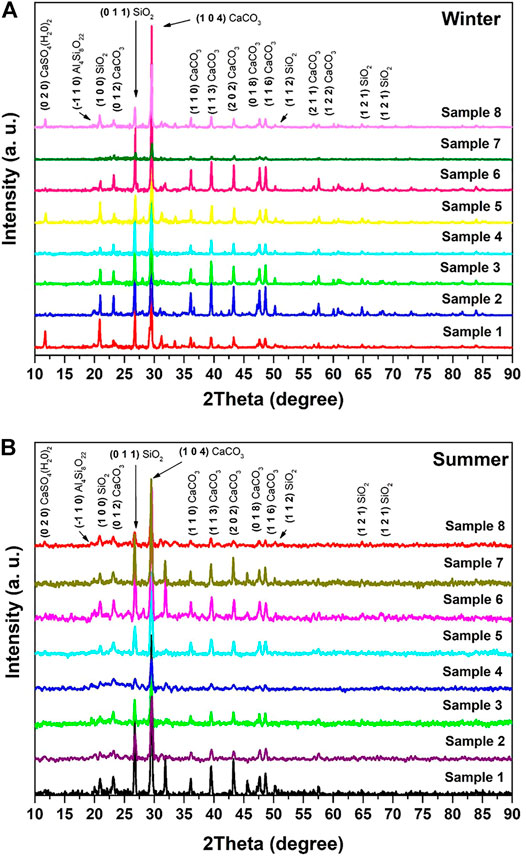
FIGURE 3. X-ray diffraction patterns of PM2.5 collected in (A) winter and (B) summer.
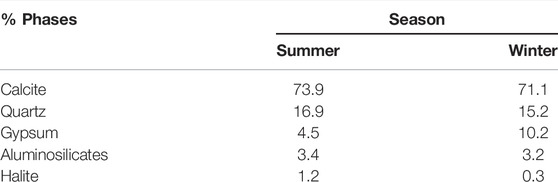
TABLE 3. Contents of the most important crystalline mineral phases present in the PM2.5 samples, which were obtained by x-ray powder diffractometry.
On the other hand, the average percentage of CaSO4 found was significantly higher in winter (10.2%; min: 0% and max: 30%) than in summer (4.5%; min: 0% and max: 12%), which was consistent with the findings by the ATR-FTIR technique. In ATR-FTIR, we found more frequent and greater intensity signals for SO4−2 (1,080–1,135 and 612–615 cm−1) in the winter samples. This finding is relevant as most of the previous studies in the MMA have assumed that sulfate associated to the PM2.5 is mainly in the form of (NH4)2SO4 (Martinez et al., 2012; Mancilla et al., 2019). The higher percentage of CaSO4 found in the winter samples is likely more related to the meteorological parameters and concentration of SO2 in the atmosphere, since we have considered CaSO4 as a phase of secondary origin. Sulfates are formed by photochemical reactions that occur between their main precursor (SO2) and oxidizing species such as O3 and NOx (Xu et al., 2016). Unfortunately, SO2 is not monitored in the San Bernabé station. However, further exploration of available ground-level SO2 data from the local air quality monitoring network resulted in identifying that the nearby North 2 station had a complete dataset for the periods of interest. The North 2 station is approximately 6 km to the southeast of the Northwest (San Bernabé) station, in a very similar landuse and main emission sources setup. Assuming that the North 2 station is a good proxy for the Northwest station, we retrieved SO2 data for the North 2 station for the months of interest (Supplementary Table S2). The data confirms that SO2 levels are higher during the winter period, which could contribute to the formation of sulfates in this season. Another factor to consider is the changes in the meteorological parameters, where several studies have shown the dependency of sulfate levels to relative humidity and wind speed (Banerjee et al., 2015; Pant et al., 2015; Lu et al., 2016). For example, Song et al. (2014) attributed the high percentages of sulfate found in their PM10 samples to the higher humidity and low wind speed in the collection/sampling area (Henan, China). Moreover, Yue et al. (2022) found that the reaction between SO2 and CaCO3 particles in the atmosphere was favored by relative humidity values of greater than 40%. Therefore, the low wind speed, high relative humidity, as well as the abundance of SO2 y CaCO3 during the winter sampling (Table 1) in the MMA explained the higher proportions of CaSO4 found in the winter samples. It should be noted that there is no known primary source of CaSO4 near the study area. In addition, in some samples it is not possible to detect the presence of this mineral phase, it is only detected when the meteorological parameters are favorable for the photochemical reaction to take place. For everything described above, it can be thought that the CaSO4 found in the PM is of secondary origin
Similar amounts of SiO2 were found in all the samples. Several reports have associated SiO2 with natural sources (Adamo et al., 2008; Saitoh et al., 2008; Song et al., 2014). Thus, it was not surprising to find SiO2 in our samples, since the overall soil composition of the MMA falls within a sandy profile with numerous deposits that are rich with SiO2. Nonetheless, the contributions from anthropogenic sources were not overlooked. For example, there is a large glass industry in MMA, which uses crystalline SiO2 as raw material. Finally, we note that the XRD and ATR-FTIR results of this investigation complemented each other.
High-resolution XPS spectra of the elements identified in the survey scan were corrected using the C1s signal (285 eV) as reference. The assignment of signals was carried out by considering the data from the literature and National Institute of Standards and Technology (NIST) database. The atomic percentage of silicon was corrected by the method described by Atzei and Rossi (2004) and Gilham et al. (2008). In both winter and summer samples, high-intensity bands related to C and O was found along with low-intensity bands related to Si, Na, N, and S. Additional elements identified through their high- and low-resolution spectra were Ca, Mg, Zn, Cl, and F. The surface elemental composition of the PM2.5 samples are shown in Figure 4. The most abundant elements found were C, O, and Si followed by Na, S, N, and Ca. Similar results have been reported in studies by Guascito et al. (2015), Atzei et al. (2014) and Huertas et al. (2012). In these previous studies, C and O were the predominant elements found on the PM2.5 samples. The average percentage of C were higher in the winter sample, which can be attributed to the higher consumption of fossil fuels due to e.g., increased use of heating both at the industrial and residential level in the MMA (Figure 4).
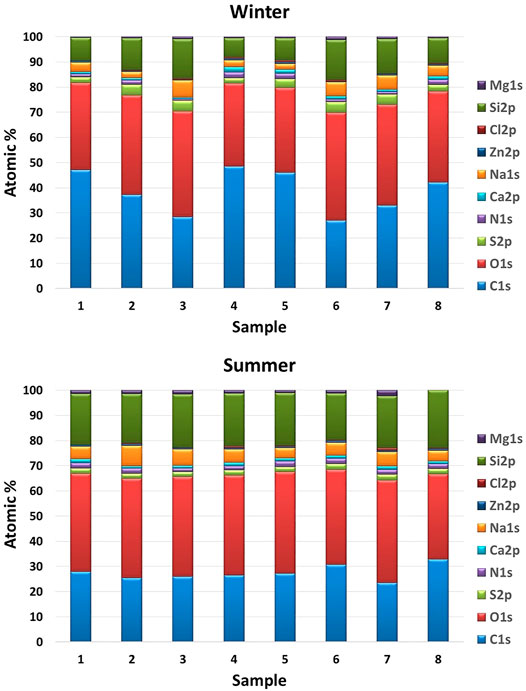
FIGURE 4. Surface elemental composition obtained by XPS of PM2.5 samples for the two study periods.
Signal speciation of C, N, S, and Ca was performed by deconvolution of the high-resolution spectrum of each element. For example, consider the high-resolution spectra of C, N, and S shown in Figure 5. For C1s (280–295 eV), the deconvolutions showed eight different states of oxidized carbon found in all samples. These were the aliphatic (C-C, 285 eV), aromatic (C=C, 284.7 eV), EC (284 eV), carbonyl (C=O, 288 eV), carbides (283.6 eV), carboxylics (O-C=O, 289 eV), carbonates (289.5 eV), and ether/alcohol (C-O, 296.5 eV). Several researchers have reported these contributing functional groups on PM (Gaddam and Vander Wal, 2013; Atzei et al., 2014). The atomic percentages of each contributing functional group to the C1s signal are summarized in Table 4. The aromatic hydrocarbons in all the samples were considered as the highest component to the C1s signals. This was followed by the EC and aliphatic hydrocarbons chains. The least contributing component in the winter and summer samples were carbonates and carbides, respectively. The atomic percentages of highly oxidized species such as ether, alcohol, carboxylic acids and/or carbonyl groups were significantly higher in the winter samples. These were consistent with the results of the ATR-FTIR spectra. The higher proportion of these functional groups in winter could be related to an increase in coal burning, in addition to a greater atmospheric oxidation caused by changes in meteorological parameters (Domínguez et al., 1999; Ahlers et al., 2000; Siciliano et al., 2018). In contrast, the decrease in oxidized species observed in summer could explain the higher proportion of aromatic and aliphatic groups recorded in this season. On the other hand, average area percentage of EC in all samples did not show any significant variation.
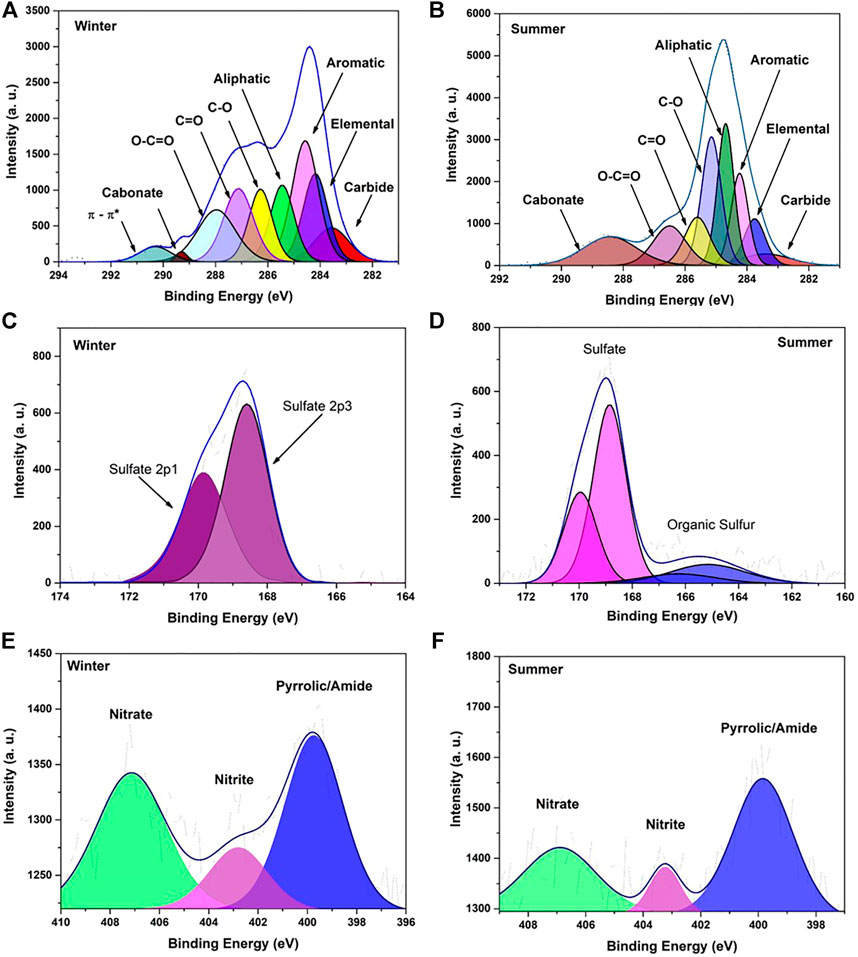
FIGURE 5. Deconvolution of high-resolution spectra in the region of the signal (A,B) C1s, (C,D) S2p, and (E,F) N1s of PM2.5 collected in winter and summer.
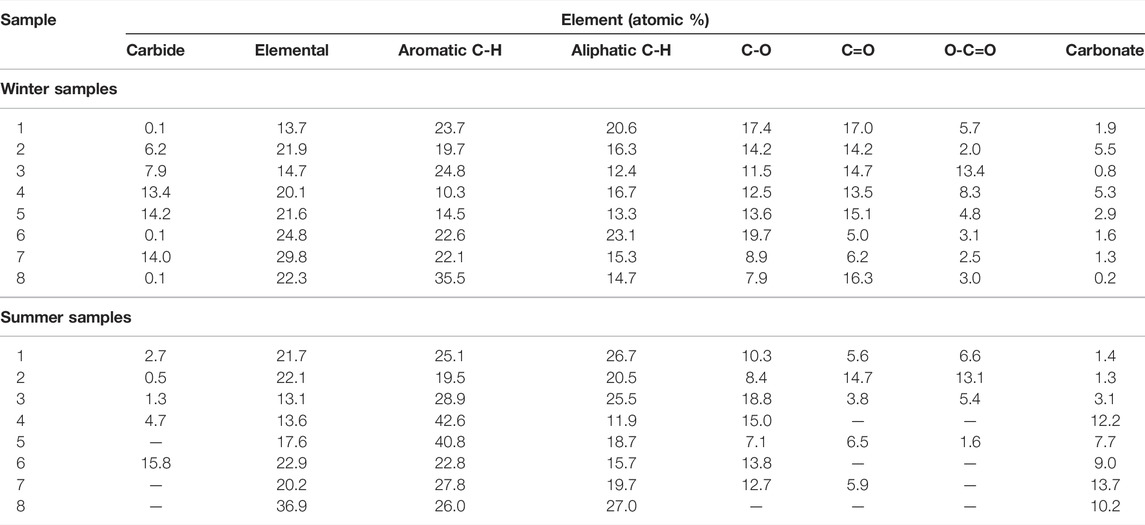
TABLE 4. Atomic percentage of each contributing functional group to the C1s signals (n = 8).
For the observed N1s signal in the samples, three contributors were identified including amide/pyrrole groups, nitrites, and nitrates, positioned at bonding energies of 399.2 and 402 eV and 407, respectively. The results obtained for the winter and summer samples showed a similar trend, where amide/pyrrole groups predominated at the surface level on PM2.5 followed by nitrates and nitrites. These were consistent with the ATR-FTIR findings where organic amides and amines, as well as inorganic nitrate were found in the samples. The abundance of amide/pyrrole groups was associated to the burning of fossil fuels. The nitrates and nitrites were of secondary origin from the photo-oxidation reactions of gaseous nitrogenous precursors in the atmosphere. In the literature, it has been reported that some ions of secondary origin, such as nitrites, are more stable under conditions of low solar radiation, which is consistent with the lower solar radiation recorded in winter(Paoletti et al., 2003). The atomic percentages obtained for the amide/pyrrole groups and nitrates in the two seasons were similar. This confirmed that seasonal variation had no significant effect on the amounts of these species in the atmosphere. Interestingly, the concentrations of nitrite were significantly higher in the winter samples (Table 5), which was attributed to the typically lower solar radiation during the cold months (Hoek et al., 1996; Lee et al., 1999; Paoletti et al., 2003).
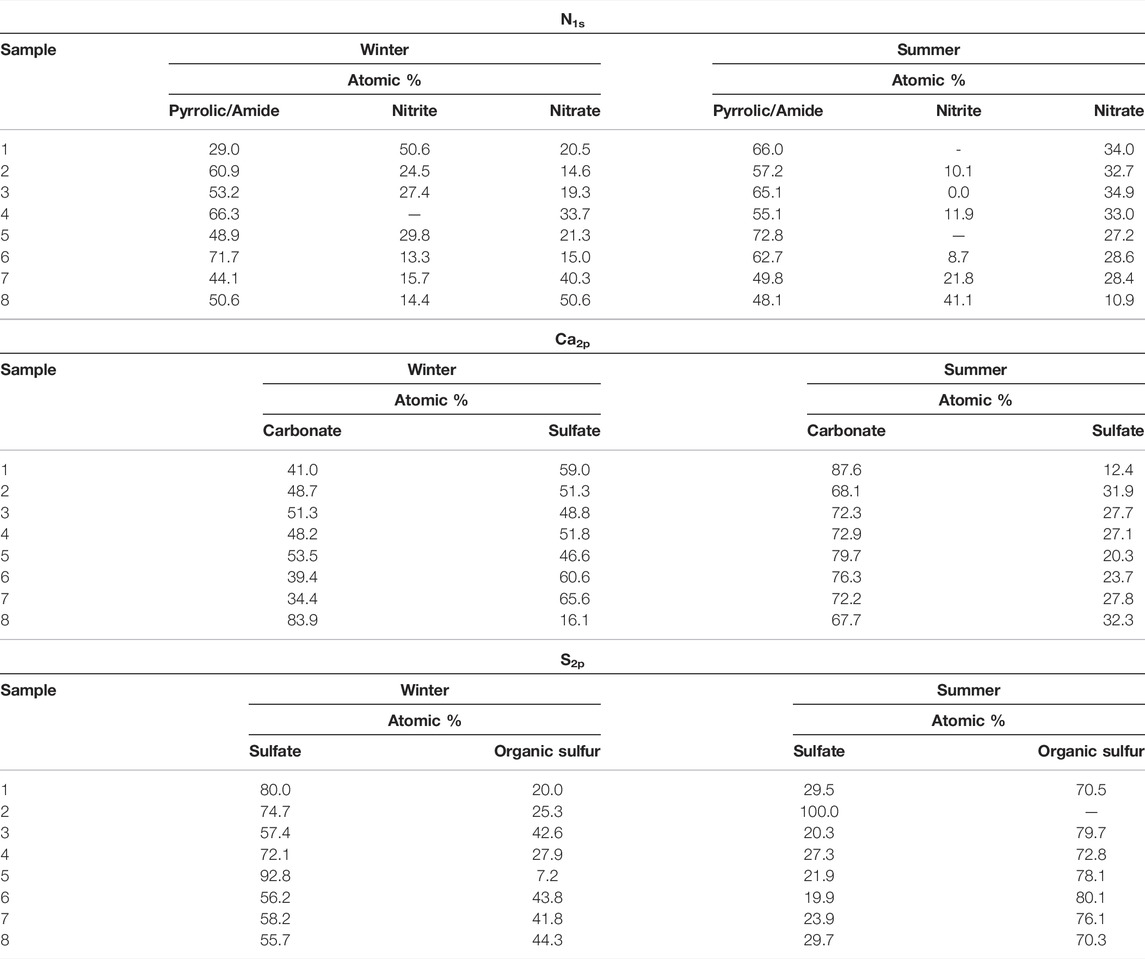
TABLE 5. Atomic percentage of each contributing functional group to the (a) N1s, (b) Ca2p, and (c) S2p signals.
Two components for the Ca2p signal were identified, where one was located at a binding energy of 347 eV, which corresponded to CaCO3. The other was at 347.8 eV, which was associated with CaSO4 (Guascito et al., 2015). Our results showed that CaCO3 was the main signal contributor in all samples, while the highest percentages of CaCO3 were found in the summer samples (e.g., 74.6%). Notably, the deconvolution of the C1s signals suggested a higher percentage of CaCO3 in the summer samples. This was explained by the summer activities related to the extraction of limestone from local quarries and its use as a raw material in the cement binder industry. The deconvolution of S2p signals showed that the sulfates and organic sulfur compounds dominated the winter (68.4%) and summer (65.9%) samples, respectively. The higher levels of CaSO4 found in the winter samples were related to the changes in meteorological conditions and possibly higher concentrations of SO2 in the atmosphere during the sampling. In summer, the meteorological conditions did not favor the formation of the CaSO4, which led to an increase in the percentages of organic sulfur in this season.
The DRS technique has been widely used for the characterization of solid materials (Zwinkels et al., 2014; Bock et al., 2019), since it is a tool useful to determine the electronic transitions from the valence to conduction band (band gap) of semiconductor oxide powders (Escobedo-Morales et al., 2019). In the environmental sciences, has been applied mainly for the analysis of minerals in soils (Sellitto et al., 2009; Szalai et al., 2013), however, we have found a few studies that used DRS for the characterization of atmospheric particulate material. For example, Wonaschütz et al. (2009) used this technique for the characterization of BC and BrC in atmospheric aerosols. In another study, Morozzi et al. (2021) used DRS to characterize the diverse mineral phases of the Sahara dust that were present in the PM samples obtained from the Mediterranean area.
The diffuse reflectance spectra obtained from the PM2.5 samples are shown in Figures 6A,B. Significant attenuation of the signal response in the visible region (400–800 nm) were observed in all the spectra, indicating the presence of chromophores that were likely from the carbonaceous materials in the samples. On the other hand, the UV region spectra showed some noticeable changes in the slopes of the curves. These were associated to the electronic transitions in the inorganic materials present in the samples (Makuła et al., 2018). The spectra were converted by the Kubleka–$132#? Munk function. To better define the processes involved, the second derivative was obtained by following the methodology proposed by Torrent and Barrón (2015) and the results are shown in Figures 6C,D. In the spectra, the absorption band near 250 nm was related to the presence of CaSO4, whose absorption range was previously reported to be between 250 and 350 nm (Nagabhushana et al., 2010). The absorption band between 210 and 230 nm corresponded to the CaCO3 electronic transition from the valence to conduction band (Al Omari et al., 2016). The additional absorptions observed between 330–400 nm in some samples are possibly related to electronic transitions of the aluminosilicates containing transition metals (Zent et al., 2008; Tarantola et al., 2019). The above demonstrates the application of the DRS technique to characterize the inorganic fraction present in PM. In addition, it is versatile, simple and low cost since the analysis of the sample is done directly in the filter, without the need to use reagents or solvents for its
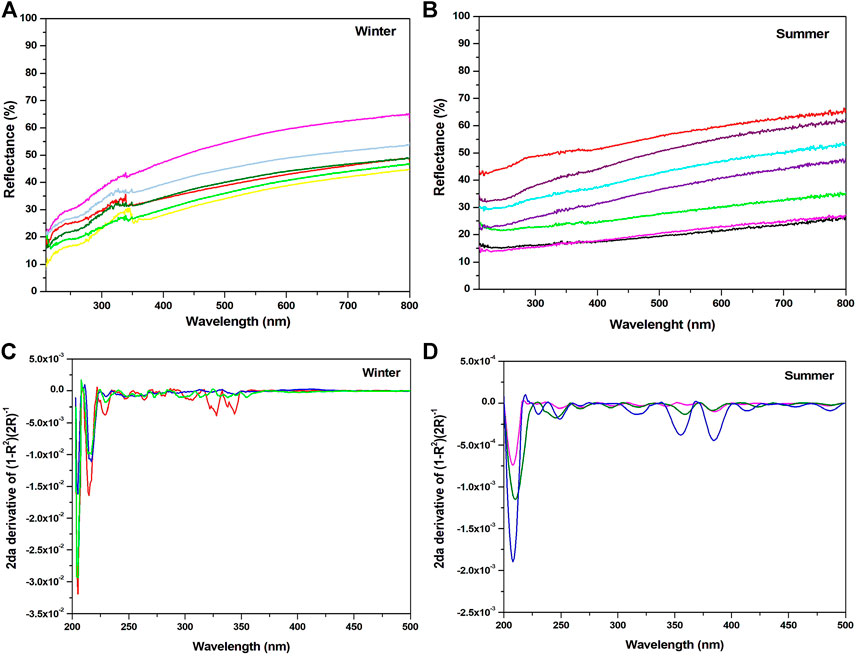
FIGURE 6. Diffuse reflectance spectra of representative PM2.5samples obtained during (A) winter and (B) summer. Derivative of second order of the Kubelka–Munk function of the same samples collected in (C) winter and (D) summer.
To fully understand the optical properties of the water-soluble fraction, UV–Vis analyses were performed on the aqueous extracts of the PM2.5 samples collected in the San Bernabé monitoring station. The variation of the Absλ with respect to the wavelength of radiation in the range of 300–600 nm is shown in Figure 7A. In both seasons studied, the absorption intensities decreased notably at longer wavelengths, suggesting a strong dependence with the radiation wavelength, which is characteristic of BrC (Cheng et al., 2016; Wu et al., 2020). Furthermore, the absorption coefficients of the winter samples were higher than the summer samples. Similar results have been reported by Chen et al. (2018) for samples obtained in Nanjing, China. Prior studies have associated the Abs365 with the absorption coefficient of BrC (not inorganic salts) (Hecobian et al., 2010). The values for Abs365 and temporal variation are shown in Table 6 and Figure 7B, respectively. The Abs365 values were higher in the winter (1.15 ± 0.49 Mm−1) than summer (0.66 ± 0.19 Mm−1) samples, which has been a seasonal trend confirmed by other researchers (Kim et al., 2016; Chen et al., 2020). The values we found were comparable to those reported by Liu et al. (2018) for samples obtained in Guangzhou City, China, and by Liu et al. (2013) in Atlanta, United States. However, our values were lower than those reported by Satish et al. (2017) for samples obtained from the cities of Indo-Gangeti Plain, India Satish et al. (2017) and Huang et al. (2018) for samples obtained from Xi’an, China. Strong correlations of the Abs365 of water extracts with WSOC concentrations for both winter (r = 0.89) and summer (r = 0.93) were found (Figure 7C), which is indicative that WSOC contains BrC (Chen et al., 2020). The difference in the Abs365 values found in both seasons could be attributed to differences in the emission sources that predominate in each season (Chen et al., 2018; Zhan et al., 2022).
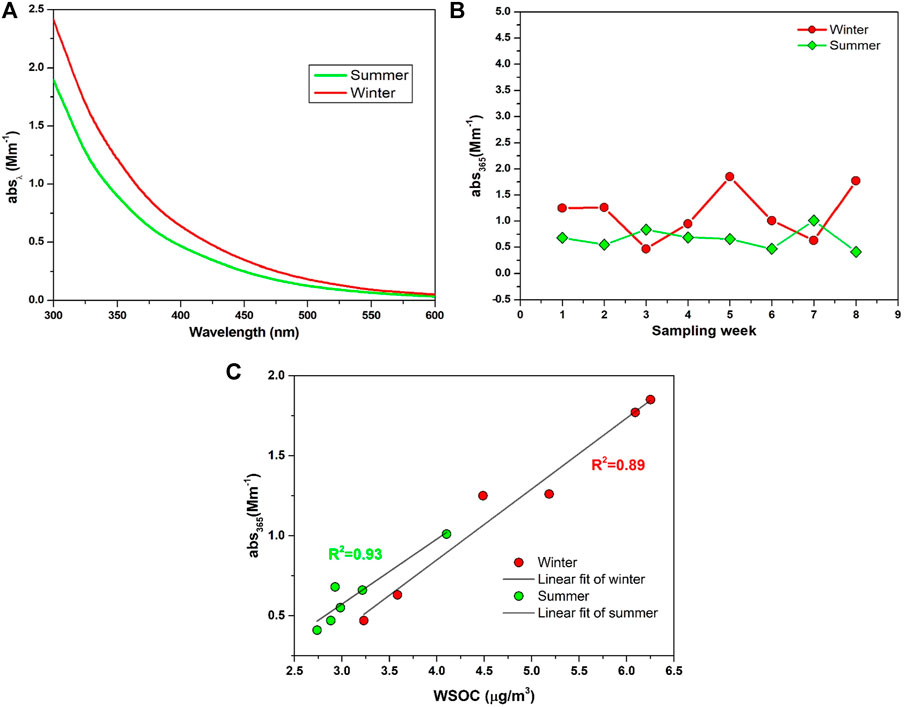
FIGURE 7. (A) Averaged light absorption spectra of the WSOC for the samples obtained in winter and summer. (B) Time series of light absorption coefficient at 365 nm (Abs365) for the two study periods. (C) Scatter plots of Abs365 versus WSOC.
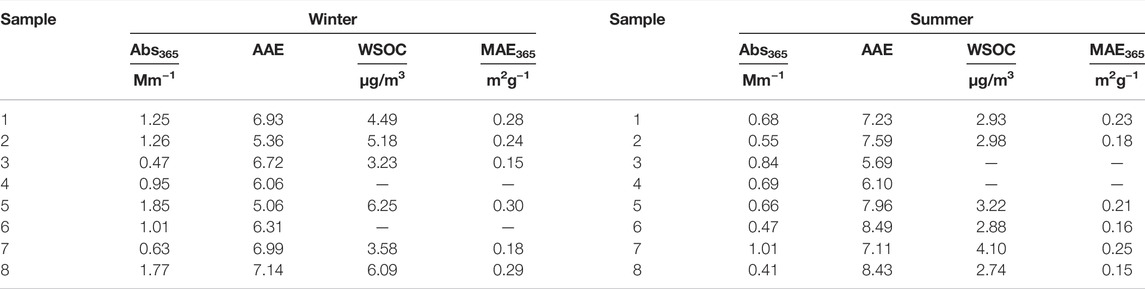
TABLE 6. WSOC mass concentration and light absorption parameters (Abs365, MAE365, and AAE), measured during winter and summer in the two study periods.
On the other hand, the average MAE365 values in the winter and summer samples were 0.23 ± 0.05 m2g−1 and 0.19 ± 0.04 m2g−1, respectively (Table 6 and Figure 8A). These results indicate that BrC in winter has a higher absorption capacity compared to summer. This could be attributed to a higher concentration of BrC chromophores in winter and/or to differences in the chemical nature of chromophores that predominate in the cold season as a result of differences in emission sources. In this study, the observed MAE365 values were lower than those reported for cities with higher pollution indices such as Beijing, China (Yan et al., 2015), Xi’an, China (Yuan et al., 2020), and New Delhi, India (Kirillova et al., 2014). In addition, our values were closer to the values reported for Seoul, Korea (Kim et al., 2016) and Atlanta, United States (Hecobian et al., 2010).
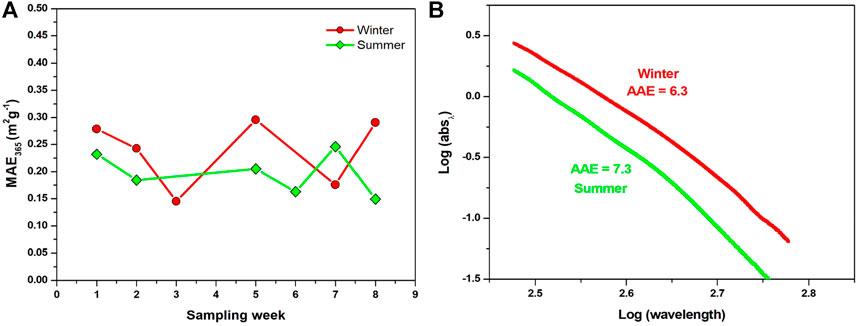
FIGURE 8. (A) Time series of mass absorption efficiency at 365 nm (MAE365) for the two study periods, (B) linear regression fit log(abs365) versus log(λ) in the wavelength range of 300–600 nm for both study periods.
The AAE is a very important parameter that provides information on the spectral dependence of the aerosol and the absorption of light in bulk (e.g., extracts) (Moosmüller et al., 2011). In the literature, it has been reported that BC from the burning of fossil fuels generally has AAE values that were close to 1 (Fraund et al., 2020). This means that the refractive index values of BC are independent of the wavelength. AAE values slightly higher than one indicated the presence of BC or a mixture of BrC and BC (Pokhrel et al., 2017). Meanwhile, high AAE values between 5 and 9 revealed the predominance of BrC in the aerosol samples (Chakraborty et al., 2016; Lin et al., 2017). The AAE values calculated for WSOC of our samples in the wavelength range from 300 to 600 nm are summarized in Table 6. The average values obtained for the winter and summer samples were 6.32 ± 0.78 and 7.33 ± 1.02, respectively (Figure 8B). The high AAE values in all samples as well as the high correlations found between Abs365 and WSOC concentration demonstrated an important contribution of BrC chromophores in the WSOC (Lin et al., 2017; Yuan et al., 2020). The AAE values were higher in the summer samples, indicating a greater contribution of compounds that absorb at shorter wavelengths in these samples. Similarly, Chen et al. (2018) reported that the highest and lowest values of AAE for PM2.5 samples collected throughout the year from Nanjing, China was obtained from the summer and winter samples, respectively. The results were explained by the difference in the chemical composition or emission sources in these seasons. Likewise, Kim et al. (2016) reported a similar seasonal variation, where the higher values of AAE in summer was attributed to the presence of metals that come from the Earth’s crust
The fluorescence emission spectra (with excitation at 355 nm) of the filters collected during winter and summer are shown in Supplementary Figure S1. The maximum wavelength intensity of the spectra from the winter and summer samples ranged from 440 to 464 nm and 439–449 nm, respectively. Similar ranges have been reported by other researchers for highly oxygenated carbonaceous and humic-like substances (HULIS) (McKnight et al., 2001; Chen et al., 2016b; Qin et al., 2021). Barsotti et al. (2016) reported that HULIS derived from the oligomerization of phenolic compounds exhibited a strong fluorescence emission in the vicinity of 450 nm. On the other hand, it is known that ozone and hydroxyl radicals are able to cause the oxidation of volatile organic compounds (VOCs) such as limonene and α-pinene. The oxidation generated HULIS that showed strong fluorescence emissions within the range of 437–513 nm. The average of maximum emission intensities was higher in the winter (1.6 × 10⁶ ± 7.8 × 10⁵ a.u.) than summers (1.4 × 10⁶ ± 6.3 × 10⁵ a.u.) samples. This was attributed to the greater amounts of oxygenated carbonaceous species found in the winter samples. Through XPS analyses, we also found slightly higher values for the total percentage of carbon and extent of functionalization by oxidized species on the C1s signal in the winter samples.
An exploratory EEM study was conducted to gain insights on the fluorescent compounds found in the samples. The aqueous extracts of the samples obtained during both seasons were used. The fluorescence indexes HIX, BIX, and FI were determined. These indexes have been implemented in studies involving DOM in both soil and aquatic systems and aerosol due to the similarities in the optical aspects of WSOC and aquatic DOM. Indeed, these indexes have been shown to provide some information on the nature of the organic compounds present in the water-soluble fraction of aerosols (McKnight et al., 2001; Huguet et al., 2009; Birdwell and Engel, 2010). The FI values are summarized in Supplementary Table S1, where 40% of the samples showed FI ∼ 1.5 values. This suggested the presence of fulvic acid-like substances with high aromaticity and of terrestrial origin. Meanwhile, 60% of the remaining samples produced FI values >2. This indicated the strong presence of fluorescent compounds with low aromaticity and of microbial origin. Similar results have been reported by Lee et al. (2013) in their EEM analysis of fresh and aged organic aerosols. They suggested that aerosols with FI values near 1.4 and 1.9 were associated with fulvic acids of terrestrial and microbial origin, respectively. The presence of this acid in our samples was verified by the FTIR and XPS results, where C = O (1798–1800 cm−1) and OH (3500–3650 cm−1) vibrations for the carboxylic acid group and OC = O, 289 eV to the C1s signal for the carboxyl group, respectively were observed. The autochthonous contribution index value (BIX near 0.4) also suggested that fulvic acid came from nonbiological sources. In addition, the HIX index found in the aerosols of ∼0.6 can be associated with the low-grade humification fluorescent components.
The PARAFAC model was applied to identify the possible sources of emission for the water-soluble carbonaceous substances that were present in the collected samples (Murphy et al., 2013). Recently, this model has been used to characterize the water-soluble organic matter in atmospheric aerosols (Mladenov et al., 2011; Matos et al., 2015; Chen et al., 2021) and organic matter in various aqueous matrices (Ishii and Boyer, 2012; Dittmar and Stubbins, 2014; Wünsch and Murphy, 2021). It is important to mention that in Mexico and possibly in Latin America, fluorescence indices and the PARAFAC model had not yet been used in the study of atmospheric aerosols. The results obtained are shown in Figure 9. The model was fixed for three components and helped determine 99.1% the data set variance and delivered central consistency values higher than 87%. Additionally, the model was validated through the analysis of divided halves (Supplementary Figure S2) and Tucke r´s congruence coefficient for both excitation and emission spectra The coefficients were found to be higher than the similarity threshold (0.95) proposed by Murphy et al. (2014). Component 1 (C1) revealed the primary and secondary signals (λex/λem) of 340/433 nm and 340/394 nm, respectively. Component (C2) gave the primary and secondary signals of 300/410 nm and 360/410 nm, respectively. Component 3 (C3) showed one signal of 360/398 nm. The signals for C1 were similar to those reported for highly oxygenated HULIS of terrestrial and dust origin, which were found in aerosol samples from urban areas and organic matter dissolved in water samples (Fu et al., 2015; Yan and Kim, 2017; Qin et al., 2018; Wang et al., 2020). Moreover, Wen et al. (2021) applied the PARAFAC model to samples collected from three sites with different environments in northern China. One of the components presented signals of 245 and 360/476 nm, which were associated with highly oxygenated HULIS from terrestrial sources. In addition, Murphy et al. (2011) attributed the signal of 349/431 nm to terrestrial humic- and fulvic-like fluorescent compounds in their samples of organic matter dissolved in water.
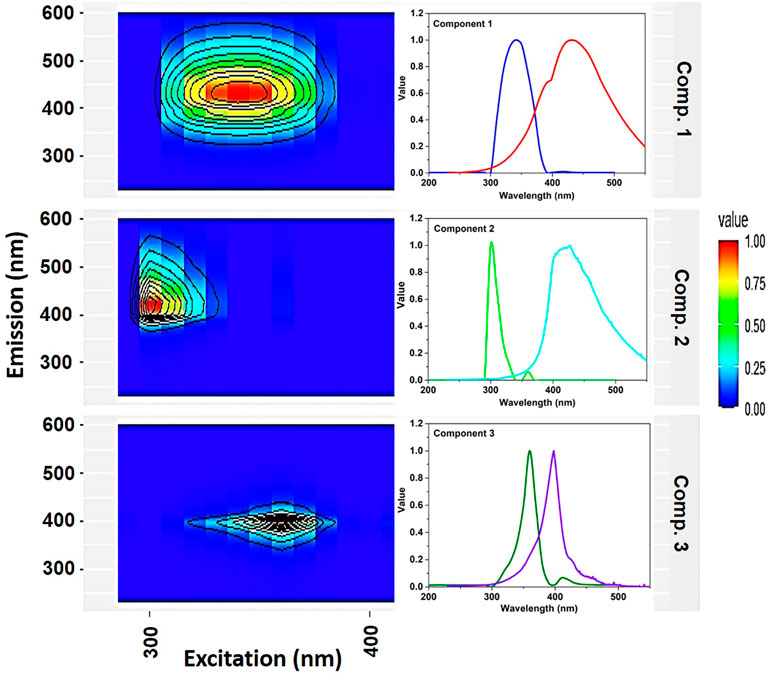
FIGURE 9. Comparison of the final models with three normalized components according to the maximum fluorescence (Fmax) emission.
In the case of C2, the fluorescence was associated to HULIS of microbial origin (Søndergaard et al., 2003; Zhuo et al., 2010; Murphy et al., 2011). Similar fluorescent compounds have been identified in the DOM of groundwater (Chen et al., 2010). On the other hand, C3 was similar to those found for humic fluorophores present in wastewater (Stedmon and Markager, 2005; D’Andrilli et al., 2013). Here, the results of the PARAFAC study were fully consistent with those obtained from the fluorescence indices study. These studies revealed the contribution of HULIS of terrestrial and microbial origin in the samples. It is important to emphasize that the emission sources and chemical composition of the fluorophores in the PM may not be the same as those found in the DOM. Moreover, only a few studies have used the fluorescence indices and PARAFAC method to characterize the fluorophore components in PM samples. Therefore, it was not possible to compare the detected components that may be found in different sources of atmospheric aerosols, such as biomass burning, fossil sources, secondary aerosols of biogenic, and anthropogenic VOCs, among others. In this sense, the present work, although an exploratory study, may serve as a basis to deepen the study of the fluorophore components present in atmospheric aerosols in Mexico.
This study investigated the light absorption characteristics and chemical composition of PM2.5 particles and their water-soluble fraction. In winter, the concentration of PM2.5 recorded at the San Bernabé station exceeded the limits in Mexico (NOM-025-SSA1-2014), which was a potential health risk to the exposed population. The presence of inorganic species in the samples collected during winter and summer, such as CaCO3, CaSO4, SiO2, and aluminosilicates were identified by ATR-FTIR, XRD, and XPS techniques. The DRS spectra showed that most of the detected constituents of the sample absorbed mainly in the UV region (200–350 nm). The highest percentages of CaSO4 were found in the winter samples (both at the surface level and in the bulk). This was attributed to the higher concentration of SO2 in the atmosphere, as well as the higher humidity and low wind speed that were recorded during the winter months of sample collection. The speciation of the C1s signal showed eight different oxidation states for carbon in all samples, with aromatic hydrocarbons, EC, and aliphatic hydrocarbons as the main contributors to the overall signal.
The light absorption by the water extracts exhibited a strong dependence with the wavelengths in the ranges 300 and 600 nm. Optical parameters, such as ABs365 and AAE, as well as the high correlation found between Abs365 and WSOC, showed that a fraction of WSOC corresponds to BrC chromophores. The Abs365 and MAE365 were found to be higher in the winter than in summer samples. This was attributed to the differences in the chemical nature of the BrC compounds and/or to a higher concentration of these compounds in the winter samples. EEM-PARAFAC analysis showed that the water-soluble BrC compounds were mainly HULIS that come from terrestrial (C1), microbial origin (C2) and humic fluorophores (C3). A high correlation was found between the fluorescence indices (FI, HIX, and BIX) and EMM-PARAFAC, which suggested the importance of both approaches in establishing the possible sources of emission for the BrC compounds in the aqueous extracts. We believe that it is necessary to continue the global studies on the molecular characterization of BrC compounds and fluorescence properties of atmospheric WSOC. These studies will allow us to establish a database on atmospheric aerosols for more accurate identification of possible emission sources.
The original contributions presented in the study are included in the article/Supplementary Material, further inquiries can be directed to the corresponding author.
Conceptualization, LG; Writing—original draft preparation, LG, AM, FL, and KA; Writing—review and editing, LG, JA, AM, and FL; Characterization, LB-C, DL-S, AR-G, and AC; Data curation, EL, Investigation, JA-B and OK; Supervision, LG.
The authors declare that the research was conducted in the absence of any commercial or financial relationships that could be construed as a potential conflict of interest.
All claims expressed in this article are solely those of the authors and do not necessarily represent those of their affiliated organizations, or those of the publisher, the editors and the reviewers. Any product that may be evaluated in this article, or claim that may be made by its manufacturer, is not guaranteed or endorsed by the publisher.
The authors thank Ing. Armandina Valdez for the use of the monitoring stations of the Sistema Integral de Monitoreo Ambiental (SIMA). The valuable support of Dr. Alonso Concha and M. C. Gerardo Silva Vidaurri from CIMAV.
The Supplementary Material for this article can be found online at: https://www.frontiersin.org/articles/10.3389/fenvs.2022.929449/full#supplementary-material
ATR, Attenuated total reflection; DOM, Dissolved organic matter; DRS, Diffuse reflectance spectroscopy; EC, Elemental carbon; FI, Fluorescence index; HULIS, Humic-like substances; MAE, Mass absorption efficiency; MMA, Monterrey metropolitan area; MS, Mass spectrometry; NIST, National institute of standards and technology; OC, Organic carbon; PM, Particulate matter; SIMA, Sistema integral de monitoreo ambiental; TOC, Total organic carbon; VOC, Volatile organic compounds; WSOC, Water-soluble organic carbon; XPS, X-ray photoelectron spectroscopy; XRD, X-ray diffraction.
Adamo, P., Giordano, S., Naimo, D., and Bargagli, R. (2008). Geochemical Properties of Airborne Particulate Matter (PM10) Collected by Automatic Device and Biomonitors in a Mediterranean Urban Environment. Atmos. Environ. 42, 346–357. doi:10.1016/j.atmosenv.2007.09.018
Ahlers, F., Bubert, H., Steuernage, S., and Wiermann, R. (2000). The Nature of Oxygen in Sporopollenin from the Pollen of Typha Angustifolia L. Z. Naturforsch. C 55, 129–136. doi:10.1515/znc-2000-3-401
Ahmady-birgani, H., Mirnejad, H., Feiznia, S., and Mcqueen, K. G. (2015). Mineralogy and Geochemistry of Atmospheric Particulates in Western. Atmos. Environ. 119, 262–272. doi:10.1016/j.atmosenv.2015.08.021
Al Omari, M. M. H., Rashid, I. S., Qinna, N. A., Jaber, A. M., and Badwan, A. A. (2016). “Calcium Carbonate,” in Profiles of Drug Substances, Excipients and Related Methodology. Editor H. G. Brittain (Amman: Academic Press), 31–132. doi:10.1016/bs.podrm.2015.11.003
Allen, D. T., Palen, E. J., Haimov, M. I., Hering, S. V., and Young, J. R. (1994). Fourier Transform Infrared Spectroscopy of Aerosol Collected in a Low Pressure Impactor (LPI/FTIR): Method Development and Field Calibration. Aerosol Sci. Technol. 21, 325–342. doi:10.1080/02786829408959719
Andreae, M. O., and Ramanathan, V. (2013). Climate's Dark Forcings. Science 340, 280–281. doi:10.1126/science.1235731
Atzei, D., Fantauzzi, M., Rossi, A., Fermo, P., Piazzalunga, A., Valli, G., et al. (2014). Surface Chemical Characterization of PM10 Samples by XPS. Appl. Surf. Sci. 307, 120–128. doi:10.1016/j.apsusc.2014.03.178
Atzei, D., and Rossi, A. (2004). Quantitative Surface Analysis of Urban Airborne Particles by X-Ray Photoelectron Spectroscopy. Ann. Chim. 94, 123–133. doi:10.1002/adic.200490016
Bahadur, R., Uplinger, T., Russell, L. M., Sive, B. C., Cliff, S. S., Millet, D. B., et al. (2010). Phenol Groups in Northeastern U.S. Submicrometer Aerosol Particles Produced from Seawater Sources. Environ. Sci. Technol. 44, 2542–2548. doi:10.1021/es9032277
Banerjee, T., Murari, V., Kumar, M., and Raju, M. P. (2015). Source Apportionment of Airborne Particulates through Receptor Modeling: Indian Scenario. Atmos. Res. 164-165, 167–187. doi:10.1016/j.atmosres.2015.04.017
Barsotti, F., Ghigo, G., and Vione, D. (2016). Computational Assessment of the Fluorescence Emission of Phenol Oligomers: A Possible Insight into the Fluorescence Properties of Humic-like Substances (HULIS). J. Photochem. Photobiol. A Chem. 315, 87–93. doi:10.1016/j.jphotochem.2015.09.012
Birdwell, J. E., and Engel, A. S. (2010). Characterization of Dissolved Organic Matter in Cave and Spring Waters Using UV-Vis Absorbance and Fluorescence Spectroscopy. Org. Geochem. 41, 270–280. doi:10.1016/j.orggeochem.2009.11.002
Bock, S., Kijatkin, C., Berben, D., and Imlau, M. (2019). Absorption and Remission Characterization of Pure, Dielectric (Nano-)powders Using Diffuse Reflectance Spectroscopy: An End-To-End Instruction. Appl. Sci. 9, 4933. doi:10.3390/APP9224933
Bond, T. C., Streets, D. G., Yarber, K. F., Nelson, S. M., Woo, J. H., and Klimont, Z. (2004). A Technology-Based Global Inventory of Black and Organic Carbon Emissions from Combustion. J. Geophys. Res. 109, 1–43. doi:10.1029/2003JD003697
Bradt, R. C. (2008). “The Sillimanite Minerals: Andalusite, Kyanite, and Sillimanite,” in Ceramic and Glass Materials: Structure, Properties and Processing. Editors J. F. Shackelford, and R. H. Doremus (Boston, MA: Springer US), 41–48. doi:10.1007/978-0-387-73362-3_3
Bro, R. (1997). PARAFAC. Tutorial and Applications. Chemom. Intelligent Laboratory Syst. 38, 149–171. doi:10.1016/S0169-7439(97)00032-4
Buseck, P. R., and Pósfai, M. (1999). Airborne Minerals and Related Aerosol Particles: Effects on Climate and the Environment. Proc. Natl. Acad. Sci. U.S.A. 96, 3372–3379. doi:10.1073/pnas.96.7.3372
Carmona, J. M., Gupta, P., Lozano-García, D. F., Vanoye, A. Y., Hernández-Paniagua, I. Y., and Mendoza, A. (2021). Evaluation of Modis Aerosol Optical Depth and Surface Data Using an Ensemble Modeling Approach to Assess pm2.5 Temporal and Spatial Distributions. Remote Sens. 13, 3102. doi:10.3390/rs13163102
Chakraborty, A., Ervens, B., Gupta, T., and Tripathi, S. N. (2016). Characterization of Organic Residues of Size‐resolved Fog Droplets and Their Atmospheric Implications. J. Geophys. Res. Atmos. 121, 4317–4332. doi:10.1002/2015JD024508
Chen, M., Price, R. M., Yamashita, Y., and Jaffé, R. (2010). Comparative Study of Dissolved Organic Matter from Groundwater and Surface Water in the Florida Coastal Everglades Using Multi-Dimensional Spectrofluorometry Combined with Multivariate Statistics. Appl. Geochem. 25, 872–880. doi:10.1016/j.apgeochem.2010.03.005
Chen, P., Kang, S., Li, C., Zhang, Q., Guo, J., Tripathee, L., et al. (2019). Carbonaceous Aerosol Characteristics on the Third Pole: A Primary Study Based on the Atmospheric Pollution and Cryospheric Change (APCC) Network. Environ. Pollut. 253, 49–60. doi:10.1016/j.envpol.2019.06.112
Chen, Q., Chen, Q., Hua, X., Guan, D., and Chang, T. (2021). Gas-phase Brown Carbon: Absorbance and Chromophore Types. Atmos. Environ. 264, 118646. doi:10.1016/j.atmosenv.2021.118646
Chen, Q., Ikemori, F., and Mochida, M. (2016a). Light Absorption and Excitation-Emission Fluorescence of Urban Organic Aerosol Components and Their Relationship to Chemical Structure. Environ. Sci. Technol. 50, 10859–10868. doi:10.1021/acs.est.6b02541
Chen, Q., Miyazaki, Y., Kawamura, K., Matsumoto, K., Coburn, S., Volkamer, R., et al. (2016b). Characterization of Chromophoric Water-Soluble Organic Matter in Urban, Forest, and Marine Aerosols by HR-ToF-AMS Analysis and Excitation-Emission Matrix Spectroscopy. Environ. Sci. Technol. 50, 10351–10360. doi:10.1021/acs.est.6b01643
Chen, Y., Ge, X., Chen, H., Xie, X., Chen, Y., Wang, J., et al. (2018). Seasonal Light Absorption Properties of Water-Soluble Brown Carbon in Atmospheric Fine Particles in Nanjing, China. Atmos. Environ. 187, 230–240. doi:10.1016/j.atmosenv.2018.06.002
Chen, Y., Xie, X., Shi, Z., Li, Y., Gai, X., Wang, J., et al. (2020). Brown Carbon in Atmospheric Fine Particles in Yangzhou, China: Light Absorption Properties and Source Apportionment. Atmos. Res. 244, 105028. doi:10.1016/j.atmosres.2020.105028
Cheng, Y., He, K.-b., Du, Z.-y., Engling, G., Liu, J.-m., Ma, Y.-l., et al. (2016). The Characteristics of Brown Carbon Aerosol during Winter in Beijing. Atmos. Environ. 127, 355–364. doi:10.1016/j.atmosenv.2015.12.035
Chou, C. C.-K., Huang, S.-H., Chen, T.-K., Lin, C.-Y., and Wang, L.-C. (2005). Size-segregated Characterization of Atmospheric Aerosols in Taipei during Asian Outflow Episodes. Atmos. Res. 75, 89–109. doi:10.1016/j.atmosres.2004.12.002
Clean Air Institute (2012). Air Quality in Latin America: An Overview. Washington, DC: Clean Air Institute.
Coury, C., and Dillner, A. M. (2008). A Method to Quantify Organic Functional Groups and Inorganic Compounds in Ambient Aerosols Using Attenuated Total Reflectance FTIR Spectroscopy and Multivariate Chemometric Techniques. Atmos. Environ. 42, 5923–5932. doi:10.1016/j.atmosenv.2008.03.026
Crowley, J. N., Ammann, M., Cox, R. A., Hynes, R. G., Jenkin, M. E., Mellouki, A., et al. (2010). Evaluated Kinetic and Photochemical Data for Atmospheric Chemistry: Volume V - Heterogeneous Reactions on Solid Substrates. Atmos. Chem. Phys. 10, 9059–9223. doi:10.5194/acp-10-9059-2010
D’Andrilli, J., Foreman, C. M., Marshall, A. G., and McKnight, D. M. (2013). Characterization of IHSS Pony Lake Fulvic Acid Dissolved Organic Matter by Electrospray Ionization Fourier Transform Ion Cyclotron Resonance Mass Spectrometry and Fluorescence Spectroscopy. Org. Geochem. 65, 19–28. doi:10.1016/j.orggeochem.2013.09.013
Davarcioglu, B. (2011). Spectral Characterization of Non-clay Minerals Found in the Clays (Central Anatolian-Turkey). Int. J. Phys. Sci. 6, 511–522. doi:10.5897/IJPS10.615
Dittmar, T., and Stubbins, A. (2014). “Dissolved Organic Matter in Aquatic Systems,” in Treatise on Geochemistry. Editors H. D. Holland, and K. K. Turekian. Second Edition (Oxford: Elsevier), 125–156. doi:10.1016/B978-0-08-095975-7.01010-X
Domínguez, E., Mercado, J. A., Quesada, M. A., and Heredia, A. (1999). Pollen Sporopollenin: Degradation and Structural Elucidation. Sex. Plant Reprod. 12, 171–178. doi:10.1007/s004970050189
Duan, X., Yan, Y., Li, R., Deng, M., Hu, D., and Peng, L. (2021). Seasonal Variations, Source Apportionment, and Health Risk Assessment of Trace Metals in PM2.5 in the Typical Industrial City of Changzhi, China. Atmos. Pollut. Res. 12, 365–374. doi:10.1016/j.apr.2020.09.017
Duarte, R. M. B. O., Santos, E. B. H., Pio, C. A., and Duarte, A. C. (2007). Comparison of Structural Features of Water-Soluble Organic Matter from Atmospheric Aerosols with Those of Aquatic Humic Substances. Atmos. Environ. 41, 8100–8113. doi:10.1016/j.atmosenv.2007.06.034
Escobedo-Morales, A., Ruiz-López, I. I., Ruiz-Peralta, M. d., Tepech-Carrillo, L., Sánchez-Cantú, M., and Moreno-Orea, J. E. (2019). Automated Method for the Determination of the Band Gap Energy of Pure and Mixed Powder Samples Using Diffuse Reflectance Spectroscopy. Heliyon 5, e01505–19. doi:10.1016/j.heliyon.2019.e01505
Fraund, M., Bonanno, D. J., China, S., Pham, D. Q., Veghte, D., Weis, J., et al. (2020). Optical Properties and Composition of Viscous Organic Particles Found in the Southern Great Plains. Atmos. Chem. Phys. 20, 11593–11606. doi:10.5194/acp-20-11593-2020
Fu, P., Kawamura, K., Chen, J., Qin, M., Ren, L., Sun, Y., et al. (2015). Fluorescent Water-Soluble Organic Aerosols in the High Arctic Atmosphere. Sci. Rep. 5, 1–8. doi:10.1038/srep09845
Gaddam, C. K., and Vander Wal, R. L. (2013). Physical and Chemical Characterization of SIDI Engine Particulates. Combust. Flame 160, 2517–2528. doi:10.1016/j.combustflame.2013.05.025
Gilham, R. J. J., Spencer, S. J., Butterfield, D., Seah, M. P., and Quincey, P. G. (2008). On the Applicability of XPS for Quantitative Total Organic and Elemental Carbon Analysis of Airborne Particulate Matter. Atmos. Environ. 42, 3888–3891. doi:10.1016/j.atmosenv.2008.01.007
Gipson, K., Stevens, K., Brown, P., and Ballato, J. (2015). Infrared Spectroscopic Characterization of Photoluminescent Polymer Nanocomposites. J. Spectrosc. 2015, 1–9. doi:10.1155/2015/489162
González, L. T., Longoria Rodríguez, F. E., Sánchez-Domínguez, M., Cavazos, A., Leyva-Porras, C., Silva-Vidaurri, L. G., et al. (2017). Determination of Trace Metals in TSP and PM 2.5 Materials Collected in the Metropolitan Area of Monterrey, Mexico: A Characterization Study by XPS, ICP-AES and SEM-EDS. Atmos. Res. 196, 8–22. doi:10.1016/j.atmosres.2017.05.009
González, L. T., Longoria-Rodríguez, F. E., Sánchez-Domínguez, M., Leyva-Porras, C., Acuña-Askar, K., Kharissov, B. I., et al. (2018). Seasonal Variation and Chemical Composition of Particulate Matter: A Study by XPS, ICP-AES and Sequential Microanalysis Using Raman with SEM/EDS. J. Environ. Sci. 74, 32–49. doi:10.1016/j.jes.2018.02.002
González, L. T., Rodríguez, F. E. L., Sánchez-Domínguez, M., Leyva-Porras, C., Silva-Vidaurri, L. G., Acuna-Askar, K., et al. (2016). Chemical and Morphological Characterization of TSP and PM2.5 by SEM-EDS, XPS and XRD Collected in the Metropolitan Area of Monterrey, Mexico. Atmos. Environ. 143, 249–260. doi:10.1016/j.atmosenv.2016.08.053
Graber, E. R., and Rudich, Y. (2006). Atmospheric HULIS: How Humic-like Are They? A Comprehensive and Critical Review. Atmos. Chem. Phys. 6, 729–753. doi:10.5194/acp-6-729-2006
Guascito, M. R., Cesari, D., Chirizzi, D., Genga, A., and Contini, D. (2015). XPS Surface Chemical Characterization of Atmospheric Particles of Different Sizes. Atmos. Environ. 116, 146–154. doi:10.1016/j.atmosenv.2015.06.028
Happo, M. S., Salonen, R. O., Hälinen, A. I., Jalava, P. I., Pennanen, A. S., Dormans, J. A. M. A., et al. (2010). Inflammation and Tissue Damage in Mouse Lung by Single and Repeated Dosing of Urban Air Coarse and Fine Particles Collected from Six European Cities. Inhal. Toxicol. 22, 402–416. doi:10.3109/08958370903527908
Hecobian, A., Zhang, X., Zheng, M., Frank, N., Edgerton, E. S., and Weber, R. J. (2010). Water-soluble Organic Aerosol Material and the Light-Absorption Characteristics of Aqueous Extracts Measured over the Southeastern United States. Atmos. Chem. Phys. 10, 5965–5977. doi:10.5194/acp-10-5965-2010
Hoek, G., Mennen, M. G., Allen, G. A., Hofschreuder, P., and Van Der Meulen, T. (1996). Concentrations of Acidic Air Pollutants in The Netherlands. Atmos. Environ. 30, 3141–3150. doi:10.1016/1352-2310(96)00032-5
Huang, R.-J., Yang, L., Cao, J., Chen, Y., Chen, Q., Li, Y., et al. (2018). Brown Carbon Aerosol in Urban Xi'an, Northwest China: The Composition and Light Absorption Properties. Environ. Sci. Technol. 52, 6825–6833. doi:10.1021/acs.est.8b02386
Huertas, J. I., Camacho, D. A., and Huertas, M. E. (2012). Standardized Emissions Inventory Methodology for Open-Pit Mining Areas. Environ. Sci. Pollut. Res. 19, 2784–2794. doi:10.1007/s11356-012-0778-3
Huguet, A., Vacher, L., Relexans, S., Saubusse, S., Froidefond, J. M., and Parlanti, E. (2009). Properties of Fluorescent Dissolved Organic Matter in the Gironde Estuary. Org. Geochem. 40, 706–719. doi:10.1016/j.orggeochem.2009.03.002
Huo, M. Q., Sato, K., Ohizumi, T., Akimoto, H., and Takahashi, K. (2016). Characteristics of Carbonaceous Components in Precipitation and Atmospheric Particle at Japanese Sites. Atmos. Environ. 146, 164–173. doi:10.1016/j.atmosenv.2016.07.017
Ishii, S. K. L., and Boyer, T. H. (2012). Behavior of Reoccurring PARAFAC Components in Fluorescent Dissolved Organic Matter in Natural and Engineered Systems: A Critical Review. Environ. Sci. Technol. 46, 2006–2017. doi:10.1021/es2043504
Jacobson, M. Z. (2004). Climate Response of Fossil Fuel and Biofuel Soot, Accounting for Soot's Feedback to Snow and Sea Ice Albedo and Emissivity. J. Geophys. Res. 109, a–n. doi:10.1029/2004JD004945
Jacobson, M. Z. (2001). Strong Radiative Heating Due to the Mixing State of Black Carbon in Atmospheric Aerosols. Nature 409, 695–697. doi:10.1038/35055518
Ji, Z., Dai, R., and Zhang, Z. (2015). Characterization of Fine Particulate Matter in Ambient Air by Combining TEM and Multiple Spectroscopic Techniques - NMR, FTIR and Raman Spectroscopy. Environ. Sci. Process. Impacts 17, 552–560. doi:10.1039/c4em00678j
Khare, P., Baruah, B. P., and Rao, P. G. (2011). Water-soluble Organic Compounds (WSOCs) in PM2.5 and PM10 at a Subtropical Site of India. Tellus, Ser. B Chem. Phys. Meteorol. 63, 990–1000. doi:10.1111/j.1600-0889.2011.00564.x
Kim, H., Kim, J. Y., Jin, H. C., Lee, J. Y., and Lee, S. P. (2016). Seasonal Variations in the Light-Absorbing Properties of Water-Soluble and Insoluble Organic Aerosols in Seoul, Korea. AtmosEnviron 129, 234–242. doi:10.1016/j.atmosenv.2016.01.042
Kirillova, E. N., Andersson, A., Tiwari, S., Srivastava, A. K., Bisht, D. S., and Gustafsson, Ö. (2014). Water-soluble Organic Carbon Aerosols during a Full New Delhi Winter: Isotope-Based Source Apportionment and Optical Properties. J. Geophys. Res. Atmos. 119, 3476–3485. doi:10.1002/2013JD020041
Kondo, Y., Miyazaki, Y., Takegawa, N., Miyakawa, T., Weber, R. J., Jimenez, J. L., et al. (2007). Oxygenated and Water-Soluble Organic Aerosols in Tokyo. J. Geophys. Res. Atmos. 112, D01203. doi:10.1029/2006JD007056
Lee, H. J., Julie), , Laskin, A., Laskin, J., and Nizkorodov, S. A. (2013). Excitation–Emission Spectra and Fluorescence Quantum Yields for Fresh and Aged Biogenic Secondary Organic Aerosols. Environ. Sci. Technol. 47, 5763–5770. doi:10.1021/es400644c
Lee, H. S., Kang, C.-M., Kang, B.-W., and Kim, H.-K. (1999). Seasonal Variations of Acidic Air Pollutants in Seoul, South Korea. Atmos. Environ. 33, 3143–3152. doi:10.1016/S1352-2310(98)00382-3
Leskinen, A., Ruuskanen, A., Kolmonen, P., Zhao, Y., Fang, D., Wang, Q., et al. (2020). The Contribution of Black Carbon and Non-BC Absorbers to the Aerosol Absorption Coefficient in Nanjing, China. Aerosol Air Qual. Res. 20, 590–605. doi:10.4209/aaqr.2019.06.0326
Lin, P., Bluvshtein, N., Rudich, Y., Nizkorodov, S. A., Laskin, J., and Laskin, A. (2017). Molecular Chemistry of Atmospheric Brown Carbon Inferred from a Nationwide Biomass Burning Event. Environ. Sci. Technol. 51, 11561–11570. doi:10.1021/acs.est.7b02276
Liñán-Abanto, R. N., Peralta, O., Salcedo, D., Ruiz-Suárez, L. G., Arnott, P., Paredes-Miranda, G., et al. (2019). Optical Properties of Atmospheric Particles over an Urban Site in Mexico City and a Peri-Urban Site in Queretaro. J. Atmos. Chem. 76, 201–228. doi:10.1007/s10874-019-09394-1
Lippmann, M., Ito, K., Hwang, J.-S., Maciejczyk, P., and Chen, L.-C. (2006). Cardiovascular Effects of Nickel in Ambient Air. Environ. Health Perspect. 114, 1662–1669. doi:10.1289/ehp.9150
Liu, C., Chung, C. E., Yin, Y., and Schnaiter, M. (2018). The Absorption Ångström Exponent of Black Carbon: from Numerical Aspects. Atmos. Chem. Phys. 18, 6259–6273. doi:10.5194/acp-18-6259-2018
Liu, J., Bergin, M., Guo, H., King, L., Kotra, N., Edgerton, E., et al. (2013). Size-resolved Measurements of Brown Carbon in Water and Methanol Extracts and Estimates of Their Contribution to Ambient Fine-Particle Light Absorption. Atmos. Chem. Phys. 13, 12389–12404. doi:10.5194/acp-13-12389-2013
Longoria-Rodríguez, F. E., González, L. T., Mancilla, Y., Acuña-Askar, K., Arizpe-Zapata, J. A., González, J., et al. (2021). Sequential SEM-EDS, PLM, and MRS Microanalysis of Individual Atmospheric Particles: A Useful Tool for Assigning Emission Sources. Toxics 9, 37. doi:10.3390/toxics9020037
Longoria-Rodríguez, F. E., González, L. T., Mendoza, A., Leyva-Porras, C., Arizpe-Zapata, A., Esneider-Alcalá, M., et al. (2020). Environmental Levels, Sources, and Cancer Risk Assessment of PAHs Associated with PM2.5 and TSP in Monterrey Metropolitan Area. Arch. Environ. Contam. Toxicol. 78, 377–391. doi:10.1007/s00244-019-00701-1
López-Ayala, O., González-Hernández, L.-T., Alcantar-Rosales, V.-M., Elizarragaz-de la Rosa, D., Heras-Ramírez, M.-E., Silva-Vidaurri, L.-G., et al. (2019). Levels of Polycyclic Aromatic Hydrocarbons Associated with Particulate Matter in a Highly Urbanized and Industrialized Region in Northeastern Mexico. Atmos. Pollut. Res. 10, 1655–1662. doi:10.1016/j.apr.2019.06.006
Lu, S., Hao, X., Liu, D., Wang, Q., Zhang, W., Liu, P., et al. (2016). Mineralogical Characterization of Ambient Fine/ultrafine Particles Emitted from Xuanwei C1 Coal Combustion. Atmos. Res. 169, 17–23. doi:10.1016/j.atmosres.2015.09.020
Makuła, P., Pacia, M., and Macyk, W. (2018). How to Correctly Determine the Band Gap Energy of Modified Semiconductor Photocatalysts Based on UV-Vis Spectra. J. Phys. Chem. Lett. 9, 6814–6817. doi:10.1021/acs.jpclett.8b02892
Mancilla, Y., Herckes, P., Fraser, M. P., and Mendoza, A. (2015). Secondary Organic Aerosol Contributions to PM2.5 in Monterrey, Mexico: Temporal and Seasonal Variation. Atmos. Res. 153, 348–359. doi:10.1016/j.atmosres.2014.09.009
Mancilla, Y., Hernandez Paniagua, I. Y., and Mendoza, A. (2019). Spatial Differences in Ambient Coarse and Fine Particles in the Monterrey Metropolitan Area, Mexico: Implications for Source Contribution. J. Air & Waste Manag. Assoc. 69, 548–564. doi:10.1080/10962247.2018.1549121
Mancilla, Y., Mendoza, A., Fraser, M. P., and Herckes, P. (2016). Organic Composition and Source Apportionment of Fine Aerosol at Monterrey, Mexico, Based on Organic Markers. Atmos. Chem. Phys. 16, 953–970. doi:10.5194/acp-16-953-2016
Maria, S. F., Russell, L. M., Turpin, B. J., and Porcja, R. J. (2002). FTIR Measurements of Functional Groups and Organic Mass in Aerosol Samples over the Caribbean. Atmos. Environ. 36, 5185–5196. doi:10.1016/S1352-2310(02)00654-4
Martin, S. T., Hung, H.-M., Park, R. J., Jacob, D. J., Spurr, R. J. D., Chance, K. V., et al. (2004). Effects of the Physical State of Tropospheric Ammonium-Sulfate-Nitrate Particles on Global Aerosol Direct Radiative Forcing. Atmos. Chem. Phys. 4, 183–214. doi:10.5194/acp-4-183-2004
Martinez, M. A., Caballero, P., Carrillo, O., Mendoza, A., and Mejia, G. M. (2012). Chemical Characterization and Factor Analysis of PM2.5 in Two Sites of Monterrey, Mexico. J. Air & Waste Manag. Assoc. 62, 817–827. doi:10.1080/10962247.2012.681421
Matos, J. T. V., Freire, S. M. S. C., Duarte, R. M. B. O., and Duarte, A. C. (2015). Natural Organic Matter in Urban Aerosols: Comparison between Water and Alkaline Soluble Components Using Excitation-Emission Matrix Fluorescence Spectroscopy and Multiway Data Analysis. Atmos. Environ. 102, 1–10. doi:10.1016/j.atmosenv.2014.11.042
McKnight, D. M., Boyer, E. W., Westerhoff, P. K., Doran, P. T., Kulbe, T., and Andersen, D. T. (2001). Spectrofluorometric Characterization of Dissolved Organic Matter for Indication of Precursor Organic Material and Aromaticity. Limnol. Oceanogr. 46, 38–48. doi:10.4319/lo.2001.46.1.0038
Menges, F. (2020). “Spectragryph–Optical Spectroscopy Software,” Version 1.2.15, 2020. Available at: http://www.effemm2.de/spectragryph/.
Miyazaki, Y., Kondo, Y., Shiraiwa, M., Takegawa, N., Miyakawa, T., Han, S., et al. (2009). Chemical Characterization of Water-Soluble Organic Carbon Aerosols at a Rural Site in the Pearl River Delta, China, in the Summer of 2006. J. Geophys. Res. 114. doi:10.1029/2009JD011736
Mladenov, N., Alados-Arboledas, L., Olmo, F. J., Lyamani, H., Delgado, A., Molina, A., et al. (2011). Applications of Optical Spectroscopy and Stable Isotope Analyses to Organic Aerosol Source Discrimination in an Urban Area. Atmos. Environ. 45, 1960–1969. doi:10.1016/j.atmosenv.2011.01.029
Mo, Y., Li, J., Cheng, Z., Zhong, G., Zhu, S., Tian, C., et al. (2021). Dual Carbon Isotope‐Based Source Apportionment and Light Absorption Properties of Water‐Soluble Organic Carbon in PM2.5 over China. JGR Atmos. 126, 1–13. doi:10.1029/2020JD033920
Moosmüller, H., Chakrabarty, R. K., Ehlers, K. M., and Arnott, W. P. (2011). Absorption Ångström Coefficient, Brown Carbon, and Aerosols: Basic Concepts, Bulk Matter, and Spherical Particles. Atmos. Chem. Phys. 11, 1217–1225. doi:10.5194/acp-11-1217-2011
Morozzi, P., Ballarin, B., Arcozzi, S., Brattich, E., Lucarelli, F., Nava, S., et al. (2021). Ultraviolet-Visible Diffuse Reflectance Spectroscopy (UV-Vis DRS), a Rapid and Non-destructive Analytical Tool for the Identification of Saharan Dust Events in Particulate Matter Filters. Atmos. Environ. 252, 118297. doi:10.1016/j.atmosenv.2021.118297
Murphy, K. R., Hambly, A., Singh, S., Henderson, R. K., Baker, A., Stuetz, R., et al. (2011). Organic Matter Fluorescence in Municipal Water Recycling Schemes: Toward a Unified PARAFAC Model. Environ. Sci. Technol. 45, 2909–2916. doi:10.1021/es103015e
Murphy, K. R., Stedmon, C. A., Graeber, D., and Bro, R. (2013). Fluorescence Spectroscopy and Multi-Way Techniques. PARAFAC. Anal. Methods 5, 6557–6566. doi:10.1039/c3ay41160e
Murphy, K. R., Stedmon, C. A., Wenig, P., and Bro, R. (2014). OpenFluor- an Online Spectral Library of Auto-Fluorescence by Organic Compounds in the Environment. Anal. Methods 6, 658–661. doi:10.1039/c3ay41935e
Nagabhushana, H., Nagaraju, G., Nagabhushana, B. M., Shivakumara, C., and Chakradhar, R. P. S. (2010). Hydrothermal Synthesis and Characterization of CaSO4pseudomicrorods. Philos. Mag. Lett. 90, 289–298. doi:10.1080/09500831003636051
Pant, P., Shukla, A., Kohl, S. D., Chow, J. C., Watson, J. G., and Harrison, R. M. (2015). Characterization of Ambient PM2.5 at a Pollution Hotspot in New Delhi, India and Inference of Sources. Atmos. Environ. 109, 178–189. doi:10.1016/j.atmosenv.2015.02.074
Paoletti, L., Berardis, B. D. E., and Arrizza, L. (2003). Inquinamento da polveri e da particolato fino in siti con differenti caratteristiche ambientali. Ann. Ist. Super. Sanità 39, 381–385. doi:10.1049/el:20031096
Pokhrel, R. P., Beamesderfer, E. R., Wagner, N. L., Langridge, J. M., Lack, D. A., Jayarathne, T., et al. (2017). Relative Importance of Black Carbon, Brown Carbon, and Absorption Enhancement from Clear Coatings in Biomass Burning Emissions. Atmos. Chem. Phys. 17, 5063–5078. doi:10.5194/acp-17-5063-2017
Pucher, M., Wünsch, U., Weigelhofer, G., Murphy, K., Hein, T., and Graeber, D. (2019). StaRdom: Versatile Software for Analyzing Spectroscopic Data of Dissolved Organic Matter in R. Water 11, 2366. doi:10.3390/w11112366
Qian, Y., Yasunari, T. J., Doherty, S. J., Flanner, M. G., Lau, W. K. M., Ming, J., et al. (2015). Light-absorbing Particles in Snow and Ice: Measurement and Modeling of Climatic and Hydrological Impact. Adv. Atmos. Sci. 32, 64–91. doi:10.1007/s00376-014-0010-0
Qin, J., Tan, J., Zhou, X., Yang, Y., Qin, Y., Wang, X., et al. (2021). Measurement Report: Particle-size-dependent Fluorescence Properties of Water-Soluble Organic Compounds (WSOCs) and Their Atmospheric Implications for the Aging of WSOCs. Atmos. Chem. Phys. 22, 465–479. doi:10.5194/acp-22-465-2022
Qin, J., Zhang, L., Zhou, X., Duan, J., Mu, S., Xiao, K., et al. (2018). Fluorescence Fingerprinting Properties for Exploring Water-Soluble Organic Compounds in PM2.5 in an Industrial City of Northwest China. Atmos. Environ. 184, 203–211. doi:10.1016/j.atmosenv.2018.04.049
Radulescu, C., Stihi, C., Iordache, S., Dunea, D., and Dulama, I. D. (2017). Characterization of Urban Atmospheric PM2.5 by ATR-FTIR, ICP-MS and SEM-EDS Techniques. Rev. Chim. 68, 805–810. doi:10.37358/rc.17.4.5557
Ravindra, K., Singh, T., Mandal, T. K., Sharma, S. K., and Mor, S. (2022). Seasonal Variations in Carbonaceous Species of PM2.5 Aerosols at an Urban Location Situated in Indo-Gangetic Plain and its Relationship with Transport Pathways, Including the Potential Sources. J. Environ. Manag. 303, 114049. doi:10.1016/j.jenvman.2021.114049
Ravisankar, R., Kiruba, S., Eswaran, P., Senthilkumar, G., and Chandrasekaran, A. (2010). Mineralogical Characterization Studies of Ancient Potteries of Tamilnadu, India by FT-IR Spectroscopic Technique. E-Journal Chem. 7, S185–S190. doi:10.1155/2010/643218
Rietveld, H. M. (1969). A Profile Refinement Method for Nuclear and Magnetic Structures. J. Appl. Cryst. 2, 65–71. doi:10.1107/s0021889869006558
Saitoh, K., Sera, K., and Shirai, T. (2008). Characterization of Atmospheric Aerosol Particles in a Mountainous Region in Northern Japan. Atmos. Res. 89, 324–329. doi:10.1016/j.atmosres.2008.03.007
Satish, R., Shamjad, P., Thamban, N., Tripathi, S., and Rastogi, N. (2017). Temporal Characteristics of Brown Carbon over the Central Indo-Gangetic Plain. Environ. Sci. Technol. 51, 6765–6772. doi:10.1021/acs.est.7b00734
Sellitto, V. M., Fernandes, R. B. A., Barrón, V., and Colombo, C. (2009). Comparing Two Different Spectroscopic Techniques for the Characterization of Soil Iron Oxides: Diffuse versus Bi-directional Reflectance. Geoderma 149, 2–9. doi:10.1016/j.geoderma.2008.11.020
Secretaría de Salud (2014). “NORMA Oficial Mexicana NOM-025-SSA1-2014, Salud Ambiental,” in Valores límite permisibles para la concentración de partículas suspendidas PM10 y PM2.5 en el aire ambiente y criterios para su evaluación, México, DF.
Shaka’, H., and Saliba, N. A. (2004). Concentration Measurements and Chemical Composition of PM10-2.5 and PM2.5 at a Coastal Site in Beirut, Lebanon. Atmos. Environ. 38, 523–531. doi:10.1016/j.atmosenv.2003.10.009
Siciliano, T., Siciliano, M., Malitesta, C., Proto, A., Cucciniello, R., Giove, A., et al. (2018). Carbonaceous PM10 and PM2.5 and Secondary Organic Aerosol in a Coastal Rural Site Near Brindisi (Southern Italy). Environ. Sci. Pollut. Res. 25, 23929–23945. doi:10.1007/s11356-018-2237-2
Simonsen, M. E., Sønderby, C., Li, Z., and Søgaard, E. G. (2009). XPS and FT-IR Investigation of Silicate Polymers. J. Mat. Sci. 44, 2079–2088. doi:10.1007/s10853-009-3270-9
Søndergaard, M., Stedmon, C. A., and Borch, N. H. (2003). Fate of Terrigenous Dissolved Organic Matter (DOM) in Estuaries: Aggregation and Bioavailability. Ophelia 57, 161–176. doi:10.1080/00785236.2003.10409512
Song, X., Shao, L., Zheng, Q., and Yang, S. (2014). Mineralogical and Geochemical Composition of Particulate Matter (PM10) in Coal and Non-coal Industrial Cities of Henan Province, North China. Atmos. Res. 143, 462–472. doi:10.1016/j.atmosres.2014.03.015
Stedmon, C. A., and Markager, S. (2005). Resolving the Variability in Dissolved Organic Matter Fluorescence in a Temperate Estuary and its Catchment Using PARAFAC Analysis. Limnol. Oceanogr. 50, 686–697. doi:10.4319/lo.2005.50.2.0686
Sullivan, A. P., and Weber, R. J. (2006). Chemical Characterization of the Ambient Organic Aerosol Soluble in Water: 2. Isolation of Acid, Neutral, and Basic Fractions by Modified Size-Exclusion Chromatography. J. Geophys. Res. 111, 1–19. doi:10.1029/2005JD006486
Szalai, Z., Kiss, K., Jakab, G., Sipos, P., Belucz, B., and Németh, T. (2013). The Use of UV-VIS-NIR Reflectance Spectroscopy to Identify Iron Minerals. Astron. Nachr. 334, 940–943. doi:10.1002/asna.201211965
Tang, M. J., Whitehead, J., Davidson, N. M., Pope, F. D., Alfarra, M. R., McFiggans, G., et al. (2015). Cloud Condensation Nucleation Activities of Calcium Carbonate and its Atmospheric Ageing Products. Phys. Chem. Chem. Phys. 17, 32194–32203. doi:10.1039/c5cp03795f
Tarantola, A., Voudouris, P., Eglinger, A., Scheffer, C., Trebus, K., Bitte, M., et al. (2019). Metamorphic and Metasomatic Kyanite-Bearing Mineral Assemblages of Thassos Island (Rhodope, Greece). Minerals 9, 252. doi:10.3390/MIN9040252
Teich, M., Van Pinxteren, D., Wang, M., Kecorius, S., Wang, Z., Müller, T., et al. (2017). Contributions of Nitrated Aromatic Compounds to the Light Absorption of Water-Soluble and Particulate Brown Carbon in Different Atmospheric Environments in Germany and China. Atmos. Chem. Phys. 17, 1653–1672. doi:10.5194/acp-17-1653-2017
Torrent, J., and Barrón, V. (2015). “Diffuse Reflectance Spectroscopy,” in Methods of Soil Analysis Part 5—Mineralogical Methods, 5.5. Wisconsin: Soil Science Society of America, 5, 367–385. doi:10.2136/sssabookser5.5.c13
Tsapakis, M., Lagoudaki, E., Stephanou, E. G., Kavouras, I. G., Koutrakis, P., Oyola, P., et al. (2002). The Composition and Sources of PM2.5 Organic Aerosol in Two Urban Areas of Chile. Atmos. Environ. 36, 3851–3863. doi:10.1016/S1352-2310(02)00269-8
Varrica, D., Tamburo, E., Vultaggio, M., and Di Carlo, I. (2019). ATR-FTIR Spectral Analysis and Soluble Components of PM10 and PM2.5 Particulate Matter over the Urban Area of Palermo (Italy) during Normal Days and Saharan Events. Ijerph 16, 2507. doi:10.3390/ijerph16142507
Wang, H., Zhang, L., Huo, T., Wang, B., Yang, F., Chen, Y., et al. (2020). Application of Parallel Factor Analysis Model to Decompose Excitation-Emission Matrix Fluorescence Spectra for Characterizing Sources of Water-Soluble Brown Carbon in PM2.5. Atmos. Environ. 223, 117192. doi:10.1016/j.atmosenv.2019.117192
Wang, Z., Wang, R., Wang, J., Wang, Y., McPherson Donahue, N., Tang, R., et al. (2022). The Seasonal Variation, Characteristics and Secondary Generation of PM2.5 in Xi'an, China, Especially during Pollution Events. Environ. Res. 212, 113388. doi:10.1016/j.envres.2022.113388
Wen, H., Zhou, Y., Xu, X., Wang, T., Chen, Q., Chen, Q., et al. (2021). Water-soluble Brown Carbon in Atmospheric Aerosols along the Transport Pathway of Asian Dust: Optical Properties, Chemical Compositions, and Potential Sources. Sci. Total Environ. 789, 147971. doi:10.1016/j.scitotenv.2021.147971
Wonaschütz, A., Hitzenberger, R., Bauer, H., Pouresmaeil, P., Klatzer, B., Caseiro, A., et al. (2009). Application of the Integrating Sphere Method to Separate the Contributions of Brown and Black Carbon in Atmospheric Aerosols. Environ. Sci. Technol. 43, 1141–1146. doi:10.1021/es8008503
Wu, C., Wang, G., Li, J., Li, J., Cao, C., Ge, S., et al. (2020). The Characteristics of Atmospheric Brown Carbon in Xi'an, Inland China: Sources, Size Distributions and Optical Properties. Atmos. Chem. Phys. 20, 2017–2030. doi:10.5194/acp-20-2017-2020
Wu, G., Fu, P., Ram, K., Song, J., Chen, Q., Kawamura, K., et al. (2021). Fluorescence Characteristics of Water-Soluble Organic Carbon in Atmospheric Aerosol☆☆. Environ. Pollut. 268, 115906. doi:10.1016/j.envpol.2020.115906
Wu, G., Ram, K., Fu, P., Wang, W., Zhang, Y., Liu, X., et al. (2019). Water-Soluble Brown Carbon in Atmospheric Aerosols from Godavari (Nepal), a Regional Representative of South Asia. Environ. Sci. Technol. 53, 3471–3479. doi:10.1021/acs.est.9b00596
Wünsch, U. J., and Murphy, K. (2021). A Simple Method to Isolate Fluorescence Spectra from Small Dissolved Organic Matter Datasets. Water Res. 190, 116730. doi:10.1016/j.watres.2020.116730
Xu, P., Xu, J., He, M., Song, L., Chen, D., Guo, G., et al. (2016). Morphology and Chemical Characteristics of Micro- and Nano-Particles in the Haze in Beijing Studied by XPS and TEM/EDX. Sci. Total Environ. 565, 827–832. doi:10.1016/j.scitotenv.2016.03.042
Yan, C., Zheng, M., Sullivan, A. P., Bosch, C., Desyaterik, Y., Andersson, A., et al. (2015). Chemical Characteristics and Light-Absorbing Property of Water-Soluble Organic Carbon in Beijing: Biomass Burning Contributions. Atmos. Environ. 121, 4–12. doi:10.1016/j.atmosenv.2015.05.005
Yan, G., and Kim, G. (2017). Speciation and Sources of Brown Carbon in Precipitation at Seoul, Korea: Insights from Excitation-Emission Matrix Spectroscopy and Carbon Isotopic Analysis. Environ. Sci. Technol. 51, 11580–11587. doi:10.1021/acs.est.7b02892
Yan, J., Wang, X., Gong, P., Wang, C., and Cong, Z. (2018). Review of Brown Carbon Aerosols: Recent Progress and Perspectives. Sci. Total Environ. 634, 1475–1485. doi:10.1016/j.scitotenv.2018.04.083
Yang, Y., Qin, J., Qi, T., Zhou, X., Chen, R., Tan, J., et al. (2020). Fluorescence Characteristics of Particulate Water-Soluble Organic Compounds Emitted from Coal-Fired Boilers. Atmos. Environ. 223, 117297. doi:10.1016/j.atmosenv.2020.117297
Yu, X., Song, W., Yu, Q., Li, S., Zhu, M., Zhang, Y., et al. (2018). Fast Screening Compositions of PM2.5 by ATR-FTIR: Comparison with Results from IC andOC/EC Analyzers. J. Environ. Sci. 71, 76–88. doi:10.1016/j.jes.2017.11.021
Yuan, W., Huang, R.-J., Yang, L., Guo, J., Chen, Z., Duan, J., et al. (2020). Characterization of the Light-Absorbing Properties, Chromophore Composition and Sources of Brown Carbon Aerosol in Xi'an, Northwestern China. Atmos. Chem. Phys. 20, 5129–5144. doi:10.5194/acp-20-5129-2020
Yue, Y., Cheng, J., Lee, K. S., Stocker, R., He, X., Yao, M., et al. (2022). Effects of Relative Humidity on Heterogeneous Reaction of SO2 with CaCO3 Particles and Formation of CaSO4·2H2O Crystal as Secondary Aerosol. Atmos. Environ. 268, 118776. doi:10.1016/j.atmosenv.2021.118776
Zarasvandi, A., Carranza, E. J. M., Moore, F., and Rastmanesh, F. (2011). Spatio-Temporal Occurrences and Mineralogical‐Geochemical Characteristics of Airborne Dusts in Khuzestan Province (Southwestern Iran). J. Geochemical. Explor. 111, 138–151. doi:10.1016/j.gexplo.2011.04.004
Zapata-Hernandez, C., Durango-Giraldo, G., Tobón, C., and Buitrago-Sierra, R. (2020). Physicochemical Characterization of Airborne Particulate Matter in Medellín, Colombia, and its Use in an In Silico Study of Ventricular Action Potential. Water. Air. Soil Pollut. 231, 508. doi:10.1007/s11270-020-04884-5
Zeb, B., Alam, K., Sorooshian, A., Blaschke, T., Ahmad, I., and Shahid, I. (2018). On the Morphology and Composition of Particulate Matter in an Urban Environment. Aerosol Air Qual. Res. 18, 1431–1447. doi:10.4209/aaqr.2017.09.0340
Zent, A. P., Ichimura, A. S., Quinn, R. C., and Harding, H. K. (2008). The Formation and Stability of the Superoxide Radical (O2−) on Rock-Forming Minerals: Band Gaps, Hydroxylation State, and Implications for Mars Oxidant Chemistry. J. Geophys. Res. 113, 1–13. doi:10.1029/2007JE003001
Zhan, Y., Tsona, N. T., Li, J., Chen, Q., and Du, L. (2022). Water-soluble Matter in PM2.5 in a Coastal City over China: Chemical Components, Optical Properties, and Source Analysis. J. Environ. Sci. 114, 21–36. doi:10.1016/j.jes.2021.07.011
Zhou, Y., Xiao, H., Guan, H., Zheng, N., Zhang, Z., Tian, J., et al. (2020). Chemical Composition and Seasonal Variations of PM2.5 in an Urban Environment in Kunming, SW China: Importance of Prevailing Westerlies in Cold Season. Atmos. Environ. 237, 117704. doi:10.1016/j.atmosenv.2020.117704
Zhuo, J. F., Guo, W. D., Deng, X., Zhang, Z. Y., Xu, J., and Huang, L. F. (2010). [Fluorescence Excitation-Emission Matrix Spectroscopy of CDOM from Yundang Lagoon and its Indication for Organic Pollution]. Guang Pu Xue Yu Guang Pu Fen Xi 30, 1539–1544.
Keywords: PM2.5, mass absorption efficiency (MAE)., water-soluble organic carbon (WSOC), parallel factor analysis (PARAFAC), Ångström absorption exponent
Citation: Acuña Askar K, González LT, Mendoza A, Kharissova OV, Rodríguez-Garza A, Lara EM, Campos A, López-Serna D, Bautista-Carrillo LM, Alfaro-Barbosa JM and Longoria-Rodríguez FE (2022) Chemical Composition, Optical Properties and Sources of PM2.5 From a Highly Urbanized Region in Northeastern Mexico. Front. Environ. Sci. 10:929449. doi: 10.3389/fenvs.2022.929449
Received: 26 April 2022; Accepted: 08 June 2022;
Published: 04 July 2022.
Edited by:
Michael MacKinnon, University of California, Irvine, United StatesReviewed by:
Bighnaraj Sarangi, University of Puerto Rico, Puerto RicoCopyright © 2022 Acuña Askar, González, Mendoza, Kharissova, Rodríguez-Garza, Lara, Campos, López-Serna, Bautista-Carrillo, Alfaro-Barbosa and Longoria-Rodríguez. This is an open-access article distributed under the terms of the Creative Commons Attribution License (CC BY). The use, distribution or reproduction in other forums is permitted, provided the original author(s) and the copyright owner(s) are credited and that the original publication in this journal is cited, in accordance with accepted academic practice. No use, distribution or reproduction is permitted which does not comply with these terms.
*Correspondence: Lucy T. González, bHVjeS5nb256YWxlekB0ZWMubXg=
Disclaimer: All claims expressed in this article are solely those of the authors and do not necessarily represent those of their affiliated organizations, or those of the publisher, the editors and the reviewers. Any product that may be evaluated in this article or claim that may be made by its manufacturer is not guaranteed or endorsed by the publisher.
Research integrity at Frontiers
Learn more about the work of our research integrity team to safeguard the quality of each article we publish.