 Panxing He
 Xiaoliang Ma1,2†
94% of researchers rate our articles as excellent or good
Learn more about the work of our research integrity team to safeguard the quality of each article we publish.
Find out more
ORIGINAL RESEARCH article
Front. Environ. Sci., 07 September 2022
Sec. Drylands
Volume 10 - 2022 | https://doi.org/10.3389/fenvs.2022.928351
This article is part of the Research TopicCurrent Insights in DrylandsView all 13 articles
Gross primary productivity (GPP) is an important parameter in the carbon cycle and climate change studies. The results of GPP fluxes estimated based on multiple models or remote sensing vary widely, but current studies of GPP in Chinese grasslands tend to ignore data uncertainty. In this study, uncertainty analysis of GPP datasets estimated based on terrestrial ecosystem models and remote sensing was conducted using cross-validation, standard error statistics, and ensemble empirical modal decomposition. We found that 1) the fit coefficients R2 of two-by-two cross-validation of GPP datasets mostly exceeded 0.8 at the global scale. 2) GPP from different sources were consistent in portraying the spatial and temporal patterns of GPP in Chinese grasslands. However, due to many differences in model structure, parameterization and driving data, some uncertainties still exist, especially in the parts of dry-cold areas where the standard deviations are relatively large. 3) Uncertainties were higher for future scenarios than for historical periods, and GPP uncertainties were much higher for future high-emissions scenarios than for low- and medium-emissions scenarios. This study highlighted the need for uncertainty analysis when GPP is applied to spatio-temporal analysis, and suggested that when comparing and assessing carbon balance conditions, multiple source data sets should be combined to avoid misleading conclusion due to uncertainty.
The ability to evaluate the strengths and weaknesses of gross primary productivity (GPP) between site observations, model simulations, and remote sensing estimates can be evaluated by comparing multiple source datasets against each other (Randerson et al., 2009). Eddy covariance techniques can accurately measure net ecosystem CO2 exchange, and ecosystem respiration can be removed from this variable to directly obtain GPP observations from flux towers at the site scale (Falge et al., 2001; Morales et al., 2021). However, flux towers only provide a composite measure of CO2 fluxes over the footprint (the area upwind of the flux tower measurement), whose size and shape (ranging from several hundred meters to several kilometers) vary with tower height, physical properties of the canopy, and wind speed (Osmond et al., 2004). The observation footprint is so small that it is not suitable for use in evaluating models and remotely sensed coarse resolution GPP datasets. In addition, there are not yet enough effective observation systems for long periods and large scales in Chinese grasslands because of the spatio-temporal constraints and high cost of flux tower site observations (Yuan et al., 2014). To accurately assess the large-scale GPP dynamics in Chinese grasslands, the spatio-temporal applicability of models and remote sensing GPP in Chinese grasslands needs to be analyzed from macroscopic and long series. Therefore, when there is a lack of validation of the actual measurement data, uncertainty analysis can only be done on GPP data from different sources.
Based on the observed ecophysiological, biophysical, and biogeochemical processes (Sitch et al., 2008; Huang et al., 2015), terrestrial ecosystem models can theoretically obtain a high enough resolution grid GPP and are currently an effective method for studying GPP variability and its climate effects at large spatial and temporal scales (Yuan et al., 2021). However, the accuracy of model GPP is limited by the uncertainty of input parameters, model-driven data, and defects in the physical structure of the model, leading to large uncertainties in the GPP simulated by individual models (Zaehle et al., 2005; Cheng et al., 2017). In addition, using satellite-derived GPP, Mao et al. (2012) pointed out that remote sensing provides large-scale information on real changes in vegetation, land use, and landforms, which can provide valuable observations at large scales for terrestrial ecosystem models to correct model GPP products.
To analyze the uncertainty among the models, the four Inter-Sectoral Impact Model Intercomparison Project (ISIMIP) and four Multi-scale Synthesis and Terrestrial Model Intercomparison Project (MsTMIP) models covered above were used to analyze GPP data uncertainty. The ISIMIP and MsTMIP projects were originally established to assess the physical mechanisms of climate feedback differences among models and were used to explore the reasons for the different results between models for the same driving data outputs. Currently, a small number of studies on model uncertainty have been conducted for ISIMIP and MsTMIP (Shao et al., 2016; Krysanova et al., 2017; Exbrayat et al., 2018), but the spatio-temporal applicability of the two sets of model GPP data in Chinese grasslands has still not been compared.
The purpose of this study is to assess the capability of eight terrestrial ecosystem models in ISIMIP and MsTMIP to simulate GPP, explore the influence of initial conditions and model structure on model GPP uncertainty, and propose to address 1) cross-validation of GPP products from global-scale ISIMIP, MsTMIP, Global Land Surface Satellite (GLASS), and Multisource data Synergized Quantitative (MuSYQ) on an pixel-by-pixel basis; 2) study the GPP simulation capability of ISIMIP and MsTMIP by comparing with GLASS and MuSYQ remote sensing observations of GPP, investigate the ability of ISIMIP and MsTMIP to simulate the historical phase (1981–2005) of the mean climate state and long-term trend of GPP for grasslands in China through comparative analysis with GLASS and MuSYQ remote sensing observations of GPP; 3) explore the future scenarios of different models in ISIMIP for typical emission pathways RCP2.6, RCP6.0, and RCP8.5 (LPJmL model only) (2005–2099) for China’s grassland GPP.
The GPP data used in this study mainly include eight simulated GPP datasets provided by ISIMIP and MsTMIP, two observation GPP datasets provided by GLASS and MuSyQ. Descriptions of the relevant datasets have been published in our previous analysis (He et al., 2022), but the difference is that this study focuses on GPP uncertainty.
Ecological process models are the only means to study the impact of global change factors on the carbon cycle of ecosystems in the context of past, present and future global change (Wei et al., 2014). Schimel et al. (2000) simulated several different ecosystem process models and found that, due to the huge differences in complexity, input parameters and simulation algorithms of different models, researchers should used multi-model simulation and intercomparison to quantify the uncertainty of GPP in terrestrial ecosystems. At present, the International Comparison Scheme of Multi-Terrestrial Ecosystem Models has developed rapidly, such as ISIMIP (https://www.isimip.org/), MsTMIP (https://nacp.ornl.gov/MsTMIP.shtml), and TRENDY (http://globalcarbonproject.org/) for the annual global carbon balance report. Moreover, MsTMIP and ISIMIP are publicly available free of charge without application.
(1) The MsTMIP is a model comparison program designed to diagnose differences in simulations of historical terrestrial carbon cycle dynamics between models (Huntzinger et al., 2013). The ecological process models participating in MsTMIP all use the same driving data to provide GPP output products for historical periods (Wei et al., 2014; Zscheischler et al., 2014). In the latest release of model simulations (https://doi.org/10.3334/ORNLDAAC/1225), MsTMIP provides monthly-valued GPP products with a spatial resolution of 0.5°, and a time span of 1901–2010. Based on the need for sensitivity analysis, we selected four terrestrial ecosystem models in MsTMIP for multiple scenarios based on the findings of previous studies (Zhou et al., 2017): Community Land Model version 4(CLM4) (Mao et al., 2012), CLM4-Variable Infiltration Capacity model (CLM4VIC) (Li et al., 2011), Dynamic Land Ecosystem Model (DLEM) (Tian et al., 2012), and Integrated Science Assessment Model (ISAM) (Jain et al., 2013) were used as the basis dataset for this study. The MsTMIP model provides multi-simulation GPP results for different scenarios, and only the BG1 scenario of MsTMIP (with all environmental drivers) was used in our study.
(2) The ISIMIP is a model comparison program that assesses a comprehensive and consistent description of global climate dynamics under different climate change scenarios (Rosenzweig et al., 2017), and aims to provide international organizations and individual countries with a framework for sustainable projections of climate change and its impacts (https://esg.pik-potsdam.de/projects/isimip/). The four terrestrial GPP datasat providing GPP data, were screened for historical period (1901–2005) and future (2006–2099) scenarios under strict adherence to the ISIMIP2b standard protocol. The ISIMIP applied the atmospheric circulation model IPSL-CM5A-LR as meteorological forcing data, and output products of the global terrestrial vegetation dynamics model (monthly, 0.5°). We used Ecosystem Models: CARbon Assimilation In the Biosphere (CARAIB) (Warnant et al., 1994), Lund-Potsdam-Jena: General Ecosystem Simulator (LPJ GUESS) (Smith et al., 2014), Lund-Potsdam-Jena managed Land (LPJmL) (Bondeau et al., 2007), and Organizing Carbon and Hydrology in Dynamic EcosystEms: Dynamic Global Vegetation Model (ORCHIDEE DGVM) (Guimberteau et al., 2018) in this study.
(3) The GLASS is widely used in the study of global change. Among them, the ecosystem GPP is the most important product dataset of GLASS, which spans nearly 40 years (1982–2018), and becomes the primary choice for the current study of long-term evolution characteristics of GPP due to its relatively high spatio-temporal resolution (0.05°, 8 days). Previous research found that GLASS GPP can better characterize the photosynthetic productivity of major ecosystem types than other satellite-based GPP models (Yuan et al., 2014). The link to access this GLASS GPP is: http://www.glass.umd.edu/Download.html.
In addition, to avoid misleading results from a single remote sensing algorithm inversion of GPP, another MuSyQ GPP algorithm based on photosynthetic use efficiency model was used in this study to compare the accuracy of GLASS GPP results (Wang et al., 2021). The MuSyQ GPP (8 days and 0.05°) products for 1982–2018 are available. Crucially, when cross-validating with the model GPP data, we resampled the remotely sensing GPP to half-degree resolution in line with the model GPP.
(4) The CRU climate dataset uses an extrapolated spatial interpolation algorithm to obtain a global image-by-image gridded product by integrating measured information from various meteorological stations on a global scale (Harris et al., 2020). In this study, we used temperature and precipitation data with a temporal resolution of 1 month and a spatial resolution of 0.5° provided by CRU TS Version 4.02 (https://crudata.uea.ac.uk/cru/data/hrg/).
(1) In this study, the Manner-Kendall (M-K) nonparametric test was applied to calculate the trend of GPP over time (Kendall and Gibbons 1957; Culotta 1995). Assuming a time series with n years (x1,…, xn), for all k, j ≤ n, and k ≠ j, the distributions of xj and xk are different, the test statistic S is calculated with the following equation.
S is normally distributed with mean 0 and variance Var(S) = n (n − 1) (2n + 5)/18. When n > 10, the standard normal statistic variable is calculated by the following equation.
For statistical values, greater than 0 indicates an increase in the series; the opposite is true for a decrease. However, since the M-K nonparametric test can only provide the sign and statistical significance of the trend of the variable, it cannot clarify the size of the trend of the variable. Therefore, the Sen’s slope estimation method was introduced in this study to quantify the degree of change in the trend of the variables.
The Sen’s slope estimation method is a method for robustly fitting a line to a sampled point in the plane (simple linear regression) by selecting the median of the slope of all lines at paired points, which provides a good response to the degree of change in the series trend, and the Sen’s slope K is given by the following
where i is a constant taking value of (1,2,…,n); n is the length of the time series; xj and xk are the sequences of j and k, respectively; and j > k is satisfied.
The statistical method was implemented in MATLAB software (Note: The statistics and plots in this study are based on MATLAB software unless otherwise stated).
(2) The Empirical Mode Decomposition (EMD) method is an adaptive time-frequency method first proposed, which is widely used in climate signal processing. EMD is applied to decompose the original signal into a series of Intrinsic Mode Function (IMF) signals. However, EMD suffers from the modal mixing problem, and the components of IMF may lose their practical meaning. To solve this problem, researcher proposed Ensemble Empirical Mode Decomposition (EEMD) (Wu and Huang 2009), a method to aid data analysis by controlled addition of white noise, which can improve EMD performance overall.
As can be seen from the equation, EEMD decomposes a time series into a series of eigenmodal function IMF components. The resulting IMF signal must satisfy two conditions: the number of extremes and the number of zero crossings must be equal or differ by one, and the mean of the two envelopes is defined by local maxima and local minima. IMF is the same as the original time series but with differences in frequency and amplitude, from IMF one to IMF X, the frequency decreases sequentially. The residual component is monotonic and contains only one extreme value, so it can be considered as the overall trend of the original series. In this study, the amplitude of white noise is added as 1/5 times the standard deviation of the original time series GPP data, the number of IMFs is five, and the number of pooled average members is 100.
The cross-validation of the GPPs of each source at the whole Earth showed that the GPPs of the two combinations are in good agreement (Figure 1). The R2 values of ISIMIP, MsTMIP, GLASS, and MuSyQ are all high among each other, especially the R2 between IMSMIP and GLASS is close to 0.85, and even the combination of ISIMIIP and MuSyQ with the lowest R2 is over 0.79. This reflects that the model simulation and remote sensing observation GPPs fit well on the global with high consistency. When compared the remotely sensed GPP of different algorithms, we found that the fitted R2 of GLASS with MsTMIP and ISIMIP model GPP is obviously higher, 0.85 and 0.84, respectively, which is significantly higher than 0.79 and 0.80 of MuSyQ. This represents that GLASS GPP may be able to portray the true value of GPP at global better than MuSyQ.
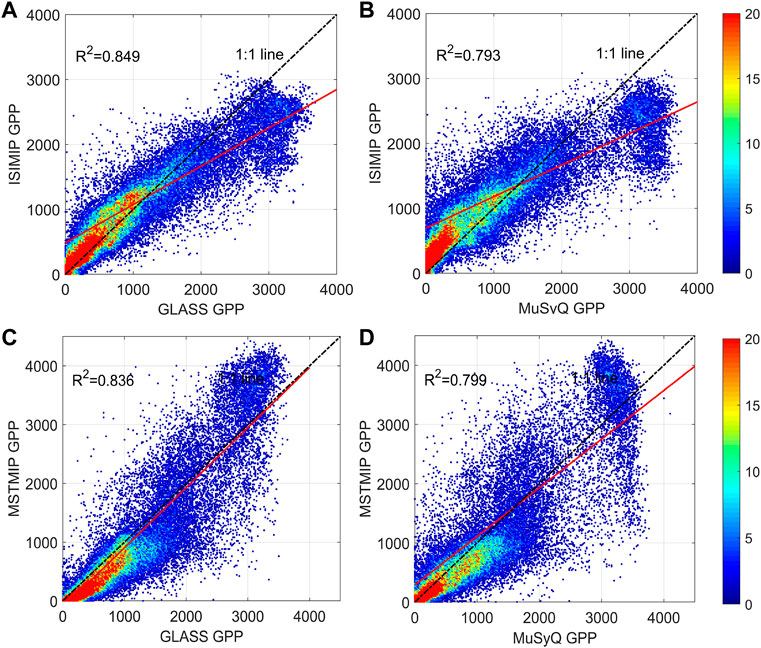
FIGURE 1. Cross-validation between four different sources of GPP data at the global scale per pixel. (A) ISIMIP vs. GLASS; (B) ISIMIP vs. MuSyQ; (C) MsTMIP vs. GLASS; (D) MsTMIP vs. MuSyQ.
Most of the global pixel values are concentrated within the value of 1,000 g C m−3. The prominent feature of value threshold data is that the GPP simulated by the ISIMIP model is significantly above the 1:1 value line, which is significantly higher than the remotely sensed GPP, represents a possible overestimation of ISIMIP at the low value threshold GPP. However, the same modeled MsTMIP GPP, the low-value threshold is clearly lower than the two remotely sensed datasets, represents that MsTMIP may underestimate GPP.
Before analyzed the uncertainty of the spatial mean state of GPP in Chinese grasslands during the historical period, the spatial distribution of GPP from various sources in Chinese grasslands was shown, and the influence of environmental factors (temperature, precipitation) on the spatial distribution of GPP in ecosystems is initially explored. Figure 2 showed the spatial distribution of GPP from multiple sources, indicated that each GPP maintains a similar spatial pattern, with higher GPP values closer to the east and a gradual decrease in GPP closer to the inland northwest. The high value area includes the eastern part of the Inner Mongolia steppe, the middle-eastern part of Qinghai-Tibet Plateau and the southeastern part of Loess Plateau, while the low value area includes the western part of Inner Mongolia steppe, most of Qinghai-Tibet Plateau, Xinjiang and the northwestern part of Loess Plateau. The spatial divergence is obviously related to the combination of water and heat resources. When the mean values of ecosystem GPP in different precipitation and temperature intervals were analyzed, we found that the high value areas of GPP in Chinese grasslands were mostly located in areas with higher temperature and more abundant precipitation, while the low value areas were mostly concentrated in areas with water scarcity and temperature limitation (Figure 3).
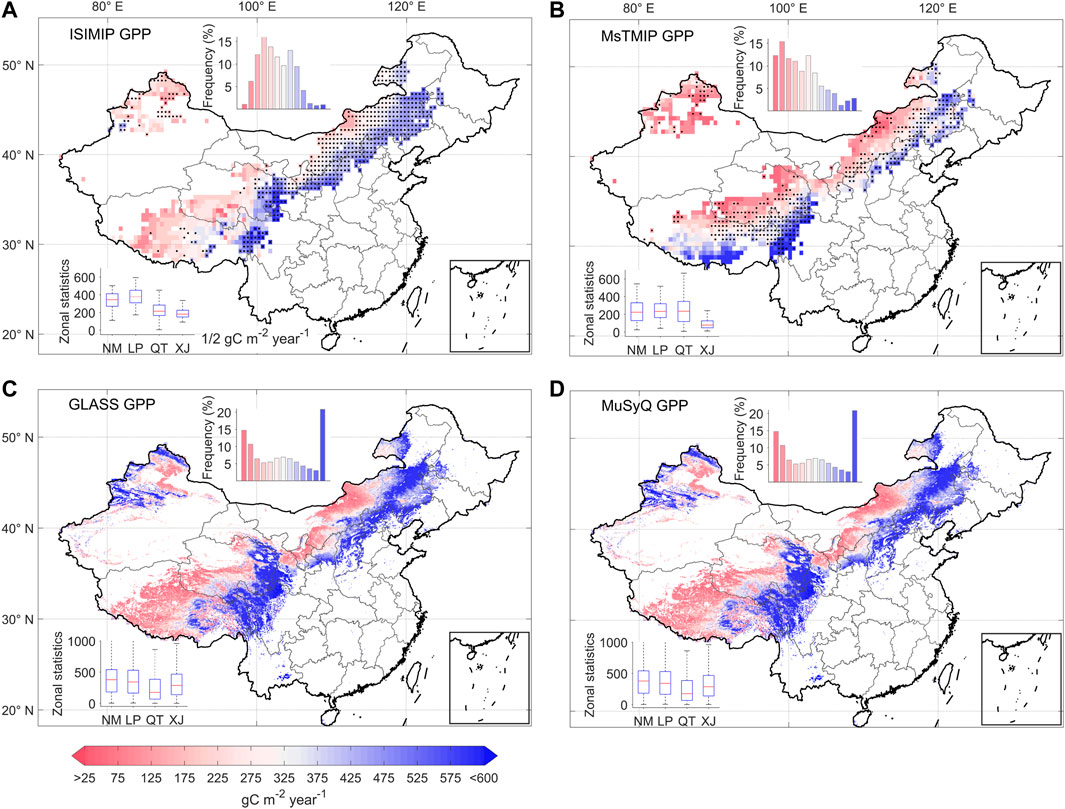
FIGURE 2. Spatial patterns of ecosystem GPP value per pixel estimated based on process model simulations and remote sensing datasets for the period 1982–2005. (A) ISIMIP; (B) MsTMIP; (C) GLASS; (D) MuSyQ. The results of averaging over multiple model ensembles to reduce inter-model errors were used in Figure (A,B). Black dots represent standard deviations between members that exceed 50% of the mean of the model ensemble. The regional average trend values are counted as box plots in the lower left corner, NM, LP, QT, and XJ represent grasslands in Inner Mongolia, Loess Plateau, Qinghai-Tibet Plateau, and Xinjiang, respectively, red dots represent GPP anomalies.
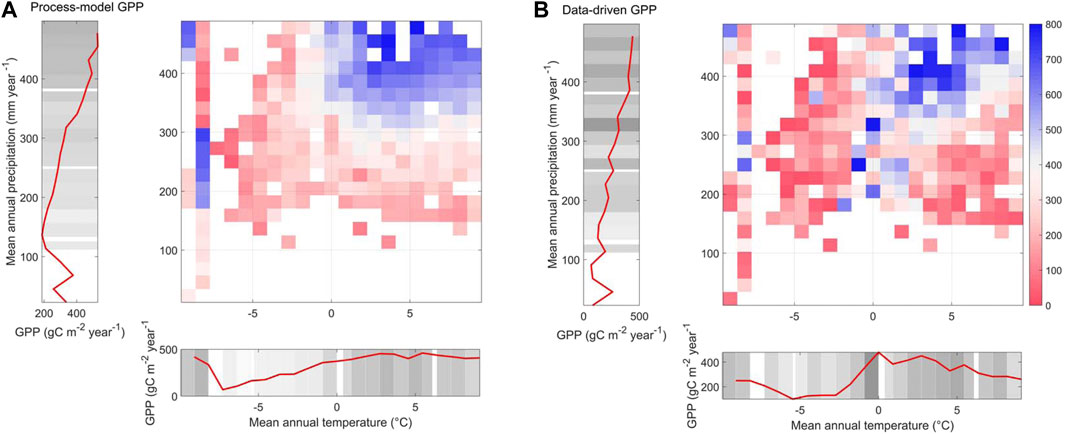
FIGURE 3. Mean values of GPP of Chinese grasslands in different temperature and precipitation intervals. The precipitation and temperature variables here are the multi-year average annual total precipitation and the multi-year average annual average temperature, respectively. The red curve in the figure represents the mean value of GPP at that temperature and precipitation value threshold. The gray shading represents the uncertainty, and the darker the color reflects the greater uncertainty of GPP. (A) Simulated GPP based on ecosystem process model; (B) Estimated GPP based on remote sensing dataset.
As shown in Figure 4, the GPP mean states based on models and remote sensing differed, and there were also differences between GPPs at different spatial scales. The difference between the GPP simulated by different ISIMIP models is very obvious for Chinese grasslands, with a maximum of 720 g C m−2 and a minimum of 380 g C m−2, and the extreme difference is nearly double. The simulation results of MsTMIP multi-model are closer, and the same two remote sensing GPP estimation results are similar. Compared the absolute values of GPP for each source at both national and global scales, we found that the GPP values are closer, which is consistent with the findings in Section 3.1 that multi-source GPP may have a better match at the global scale, but the error may be large at the regional scale. This reminds that in regional studies, a single model or remotely sensed GPP should not be selected as the base data, but rather a multi-source dataset should be used to judge whether the conclusion obtained from a single data are reliable. Multiple source datasets can provide multiple conclusion that increase the robustness and applicability of the conclusion, and also avoid misleading findings as much as possible.
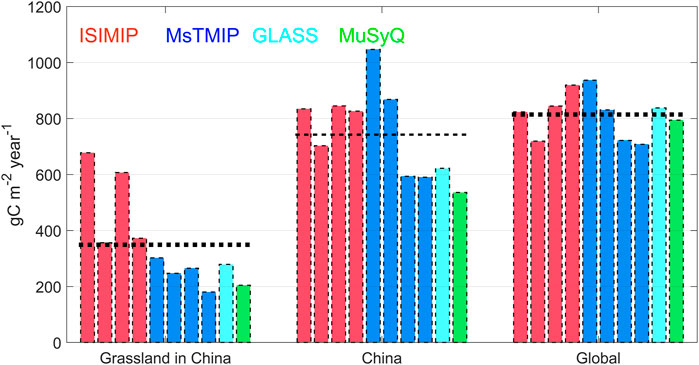
FIGURE 4. Average GPP from multiple sources for Chinese grasslands, China, and globally during 1982–2005. The black dashed line parallel to the x-axis is the ensemble mean of the four ISIMIP process models and the four MsTMIP process models.
Considerd that the simulation of GPP by different models is influenced by the model complexity and climate state settings, the accuracy of GPP obtained from the simulation should be more concerned with the consistency of its evolution characteristics over time rather than its mean size (Dirmeyer et al., 2004). To eliminate the effect of differences in the climate state of GPP between different models, the distance level of GPP over the time series was first calculated. The time series of the mean GPP distance levels for the four different sources were shown in Figure 5A. To facilitate comparison between ISIMIP and MsTMIP multi-models, doubled standard deviation was used to indicate the variability between the two groups of terrestrial ecosystem model members. The analysis revealed that the ensemble averages of the two groups of models showed very similar patterns of change during the period 1901–2005, with both showed a significant upward trend and a significantly faster rate of increased since 1980. Comparison with the two remotely sensed GPPs also showed that the evolution characteristics of model GPP and remotely sensed GPP over time are consistent overall (Figure 5A). Figure 5B reflected the time series of the simulated standard deviations of the two GPP ensembles, ISIMIP and MsTMIP, and we found that the standard deviations of the two GPP models are significantly different over time.
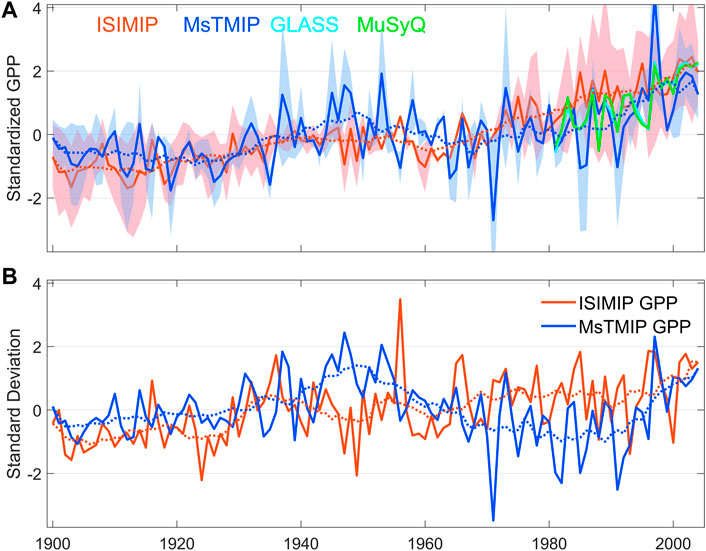
FIGURE 5. Time series of annual average GPP distance levels based on multiple data sources. Shading represents the doubled standard deviation of the four model members. Dotted dashed lines are 20-years moving average of ISIMIP GPP and MsTMIP GPP. (A) Annual average GPP; (B) model GPP standard deviation.
To quantitatively assess the inter-model uncertainty, the relative standard deviation (relative standard deviation was defined as the ratio of standard deviation to mean GPP) between the members of the ISIMIP and MsTMIP models was then obtained. The relative standard deviation, which is more applicable than the standard deviation, was used in this study because it is considered that the relative standard deviation can effectively eliminate GPP units and facilitate the intercomparison of the two groups of models in different climate zones. From the analysis of Figure 6, we point out that the differences between different ISIMIP simulations are greater than MsTMIP (Figures 6A,B), and the relative standard deviation among the four ISIMIP models is less than 20% of the ensemble average for 26.71% of the pixels in Chinese grasslands, while 28.43% of the pixels are greater than 50% of the ensemble average and they are mostly located in the grasslands of eastern Inner Mongolia, western Qinghai-Tibet Plateau, and Xinjiang. In contrast, 69.36% and 90.02% of the pixels were less than 20% and 50% of the ensemble average, respectively, for MsTMIP. Therefore, the relative standard deviation of MsTMIP is significantly smaller than that of ISIMIP, which means that there is less variation among GPP results output from MsTMIP at the image element scale.
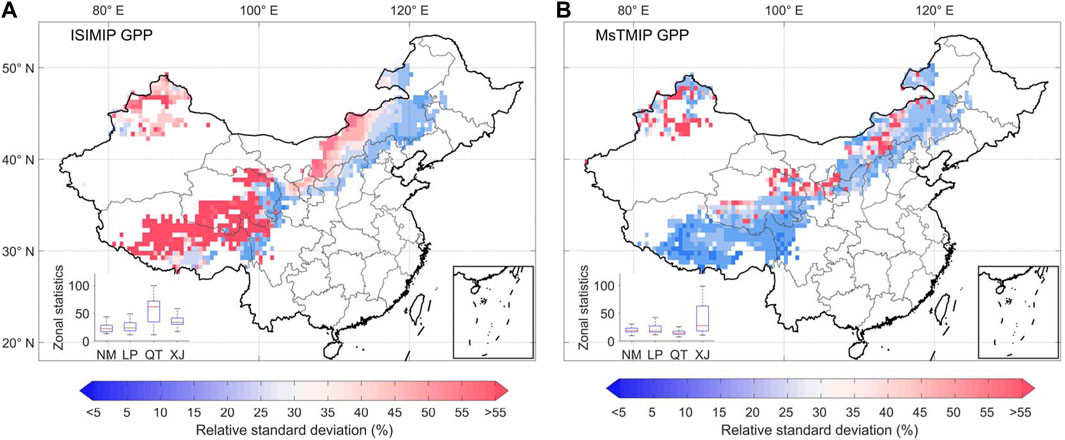
FIGURE 6. Spatial patterns of the relative standard deviations of the (A) ISIMIP, and (B) MsTMIP simulations for the period 1901–2005.
The above studies used standard deviation to demonstrate the uncertainty among models, but the standard deviation is essentially an averaging value that does not fully reflect the subtle differences among different members of the models. Therefore, in our study, time series distance levels of GPP simulated by eight terrestrial ecosystem models for the period 1901–2005 were calculated (Figure 7A). We found that the results vary among model members but the trends are nearly consistent, i.e., individual models all showed an upward trend while showing interannual fluctuations of varying amplitudes. In addition, we found that the pooled averaging (black line in Figure 7A) effectively eliminates the interannual fluctuations of the model, and makes the data show only low-frequency signals. Since interannual fluctuations generally contain a large amount of uncertain information about the internal variability of the model, pooled averaging is an important way to effectively eliminate the uncertainty of the internal variability of the model.
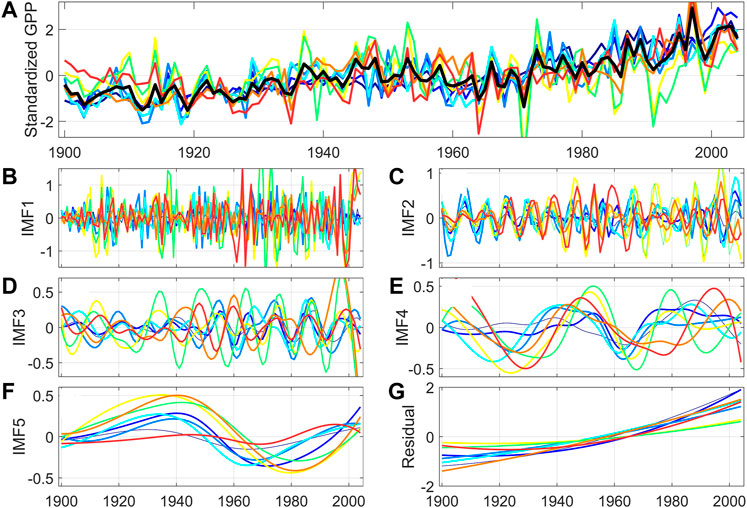
FIGURE 7. Average GPP distance levels for 1901–2005 and IMF1...IMF5, and the time series of residuals. (A) Time series of simulated GPP distance levels for the four ISIMIP and four MsTMIP models, the black line is the result of the average of the eight model ensembles; (B–F) time series of IMF1 to IMF5 extracted by the EEMD method; (G) residuals extracted by the EEMD method.
To further explore the uncertainty of the model results on different time scales, the GPP of each model on the original time series was decomposed into five IMF components and residuals at different time scales by the EEMD method. Figures 7B–G showed the variation curves of IFM1 to IFM5 with time series, representing the GPP signals at different time scales from high frequency to low frequency, and the residuals represent the long-term trend of GPP. The analysis showed that the five IMFs have different periodic signals, and their variation periods are shortening while their amplitudes are becoming larger as the signal frequency decreases. However, we noted that there are differences in the simulated curves of IMF3 and IMF4, which indicated that the model complexity can lead to uncertainty in the model GPP at each time scale. As seen in the residual signals, the eight models exhibit a generally consistent upward trend, and this is consistent with the conclusive information presented in Figure 6A. However, the long-run signals of the residuals whose starting values in 1901 and 2005 are inconsistent suggest that there is still some uncertainty in the simulated GPP for each model.
Since only the ISIMIP model comparison program provides GPP products under future emission scenarios, the uncertainty of the ISIMIP GPP dataset under future scenarios is then analyzed. Figure 8 showed the long-term change curves of the GPP models for each future scenario, which showed that the overall Chinese grassland GPP maintains some increase from 2006 to 2099 for the low, medium, and high scenarios. The analysis of the change curves and doubling standard deviation of each model showed that the difference between the models is relatively small in the first half of the 21st century, while the uncertainty increases in the second half of the century with increasing standard deviation.
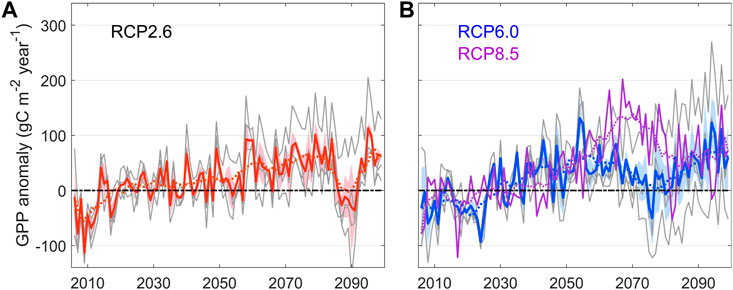
FIGURE 8. Time series of ISIMIP annual average GPP distance levels for future periods, distance levels are based on 2006–2025 average. (A) RCP2.6; (B) RCP6.0 and RCP8.5, note that the RCP8.5 model only provides the LPJmL model so only its curves are plotted. The gray lines in the figure represent the distance level of the four models in the time series for the RCP2.6 (A) and RCP6.0 (B) scenarios, and the shading represents the doubled standard deviation of the four model members. The dotted dashed line is the 20-years moving average for ISIMIP GPP and MsTMIP GPP.
When compared the standard deviations within the Chinese grassland pixels for each future scenario, we found that the standard deviations of RCP2.6 and RCP6.0 were relatively low (Figure 9), reflecting that the differences among regions of Chinese grassland under the low-moderate emission scenario were relatively small and maintained a range in the time series. The standard deviation of Chinese grassland under the high emission scenario of RCP8.5 showed a gradual increase from 2030 onward, indicated that the standard deviation of Chinese grasslands under the RCP8.5 high emission scenario increased gradually after 2030, indicated that the simulated GPP between regions of Chinese grasslands became more spatially heterogeneous and the internal uncertainty increased with time.
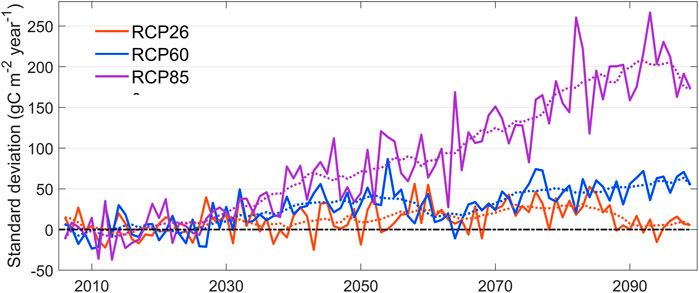
FIGURE 9. Time series of ISIMIP simulated standard distance levels for GPP in China grasslands for each emission scenario in the future period, with distance levels based on the 2006–2025 average.
After analyzing the percentage change between the second half and the first half of the 21st century (Figure 10), we found that under the RCP2.6 low emission scenario, the GPP values of most of the Chinese grasslands would exceed those of the first half of the century in the second half of the century, and the density distribution curve was more distributed to the right of the 0-value line, and most of the models showed a consistent percentage change in the direction. The RCP8.5 scenario showed the same direction of GPP percentage change as RCP6.0. We concluded that the GPP of Chinese grasslands will not continue to grow steadily under the medium and high emission scenarios in the future, and continued high emissions will limit the productivity accumulation of Chinese temperate grassland and Xinjiang grassland. However, the special point is that the simulation of the direction of the percentage change differs greatly among models for each future scenario Tibetan Plateau grassland in the second half of the century despite showing a stronger increase in GPP, reflecting the great challenge for the models to accurately portray the GPP change on the Tibetan Plateau.
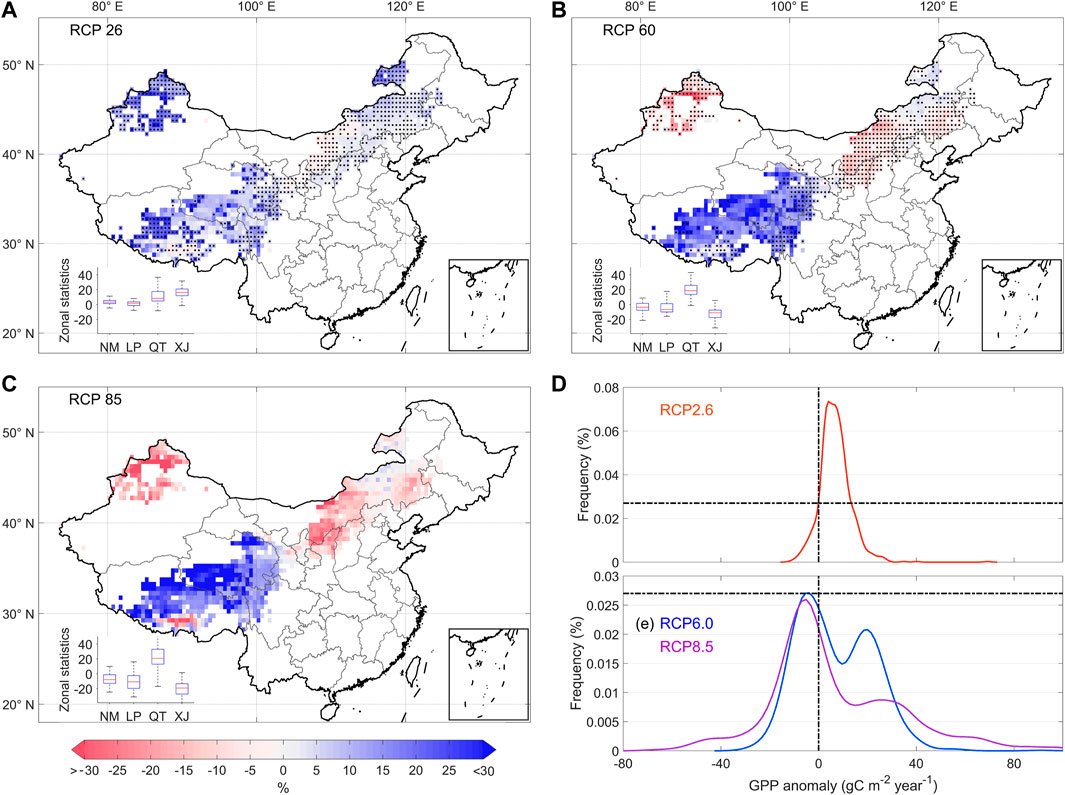
FIGURE 10. Percentage change in mean GPP from 2050 to 2099 compared to 2006–2049 over the Chinese grassland. (A) RCP2.6; (B) RCP6.0; (C) RCP8.5; (D) distribution density of percentages in the RCP2.6 scenario; (E) distribution density of percentages in the RCP6.0 and RCP8.5 scenarios. Where the black dots in figure (A,B) represent three of the four models where the positive and negative directions of percentages are consistent.
We indicated that terrestrial ecosystem models have significant uncertainties in model structure, parameterization, and driving data, and the correction and deterministic assessment of model data become important scientific issues (Shao et al., 2016; Cheng et al., 2017). We previously suggested that remote sensing technology provides near real-time indicators related to global vegetation growth and gross primary production, which can be a global-scale constraint for assessing the reliability of the information provided by ecological process models (Mao et al., 2012). In this study, based on the cross-validation results of the model and remotely sensed GPP, we found that the model is an important way to accurately portray the true GPP at the global scale, and its R2 fit coefficient between the model and remotely sensed data was as high as 0.8, which is consistent with the findings of Mao et al. (2012). However, the comparison with remotely sensed GPP data also reveals that there is a significant overestimation or underestimation of GPP in both models, especially in the pixels in the low GPP region. The reason for this discrepancy may be related to the uncertainty of the model input data in addition to the uncertainty of the model itself. For example, the climate information, system noise and processing bias input to the model can affect the accurate simulation of GPP at the regional scale (Wei et al., 2014; Cheng et al., 2017). In particular, the selected historical climate dataset inputs may cause considerable uncertainty in the estimated GPP with output fluctuations of 9%–20% (Jung et al., 2007; Barman et al., 2014; Wu et al., 2017). In our study, the input climate datasets selected in the MsTMIP model comparison program were mainly CRU-NCEP reanalysis data (Wei et al., 2014), while ISIMIP selected climate datasets from the IPSL-CM6A-LR climate model output (Boucher et al., 2020). Therefore, it is possible that the differences in the selection of climate input parameters led to the differences in the Chinese grassland GPP output from the two model datasets. In addition, other environmental drivers and related data are different between the two model sets, including time-varying atmospheric CO2 concentration, time-varying N deposition, C3/C4 fraction, major crop distribution, phenology, and soil characteristics, which may also be another reason for the existence of over- or under-estimation of model-simulated Chinese grassland GPP (Wei et al., 2014; Shao et al., 2016; Exbrayat et al., 2018).
Grassland GPP uncertainty in China showed an increasing pattern from southeast to northwest, which may be related to the differences in model responses under different environmental stresses. During the historical period, the grasslands of the Qinghai-Tibet Plateau, Xinjiang, and eastern Inner Mongolia had colder and drier climates, and the environmental stresses of moisture and temperature had a greater impact on the accuracy of model simulations (Jia et al., 2018), so the historical GPP based on model simulations also had large uncertainties in colder and drier environments (Shao et al., 2016). In contrast, for future emission scenarios, the uncertainty in model GPP increased in the second half of the 21st century and spatially showed that except for the Qinghai-Tibet Plateau (and the direction of change is not consistent among models), grasslands in other regions exhibit consistent decreasing GPP changes. This aspect reflects that the future GPP of Chinese grasslands will not consistently increase along with rising CO2 concentration and warming all the time. With the exception of the temperature-constrained Tibetan Plateau, the carbon sequestration capacity of the other grasslands, which are more sensitive to water (especially drought), will be greatly limited in the future (Wu and Wang 2022). On the other hand, we also be seen that accurately simulating the cold-dry Tibetan Plateau GPP in the future will still be quite difficult.
In addition, our study found that ensemble averaging can effectively eliminate the uncertainty of the internal variability among model GPPs, and make the results exhibit low-frequency signals, which is a reasonable and necessary treatment for multi-model ensemble averaging than the results of single-model simulations. The results of EEMD analysis showed that the amplitude of each IMF component after model ensemble averaging is significantly lower than the time series of the original values, which is consistent with the results of previous studies consistent with previous findings that the ensemble averaging method is not only effective in eliminating the effect of model internal variability, but also may filter out the interdecadal scale signal (Cheng et al., 2017), which is meaningful in many fields. Therefore, in the future, a new method that can eliminate the internal variability and retain the interdecadal scale signal in a more scientific way needs to be explored to resolve this conflict.
Uncertainty analysis of GPP datasets based on terrestrial ecosystem models and remote sensing estimates was conducted using cross-validation, standard error statistics and ensemble empirical modal decomposition. We found that 1) the R2 of the fit coefficients for two-by-two cross-validation of the GPP datasets mostly exceeded 0.8 globally. 2) GPP from different sources were consistent in portraying the spatiotemporal patterns of GPP in Chinese grasslands. However, due to many differences in model structure, parameterization, and driving data, uncertainties still exist, especially in the relatively large standard deviations in some arid-cold areas. 3) The uncertainties of future scenarios are higher than those of historical periods, and the GPP uncertainties of future high-emission scenarios are much higher than those of medium-low emission scenarios. In summary, we found that the uncertainty between different data is very large. Therefore, we recommend that multi-source data (including models and remote sensing) should be used when analyzing ecosystem GPP dynamics in the future, to avoid the shortcomings of a single data that is not sufficient to fully and truly reflect changes in ecosystem productivity.
The original contributions presented in the study are included in the article/supplementary material, further inquiries can be directed to the corresponding author.
Conceptualization, ZS and PH; Methodology, XYM and PH; Software, PH; Validation, PH and XYM; Formal analysis, PH; Investigation, PH and XYM; Re-sources, HP; Data curation, HP; Writing—original draft preparation, XLM, ZH, and PH; Writing—review and editing, XLM, XYM, and PH; Visualization, PH; Supervision, PH; Project administration, ZS and PH; Funding acquisition, ZS and PH. All authors have read and agreed to the published version of the manuscript.
This research was funded by Foundation items: National Natural Science Foundation of China, No. 32060408; National Basic Resources Survey Special, No. 2017FY100200; the Scientific Innovation Project of Postgraduates of Xinjiang Uygur Autonomous Region, China, No. XJ 2021G169.
The authors declare that the research was conducted in the absence of any commercial or financial relationships that could be construed as a potential conflict of interest.
All claims expressed in this article are solely those of the authors and do not necessarily represent those of their affiliated organizations, or those of the publisher, the editors and the reviewers. Any product that may be evaluated in this article, or claim that may be made by its manufacturer, is not guaranteed or endorsed by the publisher.
Barman, R., Jain, A., and Liang, M. (2014). Climate-driven uncertainties in modeling terrestrial gross primary production: A site level to global-scale analysis. Glob. Chang. Biol. 20 (5), 1394–1411. doi:10.1111/gcb.12474
Bondeau, A., Smith, P., Zaehle, S., Schaphoff, S., Lucht, W., Cramer, W., et al. (2007). Modelling the role of agriculture for the 20th century global terrestrial carbon balance. Glob. Chang. Biol. 13 (3), 679–706. doi:10.1111/j.1365-2486.2006.01305.x
Boucher, O., Servonnat, J., Albright, A., Aumont, O., Balkanski, Y., Bastrikov, V., et al. (2020). Presentation and evaluation of the IPSL-CM6A-LR climate model. J. Adv. Model. Earth Syst. 12 (7), 1–25. doi:10.1029/2019MS002010
Cheng, S., Huang, J., Ji, F., and Lin, L. (2017). Uncertainties of soil moisture in historical simulations and future projections: Uncertainties of soil moisture. J. Geophys. Res. Atmos. 122 (4), 2239–2253. doi:10.1002/2016JD025871
Culotta, E. (1995). Will plants profit from high CO2? Science 268 (5211), 654–656. doi:10.1126/science.268.5211.654
Dirmeyer, P., Guo, Z., and Gao, X. (2004). Comparison, validation, and transferability of eight multiyear global soil wetness products. J. Hydrometeorol. 5 (6), 1011–1033. doi:10.1175/JHM-388.1
Exbrayat, J., Bloom, A., Falloon, P., Ito, A., Smallman, T. L., and Williams, M. (2018). Reliability ensemble averaging of 21st century projections of terrestrial net primary productivity reduces global and regional uncertainties. Earth Syst. Dyn. 9 (1), 153–165. doi:10.5194/esd-9-153-2018
Falge, E., Baldocchi, D., Olson, R., Anthoni, P., Aubinet, M., Bernhofer, C., et al. (2001). Gap filling strategies for long term energy flux data sets. Agric. For. Meteorology 107 (1), 71–77. doi:10.1016/s0168-1923(00)00235-5
Guimberteau, M., Zhu, D., Maignan, F., Huang, Y., Yue, C., Dantec-Nédélec, S., et al. (2018). ORCHIDEE-MICT (v8.4.1), a land surface model for the high latitudes: Model description and validation. Geosci. Model Dev. 11 (1), 121–163. doi:10.5194/gmd-11-121-2018
Harris, I., Osborn, T., Jones, P., and Lister, D. (2020). Version 4 of the CRU TS monthly high-resolution gridded multivariate climate dataset. Sci. Data 7 (1), 109. doi:10.1038/s41597-020-0453-3
He, P., Ma, X., Meng, X., Han, Z., Liu, H., and Sun, Z. (2022). Spatiotemporal evolutionary and mechanism analysis of grassland GPP in China. Ecol. Indic. 143. doi:10.1016/j.ecolind.2022.109323
Huang, M., Piao, S., and Zeng, Z. (2015). Seasonal responses of terrestrial ecosystem water-use efficiency to climate change[J]. Glob. Change Biol. 22 (6), 2165–2177. doi:10.1111/gcb.13180
Huntzinger, D., Schwalm, C., Michalak, A., Schaefer, K., King, A. W., Wei, Y., et al. (2013). the north American carbon program multi-scale synthesis and terrestrial model intercomparison project – Part 1: Overview and experimental design. Geosci. Model Dev. 6 (6), 2121–2133. doi:10.5194/gmd-6-2121-2013
Jain, A., Meiyappan, P., Song, Y., and House, J. (2013). CO2 emissions from land-use change affected more by nitrogen cycle, than by the choice of land cover data. Glob. Chang. Biol. 19 (9), 2893–2906. doi:10.1111/gcb.12207
Jia, W., Liu, M., Wang, D., he, H., Shi, P., Li, Y., et al. (2018). Uncertainty in simulating regional gross primary productivity from satellite-based models over northern China grassland. Ecol. Indic. 88 (5), 134–143. doi:10.1016/j.ecolind.2018.01.028
Jung, M., Vetter, M., Herold, M., Churkina, G., Reichstein, M., Zaehle, S., et al. (2007). Uncertainties of modeling gross primary productivity over europe: A systematic study on the effects of using different drivers and terrestrial biosphere models. Glob. Biogeochem. Cycles 21 (4), 1–12. doi:10.1029/2006GB002915
Kendall, M., and Gibbons, J. (1957). Rank correlation methods. Biometrika 44 (2), 298. doi:10.2307/2333282
Krysanova, V., Vetter, T., Eisner, S., Huang, S. C., Pechlivanidis, I., Strauch, M., et al. (2017). Intercomparison of regional-scale hydrological models and climate change impacts projected for 12 large river basins worldwide-a synthesis. Environ. Res. Lett. 12 (10), 105002. doi:10.1088/1748-9326/aa8359
Li, H., Huang, M., Wigmosta, M., Ke, Y., Coleman, A. M., Leung, L. R., et al. (2011). Evaluating runoff simulations from the Community Land Model 4.0 using observations from flux towers and a mountainous watershed. J. Geophys. Res. 116 (D24), 1–19. doi:10.1029/2011jd016276
Mao, J., Thornton, P., Shi, X., Zhao, M., and Post, W. (2012). Remote sensing evaluation of CLM4 GPP for the period 2000-09. J. Clim. 25 (15), 5327–5342. doi:10.1175/JCLI-D-11-00401.1
Morales, L., Hernandez, A., Rodriguez, N., and Jimenez, R. (2021). Carbon exchange and accumulation in an orinoco high plains native savanna ecosystem as measured by eddy covariance. Front. Environ. Sci. 9, 673932. doi:10.3389/fenvs.2021.673932
Osmond, B., Ananyev, G., Berry, J., Langdon, C., Kolber, Z., Lin, G., et al. (2004). Changing the way we think about global change research: Scaling up in experimental ecosystem science. Glob. Chang. Biol. 10 (4), 393–407. doi:10.1111/j.1529-8817.2003.00747.x
Randerson, J., Hoffman, F., Thornton, P., Mahowald, N., Lindsay, K., Lee, Y.-H., et al. (2009). Systematic assessment of terrestrial biogeochemistry in coupled climate-carbon models. Glob. Chang. Biol. 15 (10), 2462–2484. doi:10.1111/j.1365-2486.2009.01912.x
Rosenzweig, C., Arnell, N., Ebi, K., Lotze-Campen, H., Raes, F., Rapley, C., et al. (2017). Assessing inter-sectoral climate change risks: The role of ISIMIP. Environ. Res. Lett. 12 (1), 010301. doi:10.1088/1748-9326/12/1/010301
Schimel, D., Melillo, J., Tian, H., McGuire, A., Kicklighter, D., Kittel, T., et al. (2000). Contribution of increasing CO2 and climate to carbon storage by ecosystems in the United States. Sci. (New York, N.Y.) 287 (1), 2004–2006. doi:10.1126/science.287.5460.2004
Shao, J., Zhou, X., Luo, Y., Zhang, G. D., Yan, W., Li, J. X., et al. (2016). Uncertainty analysis of terrestrial net primary productivity and net biome productivity in China during 1901-2005. J. Geophys. Res. Biogeosci. 121 (5), 1372–1393. doi:10.1002/2015JG003062
Sitch, S., Huntingford, C., and Gedney, N. (2008). Evaluation of the terrestrial carbon cycle, future plant geography and climate-carbon cycle feedbacks using five Dynamic Global Vegetation Models (DGVMs)[J]. Glob. Change Biol. 14 (9), 2015–2039. doi:10.1111/j.1365-2486.2008.01626.x
Smith, B., Wårlind, D., Arneth, A., Hickler, T., Leadley, P., Siltberg, J., et al. (2014). Implications of incorporating N cycling and N limitations on primary production in an individual-based dynamic vegetation model. Biogeosciences 11 (7), 2027–2054. doi:10.5194/bg-11-2027-2014
Tian, H., Chen, G., Zhang, C., Liu, M., Sun, G., Chappelka, A., et al. (2012). Century-scale responses of ecosystem carbon storage and flux to multiple environmental changes in the Southern United States. Ecosystems 15 (4), 674–694. doi:10.1007/s10021-012-9539-x
Wang, J., Sun, R., Zhang, H., Xiao, Z., Zhu, A., Wang, M., et al. (2021). New global MuSyQ GPP/NPP remote sensing products from 1981 to 2018. IEEE J. Sel. Top. Appl. Earth Obs. Remote Sens. 14 (1), 5596–5612. doi:10.1109/jstars.2021.3076075
Warnant, P., François, L., Strivay, D., and Gerard, J. C. (1994). Caraib: A global model of terrestrial biological productivity. Glob. Biogeochem. Cycles 8 (3), 255–270. doi:10.1029/94GB00850
Wei, Y., Liu, S., Huntzinger, D., Michalak, A. M., Viovy, N., Post, W. M., et al. (2014). the north American carbon program multi-scale synthesis and terrestrial model intercomparison project-part 2: Environmental driver data. Geosci. Model Dev. 7 (6), 2875–2893. doi:10.5194/gmd-7-2875-2014
Wu, C., and Wang, T. (2022). Evaluating cumulative drought effect on global vegetation photosynthesis using numerous GPP products. Front. Environ. Sci. 10 (1). doi:10.3389/fenvs.2022.908875
Wu, Z., Ahlström, A., Smith, B., Ardö, J., Eklundh, L., Fensholt, R., et al. (2017). Climate data induced uncertainty in model based estimations of terrestrial primary productivity. Environ. Res. Lett. 12 (6), 064013. doi:10.1088/1748-9326/aa6fd8
Wu, Z., and Huang, N. (2009). Ensemble empirical mode decomposition: A noise-assisted data analysis method. Adv. Adapt. Data Anal. 1 (1), 1–41. doi:10.1142/S1793536909000047
Yuan, W., Cai, W., Xia, J., Chen, J., Liu, S., Dong, W., et al. (2014). Global comparison of light use efficiency models for simulating terrestrial vegetation gross primary production based on the LaThuile database. Agric. For. Meteorology 192 (15), 108–120. doi:10.1016/j.agrformet.2014.03.007
Zaehle, S., Sitch, S., Smith, B., and Hatterman, F. (2005). Effects of parameter uncertainties on the modeling of terrestrial biosphere dynamics. Glob. Biogeochem. Cycles 19 (3), 1–16. doi:10.1029/2004GB002395
Zhou, S., Yu, B., Schwalm, C., Ciais, P., Zhang, Y., Fisher, J., et al. (2017). Response of water use efficiency to global environmental change based on output from terrestrial biosphere models: Drivers of WUE variability. Glob. Biogeochem. Cycles 31 (11), 1639–1655. doi:10.1002/2017GB005733
Keywords: gross primary productivity, uncertainty, Chinese grasslands, MsTIMP, ISIMIP
Citation: He P, Ma X, Han Z, Meng X and Sun Z (2022) Uncertainties of gross primary productivity of Chinese grasslands based on multi-source estimation. Front. Environ. Sci. 10:928351. doi: 10.3389/fenvs.2022.928351
Received: 25 April 2022; Accepted: 16 August 2022;
Published: 07 September 2022.
Edited by:
Mengtian Huang, Chinese Academy of Meteorological Sciences, ChinaReviewed by:
Haijun Deng, Fujian Normal University, ChinaCopyright © 2022 He, Ma, Han, Meng and Sun. This is an open-access article distributed under the terms of the Creative Commons Attribution License (CC BY). The use, distribution or reproduction in other forums is permitted, provided the original author(s) and the copyright owner(s) are credited and that the original publication in this journal is cited, in accordance with accepted academic practice. No use, distribution or reproduction is permitted which does not comply with these terms.
*Correspondence: Xiaoyu Meng, bWVuZ3hpYW95dUBoZW51LmVkdS5jbg==
†These authors share first authorship
Disclaimer: All claims expressed in this article are solely those of the authors and do not necessarily represent those of their affiliated organizations, or those of the publisher, the editors and the reviewers. Any product that may be evaluated in this article or claim that may be made by its manufacturer is not guaranteed or endorsed by the publisher.
Research integrity at Frontiers
Learn more about the work of our research integrity team to safeguard the quality of each article we publish.