- College of Economics and Management, Shandong University of Science and Technology, Qingdao, China
Optimizing energy structure is necessary to achieve full decarbonization. In this study, we introduced thermal power, clean energy, and traditional fossil energy as three different input factors into the translog production function. We considered three improvement paths of the energy structure, including replacing fossil energy with electricity and using thermal power to substitute for clean energy and then analyzed whether the directed technological change promotes the optimization of the energy structure in China. The results show that there is a substitution relationship between thermal power and clean energy during the internal transition process, and the biased technical change is thermal power-using, which suggests that technological change is not conducive to the improvement of electricity structure from thermal power to clean energy. In external transition, the biased technical change is fossil energy-using instead of thermal power-using or clean power-using, and there is a substitution relationship among three factors, which shows that technical change goes against the improvement of energy structure from fossil energy to electricity. We propose that the Chinese governments adopt energy price or carbon tax measures to adjust the directed technical change and thus optimize the energy structure. In addition, according to the results from China, different countries can improve the energy structure based on their characteristic production mode.
Introduction
Since the reform and opening up, while China’s economy has been growing rapidly, the problems of environmental pollution and energy depletion have become more and more serious (Chen et al., 2022), and the sustainable economic development has become the focus of the Chinese government. According to the World Energy Statistics Yearbook, China’s fossil energy consumption accounted for 24.66 percent in 2019, renewable energy for 23.42 percent, and coal for more than 50 percent of the world total consumption. At present, traditional fossil energy remains the most dependable energy source in China. Therefore, energy transfer is particularly urgent for the Chinese government.
The Chinese government has realized that previous development models are unsustainable, so the government is implementing the new ones. At the 75th United Nations General Assembly, President Xi Jinping announced China’s goal of peaking carbon dioxide emissions by 2030 and achieving carbon neutrality by 2060. China has become the world’s largest user of clean energy and is further promoting the revolution in energy structure. Based on its own national conditions, the Revolutionary Strategy for Energy Production and Consumption (2016–2030) mentioned that China plans to increase the share of non-fossil energy in primary energy to 20% by 2030 and 50% by 2050. Therefore, the governments’ goals of energy structure restructuring will be the driving forces for the optimization of the energy structure.
Technical innovation, technical change, and other technological progress methods are necessary for optimizing energy structure. Recently, to promote energy technical progress, the Chinese government adopted subsidies and carbon taxes to encourage the technical change of carbon emission reduction. The total factor productivity is often adopted to measure China’s technical progress (Chen et al., 2022; Zhong et al., 2022). However, Hicks (1932) considered that the change of factors relative to price will simulate specific technical inventions to reduce the use of expensive production factors. It means after the technical change occurs, the demand proportion of factors changes and the technical change is biased. With the economic growth, the path of technical progress is becoming more complicated, and some scholars proved the existence of biased technical change (Wang et al., 2021; Zhu et al., 2021). After that, more literature paid close attention to the role of directed technical change in carbon emissions (Liu and Li, 2021; Zhong et al., 2021), and few studies analyzed how directed technical change affects the improvement of energy structure.
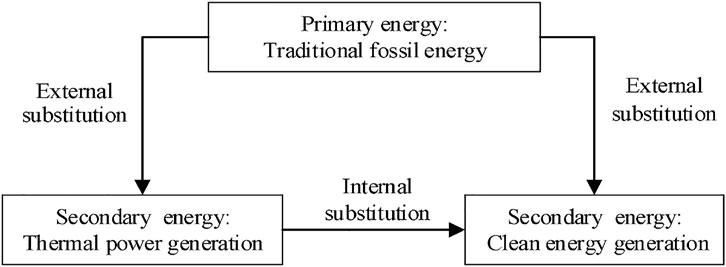
In addition, energy substitution plays a vital role in improvement of energy structure. However, existing studies mainly focus on the substitution between energy and non-energy (Lee, 2005; Yang et al., 2018; Lin and Raza, 2021). For China, “electricity substitution” is the primary support for promoting energy structure (Zhou, 2018; Liu and Wang, 2019; Chen et al., 2020). At present, the task of China’s “electric energy substitution” requires us to not only effectively use the electric energy to alter polluting energy consumption methods such as scattered coal and fuel oil but also vigorously transform the inefficient generation production mode using clean power to substitute thermal power. As far as the “electricity substitution” in the transformation, it includes two goals of “internal electric substitution” and “external electric substitution.” External substitution is the orderly transition from primary energy to secondary energy, while internal electric substitution is the technological upgrade of clean power to thermal power. The boundary definition of internal and external electric substitution is shown in Figure 1. Therefore, this study considered three structural optimization paths and separately analyzed whether directed technological change facilitates them. In the transition of fossil energy to electricity, we consider two transition paths: replacing traditional fossil energy with thermal power and clean power. In the internal electric transformation, we consider the transformation path of using thermal power to substitute for clean power.
According to the aforementioned analysis, some scholars measured the biased technical change in China’s different industries. However, most studies considered the technical change bias between energy and non-energy. We innovatively investigated the technical change bias between electric energy and fossil energy as well as thermal power and clean power from the perspective of electricity substitution. Moreover, most of the existing literature focused on the role of technical change in carbon emissions. Few studies explored the impact of directed technical change on optimizing energy structure.
Compared to the existing studies, there are mainly three aspects of contribution in this study. First, we considered the technical change bias among clean power, thermal power, and fossil energy. We calculated the biased technical change in interfuel energy by providing a novel perspective from electricity substitution. Second, we explored the impact of technical change bias on the improvement of energy structure. This work broadened the field of research as existing studies focus more on the role of biased technical change in the economy. Finally, the substitution elasticities among fossil energy, thermal power generation, and clean energy are calculated. This work provided a comprehensive perspective to understand the relationship between directed technical change and the improvement of energy structure.
Literature Review
Energy structure optimization is considered to be necessary for full decarbonization. The feasibility of energy structure optimization depends on the substitutability between different energy sources. The substitution relationships between energy and non-energy have been investigated by some studies. In China’s steel industry, Smyth et al. (2011) examined the possibility of inter-factor substitution between capital, energy, and labor. The results show that the substitution relationship exists among capital, energy, and labor. This result suggests that removing the energy price ceiling reduces energy use and increases capital use. Shao et al. (2016) analyzed the improvement path of green transformation in the country’s industrial sector and found an alternative relationship between labor and fossil energy. They also show a complementary relationship between capital and fossil energy. Zha and Zhou, (2014) proposed a method to analyze the energy and non-energy substitution elasticity by combining the log production function and the alternative constant elasticity function. The results show that there is a substitute relationship between capital-energy and labor-energy. The empirical findings of two important conclusions were made by Raurich et al. (2012): first, the alternative elasticity between capital and labor is greater than 1 in Spain and less than 1 in the United States. Second, the rising price rise deviates the estimate of this elasticity from 1. Lin and Liu, (2017) analyzed the factor substitution relationship of energy in China’s machinery industry, and the results show that substitution relationships exist in energy–capital and energy–labor. The alternative elasticity of the former pair is about 1.029, and that of the latter pair is about 1.030. This suggests that it is a better way to increase more capital and labor than energy will help reduce carbon emissions in China’s machinery industry. Lin and Raza, (2021) investigated fuel substitution possibilities in Pakistan’s agriculture sector with Ridge regression. The results show that labor, capital, and energy consumption are all substitutes. Yang et al. (2018) divided energy into two factors of fossil energy and non-fossil energy and treated them into production functions to analyze the substitution elasticities of input factors. The results show there is a substitution relationship in the pair of capital–labor as well as the pair of labor–fossil energy, but there is a complementary relationship in the pair of capital–fossil energy. Lee (2005) explored the potential of substitution in the pair of sulfur–capital. The substitution elasticities indicate that there is a high substitutability in the pair of capital–sulfur. Koetse et al. (2008) investigated the substitution elasticities of capital–energy, and confirmed that there are opportunities to save energy capital through energy price regulations.
As the energy shortage becomes an increasingly serious issue, some studies begin focusing on interfuel substitution. For example, Bello et al. (2018) used Ridge regression to analyze alternative resilience between different energy in Malaysia and found that hydropower is a substitution for other fossil energy, suggesting a cleaner fuel can be transformed in the country’s power generation. Lin and Abudu, (2020b) analyzed the alternative possibilities between energy in the Middle East and North Africa and found that perfect alternatives existed between renewable and non-renewable energy in the power sector. David (Ma and Stern, 2016) used cross-price elasticity to analyze the substitution elasticity between energy sources in China’s provinces and found a complementary relationship between coal and electricity, and diesel and electricity, with gasoline and diesel as alternative relationships. Lin and Atsagli, (2017) analyzed the possibility of technical changes and energy substitution between oil, coal, and electricity in South Africa and found that all inputs were alternatives. This alternative relationship suggests that removing all price caps and subsidies for oil would reduce the demand for oil. An input distance function was applied by Xie et al. (2017) to measure the substitution between non-fossil energy and fossil energy in China. The results confirmed the potential substitution between them. Considering the increasing cost of fossil energy and the limited resources in China, Zhou and Zhang, (2010) supported the substitution between non-fossil energy and fossil energy. Lee and Jin, (2012) utilized the input distance function to examine the possible substitution between thermal capital and nuclear capital. The results show that nuclear capital can be used to substitute thermal capital in the Korean electric power industry. Li and Lin, (2016) investigated substitutability among electricity, coal, and oil. They found there are substitutions among these three input factors, and the elasticity values indicate the existence of inelastic substitution. Furthermore, Mohammadi et al. (2022) applied the LMDI method to decompose the energy intensity changes. The results showed that substituting different types of fuel could not reduce energy intensity in Iran. The aforementioned literature analyzes the possibility of energy substitution in inter-fuel energy, energy, and non-energy.
However, existing studies also ignore the relationship between technological progress bias and energy transformation. Hicks (1932) divided technical change into three categories: when technological progress is more conducive to improving the marginal output of i (j), technological progress is called i (j) bias, while the technical change is called neutral, if the impact of technological change on the marginal output of i and j is biased. Many scholars measured China’s technological progress bias. For example, scholars (Li, 2013; Dong and Chen, 2014; Yao et al., 2014; Li and Li, 2018) analyzed the technical change between labor and capital and found that the technical is capital-biased. Xiu et al. (2019) added energy factors into production function, and the results showed that the technical is energy-biased.
Also, in general, in the external transition, if the order of production technology is biased to thermal power generation-using or clean energy-using, manufacturers will be more inclined to increase thermal power generation or clean energy instead of fossil energy. Under this circumstance, if there is a substitution relationship between energy factors, directed technology changes will help to promote the transformation from fossil energy to electricity, thus promoting the external transition. In the internal transition, if production technology is biased toward clean power-using, then producers will be more inclined to increase the input of clean power instead of thermal power. If there is an alternative relationship between clean power and thermal power, this directed technical change can effectively promote the energy transition from thermal power to clean energy. Therefore, the order of directed technical change is the key to determine the energy transition.
Therefore, in the external transition of electric energy, stimulating the production technology biased toward thermal power or clean energy and strengthening the alternative relationship between fossil energy and secondary energy can effectively promote the external transformation. In the internal transition, it is a reasonable way to stimulate the production technology biased to clean power-using and to strengthen the substitution relationship between thermal power and clean power. The aforementioned three paths for energy structure optimization can be promoted through the appropriate use of policies and pricing. Hicks (1932) believed relative factor price changes of production were an stimulant for the invention to save the use of a factor that becomes relatively expensive. Acemoglu (2002a) and Acemoglu (2002b) pointed out two reasons that can affect technical change are price effect and endowment effect. In addition, Luo et al. (2018) analyzed the role of international trade in technical change by introducing the intermediary factor of price distortion in China. Based on this, Popp (2002) found that energy prices have a positive effect on energy-saving and innovative technologies through data from the US region, arguing that environmental taxes can encourage the development of new technologies and thus reduce the cost of controlling pollution. Osman (Habeşoğlu et al., 2022) also affirmed that the taxation revenues have a negative effect on carbon emissions. Kong et al. (2020) analyzed Chinese manufacturing companies and found that rising energy prices would require them to positively reflect their energy conservation efforts and ultimately enhance their energy-saving innovation. Lin and Chen (2019) analyzed how electricity prices affect the technology innovation of renewable energy in different provinces of China. The results showed that higher electricity prices that mainly include fossil energy would lead to an increase in renewable energy technology innovation. The aforementioned analysis shows that energy relative price, carbon tax, and other policies can affect the order of biased technological change with different energy sources.
Data
For the translog production function model, the variables are selected from the China Statistical Yearbook, China Energy Statistical Yearbook, and China Power Statistical Yearbook. Variables mainly include GDP, capital, clean energy, fossil energy, and thermal power generation. The GDP is converted to a constant base price in 1997. Fossil energy includes coal, oil, and natural gas. Clean power includes hydroelectric, wind, nuclear, and solar power. The unit of the energy variable is uniformly converted to tce. We calculate the capital stock by the equation as follows (Shan, 2008):
where
where
Methods
Model
Electricity and traditional fossil energy can be seen as two input factors with different features. The electricity can be divided into clean energy and thermal power generation. Some studies exist on energy and non-energy about biased technical changes and elasticity substitution. However, few studies focus on the biased technical changes and clean elasticities among interfuels. In order to improve the research on energy structure, we combine the biased technical change and elasticity substitution to analyze the transition of internal and external electric transitions.
For the purpose of estimation, we hope to find a function that allows us to track the substitution elasticity and directed technical change bias between Chinese fuel inputs. There are a number of functions that can help solve the substitution elasticity problem between energy inputs, including constant elasticity of substitution and the popular Cob–Dogglas production functions. The translog function is adopted because of the estimable and inclusive advantages. The estimable advantage has two points. First, the model that is estimated only needs the basic quantity or price data. Second, the model can estimate scenarios with multiple elements (n > 2) without any changes. In addition, the inclusive advantage also has two points. First, it can be regarded as an approximation to the second-order Taylor expansion. Second, specific parameters (e.g., output elasticity and alternative elasticity) can be estimated and tested by actual data without a prior setting (Hao, 2015). We can use either cost or production function to obtain the substitution elasticity and biased technical change. The cost function is not available for all the input prices, so we adopted production function to estimate the substitution elasticity and the directed technical change during 1997–2019 in China.
According to Wesseh and Lin, (2016), the translog production function can be given as follows:
where
Specifically, the production function model includes gross domestic product (Y), capital
From Eq. 4, we can gain substitution elasticity of various factors. The output elasticity of an input factor is as follows:
Therefore, for each input energy factors
where
The substitution elasticity between the factors i and j can be given as:
Specifically, the substitution elasticities between N, R, and F are as follows:
From Eqs 11–13,
Directed Technical Change
The biased directed technical change of input elements can be computed by output elasticity and parameter estimates of Eq. 4. To do this, the following formula is adopted:
where
Major Results
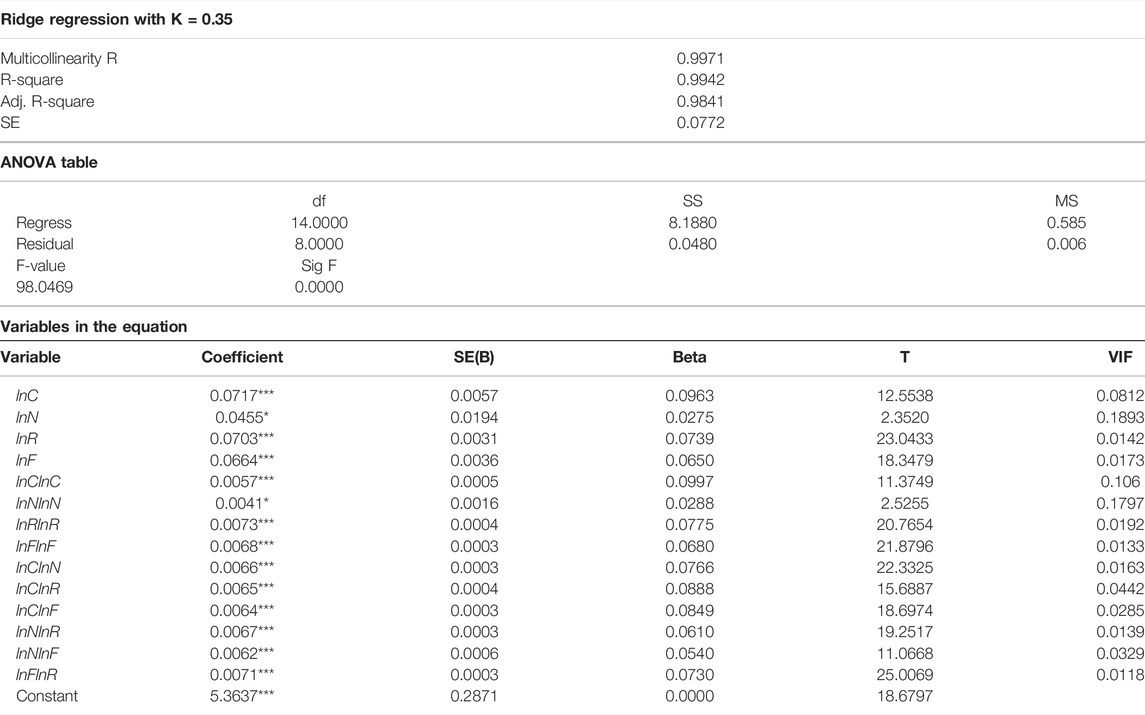
According to the translog production function we established, a number of parameters are estimated. The multicollinearity can be found among the input factors. The OLS method is not applicable if there exists a multicollinearity problem. Because of the high correlation between the independent variables,
To address the problem of multicollinearity, some studies (Xie and Hawkes, 2015; Lin and Long, 2016; Xiu et al., 2019; Lin and Abudu, 2020a) estimate the function by ridge regression. The solution is to include a bias parameter
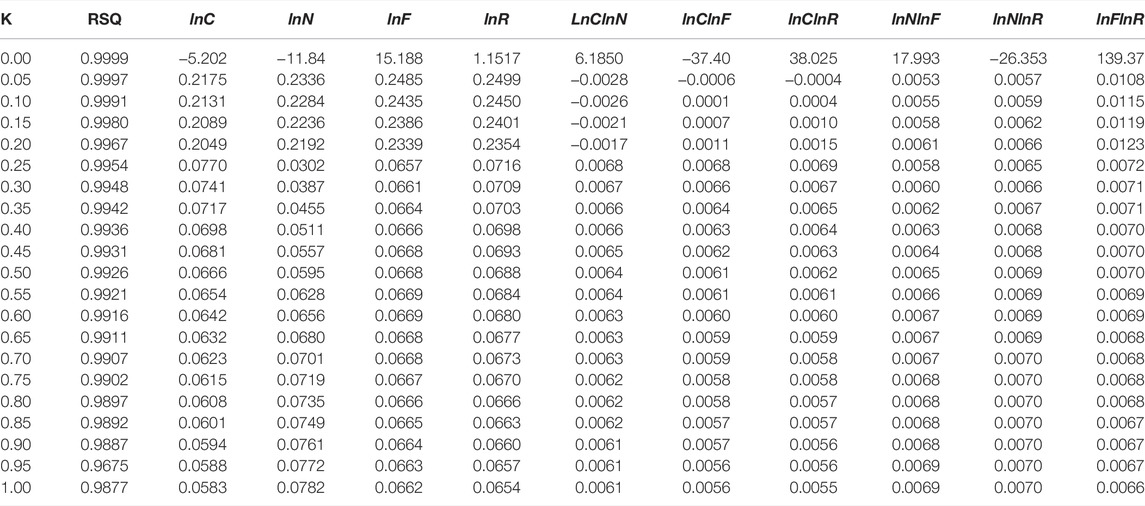
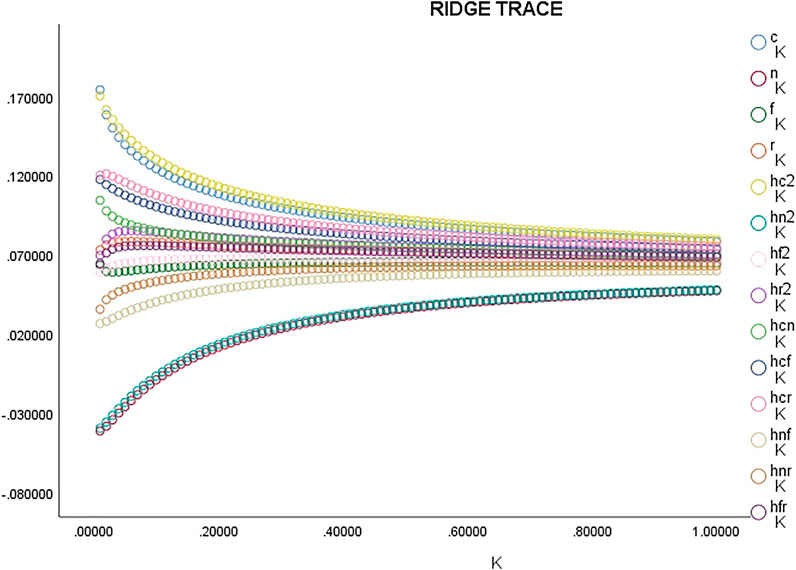
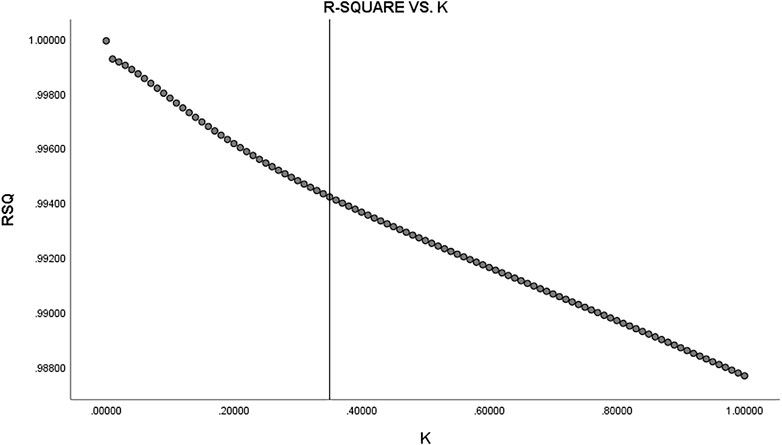
The parameter values of K can be determined based on the values of the R-square and beta coefficients for ridge regression (see Table 1), ridge trace of production function (see Figure 2), and the R-square and K-values (see Figure 3). In this study, the K value is 0.35. Using SPSS software, the model results were obtained by calling the “ridge regression. sps” statement.
As is seen from Table 1, the R-square and beta line values of the ridge regression become stable when k is in the range of 0.3–0.4. When K is between 0.0 and 0.3, Table 1 shows the unstable beta coefficients of K, N, KN, KF, KR, and NR, with positive and negative conversion changes with K.
As shown in Figure 1, the ridge trace becomes fairly stable when K reached around 0.35, consistent with previous conclusions. Furthermore, the ridge values are also supported by the variance expansion factor (VIF). The severity of multicollinearity can be calculated by VIF in some linear models. Through R language programming, we obtain the VIF values which are less than 0.2 for all variables at K = 0.35, and we obtain specific results as shown in Table 2.
Table 1 shows that the results of the ridge regression model are significant. All the statistical test metrics, including goodness of fit, standard error, the significance levels of the regression equations (F and sig values), and the variance table reflect this as a reasonable model. Furthermore, the value of the VIF reflects that the ridge regression effectively overcomes the problem of multicollinearity. All of the regression coefficients were significant. Both individual variables and cross-term and square term regression coefficients are positive. The results correspond with economic reality, indicating increasing returns for all inputs. Thus, the equations of the model can be written as follows:
Interfuel Substitution Elasticities
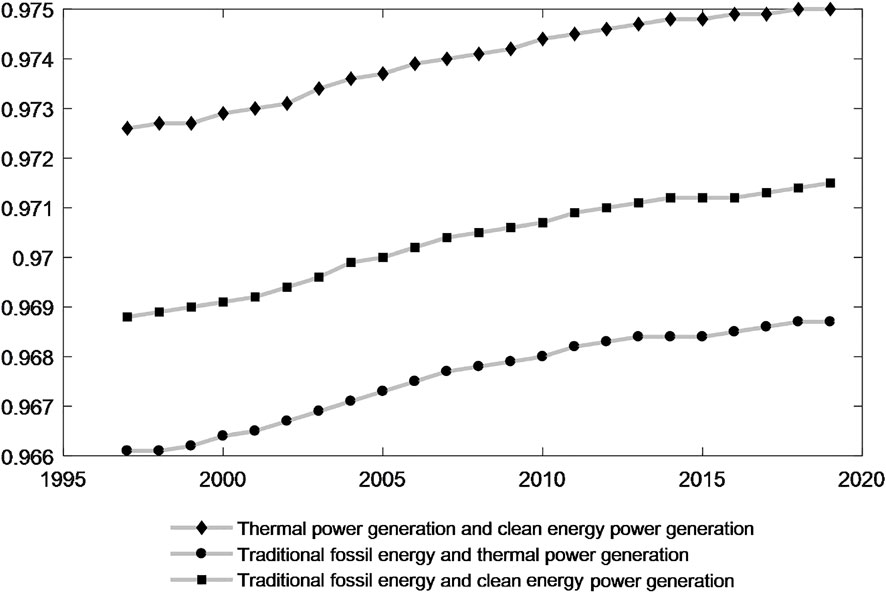
Subsequently, the alternative elasticity between the internal and external electric transition is calculated. As mentioned previously,
Interfuel Directed Technical Change Bias
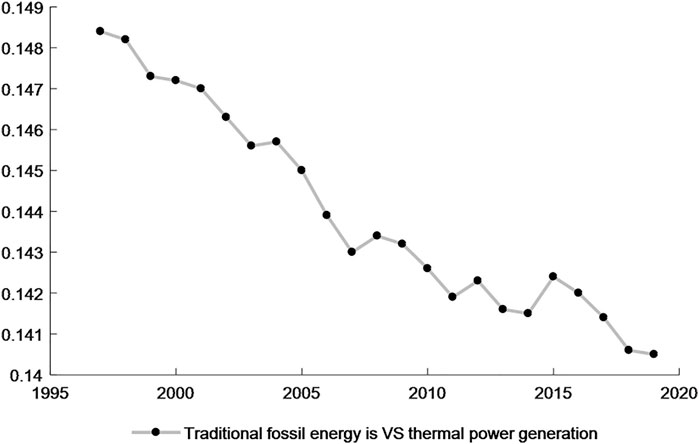
Then, Figures 5, 6 show the directed technical change bias between external electric transitions. It can be found that: 1) the mode Bias-NF> 0 Bias-NR> 0 indicates that the biased technological changes are fossil energy-using rather than thermal-using or clean energy-using nationwide. In fact, Yang et al. (Lin and Raza, 2021) also found that the technological change is biased toward fossil energy. 2) From the trend of technological change, the trend between fossil energy (N) and thermal power generation (F) is similar to the fossil energy (N) and clean power (R): the positive technical change value tends to decrease in the trend, especially after 2007, as it dropped to below 0.144. This suggests that the technical changes between traditional fossil energy and thermal as well as clean power generation are gradually shrinking. 3) The directed technical progress between fossil energy and clean energy is far greater than that between fossil energy and thermal power generation. This shows that the Chinese government still needs to reverse the order of technological changes using some policies between fossil energy and clean power.
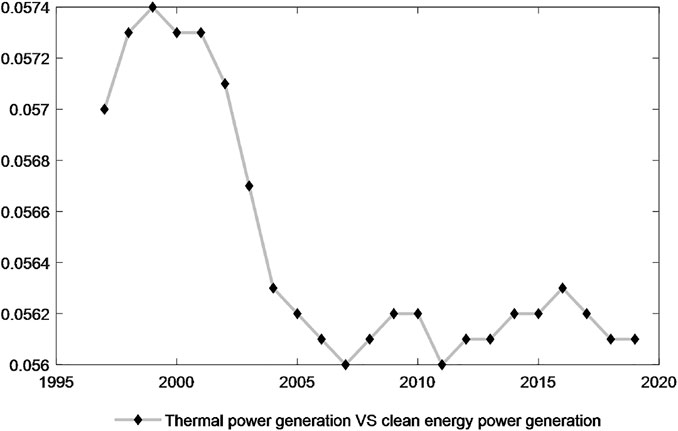
Next, the direct technical change bias between the internal electric transition is calculated, as shown in Figure 7. The conclusions are as follows: 1) the technical change bias (Bias-FR) results for the whole period (1997–2019) are positive, which means that the technical change is always biased toward thermal power generation nationwide. This shows that governments still need to reverse the order of technological change bias by imposing carbon taxes on thermal power and providing subsidies for clean energy. 2) The technical bias values of thermal power and clean power are fluctuating. Among them, there is a descendant trend between 2000 and 2007, but the direction has changed continuously from 2007 to 2019. 3) On the whole, the biased technological change of the thermal power generation is in a downward trend, indicating that the biased technology of the clean energy power generation has a certain development.
In general, the order of the biased technical change is N > F > R. Among three factors in production, the first two orders indicate the producers’ production preference, and the last factor denotes producers’ relative aversion. We can find from the biased order that the technical changes are fossil energy-using and thermal power-using, while technical changes deviate from clean power. The results indicate that from the national point of view, China’s producers are more willing to use traditional fossil energy and thermal power generation instead of using clean power. This result shows the problems of energy consumption and environmental pollution increase with the technological change biased toward fossil energy-using. In addition, it also means that producers should strengthen the production of clean energy.
Therefore, the directed technical change is not conducive to improving energy structure. According to Yang (Habeşoğlu et al., 2022), the price effect determines the order of biased technical change. Therefore, adjusting the relative price between energy factors can be a method to adjust the order of biased technical change. For example, the increase of carbon tax or subsidy of clean power can increase the price of fossil energy or lower the relative price of clean power, so it can help adjust the order of the biased technical change.
Improvement Path of Energy Structure
In terms of “internal and external electricity substitution” in the transformation, external substitution is the transformation from primary energy to secondary energy, while internal substitution is the technical increase of clean power to thermal power generation. Obviously, promoting the internal and external substitution of electric energy is conducive to reducing the pollution emissions caused by high-carbon energy consumption. Therefore, according to the degree of relative factor deviation of directional technology change and the alternative elasticity between pairs of input factors, a path to promote energy transformation can be proposed.
The optimal production mode should be Bias-FR < 0 and Subs-FR > 0. It means that the technological changes prefer clean power-using, and increasing clean power-using will reduce thermal power-using. However, the production model is Bias-FR > 0 and Subs-FR > 0, which means that China currently prefers to use thermal power generation rather than using clean power, and there is an alternative relationship between clean power and thermal power. Increasing thermal power use will reduce clean power use. Therefore, the Chinese government needs to make more efforts such as providing more green finance funds (Samour et al., 2022) and imposing carbon taxes to promote technological changes that favor clean power.
For the electrical energy external substitution, the perfect production mode should be Bias-NF < 0, Subs-NF > 0 and Bias-NR < 0, Subs-NR > 0. However, the current production mode in China is Bias-NF > 0, Subs-NF > 0 and Bias-NR > 0, Subs-NR > 0. That means China now is inclined to use more fossil energy than thermal power or clean energy. As a result, the Chinese governments need to adjust the order of technological changes between traditional fossil generation and thermal as well as clean power.
Conclusion and Suggestion
Optimizing the internal as well as external substitution is an essential way for China to improve the energy consumption structure and realize the green transformation. This study builds an energy-related production model by the translog production function, with capital, clean power, thermal power, and traditional fossil energy as input factors. We also apply Ridge regression to this model to eliminate multicollinearity.
First of all, at the level of technological change bias, China’s biased technological change is thermal power-using and deviates from clean power from the internal transition. Moreover, the deviation trend of technical variation between clean power and thermal power is quite stable. This stability shows that it is difficult for the Chinese government to change the preference of the thermal power generation factor. From the external transition, China’s technology changes are more biased toward traditional fossil energy rather than thermal generation or clean power. In addition, the technical differences between clean power, traditional fossil energy, and thermal generation are gradually narrowing.
Second, at the level of substitution elasticity, the substitution relationship exists among fossil energy, thermal power generation, and clean power, and it is quite stable. This suggests that increasing clean power use in the internal transition can reduce the use of thermal power. In the external transition, fossil energy use can be reduced by increasing electricity. In addition, the trend of substitution elasticity is stable upward in internal and external transition with three pairs, indicating that with the development of low-carbon energy technology, there is a considerable replacement space in energy substitution.
Third, due to the unreasonable bias order of technical change among clean energy, thermal generation, and fossil energy, we find that the directed technical change is not conducive to improving energy structure. Therefore, the innovation of electricity should be paid attention to, which can reduce the cost of electricity and expand the production scale of electricity. Although the government has recognized the necessity to promote clean energy development, the clean energy industry is still limited. In order to improve the technical level of clean energy, the governments should take some fiscal and tax policies to improve the rapid upgrade of the clean energy technical level and the development of the clean energy industry. For example, the government can provide financial subsidies and tax policies for the consumption of new energy vehicles and the production of photovoltaic enterprises. In the long run, the construction of a clean energy generation base should be encouraged in clean energy-rich areas so that the clean energy supply can be expanded and the electricity structure is optimized.
Data Availability Statement
The original contributions presented in the study are included in the article/supplementary material; further inquiries can be directed to the corresponding author.
Author Contributions
GH: Methodology, software, data curation, and writing—original draft. HS: Conceptualization, methodology, software, data curation, and writing—original draft.
Conflict of Interest
The authors declare that the research was conducted in the absence of any commercial or financial relationships that could be construed as a potential conflict of interest.
Publisher’s Note
All claims expressed in this article are solely those of the authors and do not necessarily represent those of their affiliated organizations, or those of the publisher, the editors, and the reviewers. Any product that may be evaluated in this article, or claim that may be made by its manufacturer, is not guaranteed or endorsed by the publisher.
References
Acemoglu, D. (2002). Directed Technical Change. Rev. Econ. Stud. 69 (4), 781–809. doi:10.1111/1467-937x.00226
Acemoglu, D. (2002). Technical Change, Inequality, and the Labor Market. J. Econ. Literature 40 (1), 7–72. doi:10.1257/jel.40.1.7
Bello, M. O., Solarin, S. A., and Yen, Y. Y. (2018). Hydropower and Potential for Interfuel Substitution: The Case of Electricity Sector in Malaysia. Energy 151 (C), 966–983. doi:10.1016/j.energy.2018.03.055
Chen, G., Liang, Z., and Dong, Y. (2020). Analysis and Thinking on Electric Power Market Construction with Chinese Characteristics Based on Energy Transformation [J]. Chin. J. Electr. Eng. 40 (2), 369–379. doi:10.13334/j.0258-8013.pcsee.191382
Chen, X., Liu, X., and Zhu, Q. (2022). Comparative Analysis of Total Factor Productivity in China's High-Tech Industries [J]. Technol. Forecast. Soc. Change 175, 121332. doi:10.1016/j.techfore.2021.121332
Dong, Z., and Chen, R. (2014). Effect of Biased Changes in Technological Progress on Total Factor Productivity Growth [J]. J. Manag. 11 (08), 1199–1207. doi:10.3969/j.issn.1672-884x.2014.08.014
Habeşoğlu, O., Samour, A., Tursoy, T., Ahmadi, M., Abdullah, L., and Othman, M. (2022). A Study of Environmental Degradation in Turkey and its Relationship to Oil Prices and Financial Strategies: Novel Findings in Context of Energy Transition. Front. Environ. Sci. 10, 876809. doi:10.3389/fenvs.2022.876809
Hao, F. (2015). Modification and Comparison with Estimation Methods of Translog Function Substitution Elasticity [J]. Quantitative, Econ. Tech. Econ. Res. 32 (04), 88–105+122. doi:10.13653/j.cnki.jqte.2015.04.006
Koetse, M. J., de Groot, H. L. F., and Florax, R. J. G. M. (2008). Capital-energy Substitution and Shifts in Factor Demand: A Meta-Analysis. Energy Econ. 30 (5), 2236–2251. doi:10.1016/j.eneco.2007.06.006
Kong, D., Yang, X., and Xu, J. (2020). Energy Price and Cost Induced Innovation: Evidence from China [J]. Energy 192, 116586.1–116586.12. doi:10.1016/j.energy.2019.116586
Lee, M., and Jin, Y. (2012). The Substitutability of Nuclear Capital for Thermal Capital and the Shadow Price in the Korean Electric Power Industry. Energy Policy 51 (DEC), 834–841. doi:10.1016/j.enpol.2012.09.032
Lee, M. (2005). The Shadow Price of Substitutable Sulfur in the US Electric Power Plant: A Distance Function Approach. J. Environ. Manag. 77 (2), 104–110. doi:10.1016/j.jenvman.2005.02.013
Li, J., and Lin, B. (2016). Inter-factor/inter-fuel Substitution, Carbon Intensity, and Energy-Related CO2 Reduction: Empirical Evidence from China. Energy Econ. 56, 483–494. doi:10.1016/j.eneco.2016.04.001
Li, L. (2013). Measculation and Analysis of Biased Technological Progress [J]. Stat. Study 30 (04), 83–91. doi:10.19343/j.cnki.11-1302/c.2013.04.014
Li, X., and Li, X. (2018). Biased Technological Progress and China's Industrial Total Factor Productivity Growth [J]. Econ. Res. 53 (10), 82–96.
Lin, B., and Abudu, H. (2020b). Can Energy Conservation and Substitution Mitigate CO2 Emissions in Electricity Generation? Evidence from Middle East and North Africa. J. Environ. Manag. 275, 111222. doi:10.1016/j.jenvman.2020.111222
Lin, B., and Abudu, H. (2020a). Impact of Inter-fuel Substitution on Energy Intensity in Ghana. Front. Energy 14 (1), 27–41. doi:10.1007/s11708-019-0656-5
Lin, B., and Atsagli, P. (2017). Inter-fuel Substitution Possibilities in South Africa: A Translog Production Function Approach. Energy 121 (C), 822–831. doi:10.1016/j.energy.2016.12.119
Lin, B., and Chen, Y. (2019). Does Electricity Price Matter for Innovation in Renewable Energy Technologies in China? Energy Econ. 78, 259–266. doi:10.1016/j.eneco.2018.11.014
Lin, B., and Liu, W. (2017). Estimation of Energy Substitution Effect in China's Machinery Industry-Bbased on the Corrected Formula for Elasticity of Substitution. Energy 129, 246–254. doi:10.1016/j.energy.2017.04.103
Lin, B., and Long, H. (2016). Input Substitution Effect in China׳s Chemical Industry: Evidences and Policy Implications. Renew. Sustain. Energy Rev. 53, 1617–1625. doi:10.1016/j.rser.2015.09.071
Lin, B., and Raza, M. Y. (2021). Fuels Substitution Possibilities and the Technical Progress in Pakistan's Agriculture Sector. J. Clean. Prod. 314, 128021. doi:10.1016/j.jclepro.2021.128021
Liu, L., and Li, L. (2021). The Effect of Directed Technical Change on Carbon Dioxide Emissions: Evidence from China's Industrial Sector at the Provincial Level [J]. Nat. Hazards 107 (4), 1–24. doi:10.1007/s11069-020-04437-3
Liu, P., and Wang, Z. (2019). Is China's "energy Transformation" reasonable?Empirical Study of the Energy Substitution-Complementary Relationship in —— [J]. China Soft Sci. 8, 14–30.
Luo, Z., Xuan, L., and Li, H. (2018). International Trade and China Technology Progress Direction ——analysis of Mediation Effect Based on Factor Price Distortion [J]. Econ. Rev. 3, 74–89. doi:10.19361/j.er.2018.03.06
Ma, C., and Stern, D. I. (2016). Long-run Estimates of Interfuel and Interfactor Elasticities [J]. Resour. energy Econ. 46, 114–130. doi:10.2139/ssrn.2724312
Mohammadi, V., Tabar, A. M. M., and Dashti, N. (2022). Inter-fuel Substitution and Decomposition Analysis of Energy Intensity: Empirical Evidence from Iran. Energy Strategy Rev. 39, 100773. doi:10.1016/j.esr.2021.100773
Popp, D. (2002). Induced Innovation and Energy Prices. Am. Econ. Rev. 92 (1), 160–180. doi:10.1257/000282802760015658
Raurich, X., Sala, H., and Sorolla, V. (2012). Factor Shares, the Price Markup, and the Elasticity of Substitution between Capital and Labor. J. Macroecon. 34 (1), 181–198. doi:10.1016/j.jmacro.2011.09.004
Samour, A., Baskaya, M. M., and Tursoy, T. (2022). The Impact of Financial Development and FDI on Renewable Energy in the UAE: A Path towards Sustainable Development. Sustainability 14, 1208. doi:10.3390/su14031208
Shan, H. (2008). Reestimation of China's Capital Stock K: 1952-2006 [J]. Quantitative Econ. Tech. Econ. Res. 25 (10), 17–31.
Shao, S., Luan, R., Yang, Z., and Li, C. (2016). Does Directed Technological Change Get Greener: Empirical Evidence from Shanghai's Industrial Green Development Transformation. Ecol. Indic. 69, 758–770. doi:10.1016/j.ecolind.2016.04.050
Smyth, R., Narayan, P. K., and Shi, H. (2011). Substitution between Energy and Classical Factor Inputs in the Chinese Steel Sector. Appl. Energy 88 (1), 361–367. doi:10.1016/j.apenergy.2010.07.019
Wang, X., Wang, Y., and Lan, Y. (2021). Measuring the Bias of Technical Change of Industrial Energy and Environment Productivity in China: A Global DEA-Malmquist Productivity Approach [J]. Environ. Sci. Pollut. Res. 28 (31), 41896–41911. doi:10.1007/s11356-021-13128-w
Wesseh, P. K., and Lin, B. (2016). Output and Substitution Elasticities of Energy and Implications for Renewable Energy Expansion in the ECOWAS Region. Energy Policy 89, 125–137. doi:10.1016/j.enpol.2015.11.007
Xie, C., and Hawkes, A. D. (2015). Estimation of Inter-fuel Substitution Possibilities in China's Transport Industry Using Ridge Regression. Energy 88, 260–267. doi:10.1016/j.energy.2015.05.034
Xie, H., Yu, Y., Wang, W., and Liu, Y. (2017). The Substitutability of Non-fossil Energy, Potential Carbon Emission Reduction and Energy Shadow Prices in China. Energy Policy 107 (aug), 63–71. doi:10.1016/j.enpol.2017.04.037
Xiu, J., Zhang, G.-x., and Hu, Y. (2019). Which Kind of Directed Technical Change Does China's Economy Have? from the Perspective of Energy-Saving and Low-Carbon. J. Clean. Prod. 233, 160–168. doi:10.1016/j.jclepro.2019.05.296
Yang, Z., Shao, S., Yang, L., and Miao, Z. (2018). Improvement Pathway of Energy Consumption Structure in China's Industrial Sector: From the Perspective of Directed Technical Change. Energy Econ. 72, 166–176. doi:10.1016/j.eneco.2018.04.003
Yao, Y., Yuan, L., and Wang, L. (2014). Factor Income Distribution Pattern of China’s Industrial Sector—Analysis Based on the Perspective of Technological Progress Bias [J]. China Ind. Econ. 8, 44–56. doi:10.19581/j.cnki.ciejournal.2014.08.004
Zha, D., and Zhou, D. (2014). The Elasticity of Substitution and the Way of Nesting CES Production Function with Emphasis on Energy Input. Appl. Energy 130 (oct.1), 793–798. doi:10.1016/j.apenergy.2014.01.093
Zhong, M.-R., Xiao, S.-L., Zou, H., Zhang, Y.-J., and Song, Y. (2021). The Effects of Technical Change on Carbon Intensity in China's Non-ferrous Metal Industry [J]. Resour. Policy 73, 102226. doi:10.1016/j.resourpol.2021.102226
Zhong, S., Li, J., and Zhang, D. (2022). Measurement of Green Total Factor Productivity on Chinese Pig Breeding: From the Perspective of Regional Differences [J]. Environ. Sci. Pollut. Res. 16 (9), e0257239. doi:10.1007/s11356-021-17908-2
Zhou, S., and Zhang, X. (2010). Nuclear Energy Development in China: A Study of Opportunities and Challenges [J]. Energy 35 (11), 4282–4288. doi:10.1016/j.energy.2009.04.020
Zhou, X. (2018). Development Trend of New-Generation Power System Technology in China in Energy Transformation [J]. Electr. Age 1, 33–35.
Keywords: energy structure, economic growth, ridge regression, directed technical change, substitution elasticity
Citation: Hou G and Song H (2022) Whether the Directed Technical Change Promotes the Improvement of the Energy Structure in China. Front. Environ. Sci. 10:928239. doi: 10.3389/fenvs.2022.928239
Received: 25 April 2022; Accepted: 16 May 2022;
Published: 20 June 2022.
Edited by:
Umer Shahzad, Anhui University of Finance and Economics, ChinaReviewed by:
Grzegorz Mentel, Rzeszów University of Technology, PolandAhmed Samour, Near East University, Cyprus
Copyright © 2022 Hou and Song. This is an open-access article distributed under the terms of the Creative Commons Attribution License (CC BY). The use, distribution or reproduction in other forums is permitted, provided the original author(s) and the copyright owner(s) are credited and that the original publication in this journal is cited, in accordance with accepted academic practice. No use, distribution or reproduction is permitted which does not comply with these terms.
*Correspondence: Guisheng Hou, MjQzNDgzNTA4MEBxcS5jb20=
 Guisheng Hou
 Hongyu Song