 Ziyan Yin
 Chunjiang Zhao1,2,3
 Yu Liu
- 1Research Center of Information Technology, Beijing Academy of Agriculture and Forestry Sciences, Beijing, China
- 2National Engineering Research Center for Information Technology in Agriculture, Beijing, China
- 3School of Land Science and Technology, China University of Geosciences (Beijing), Beijing, China
With the acceleration of economic and social development, the demand for natural resources has increased. To realize the sustainable utilization of natural resources (SUNRs), it is necessary to seek ways to improve natural resource utilization benefits (NRUBs) and promote the coordinated development of economic, social, and ecological benefits. This study explores the coupling coordination relationships of NRUBs in Beijing from 1978 to 2018 and analyzes the influencing factors. We first establish a comprehensive evaluation index system covering economic, social, and ecological benefits to quantify NRUBs. Then, a coupling coordination degree (CCD) model is applied to reveal the evolution characteristics of the coupling coordination relationships among the NRUB system. Finally, the main factors affecting the coordinated development of NRUBs are identified through gray relational analysis (GRA). Three main results are found: 1) from 1978 to 2018, the economic, social, ecological, and comprehensive benefits all have been significantly improved, although with some fluctuations. 2) The coupling coordination relationships of NRUBs show upward trends during the study period, and their coordination types transform from imbalance to coordination. 3) Urbanization, industrial structure, technology innovation, economic development, and environmental awareness all have significant impacts on the coupling coordination relationships of NRUBs. Measures such as transformation of the economic development mode, improvement of public facilities, construction of spiritual culture, ecological protection, and technological innovation need to be recognized to achieve coordinated development. This study can provide a reference for other comprehensive evaluations of natural resources and the formulation of natural resource utilization policies.
1 Introduction
Natural resources refer to the material and energy that can be used by human beings in nature, which cover both aboveground and underground, including land, mineral, water, forest, grassland, wetland, and marine resources (Zhang et al., 2021), which are closely related to human survival and development. However, the rapid population and economic growth has put tremendous pressure on resources and the environment (Wolman, 2011; Chen et al., 2020). In the last 50 years, the global population has increased from 3.7 billion in 1970 to 7.8 billion in 2021 (UNFPA, 2021), whereas natural resources continue to be consumed and wasted, leading to the over-exploitation and utilization of natural resources (Liu et al., 2020). The irrational use of resources not only destroys the environment but also threatens the sustainable development of human society (Shafiei and Salim, 2014; Merino-Saum et al., 2018). To save resources and protect the environment, it is necessary to realize the sustainable utilization of natural resources (SUNRs) and improve natural resource utilization benefits (NRUBs) (Roozbahani et al., 2015; Su and Jiang, 2021). In 2015, the United Nations (UN) devised the 2030 Agenda for Sustainable Development, which includes 17 sustainable development goals (SDGs) (Colglazier, 2015). Among them, 12 goals are relevant to SUNRs, and 10 goals can only be achieved by substantially increasing NRUBs (Huang, 2020). Thus, the utilization benefits of natural resources are an important issue related to human development.
Since the reform and opening-up in China, the processes of industrialization and urbanization have accelerated (Xu et al., 2019). The development for 40 years has made China the world’s no.2 economy, with the largest population. Although the total amount of natural resources is abundant, a big gap still exists between the per capita resources and the world average. The key to achieving high-quality development is to optimize the way of resource utilization and improve efficiency (Miao et al., 2017). The strategy of ecological civilization construction, put forward at the 18th National Congress of the Communist Party of China (CPC) in 2012, was proposed to save resources, protect the environment, and realize the unity of economic, social, and ecological benefits (Du et al., 2021). In 2020, the Proposal on Formulating the 14th Five-Year Plan for National Economic and Social Development and the Long-Range Goals of 2035 further emphasized improving NRUBs. Due to the inevitable pressure on resources and the environment and the realistic demand for sustainable development, the coordinated development of economic, social, and ecological benefits of natural resources has been regarded as an effective method to save resources (Hansmann et al., 2012; Li et al., 2020). Therefore, exploring the coupling coordination relationships between economic, social, and ecological benefits is helpful to formulate resource utilization policies and achieve the goal of sustainability.
A more efficient way of resource utility is deemed an important step to conserve resources, reduce climate change, and preserve ecological assets (Huysman et al., 2015). In this context, there is a rich body of literature assessing the NRUBs and seeking measures to improve the benefits. The evaluation framework usually takes into account the link between resource utilization and other relevant aspects, including the socioeconomic system, environmental impact, self-supply, and nature conservation (Huysman et al., 2015; Eisenmenger et al., 2016; Noda et al., 2019). In addition to the impacts on regional socioeconomy and environment, many recent studies have shown that natural resource utilization is related to key issues such as economic globalization, ecological footprint, and carbon neutrality (Adebayo et al., 2022; Awosusi et al., 2022; Miao et al., 2022). In terms of measures to improve NRUBs, natural resource balance sheet compilation (Chen et al., 2022), green technology innovation (Miao et al., 2017), and clean energy input (Han et al., 2020) are effective methods. Most of the studies regard NRUBs as a whole and explore the connection with other systems. Some scholars also pay attention to the relationships of the internal economic, social, and ecological subsystems, and the importance of their coordinated development. For instance, Ma and Wen (2021) developed a fuzzy multi-objective linear programming (FMLP) to determine an optimal land use structure considering the relationships of social, economic, and ecological benefits of land. Schratzberger et al. (2019) identified the interactions between and within ecological and socioeconomic benefits of highly protected marine areas (HPMAs) to help marine planners and managers make informed decisions. Laing and Moonsammy (2021) argued that the economic benefit of small-scale mining in Guyana should be weighed against social and ecological benefits to achieve sustainable development. Consequently, the relationships and interactions among economic, social, and ecological benefits need to be studied to explore the optimal resource utilization mode. Recently, researchers have carried out much work on the coordination evaluation (Ye and Qiu, 2021), spatiotemporal variation (Huang et al., 2016; Yuan et al., 2019; Chen et al., 2021), and influencing factors (Yu et al., 2019) among the utilization benefits of different resources. Ji et al. (2020) revealed that the coupling degree of Xiamen City’s land use was relatively low while showing a positive trend of development. Tian et al. (2019) proved that the lag of economic benefit was the main reason that restricted the improvement of coupling coordination of land use benefit. However, previous studies mainly focused on the benefits of individual resources, which were insufficient in the comprehensive utilization of natural resources, with a few research studies on water and land resources (Wang and Shi, 2013). In addition, the existing works of literature only studied the coupling relationships between economic, social, and ecological benefits or pair-wise benefits, and the analysis of the shortcomings and factors that affect the coordinated development of the overall benefits is limited. Therefore, this study attempts to explore the coupling coordination relationships between economic–social, economic–ecological, social–ecological, and economic–social–ecological benefits of natural resources through a coupling coordination degree (CCD) model and analyze the influencing factors.
In 2018, China’s Ministry of Natural Resources was established to exercise unified functions in the utilization and management of natural resources. In the context of unified management of natural resources, it is necessary to explore NRUBs and their coupling coordination relationships to improve the sustainability of natural resources. Selecting Beijing as the research area, the objectives of this study include the following three parts: 1) constructing an evaluation index system and model of NRUBs from the aspects of economy, society, and ecology; 2) developing a CCD model and analyzing the evolution rules of coupling coordination relationships between economic, social, and ecological benefits from 1978 to 2018; and 3) determining the main influencing factors of the coordination state of economic, social, and ecological benefits by applying gray relational analysis (GRA) and putting forward corresponding suggestions. This study can provide a reference for the evaluation of NRUBs to promote the sustainable utilization and management of natural resources.
The rest of this study is organized as follows. Section 2 explains the connotation and interaction of NRUBs. Section 3 introduces the research framework, study area, and materials and methods. Section 4 shows the results, including evolution patterns of NRUBs, the CCD of NRUBs and coordination types, and the relational coefficients of the main influencing factors. Section 5 presents the analyses and discussions based on the results. The main conclusions are summarized in Section 6.
2 Theoretical Basis
2.1 Connotation of Natural Resource Utilization Benefits
NRUBs are formed by the interaction between humans and natural resources. As the subjects of natural resource utility, humans have different needs in basic life, economic development, spiritual culture, and environmental protection. As the objects, natural resources have natural, economic, social, and ecological attributes, and rational exploitation and utilization can satisfy the diverse needs of human beings. As a result, humans purposefully invest capital, technology, and labor to use resources to obtain products and services. Therefore, NRUBs can be defined as the general terms of various useful achievements to nature or human development produced in the process of natural resource utilization in a certain region.
NRUBs have significant temporal variation characteristics, which are manifested in two aspects. The process of natural resources from exploitation and utilization to providing products and services to humans will go through a period of time, and the form and size of its benefits will change constantly. Moreover, there are differences in human needs at different stages of social development, leading to changes in the goals of resource exploitation, and changes in NRUBs. Hence, the dynamic monitoring and evaluation of NRUBs is to some extent a reflection of the changes in the social and economic development of the region.
2.2 Interaction Within Natural Resource Utilization Benefits
The economic, social, and ecological benefits are three subsystems of the NRUB system (de Groot et al., 2002; Duguma and Hager, 2011), and they have mutual influences (Liang et al., 2008), as shown in Figure 1. Humans exploit and use natural resources based on their own needs to acquire economic benefits and put the economic benefits into public services and infrastructure construction to obtain social benefits (Tian et al., 2019). In this process, if the resource utilization mode is reasonable and within the carrying capacity of resources and the environment, significant economic and social benefits can be achieved continuously. If undesirable outputs such as environmental pollution and ecological damage are caused by the restriction of capital or technology, the ecological benefits will be affected. Improvement of social benefits promotes the agglomeration of production factors to improve the environmental quality and production conditions (Hu et al., 2020). The increase in ecological benefits has a positive effect on the social benefits by improving living conditions and also creates favorable resource and environmental conditions for economic development.
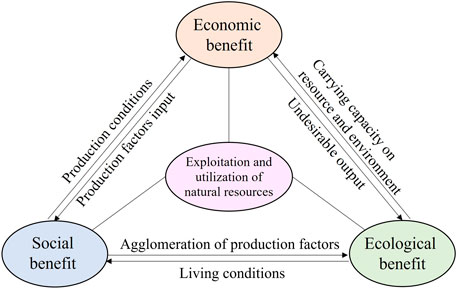
FIGURE 1. Interaction among economic, social, and ecological benefits.
3 Methods and Materials
3.1 Research Framework
Based on the dynamic characteristics of NRUBs and the interrelationship between economic, social, and ecological benefits, this study examines the coordination relationships in the NRUB system in Beijing from 1978 to 2018 and analyzes the influencing factors. First, we establish an evaluation index system, including economic, social, and ecological benefits. Second, we analyze the evolution characteristics of the NRUBs. Third, we use a CCD model to examine the changing features of the coordinated development within the NRUB system. Finally, we identify the main influencing factors of the coordination relationships in the NRUB system and put forward policy implications for sustainable utilization of natural resources. The research framework is shown in Figure 2.
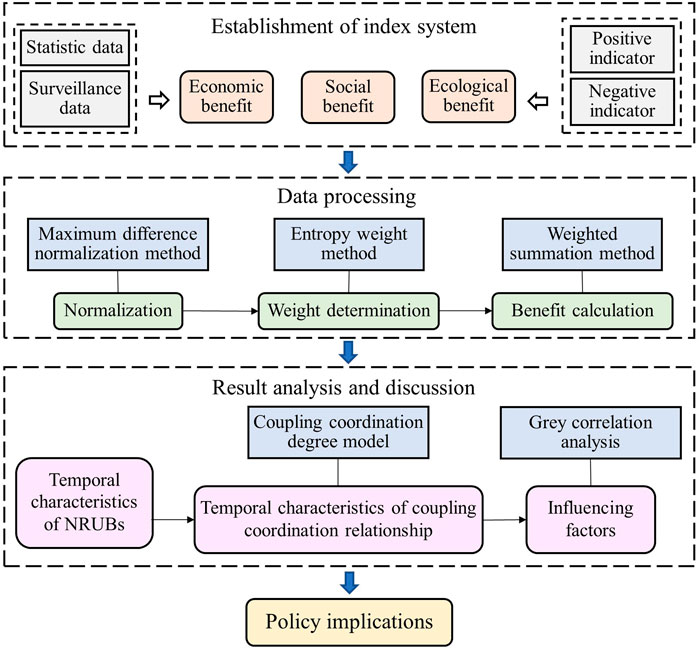
FIGURE 2. Research framework.
3.2 Study Area
This study is conducted in Beijing, which is a megacity and the capital of China (Figure 3). Beijing lies in the central hinterland of North China and extends from 115.7°E to 117.4°E and 39.4°N to 41.6°N. The total area is 16,410.54 km2, with mountainous areas and plains accounting for 62 and 38%, respectively. As the political and cultural center of China and the economic center of Northern China, Beijing has experienced rapid urbanization and industrialization since the reform and opening-up (Sun et al., 2014; Hao et al., 2020). According to the statistical yearbook of Beijing, the gross domestic product (GDP) increased from 10.9 billion CNY in 1978 to 3,310.6 billion CNY in 2018, and the population increased from 8.7 million in 1978 to 21.5 million in 2018. In 2018, it achieved about 3.60% of China’s GDP and supported 1.54% of the country’s population, with only 0.17% of land resources and 0.13% of water resources. Economic development and population growth have put significant pressure on resources and the environment. In turn, resource shortage, inefficient resource utilization, and environmental pollution will restrict the sustainable development of economy and society. Consequently, it is vital to increase NRUBs and seek ways to promote the coordinated development of economic, social, and ecological benefits in Beijing.
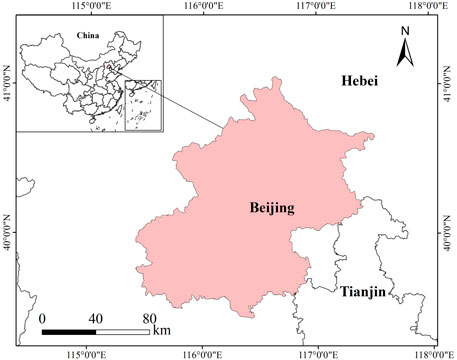
FIGURE 3. Study area.
3.3 Data Source and Pre-Processing
This study takes Beijing as the evaluation unit and studies the evolution characteristics of NRUBs and their coupling coordination relationships from 1978 to 2018 yearly. The data are mostly obtained from the Beijing Statistical Yearbook (1980–2020) and China Population and Employment Statistics Yearbook (1988–2019). We refer to the latest version of economic data, which has been revised officially so that the data from different years are comparable. In addition, some indicators were not counted in 1978; for instance, energy consumption per 10,000 CNY of GDP and forest virescence ratio were first counted in 1980, and indicators related to water resources started in 1988. Therefore, trend line fitting is used to supplement the lacking data. The coefficients of determination (R2) are all greater than 0.9, indicating that the fitting is accurate. The data on natural reserves are from the official website of the Beijing Municipal Ecology and Environment Bureau (https://sthjj.beijing.gov.cn/).
The index system contains both positive and negative indicators. To eliminate the influence of magnitude and measurement, the maximum difference normalization method is adopted, whose formula is as follows:
where
3.4 Methods
3.4.1 Index System
The key to analyzing the benefit is to select appropriate indicators and construct a comprehensive evaluation index system. The indicators are almost acquired from previous studies (Liang et al., 2008; Huang et al., 2016; Xia et al., 2018). A total of 13 indicators (I1–I13) are selected to construct the index system (Table 1). The selection follows the principles of availability, typicality, and scientificity, combined with the actual situation in Beijing.
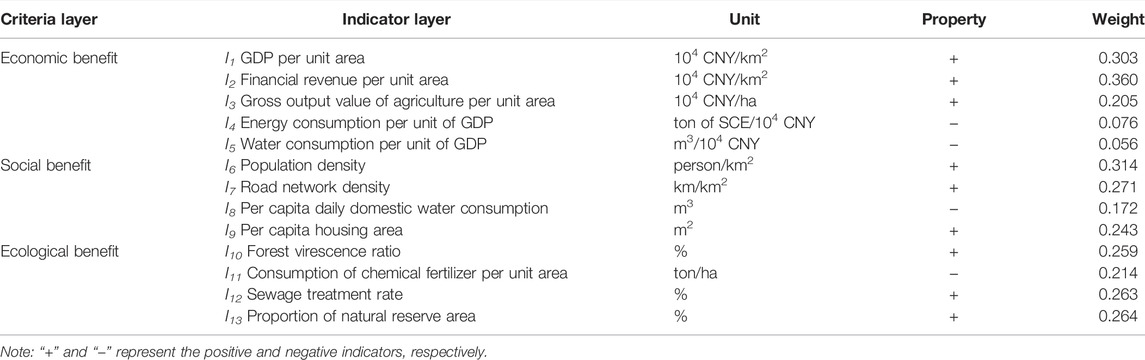
TABLE 1. Index system for assessing NRUBs.
Economic benefit refers to the ratio of the product or service obtained to the costs such as labor, capital, and the amount of resources. Five indicators are selected to represent the economic benefit, namely, GDP per unit area, financial revenue per unit area, gross output value of agriculture per unit area, energy consumption per unit of GDP, and water consumption per unit of GDP. GDP per unit area (I1) and gross output value of agriculture per unit area (I3) directly measure the output value of unit natural resources, while financial revenue per unit area (I2) represents the indirect earnings brought by resource utilization. Energy consumption per unit of GDP (I4) and water consumption per unit of GDP (I5) reflect the economic output capacity and intensive utilization of natural resources.
Social benefit is the satisfaction of social needs after utilizing natural resources, which is related to people’s livelihood and social sustainable development. Population density, road network density, per capita daily domestic water consumption, and per capita housing area are chosen to quantify the social benefit. Here, population density (I6) is regarded as a positive indicator from the perspective of resource utilization efficiency, indicating that land is capable of carrying more people. Road network density (I7) and per capita housing area (I9) reflect the living convenience and comfort of residents. Per capita daily domestic water consumption (I8) is a negative indicator, representing the ability to save natural resources in daily life.
Ecological benefit refers to the impacts on the eco-environment, which is represented by the forest virescence ratio, consumption of chemical fertilizer per unit area, sewage treatment rate, and proportion of natural reserve area. The forest virescence ratio (I10) is similar to the forest coverage rate, reflecting the greening situation of the region. The utilization of natural resources will lead to some adverse environmental consequences, which are measured by the consumption of chemical fertilizer per unit area (I11) and sewage treatment rate (I12). The proportion of natural reserve area (I13) is chosen to represent the conservation of the environment and ecology.
3.4.2 Entropy Weight Method
This study applies the entropy weight method (EWM) to determine the weight of each indicator. The EWM determines the weight according to the degree of dispersion of data and avoids the subjective influence of the evaluator (Liu et al., 2018). Three equations are used and the formulas are shown as follows:
where
The economic, social, and ecological benefits are regarded as equally important subsystems. Therefore, the sum of weights of each subsystem is 1, and the values of each benefit range from 0 to 1. Then, the weighted summation method (Xu et al., 2020) is used to calculate the values of economic, social, ecological, and comprehensive benefits.
3.4.3 Coupling Coordination Degree Model
Originating from physical science, coupling refers to the relationships between different systems that affect each other through various interactions (Huang and Fang, 2003), and has been applied in environmental studies (Guo et al., 2015). Based on the coupling theory, a CCD model is developed to analyze the relationships between economy, society, and environment (Cheng et al., 2019; Li and Yi, 2020); economy, resources, and environment (Xing et al., 2019; Han et al., 2021); urbanization and eco-environment (Ma et al., 2021; Yang C. et al., 2020); urbanization and natural resource benefits (Tong et al., 2020; Wang et al., 2020); etc. Given that there is a coupling relationship among the economic, social, and ecological benefits of natural resource utilization, the CCD model is suitable to explore the coupling coordination relationships among NRUBs.
We analyze the coupling coordination relationships among both two pairs of the three subsystems (Yang Y. et al., 2020) and the three subsystems (Han et al., 2021). The formulas for calculating the coupling coordination degrees of the pair-wise benefits are as follows:
where
For the coupling coordination degree in three subsystems, the calculation methods of C and T have slight differences, as follows:
where C and T represent the coupling degree and development index of economic–social–ecological benefits, respectively;
After the calculation of the coupling coordination degree, it is usually divided into several coordination types subjectively, as shown in Table 2. The higher the D value, the better the coupling coordination relationship (Yang Y. et al., 2020).
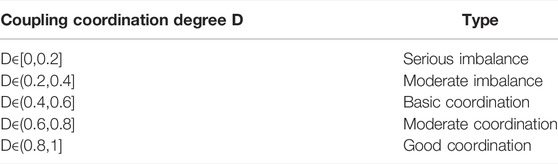
TABLE 2. Coordination types.
3.4.4 Gray Relational Analysis
GRA is a method to measure the correlation degree between two factors according to the similarity of their developing trends and is widely applied in the quantitative analysis of dynamic systems (Guo, 2021). To ensure the dependence of indicators, factors affecting the coupling coordination relationships of NRUBs are selected based on previous literature (Yu et al., 2019; Zhu and Sun, 2019), including economic development (F1), industrial structure (F2), urbanization (F3), environmental awareness (F4), and technological innovation (F5). Per capita GDP, proportion of the tertiary industry, proportion of urban population, education level, and number of granted patents are calculated to characterize these factors, as shown in Table 3.
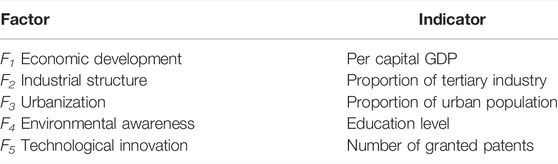
TABLE 3. Factors affecting the coupling coordination relationships of NRUBs and indicators.
Then, the relational coefficients between the CCD and the factors are calculated through the GRA. The larger coefficient reflects the greater influence. The formulas are as follows:
where
4 Results
4.1 Evolution Patterns of Natural Resource Utilization Benefits
Based on the evaluation index system, the values of economic, social, ecological, and comprehensive benefits of natural resource utilization and their evolution trends are shown in Figure 4. From 1978 to 2018, all the benefits significantly improved, with some fluctuations. The economic benefit shows a trend of steady growth, although it is the lowest for most of the study period. From 1978 to 2000, the economic value is low and grew slowly, with its value rising from 0.001 in 1978 to 0.193 in 2000. Since the 21st century, it increased rapidly and surpassed social and ecological benefits in 2016. The changing trend of the social benefit increases slightly at the beginning of the study period. During the 1991–2006 period, the social benefit increases with fluctuations, which decreases in 1992, 1998, and 2003 and increases in 2006 noticeably. Since 2006, it displays a steady upward trend and tended to be stable, maintaining at about 0.86 after 2013. The overall trend of the ecological benefit can be described as fluctuating growth. In the first 30 years of the study period, the value of the ecological benefit was almost the highest. Except for notable increases in 1985, 1995, 1999, 2000, and the last 6 years, the changes in the ecological benefit in other years are relatively insignificant. The comprehensive benefit, comprising the economic, social, and ecological benefits, showed an evolution trend of rising from 1978 to 2018, and the growth rate gradually accelerates. There are also several slight fluctuations in the curve, due to the changes in the social and ecological benefits; however, the upward trend is steady on the whole.
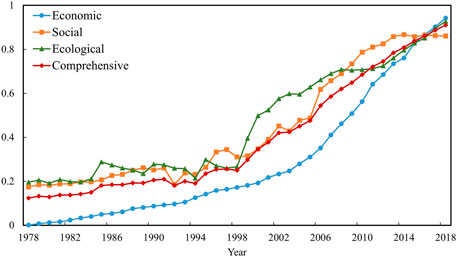
FIGURE 4. Changing curves for the values of NRUBs.
4.2 Coupling Coordination Degree of Natural Resource Utilization Benefits and Coordination Types
The coupling coordination relationships among the economic, social, and ecological benefits of natural resource utilization are analyzed according to the CCD model. The evolution characteristics of the coupling coordination degrees and the coordination types are shown in Figures 5, 6, respectively. It can be noted that the coupling coordination degrees of the ecological–social, economic–ecological, social–ecological, and economic–social–ecological benefits all have upward trends during the study period, although with some fluctuations.
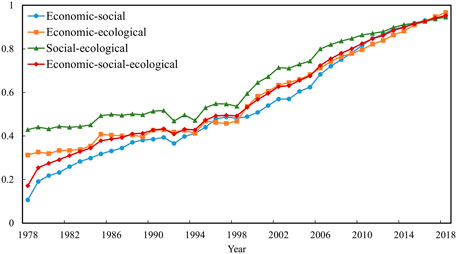
FIGURE 5. Evolution curves of coupling coordination degrees of NRUBs.
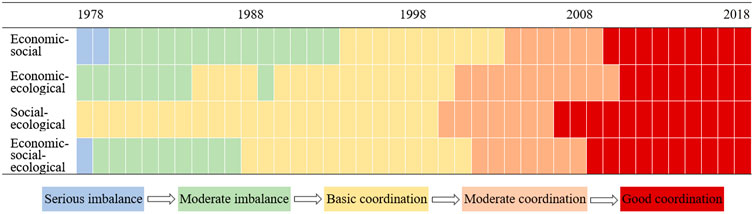
FIGURE 6. Coupling coordination types of NRUBs from 1978 to 2018.
Specifically, the coupling coordination relationship of the economic–social benefits displays an upward trend overall, while the degree is relatively low at the beginning of the study period. From 1978 to 1993, the coordination relationship stays at the stage of imbalance, and the degree reaches 0.6 in 1994. After reaching the basic coordination, the coordination relationship of economic–social benefits improves steadily and achieves good coordination in 2010. The overall evolution trend of the coupling coordination relationship between the economic and ecological benefits can be described as steady growth. During the first half of the study period, the coupling coordination degree rises slowly in the fluctuations, with the coordination type changing from moderate imbalance to basic coordination, except for a slight degradation in 1989. Afterward, the coordination degree rises continuously and reaches the stage of moderate-good coordination. For the social–ecological benefits, the coupling coordination relationship reaches the stage of basic coordination at the beginning of the study period, but it improves slowly over a long time. The degree rises from 0.429 in 1978 to 0.536 in 1998 with fluctuations. In the second half of the study period, the evolution curve shows a steady upward trend, with the coordination type reaching the best level in 2007. The changing trend of the coupling coordination relationship among economic–social–ecological benefits combines the evolution characteristics of the relationships of the pair-wise benefits. At the beginning stage, the coordination degree is relatively low, and the coordination type remains at a serious–moderate imbalance for 10 years. During the 1992–2003 period, the degree rises with slight fluctuations. After 2003, the coordination degree is significantly enhanced, and the coordination type reaches a state of good coordination in 2009.
4.3 Relational Coefficients of Influencing Factors
From Table 4, we can note that the relational coefficients of the five influencing factors are all more than 0.8, indicating that they have significant impacts on the coordinated development of NRUBs. Among them, the coefficients of F3, F2, and F5 exceed 0.9, and the values are 0.996, 0.982, and 0.977, respectively. The coefficients of F1 and F4 are 0.854 and 0.845, respectively, which are slightly less correlated than F3, F2, and F5.
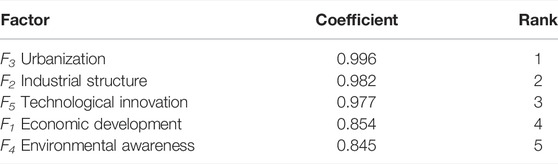
TABLE 4. Correlation coefficients of influencing factors.
5 Discussion
5.1 Reasons for the Changes in Economic, Social, and Ecological Benefits
As can be seen from Figure 2, the economic benefit of natural resource utilization is the lowest for most of the study period, indicating that economic factors are the key to the overall improvement of the benefit. The evolution trend of the economic benefit displays an “exponential” curve, with the value rising slowly at the beginning of the study period and then rapidly. This is because China’s economy was in its infancy at the early stage of the reform and opening-up, and the resource utilization efficiency was low. For example, GDP per unit area (I1) in 1978, 1998, and 2018 was 64.73, 1,451.17, and 20,173.62 104 CNY/km2, respectively. The average annual increase in the first and second 20 years was 69.32 and 936.12 104 CNY/km2, respectively, showing that the growing speed of the economy has accelerated. In addition, with the innovation of technology, the amount of resources consumed in production has also been reduced; thus, the degree of intensive resource utilization is significantly improved (Miao et al., 2017; Ding et al., 2019).
In terms of social benefit, the evolution curve displays an upward trend with fluctuations and tends to be stable after 2013. Economic development is regarded as the core of China’s reform and development, which has been of significant importance for a long time, with the needs and interests of people being ignored. Therefore, the social benefit of natural resource utilization grows slowly for the first 20 years. It even bottoms out in 1992. Since the 21st century, with the proposal of the Scientific Outlook on Development, increasing attention has been paid to people’s needs (Li, 2007). A large number of houses and roads have been constructed to meet the needs of the growing population, leading to the rapid rise of social benefits. Entering the new era of socialism after 2012, the demand for a better life has gradually replaced the demand for materials (Li, 2018). Therefore, the social benefit has changed little in recent years, and further improvement can only be achieved by meeting people’s spiritual needs.
For the changing curve of ecological benefit, the fluctuating duration is long and the degree is relatively great. At the beginning of the study period, the value of the ecological benefit is higher than that of economic and social benefits, mainly due to the backward development level, with a low degree of resource exploitation and environmental damage. As the economy and society develop, the exploitation and utilization of natural resources have expanded, whereas the ecological benefit has not achieved enough attention. Therefore, the ecological benefit fluctuates heavily, with its value in 1998 only rising by 0.055 compared with 1978. There is an evident increase in the ecological benefit from 1998 to 2000, mainly due to the fact that 12 natural reserves were set up in the 2 years, leading to the rise in the proportion of natural reserve areas (I13). Since the beginning of the construction of ecological civilization strategy in 2012, the local government has paid more attention to environmental protection; hence, the ecological benefit starts to increase again after 4 years of leveling off.
5.2 Coordinated Development Stage Division of Natural Resource Utilization Benefits
The coupling coordination relationships among economic, social, and ecological benefits of natural resource utilization can be divided into three stages: slow increase (1978–1991), fluctuating growth (1992–2003), and steady improvement (2004–2018).
1) 1978–1991: Initially, the coupling coordination relationship of economic–social–ecological benefits is low, but it improves in the following years, especially in 1979. In this stage, the changing characteristics of the coordination relationship among the three benefits are similar to those of economic–social benefits, while the variations of the coupling coordination relationships of economic–ecological and social–ecological benefits are slight. This is due to the fact that the ecological benefit is maintained at a high level, and the development level of the economy and society is low. With the slow growth of economic and social benefits, the coupling coordination degree has gradually increased.
2) 1992–2003: In this stage, the coupling coordination relationships of economic, social, and ecological benefits and pair-wise benefits all present the characteristics of volatility. The changing trend of the coupling coordination relationship of economic–social–ecological benefits is most similar to that of social–ecological benefits. This is because the social and ecological benefits fluctuate heavily, while the economic benefit grows steadily. During this period, the economic development significantly influences the society and ecology, indicating that efforts are made to develop the economy and insufficient attention is paid to social development and ecological protection, which is consistent with the hypothesis of the environmental Kuznets curve (Grossman and Krueger, 1995).
3) 2004–2018: The coupling coordination relationships in the NRUB system increase steadily and all reach the level of moderate–good coordination in this period. China has gradually achieved sound and rapid economic development since the 21st century. Additionally, under the guidance of policies such as the Scientific Outlook on Development and Construction of Ecological Civilization, economic development can improve the society and environment through the adjustment of industrial structures and technology upgrading (Xue et al., 2014; Xing et al., 2019), and social and ecological benefits have simultaneously been improved. Subsequently, the coupling coordination relationships of economic–social–ecological benefits and pair-wise benefits enhance rapidly.
5.3 Influencing Factors and Policy Implications
Through the deep analysis of the changes in NRUBs and the coordination relationships, it can be noted that NRUBs are closely related to national policy and region development strategy. Therefore, it is necessary to objectively identify the problems existing in the current benefits and adjust the resource utilization policies to realize the sustainable utilization of natural resources.
Urbanization, industrial structure, technology innovation, economic development, and environmental awareness have noticeable influences on the coupling coordination relationships of NRUBs, as shown in Table 3. Urbanization refers to the process of transformation from rural population to urban population, and from agricultural production to non-agricultural production. This transformation aggregates the production factors but also increases the pressure on resources and the environment. The adjustment of industrial structure and economic development increase the demand for natural resources and provide financial guarantee for the exploitation and utilization of resources. Technology innovation is another notable factor. With the improvement of technology, the efficiency of resource utilization will be constantly increased, thus saving natural resources and reducing pollution. Finally, public awareness of environmental protection is also an important factor that affects the coupling coordination development of NRUBs. Only when the public is aware of the importance and scarcity of natural resources can the utilization benefits of natural resources be improved and coordinated development be promoted fundamentally.
The policy suggestions for the coordinated development of NRUBs are listed as follows. First, Beijing’s economy has reached a relatively high stage, which needs to be transformed from high-speed development to high-quality development, with less resource consumption and carbon emission. Second, with the continuous growth of the urban population, on one hand, we should perfect public facilities to ensure the resource supply for every resident and strengthen spiritual culture construction; on the other hand, new-type urbanization needs to be promoted to realize urban–rural integration and common prosperity. Third, it is suggested to further consolidate the achievements of Beijing’s environmental governance and the redistribution of non-capital functions, and give full play to the role of ecological protection areas as ecological barriers. The government should also strengthen the publicity and education on environmental protection and the construction of the ecological civilization. Last, it is necessary to increase investment in scientific research and cultivate more talented people to improve production technology and increase the efficiency of resource utilization.
5.4 Contributions and Limitations
First, in this study, various natural resources such as land, water, forest, grassland, and wetland are considered as a whole, and a comprehensive evaluation index system covering economic, social, and ecological benefits is established to quantify NRUBs. Different kinds of natural resources have interactions with each other; therefore, this study will provide a theoretical reference for the comprehensive assessment of natural resources and the unified utilization and management of natural resources. Second, the time series are longer than most studies and the interval is 1 year, which can better reflect the changing characteristics of the coupling coordination relationships over a long time. Last, both the coupling coordination degrees of economic–social–ecological benefits and the pair-wise benefits are calculated, which helps better understand the leading reasons affecting the overall coupling coordination relationships in each stage.
Nevertheless, there is still room for further progress of this research. Due to the limitation of data, some important indicators such as forest coverage rate and soil and water conservation rate are difficult to acquire, and the accuracy of indicator values needs to be further improved. In the future, with diversified evaluation dimensions, multi-source data integration and intelligent mode, the evaluation methods of NRUBs will be more scientific. Moreover, the influencing factors can be identified dynamically by stages, so that we can better distinguish the influencing mechanism and the variation trends. The spatial differentiation of coupling coordination relationships will also be studied in future research to understand the differences within the region and make more targeted policies.
6 Conclusion
This study establishes an evaluation index system and examines the coupling coordination relationships of NRUBs in Beijing from 1978 to 2018, with the methods of EWM, CCD model, and GRA. We have revealed the evolution characteristics of NRUBs and their coupling coordination relationships and analyzed the causes according to the development policies of Beijing. Finally, the influencing factors are identified and relevant policy implications are put forward. The main conclusions are summarized as follows. 1) From 1978 to 2018, the economic, social, ecological, and comprehensive benefits have significantly improved. The economic benefit shows a trend of steady growth, while the social and ecological benefits rise with fluctuations. The overall evolution trend of the comprehensive benefit is in steady growth with slight fluctuations. 2) The coupling coordination relationships of economic–social, economic–ecological, social–ecological, and economic–social–ecological benefits all exhibit upward trends during the study period, and their coordination types transform from a serious-moderate imbalance to a moderate-good coordination. 3) The relational coefficients between the coupling coordination degree and urbanization, industrial structure, technology innovation, economic development, and environmental awareness are 0.996, 0.982, 0.977, 0.854, and 0.845, respectively, and they all have significant impacts on the coupling coordination relationships of NRUBs. Measures such as transformation of the economic development mode, improvement of public facilities, construction of spiritual culture, ecological protection, and technological innovation need to be recognized to achieve coordinated development.
In the context of the unified management of natural resources, the evaluation of NRUBs and the coupling coordination relationships are of great significance to improve the utilization benefits and realize the sustainable development of natural resources. The findings of this study can provide a decision-making reference for the coordinated development of the economic, social, and ecological benefits and the formulation of natural resource utilization policies.
Data Availability Statement
The original contributions presented in the study are included in the article/Supplementary Material; further inquiries can be directed to the corresponding authors.
Author Contributions
ZY: conceptualization, methodology, formal analysis, and writing—original draft. CZ: conceptualization and formal analysis. YL: data curation and funding acquisition. YP: supervision and writing—review and editing. WZ: writing—review and editing.
Funding
This research was supported by the National Key R&D Program of China (2020YFD1100202).
Conflict of Interest
The authors declare that the research was conducted in the absence of any commercial or financial relationships that could be construed as a potential conflict of interest.
Publisher’s Note
All claims expressed in this article are solely those of the authors and do not necessarily represent those of their affiliated organizations, or those of the publisher, the editors, and the reviewers. Any product that may be evaluated in this article, or claim that may be made by its manufacturer, is not guaranteed or endorsed by the publisher.
References
Adebayo, T. S., Onifade, S. T., Alola, A. A., and Muoneke, O. B. (2022). Does it Take International Integration of Natural Resources to Ascend the Ladder of Environmental Quality in the Newly Industrialized Countries? Resour. Policy 76, 102616. doi:10.1016/j.resourpol.2022.102616
Awosusi, A. A., Adebayo, T. S., Altuntaş, M., Agyekum, E. B., Zawbaa, H. M., and Kamel, S. (2022). The Dynamic Impact of Biomass and Natural Resources on Ecological Footprint in BRICS Economies: A Quantile Regression Evidence. Energy Rep. 8, 1979–1994. doi:10.1016/j.egyr.2022.01.022
Chen, C.-F., Feng, K.-L., and Ma, H.-w. (2020). Uncover the Interdependent Environmental Impacts Associated with the Water-Energy-Food Nexus under Resource Management Strategies. Resour. Conserv. Recycl. 160, 104909. doi:10.1016/j.resconrec.2020.104909
Chen, Z., Zhang, Q., Li, F., and Shi, J. (2021). Comprehensive Evaluation of Land Use Benefit in the Yellow River Basin from 1995 to 2018. Land 10, 643. doi:10.3390/land10060643
Chen, P., Xu, H., Chen, S., ShangZhang, Y. B., Zhang, B., and Zhao, X. (2022). Developing a System Framework for China’s Natural Resources Balance Sheet from the Perspective of Sustainable Development. Front. Environ. Sci. 9, 807092. doi:10.3389/fenvs.2021.807092
Cheng, X., Long, R., Chen, H., and Li, Q. (2019). Coupling Coordination Degree and Spatial Dynamic Evolution of a Regional Green Competitiveness System - A Case Study from China. Ecol. Indic. 104, 489–500. doi:10.1016/j.ecolind.2019.04.003
Colglazier, W. (2015). Sustainable Development Agenda: 2030. Science 349, 1048–1050. doi:10.1126/science.aad2333
de Groot, R. S., Wilson, M. A., and Boumans, R. M. J. (2002). A Typology for the Classification, Description and Valuation of Ecosystem Functions, Goods and Services. Ecol. Econ. 41, 393–408. doi:10.1016/s0921-8009(02)00089-7
Ding, X., Zhang, Z., Wu, F., and Xu, X. (2019). Study on the Evolution of Water Resource Utilization Efficiency in Tibet Autonomous Region and Four Provinces in Tibetan Areas under Double Control Action. Sustainability 11, 3396. doi:10.3390/su11123396
Du, W., Yan, H., Feng, Z., Yang, Y., and Liu, F. (2021). The Supply-Consumption Relationship of Ecological Resources under Ecological Civilization Construction in China. Resour. Conserv. Recycl. 172, 105679. doi:10.1016/j.resconrec.2021.105679
Duguma, L. A., and Hager, H. (2011). Farmers' Assessment of the Social and Ecological Values of Land Uses in Central Highland Ethiopia. Environ. Manag. 47, 969–982. doi:10.1007/s00267-011-9657-9
Eisenmenger, N., Giljum, S., Lutter, S., Marques, A., Theurl, M., Pereira, H., et al. (2016). Towards a Conceptual Framework for Social-Ecological Systems Integrating Biodiversity and Ecosystem Services with Resource Efficiency Indicators. Sustainability 8, 201. doi:10.3390/su8030201
Grossman, G. M., and Krueger, A. B. (1995). Economic Growth and the Environment. Q. J. Econ. 110, 353–377. doi:10.2307/2118443
Guo, Y., Wang, H., Nijkamp, P., and Xu, J. (2015). Space-time Indicators in Interdependent Urban-Environmental Systems: A Study on the Huai River Basin in China. Habitat Int. 45, 135–146. doi:10.1016/j.habitatint.2014.06.030
Guo, L. (2021). Coupling Coordination Degree between New Urbanization and Eco-Environment in Shaanxi, China, and its Influencing Factors. Discrete Dyn. Nat. Soc. 2021, 1–8. doi:10.1155/2021/1555362
Han, X., Zhang, A., and Cai, Y. (2020). Spatio-Econometric Analysis of Urban Land Use Efficiency in China from the Perspective of Natural Resources Input and Undesirable Outputs: A Case Study of 287 Cities in China. Int. J. Environ. Res. Public Health 17, 7297. doi:10.3390/ijerph17197297
Han, H., Guo, L., Zhang, J., Zhang, K., and Cui, N. (2021). Spatiotemporal Analysis of the Coordination of Economic Development, Resource Utilization, and Environmental Quality in the Beijing-Tianjin-Hebei Urban Agglomeration. Ecol. Indic. 127, 107724. doi:10.1016/j.ecolind.2021.107724
Hansmann, R., Mieg, H. A., and Frischknecht, P. (2012). Principal Sustainability Components: Empirical Analysis of Synergies between the Three Pillars of Sustainability. Int. J. Sustain. Dev. World Ecol. 19, 451–459. doi:10.1080/13504509.2012.696220
Hao, Y., Hao, X., Li, Y., Zhang, Y., and Wu, H. (2020). How Does Air Quality Affect the Willingness of Graduate Students to Stay? Evidence from Beijing City, China. J. Clean. Prod. 259, 120759. doi:10.1016/j.jclepro.2020.120759
Hu, Y., Qiao, W., Wan, Y., He, T., Chai, Y., and Bi, Y. (2020). Comprehensive Evaluation and Spatial Distinction of Land Use Efficiency in County Area of Jiangsu Province. Econ. Geogr. 40 (11), 186–195. doi:10.15957/j.cnki.jjdl.2020.11.021
Huang, J., and Fang, C. (2003). Analysis of Coupling Mechanism and Rules between Urbanization and Eco-Environment. Geogr. Res. 22 (2), 211–220. doi:10.11821/yj2003020010
Huang, L., Bi, M., and Han, B. (2016). Comprehensive Measurement and Coupling Coordination Degree of Land Use Benefit in Heilongjiang Provinve. Chin. J. Agric. Resour. Reg. Plan. 37 (11), 20–28. doi:10.7621/cjarrp.1005-9121.20161104
Huang, S. (2020). Assessing Sustainable Use of Natural Resources for SDGs: A Case of Lishui. Zhejiang Province., Hangzhou: Zhejiang University.
Huysman, S., Sala, S., Mancini, L., Ardente, F., Alvarenga, R. A. F., De Meester, S., et al. (2015). Toward a Systematized Framework for Resource Efficiency Indicators. Resour. Conserv. Recycl. 95, 68–76. doi:10.1016/j.resconrec.2014.10.014
Ji, X., Wang, K., Ji, T., Zhang, Y., and Wang, K. (2020). Coupling Analysis of Urban Land Use Benefits: A Case Study of Xiamen City. Land 9, 155. doi:10.3390/land9050155
Laing, T., and Moonsammy, S. (2021). Evaluating the Impact of Small-Scale Mining on the Achievement of the Sustainable Development Goals in Guyana. Environ. Sci. Policy 116, 147–159. doi:10.1016/j.envsci.2020.11.010
Li, W., and Yi, P. (2020). Assessment of City Sustainability-Coupling Coordinated Development Among Economy, Society and Environment. J. Clean. Prod. 256, 120453. doi:10.1016/j.jclepro.2020.120453
Li, H., Zhao, Y., and Zheng, F. (2020). The Framework of an Agricultural Land-Use Decision Support System Based on Ecological Environmental Constraints. Sci. Total Environ. 717, 137149. doi:10.1016/j.scitotenv.2020.137149
Li, S. (2007). Scientific Implications and Spiritual Essence of the Concept of the "People-Centered Approach. Soc. Sci. China (6), 4–17. 204.
Liang, H., Liu, W., Liu, H., Lin, Y., and Liu, Y. (2008). Coupling Relationship between Socio-Economy Benefits and Eco-Environment Benefits of Land Use in Shenzhen City. Sci. Geogr. Sin. 28 (5), 636–641. doi:10.13249/j.cnki.sgs.2008.05.636
Liu, N., Liu, C., Xia, Y., and Da, B. (2018). Examining the Coordination between Urbanization and Eco-Environment Using Coupling and Spatial Analyses: A Case Study in China. Ecol. Indic. 93, 1163–1175. doi:10.1016/j.ecolind.2018.06.013
Liu, S., Xiao, W., Li, L., Ye, Y., and Song, X. (2020). Urban Land Use Efficiency and Improvement Potential in China: A Stochastic Frontier Analysis. Land Use Policy 99, 105046. doi:10.1016/j.landusepol.2020.105046
Ma, S., and Wen, Z. (2021). Optimization of Land Use Structure to Balance Economic Benefits and Ecosystem Services under Uncertainties: A Case Study in Wuhan, China. J. Clean. Prod. 311, 127537. doi:10.1016/j.jclepro.2021.127537
Ma, X., Li, N., Yang, H., and Li, Y. (2021). Exploring the Relationship between Urbanization and Water Environment Based on Coupling Analysis in Nanjing, East China. Environ. Sci. Pollut. R. 29, 4654–4667. doi:10.1007/s11356-021-15161-1
Merino-Saum, A., Baldi, M. G., Gunderson, I., and Oberle, B. (2018). Articulating Natural Resources and Sustainable Development Goals through Green Economy Indicators: A Systematic Analysis. Resour. Conserv. Recycl. 139, 90–103. doi:10.1016/j.resconrec.2018.07.007
Miao, C., Fang, D., Sun, L., and Luo, Q. (2017). Natural Resources Utilization Efficiency under the Influence of Green Technological Innovation. Resour. Conserv. Recycl. 126, 153–161. doi:10.1016/j.resconrec.2017.07.019
Miao, Y., Razzaq, A., Adebayo, T. S., and Awosusi, A. A. (2022). Do renewable Energy Consumption and Financial Globalization Contribute to Ecological Sustainability in Newly Industrialized Countries? Renew. Energy 187, 688–697. doi:10.1016/j.renene.2022.01.073
Noda, K., Iida, A., Watanabe, S., and Osawa, K. (2019). Efficiency and Sustainability of Land-Resource Use on a Small Island. Environ. Res. Lett. 14, 54004. doi:10.1088/1748-9326/ab1455
Roozbahani, R., Schreider, S., and Abbasi, B. (2015). Optimal Water Allocation through a Multi-Objective Compromise between Environmental, Social, and Economic Preferences. Environ. Model. Softw. 64, 18–30. doi:10.1016/j.envsoft.2014.11.001
Schratzberger, M., Neville, S., Painting, S., Weston, K., and Paltriguera, L. (2019). Ecological and Socio-Economic Effects of Highly Protected Marine Areas (HPMAs) in Temperate Waters. Front. Mar. Sci. 6, 749. doi:10.3389/fmars.2019.00749
Shafiei, S., and Salim, R. A. (2014). Non-renewable and Renewable Energy Consumption and CO2 Emissions in OECD Countries: A Comparative Analysis. Energy Policy 66, 547–556. doi:10.1016/j.enpol.2013.10.064
Su, Q., and Jiang, X. (2021). Evaluate the Economic and Environmental Efficiency of Land Use from the Perspective of Decision-Makers' Subjective Preferences. Ecol. Indic. 129, 107984. doi:10.1016/j.ecolind.2021.107984
Sun, F., Yang, Z., and Huang, Z. (2014). Challenges and Solutions of Urban Hydrology in Beijing. Water Resour. Manage 28, 3377–3389. doi:10.1007/s11269-014-0697-9
Tian, J., Wang, B., and Wang, S. (2019). Urban Land Use Efficiency and its Coupling Relationship in the Three Provinces of Northeast China. Sci. Geogr. Sin. 39 (2), 305–315. doi:10.13249/j.cnki.sgs.2019.02.015
Tong, Y., Pan, Y., Zhang, M., and Zhang, L. (2020). Coupling and Coordinated Development of Urbanization and Water Resources in Yunnan Province. Bull. Soil Water Conserv. 40 (6), 243–248. doi:10.13961/j.cnki.stbctb.2020.06.035
UNFPA (2021). World Population Dashboard. Available at: https://www.unfpa.org/data/world-population-dashboard (Accessed September 30,2021).
Wang, H., and Shi, P. (2013). Coordination Degree of Urbanization and Land⁃water Resources Benefits of Wuwei City. Arid. Land Geogr. 36 (5), 963–969. doi:10.13826/j.cnki.cn65-1103/x.2013.05.016
Wang, K., Tang, Y., Chen, Y., Shang, L., Ji, X., Yao, M., et al. (2020). The Coupling and Coordinated Development from Urban Land Using Benefits and Urbanization Level: Case Study from Fujian Province (China). Int. J. Environ. Res. Public Health 17, 5647. doi:10.3390/ijerph17165647
Wolman, A. (2011). The Impact of Population Changes on the Environment. 1965. Am. J. Public Health 101 (4), 642–644. doi:10.2105/ajph.101.4.642
Xia, W., Zhou, W., Li, W., and He, Q. (2018). Analysis of Coupling Effect between Water Resources Benefits and the Integration of Urban and Rural Water Supply Development: a Case Study of Luochuan County. J. Water Resour. Water Eng. 29 (3), 39–44. doi:10.11705/j.issn.1672-643X.2018.03.07
Xing, L., Xue, M., and Hu, M. (2019). Dynamic Simulation and Assessment of the Coupling Coordination Degree of the Economy-Resource-Environment System: Case of Wuhan City in China. J. Environ. Manag. 230, 474–487. doi:10.1016/j.jenvman.2018.09.065
Xu, Z., Zhuo, Y., Liao, R., Wu, C., Wu, Y., and Li, G. (2019). LADM-Based Model for Natural Resource Administration in China. Int. J. Geo-Inf. 8, 456. doi:10.3390/ijgi8100456
Xu, W., Zhang, X., Xu, Q., Gong, H., Li, Q., Liu, B., et al. (2020). Study on the Coupling Coordination Relationship between Water-Use Efficiency and Economic Development. Sustainability 12, 1246. doi:10.3390/su12031246
Xue, B., Geng, Y., Müller, K., Lu, C., and Ren, W. (2014). Understanding the Causality between Carbon Dioxide Emission, Fossil Energy Consumption and Economic Growth in Developed Countries: an Empirical Study. Sustainability 6, 1037–1045. doi:10.3390/su6021037
Yang, C., Zeng, W., and Yang, X. (2020). Coupling Coordination Evaluation and Sustainable Development Pattern of Geo-Ecological Environment and Urbanization in Chongqing Municipality, China. Sustain. Cities Soc. 61, 102271. doi:10.1016/j.scs.2020.102271
Yang, Y., Bao, W., and Liu, Y. (2020). Coupling Coordination Analysis of Rural Production-Living-Ecological Space in the Beijing-Tianjin-Hebei Region. Ecol. Indic. 117, 106512. doi:10.1016/j.ecolind.2020.106512
Ye, Y., and Qiu, H. (2021). Environmental and Social Benefits, and Their Coupling Coordination in Urban Wetland Parks. Urban For. Urban Green. 60, 127043. doi:10.1016/j.ufug.2021.127043
Yu, J., Zhou, K., and Yang, S. (2019). Land Use Efficiency and Influencing Factors of Urban Agglomerations in China. Land Use Policy 88, 104143. doi:10.1016/j.landusepol.2019.104143
Yuan, J., Bian, Z., Yan, Q., and Pan, Y. (2019). Spatio-temporal Distributions of the Land Use Efficiency Coupling Coordination Degree in Mining Cities of Western China. Sustainability 11, 5288. doi:10.3390/su11195288
Zhang, J., Li, H., Gu, H., Zhang, H., Yang, Y., Tan, X., et al. (2021). Study on Man-Machine Collaborative Intelligent Extraction for Natural Resource Features. Acta Geod. Cartogr. Sin. 50 (8), 1023–1032. doi:10.11947/j.AGCS.2021.20210102
Keywords: natural resource utilization benefits, coupling coordination relationship, influencing factors, evolution characteristics, Beijing
Citation: Yin Z, Zhao C, Liu Y, Pan Y and Zhou W (2022) Coupling Coordination Analysis of Natural Resource Utilization Benefits in Beijing From 1978 to 2018. Front. Environ. Sci. 10:926336. doi: 10.3389/fenvs.2022.926336
Received: 22 April 2022; Accepted: 25 May 2022;
Published: 05 July 2022.
Edited by:
Yanbo Qu, Shandong University of Finance and Economics, ChinaReviewed by:
Tomiwa Sunday Adebayo, Cyprus International University, TurkeyYurui Li, Institute of Geographic Sciences and Natural Resources Research (CAS), China
Guogang Wang, Institute of Agricultural Economics and Development (CAAS), China
Copyright © 2022 Yin, Zhao, Liu, Pan and Zhou. This is an open-access article distributed under the terms of the Creative Commons Attribution License (CC BY). The use, distribution or reproduction in other forums is permitted, provided the original author(s) and the copyright owner(s) are credited and that the original publication in this journal is cited, in accordance with accepted academic practice. No use, distribution or reproduction is permitted which does not comply with these terms.
*Correspondence: Yu Liu, bGl1eXVAbmVyY2l0YS5vcmcuY24=; Yuchun Pan, cGFueWNAbmVyY2l0YS5vcmcuY24=