 Yanling Zhi
 Junfei Chen
 Teng Qin2
- 1Institute of Management Science, Business School, Hohai University, Nanjing, China
- 2School of Business, Changzhou University, Changzhou, China
The increasingly severe water crisis is restricting sustainable development of the Yangtze River Delta Urban Agglomeration (YRDUA), highlighting the importance of collaborative water resources management. Based on the dataset from 26 cities between 2001 and 2020 in the YRDUA, this study applies Social Network Analysis to research the spatial correlation of urban water utilization, which helps identify the interaction of water use behaviors among different cities. Results show that the close relationships among urban water consumption in the YRDUA have formed a network, and there is no isolated city in the water use correlation network. During the research period, the water network affinity and network density showed an overall upward trend, meaning the number of actual connections in the network was increasing. However, the network hierarchy first decreased and then raised, and the network efficiency first increased and then decreased, indicating the structural evolution of the water network was gradually detrimental to the effective dissemination of water use information. The urban water consumption correlation network also shows a core-peripheral structure. Shanghai, Wuxi, Suzhou, and Hangzhou have higher coreness and centralities, dominating the water network and controlling major information spillover channels. Therefore, it is essential to focus on the overflow effects of urban water consumption and management among different regions, optimize the structure of the water consumption correlation network, exploit the core cities’ radiation effects, and realize collaborative management for regional water resources.
1 Introduction
Water resources are necessary for human survival and social progress, and ensuring that adequate water supplies are available is essential for human well-being (Oki and Kanae, 2006). Among the 17 sustainable development goals (SDGs) published by the United Nations General Assembly, at least four goals are related to sustainable utilization and management of water resources (Pradhan et al., 2017). However, only about 3% of the water on Earth is freshwater, and its distribution in time and space is uneven (Long and Pijanowski, 2017), resulting in many regions not having enough fresh water. Warnings of increasing water scarcity are common, and about two to three billion people live in highly water-stressed areas globally (Munia et al., 2016). The increasing water scarcity has constrained economic development and the maintenance of a clean environment and healthy ecosystems (Cosgrove and Loucks, 2015). Societies worldwide have long struggled with the efficient and effective management of water resources.
Urbanization is one of the most significant trends in the 21st century, and it is also the engine of growth (Bertinelli and Black, 2004). Due to their high population density and high intensity of socio-economic activities, urban areas have become significant consumers of water resources and producers of waste and pollution (Bao and Fang, 2012). It is estimated that about 2 billion urban dwellers (one-third to nearly half of the global urban population) will experience face water scarcity by 2050 (He et al., 2021). Demand for water exceeding supply will directly affect the health and well-being of urban residents and the quality of urban environmental and socio-economic development (Krueger et al., 2019). Large amounts of water resources have been transferred to urban systems from agricultural and ecological approaches to narrow the urban water supply-demand gap (Srinivasan et al., 2013). Urban water use has significant impacts on other water use systems, and cities play an essential role in managing freshwater resources. As the largest developing country and the second-largest economy globally, China has been suffering from water scarcity for a long time (Wang et al., 2019). About half of cities have insufficient water supplies in normal water years, and one-third of cities experience severe water shortages in China (Jiang, 2009). The Chinese government has adopt the strictest water resource management (SWRM) system to solve the water scarcity and water pollution problems (Zuo and Liu, 2015). The principal objective of SWRM is to comply with three redlines to reduce the total amount of water use, enhance water use efficiencies, and control water pollution (Wang et al., 2018). Suitable government circulars and policy documents have been released as guidelines on water management targets in each province. Therefore, sustainable urban water management is crucial for alleviating the water crisis in China and the world (Liu and Jensen, 2018).
Due to the mobility of water resources and the interaction between cities, there exists a significant spatial correlation in water utilization (Franczyk and Chang, 2009; Lipscomb and Mobarak, 2016). Spatial statistical techniques have arisen as a new tool to consider geospatial factors in water resources management. Compared to a simple ordinary least square (OLS) model (Chang et al., 2017), the spatial econometric model can extract significant factors more accurately by considering spatial interaction effects (Abildtrup et al., 2013). For example, municipal water demand would be subject to spatial lag and error, and there is potential usefulness of the spatial empirical methods in urban water research (O’Donnell and Berrens, 2018). On the one hand, regional water usage presents an apparent spatial aggregation. Regions with significant water use would be spatially clustered (Sohn, 2011). Water pollution also had a significant spatial effect, and water pollutant discharge in cooperation and economic radiation regions showed a combined reduction trend (Zhou et al., 2021). On the other hand, regional water use has significant spatial spillover effects. There is an apparent spatial autocorrelation, cluster trend, and unbalanced development in China’s inter-provincial water resource utilization efficiency (Ma et al., 2016; Fengting et al., 2019; Jingxue et al., 2021). The urbanization level of neighboring cities exerted the most significant positive spatial spillover impact on local water withdrawal (Li et al., 2021). At the urban level, urban water use efficiency in China was characterized by remarkable local spatial autocorrelation (Kai et al., 2022). There was also inequality and spatial diffusion in water use in the Yangtze River Economic Belt (Babuna et al., 2020). It has been widely acknowledged that spatial effects significantly impact water utilization and management (Brelsford and Abbott, 2017), More emphasis should be placed on studying the spillover effect on water use management.
Some scholars believed that traditional spatial measurement methods only could provide a partial assessment by accounting for the geographically and economically “proximity” or “adjacency” spillover effect without furnishing more complex network structure characteristics from a global perspective. Because the traditional spatial econometric model based on “attribute data” can only verify the existence of spatial effects but cannot reveal the inter-regional spatial correlation structure. These studies failed to tell each node’s roles and identify the critical regions in the entire water consumption network, leading to ineffective water management. Therefore, they tried to introduce the social network analysis (SNA) method into the study of regional water usage spatial correlation, which can be used to reveal the influence mechanism between nodes in the water network. Social networks are essential for outcomes in natural resource governance, the structural pattern of relations of a social network can significantly impact how actors behave (Bodin and Crona, 2009). At present, SNA has been applied to describe animal behavior, migration and mobility process (Bilecen et al., 2018), to analyze the complex interactions of stakeholders in natural resource management (Lienert et al., 2013; Kurian et al., 2018). People also use SNA to detective complex spatial correlations of provincial industrial carbon emissions, provincial natural gas consumption, and provincial energy eco-efficiency in China (Bu et al., 2020; Peng et al., 2020; Liu and Xiao, 2021). As for the application of SNA in water research, most literature focused on characteristics of spatial correlation of water resource utilization efficiency (Huang et al., 2021; Shi et al., 2022; Zhi et al., 2022). Besides, researchers also used SNA to study communication networks among organizational departments and divisions in water management or to help facilitate collaboration by looking for factors affecting cooperation and creating bridges in water pollution management (Kunz et al., 2017; Ruzol et al., 2017).
The above-referenced research contributes to the analysis of the spatial pattern of regional water use. However, little attention has been paid to the spatial correlation of urban water consumption, especially from the perspective of non-geographical adjacency. Lacking information on this will implement effective urban water resources management. Taking the Yangtze River Delta urban agglomeration (YRDUA) in China as the research area, according to the panel data of 26 cities from 2001 to 2020, this study constructs a spatial correlation network of urban water utilization. It can reveal the spatial structure and the network characteristics of water usage in the YRDUA. In particular, we can focus on the role of crucial urban by assessing their capacity to spillover and receive water information from other cities. The contributions of this study include: 1) It investigates the spatial correlation of urban water use in the YRDUA, which has reference significance for collaborative management of water affairs in other urban agglomerations. 2) It applied the SNA model to construct a spatial correlation network of urban water utilization at a larger scale by analyzing the spillover effects between different cities and identifying the key regions. 3) The results will offer a scientific basis for formulating more reasonable and collaborative regional water resources management schemes.
2 Materials and Research Methods
2.1 Overview of the Study Area
YRDUA is one of China’s most developed and populated regions, located on the country’s eastern coast. According to the “Yangtze River Delta Urban Agglomeration Development Plan” released by the National Development and Reform Commission in June 2016, the YRDUA contains 26 cities, including Shanghai; Nanjing, Wuxi, Changzhou, Suzhou, Nantong, Yancheng, Yangzhou, Zhenjiang, and Taizhou in Jiangsu province; Hangzhou, Ningbo, Shaoxing, Huzhou, Jiaxing, Jinhua, Zhoushan, and Taizhou in Zhejiang province; and Hefei, Wuhu, Ma’anshan, Tongling, Anqing, Xuancheng, Chizhou, and Chuzhou in Anhui province (Figure 1). Even though this area has a land area of 0.21 million km2 and accounts for only about 2.2% of China’s total land, it comprises 11.0 and 20.0% of the population and gross domestic product (GDP).
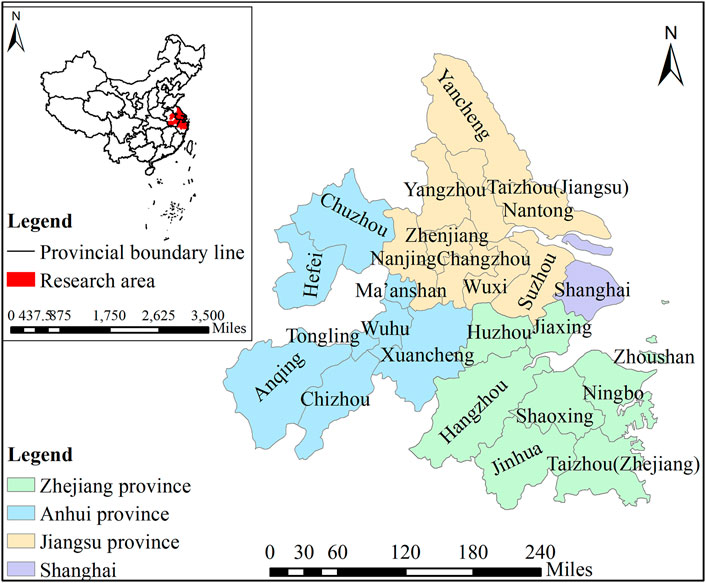
FIGURE 1. The location map of the YRDUA area.
The YRDUA is the earliest and most mature urban agglomeration in China. The overall urbanization rate here is far higher than the national average. From 2001 to 2020, with the rapid growth of population and total GDP, urban water consumption has also undergone significant changes (Figure 2). Freshwater supply is substantial to regional economies and ecosystems (Lang et al., 2017). The quickly upward water demand puts enormous pressure on regional water supplies. The YRDUA faces significant water security challenges, such as water supply stress and water environment pollution (Dou et al., 2021). Research on water use characteristics in the YRDUA is crucial for the region’s sustainable development and sustainable water management across the country.
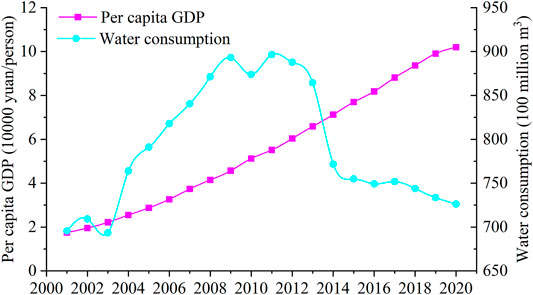
FIGURE 2. Economic development and water consumption in the YRDUA.
2.2 Research Methods
2.2.1 Generating Social Network Data
The construction of relationships is crucial for network analysis. The relationships dataset used to construct a social network is mainly derived from surveys and observations with econometric models, such as the Vector Autoregression (VAR) Granger Causality test and the gravity model. Compared with the VAR model, the network constructed based on the gravity model can reflect the evolution trend of the spatial correlation network. The gravity model was first used to investigate the determinants of bilateral trade and has now been extended to many other fields, such as trade in services (Kahouli and Maktouf, 2015), human mobility (Pappalardo et al., 2016), and knowledge diffusion (Abramo et al., 2020). In this study, complex urban water consumption network is abstracted as social network. This study abstracts a complex urban water consumption network as a social network. The urban water consumption in the YRDUA is the network node”, and the spatial correlation between cities in terms of water consumption is defined as a network “line”, thereby constructing a spatial correlation network of urban water consumption. The correlation data used for representing urban water consumption relationships are created by using an improved gravity model, and the improved gravity model is as Equations 1, 2:
where
2.2.2 Social Network Analysis (SNA)
SNA is a systematic approach. It has been widely used to analyse social relations, resource liquidity among actors (Kharanagh et al., 2020). This method can perform quantitative analysis accurately on relational data and draw qualitative conclusions. SNA has also invented graph-theoretic properties to characterize structures, positions, dyadic properties, and ties of the overall “shape” (Borgatti et al., 2009). From the perspective of urban water consumption in this paper, exchanges of technology, knowledge, talents, and resources between urban in YRDUA will cause the correlation of water usage in these regions, which meets its applicability.
Based on the above “relation data”, the spatial correlation network of urban water consumption is constructed. Then, three items are selected: the overall network characteristics, the individual characteristics, and the core-periphery structure to describe the structural features. For the overall network characteristics, this paper mainly focuses on four factors: network affinity, network density, network efficiency, and network hierarchy (Liu et al., 2017; Bu et al., 2020). For the individual characteristics, centrality measures reflect the importance of a particular node in the network: degree centrality, betweenness centrality, and closeness centrality. Table 1 contains an introduction of each characteristic, and more detailed information can be found in the supplementary material. We use the software UCINET (v 6.659) to finish calculating and analysing water network characteristics.
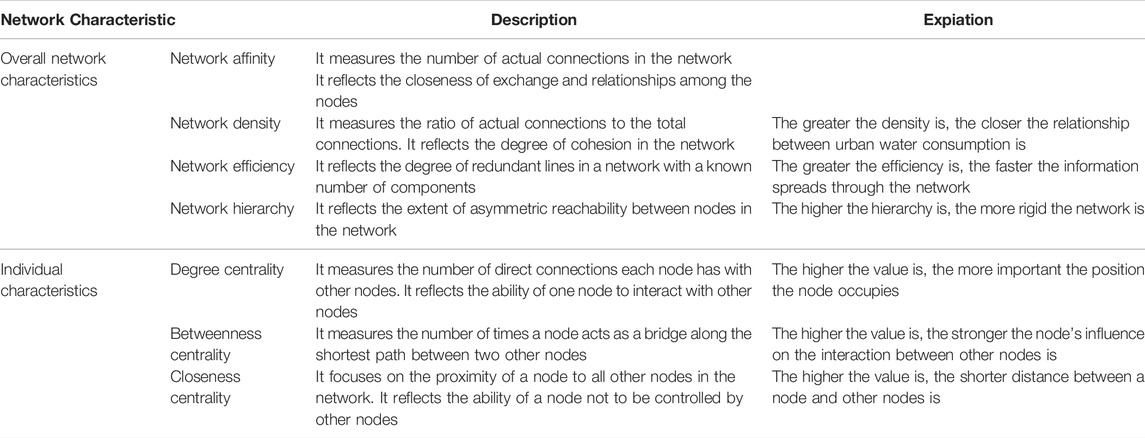
TABLE 1. A brief description of the calculation methods of social network characteristics.
The core-periphery structure is a special kind of centralized network. It can characterize the position of different nodes in the network and provide a standard to define the importance of a node in the network, thereby identifying the core members (Hartmann et al., 2020). Core actors with high centrality are strongly connected. In contrast, actors in the periphery are connected only to the core actors and not directly to other peripheral actors (Bodin and Crona, 2009). The core-periphery structures significantly affect the exchange of information and knowledge in resource governance contexts. The core actors would be more engaged in acquiring new information and knowledge than periphery actors (Rombach et al., 2017). Innovations and knowledge generally tend to trickle down from highly interconnected core actors to more loosely connected peripheral actors (Abrahamson and Rosenkopf, 1997).
2.3 Data Sources and Processing
The dataset contains GDP, water consumption, and population from 2001 to 2020. GDP is measured by 10,000 Chinese yuan and calculated in the constant price of the year 2,000. The data used in this study are mainly taken from the Statistical Yearbook of Jiangsu Province, Shanghai Statistical Yearbook, Zhejiang Statistical Yearbook, and Anhui Statistical Yearbook between 2002 and 2021. Partially missing data are supplemented by the corresponding statistical yearbooks of individual cities.
3 Results and Analysis
3.1 Overall Network Characteristics and Evolution Trend
3.1.1 Spatial Correlation Network of Urban Water Consumption
According to the modified gravity model, we establish a spatial correlation network of urban water consumption in the YRDUA. Then, we use the visualization tool NetDraw to draw the water network map for 2020. Figure 3 shows the structure and form of the spatial network. In the network, nodes represent the 26 cities within the YRDUA, and arcs represent the water connections among the regions. The complex and multi-threaded spatial correlation network structure indicates that there are relationships among neighbouring and nonadjacent regions in terms of water affairs. Moreover, there is no isolated node in the network, indicating that a significant correlation exists between all urban water use in the YRDUA. Thus, we need to manage water affairs from a global perspective. Figure 3 also indicates that Shanghai, Suzhou, Wuxi, and Hangzhou are in the centre of the network.
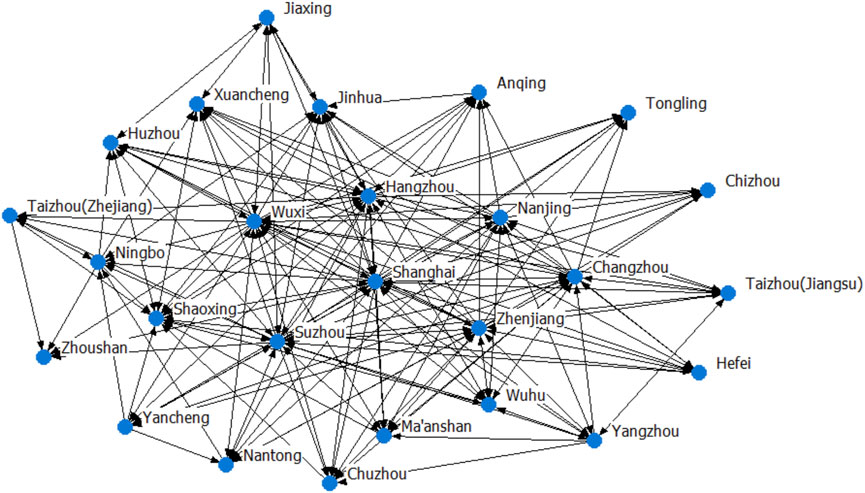
FIGURE 3. Water consumption spatial correlation network of the YRDUA in 2020.
3.1.2 Characteristics and Evolution Trend of the Water Network
This study compared the water network’s average distance and distance-based cohesiveness between 2001 and 2020 (Table 2). The average distance between network nodes decreased from 1.85 in 2001 to 1.71 in 2020, slightly fluctuating around 2011. While the distance-based cohesiveness of the whole network increased from 0.56 to 0.65, meaning an overall upward trend of correlations between urban water use. The average distance of the urban water network was below 2, indicating that any node in the network can gain access to another node through at least 2 nodes.
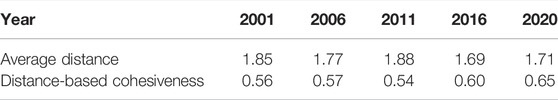
TABLE 2. Distance and cohesiveness of the water network in the YRDUA.
This study calculated the affinity, density, efficiency, and hierarchy of the urban water spatial correlation network in the YRDUA from 2001 to 2020, as shown in Figure 4. Figure 4A indicates that both the network affinity and the network density show a noticeable general upward trend, while there are also apparent fluctuations. The former raised from 0.32 in 2001 to 0.35 in 2020, and the latter increased from 210 to 228. These two growths mean the relationships of inter-urban water consumption in the YRDUA have been getting closer during the past 2 decades. However, the network affinity and density experienced an apparent downward between 2006 and 2008, while total water consumption increased. It suggests that there may be a negative correlation between regional water use constraints and cross-regional water affairs interactions. The stricter the water use restricts, the closer urban water affairs correlations (Olawuyi, 2020). The current water network density is very low. The potential connections of the urban water network are 650 (26 × 25), while the maximum network affinity was only 228 and was not even half of the total. There is still much room for improvement in the collaborative management of water affairs in the YRDUA. However, the redundant connections will increase with the rising network density. When the network’s actual links exceed the threshold, the transaction cost of water affairs information among cities will increase, reducing the overflow efficiency (Peng et al., 2020).
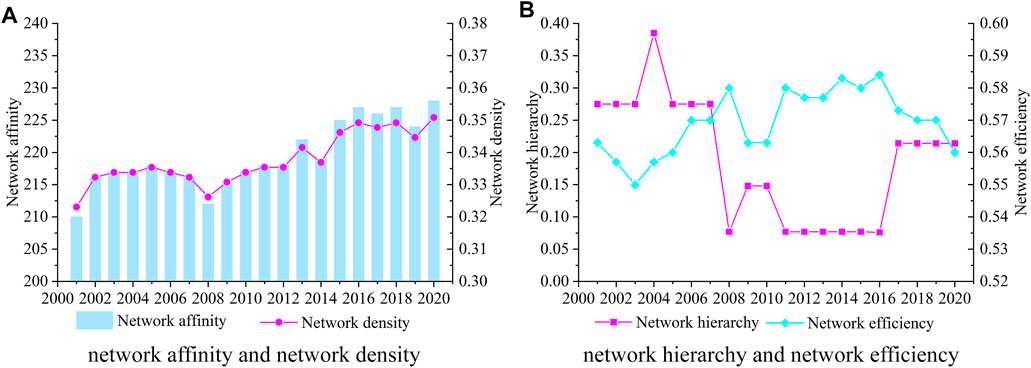
FIGURE 4. Overall network characteristics of the water network in the YRDUA. (A) network affinity and network density. (B) network hierarchy and network efficiency.
The network hierarchy decreased from 0.275 in 2001 to 0.076 in 2016 and then increased to 0.214 in 2020, showing an overall step-down trend during the whole investigation period (Figure 4B). Decreasing network hierarchy suggests that the cross-regional interaction and mutual influence in water affairs are gradually being enhanced in the YRDUA. In recent years, the network hierarchy has been stable with a value of 0.214, indicating that the water network structure is relatively steady. The network efficiency experienced the process of rising first and then falling, which had a reverse trend compared with hierarchy. Thus, breaking a rigid hierarchy structure would generate more spatial overflow channels among cities and create more opportunities for collaboration and regulation in regional water affairs. As mentioned above, with the continuous growth of network density, the network efficiency may be negatively affected. Before 2016, the efficiency and density of the urban water network generally moved in the same direction. After 2016, the efficiency and density of the urban water network changed in the opposite direction. Declining network efficiency means that the dissemination of information and technology for urban water utilization went down in recent years.
3.2 Individual Characteristics of Urban Water Network
This study selects degree centrality, betweenness centrality, and closeness centrality to reveal the status and role of each city in the network of urban water consumption, detecting the spatial correlation between urban water use furtherly. Because of the minor change in the three indices during the research period, the calculation result in 2020 is used as an example. The detailed results can be found in Supplementary Material.
3.2.1 Degree Centrality Analysis
Figure 5A reflects the degree centrality of each city in the water consumption spatial correlation network. The average degree centrality of the whole network is 34.92, which is expressed by the blue line in Figure 5A. Eight cities’ degree centrality exceeded the average value, including Shanghai, Wuxi, Suzhou, Hangzhou, Nanjing, Changzhou, Zhenjiang, and Shaoxing. According to the definition of degree centrality in Table 1, cities with a higher degree centrality get more connections with other regions in water affairs. Cities in Anhui provinces, such as Chizhou, Anqing, Tongling, Xuancheng, and Chuzhou, have low degree centrality and are marginal position in the whole network.
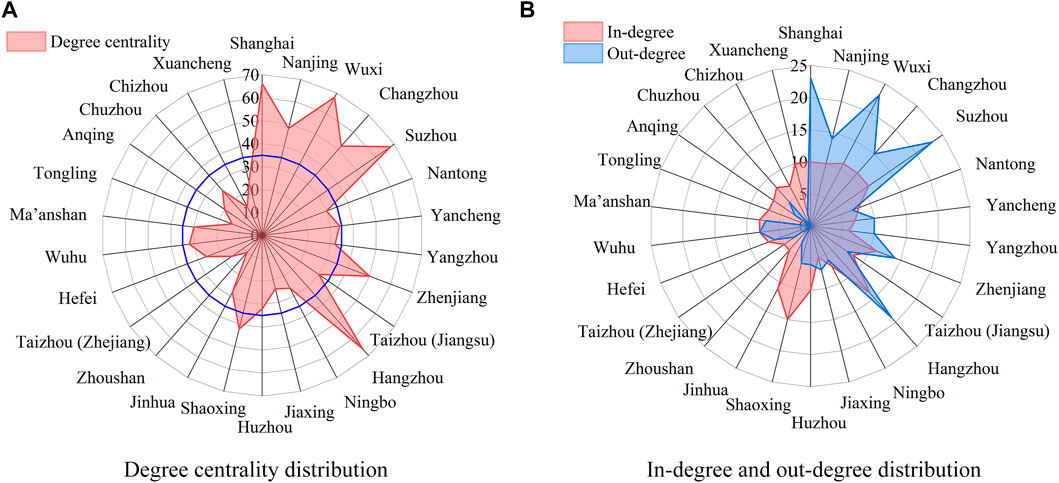
FIGURE 5. Degree centrality of the water network in the YRDUA. (A) Degree centrality distribution (B) In-degree and out-degree distribution.
The degree centrality of a node in a network can be decomposed into in-degree and out-degree, reflecting the node’s capability of overflowing and receiving information. Figure 5B shows the distribution of in-degree and out-degree of each city in the water network. The top-ranking cities with the highest out-degree were Shanghai, Wuxi, and Suzhou, with more than 20 out-degrees than other cities. These cities would have more impact on water affairs in the rest of the YRDUA than the rest of the cities have on them. The top-ranking cities with the highest in-degree are Shaoxing and Hangzhou, indicating that water affairs in these cities are affected mainly by other cities. Besides, the gap in in-degree between cities is not significant with a relatively reasonable distribution, while the gap in out-degree is rather large with a seriously unbalanced distribution. It means that cities in the YRDUA have high openness and tend to receive the spillover effects from others. Due to differences in development levels, there are apparent differences in cities’ ability to influence others’ water affairs in the network.
3.2.2 Betweenness Centrality and Closeness Centrality Analysis
The high betweenness centrality of one city represents its crucial position in water information and technology delivery, meaning its significant effect throughout the entire water network. The average value of betweenness centrality is 2.18, expressed by the blue line in Figure 6A. Eight cities exceeded the average betweenness centrality, containing Shanghai, Wuxi, Suzhou, Hangzhou, Nanjing, Changzhou, Zhenjiang, and Shaoxing. The top three cities all have betweenness centrality values above 10, indicating that water affairs interaction routes controlled by these three cities consist of more than ten nodes. They play the role of a “bridge” in the urban water network (Peng et al., 2020). Except for Shanghai, most of the cities with high betweenness centrality are located in Jiangsu province, implying the dominating role of Jiangsu as the intermediary function. In Anhui, the small-scale economy and amount of water demand restrict their capacity to affect other cities in terms of water affairs, thus weakening their function in the entire network. Generally, interactions of water affairs among cities with low betweenness centrality are achieved via bridge nodes such as Wuxi and Suzhou.
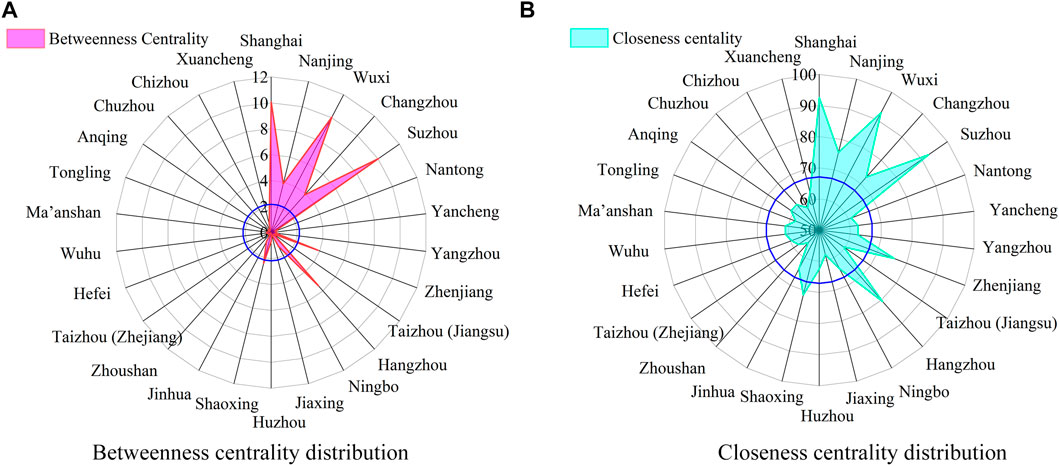
FIGURE 6. Betweenness centrality and closeness centrality of water network in the YRDUA. (A) Betweenness centrality distribution (B) Closeness centrality distribution.
Figure 6B shows that the distribution of closeness centrality is relatively balanced, which means the ability to exchange water information with other cities distribute evenly among the nodes. This phenomenon can be explained by good network connectivity and high network efficiency. Shanghai, Wuxi, and Suzhou are the top three cities scoring high closeness centralities. It indicates that the three cities have a powerful ability to communicate, deliver, and acquire resources related to water affairs, resulting in the higher water transition efficiency between them and other cities. In other words, if the connections related to these three cities are restricted, a great deal of water information flow channels will be cut off, thereby reducing the water flow efficiency throughout the entire network.
3.3 Core-Periphery Structure of Urban Water Network
Generally, a city’s network roles determine its impact on the regional water policy effect. This study introduced the coreness evaluation method to quantify the driving effects of core cities on peripheral cities in the water network.
Table 3 shows the characteristics of the core-periphery structure of the urban water consumption correlation network in the YRDUA. During the research period, the standard deviation of urban coreness decreased first and then increased. It went down from 0.134 in 2001 to 0.111 in 2016 and went up to 0.119 again. Meanwhile, the heterogeneity and the Gini coefficient of the core-periphery structure also experienced similar variation features to the above standard deviation. It indicates that between 2001 and 2016, the spatial distribution of water consumption connections between cities tended to be more balanced, and the gaps in coreness were shrinking; after 2016, this imbalance gradually increased. Especially, the Gini coefficient was still up to a relatively high value of 0.423, implying an uneven coreness distribution between different cities. The spatial correlation network of urban water consumption presents a significant core-peripheral structure.
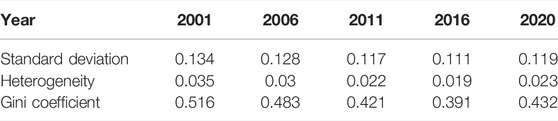
TABLE 3. Statistics in coreness of water network in the YRDUA.
Figure 7 presents the distribution and evolution of the core-peripheral structure of the urban water consumption correlation network. According to the values of coreness, the whole sample is divided into three subgroups: the core cities with coreness greater than 0.3, the semi-core cities with coreness between 0.15 and 0.3, and peripheral cities with coreness lower than 0.15. In the study period, the distributions of the core-peripheral structure were relatively stable, and only several cities experienced a small range of changes. For example, Shanghai and Suzhou have always been core cities. Wuxi and Hangzhou moved into the core area in 2006 and 2011, respectively, while Wuhu and Ma’anshan moved into the semi-core place in 2011 and 2016. The current urban water consumption correlation network has two core areas: Shanghai-Suzhou-Wuxi and Hangzhou. In the YRDUA, Shanghai is the nuclear, Suzhou-Wuxi-Changzhou region and Hangzhou Bay are crucial metropolitan circles. Except for the top four cities, most Jiangsu cities followed, such as Nanjing, Changzhou, and Yangzhou. Specifically, Shanghai, Suzhou, and Wuxi constitute the first core area, surrounded by some semi-core cities in Jiangsu province. The second core area is in Zhejiang province, with Hangzhou dominating the main direction and a change of sub-regional water flow radiating to other cities. Most cities in Anhui province are distributed in peripheral areas with fewer connections associated with other cities in the entire network.

FIGURE 7. Distribution of core-peripheral structure of water network in the YRDUA.
4 Discussion
Water is a crucial resource for production and domestic, developing economic activities and population migration undoubtedly enhance the water affairs correlations among regional cities. In the spatial correlation network of urban water consumption in the YRDUA, no isolated city exists, meaning the water affairs in any city are related to other ones. Network density is a significant structural indicator that reflects the interconnectivity among nodes within social networks (Muller and Peres, 2019). In recent years, the regional water network is becoming more and more stable with increasing density, resulting from a remarkable degree of region collaborative development. Firstly, the YRDUA is located in the south-eastern coastal area of China, noted for flat terrain, favourable climate, and rich natural resources, which provide advantageous conditions for region collaborative development (Ding et al., 2021). Secondly, supportive official policies also play an essential role. With the announcement of “the Belt and Road” initiative and a Yangtze River Economic Belt strategy, the cities’ collaborative correlation in the YRDUA has become closer (Ye et al., 2019). Especially the “Yangtze River Delta Urban Agglomeration Development Plan” issued in 2016 proposed to take advantage of the golden waterway of the Yangtze River, improving the regional transportation network and the capacity of intermodal transport. Thanks to these policies, we are gradually brokering the rigid administrative border and trade barriers, thus leading to many advantages for improving correlations among different cities. For example, regional transportation efficiency is seeing significant improvement, resulting in the flow speed of population and economy, which is helpful for cross-regional exchanges and interactions. The collaborative correlation will lead to a closer and more stable water network.
There is a synergistic and trade-off relationship between network density and network efficiency. Generally, there is a positive relationship between network density and joint action in natural resources governance, and outcomes of collaborative effort benefit from increased tie density (Sandström and Carlsson, 2008). When the connections in the urban water consumption correlation network grow, the flow of vital information on new technologies and more sustainable management practices for urban water use accelerates (Bodin and Crona, 2009). However, the positive effect of network density on natural resource governance does not necessarily continuously increase and may decrease at high densities (Bodin and Crona, 2009). Very high network density can reduce a group’s effectiveness in collective action, and lead to the homogenization of information and knowledge which results in less efficient use of resources and reduction of capacities to adapt to changing conditions (Oh et al., 2004; Bodin and Norberg, 2005). Taking 2016 as the breaking point, we found that the network efficiency first increased and then decreased with the increase of network affinity and density. Before 2016, the network affinity didn’t exceed the capacity of the water network, and the growth of communication between urban water affairs led to effective information transmission. After 2016, the efficiency and density of the urban water network changed in the opposite direction. Excessive network link redundancy affected the speed of information transfer. This phenomenon may be related to increasing water consumption constraints and uneven regional economic development. According to the strictest water resource management (SWRM), each city has explicit water consumption constraints. Since 2011, the total water consumption of the YRDUA has dropped significantly (Figure 2). At the same time, the population and economy in this area have raised rapidly, resulting in enormous water demand. The increasing water supply and demand gaps have affected the efficiency of interaction and cooperation between cities in water affairs. Therefore, we can infer a network density threshold in the spatial correlation network of urban water use in the Yangtze River Delta urban agglomeration.
The centrality analysis results of the water network presented significant polarization. Shanghai, Wuxi, Suzhou, and Hangzhou always occupied the top four positions in the entire water network. The four cities accounted for about 33, 67, and 24% of total degree centrality, Betweenness centrality, and closeness centrality. They are the most developed cities in the YRDUA, gathering plenty of resources and radiating them to other regions (Chen et al., 2019). Shanghai is the largest financial centre in China, providing capital and financial services. Wuxi is a national comprehensive transportation hub, conveniently providing convenient logistics and warehousing services. Suzhou is the national high and new technology industry centre, providing high-tech support. Hangzhou is the global Internet network information centre. Around the core cities, the YRDUA has formed a complete, developed, and adequate network of transportation, talent flow, and information dissemination. Most water affairs interaction should be achieved via these cities, reflecting their vital function in controlling and guiding the channels of spillover and reception related to water usage information. Most of the new economic development policies and reforms implemented in recent years were concentrated in core and central cities, exacerbating the unevenness of centrality distribution in the water network. Regions such as Jiaxing, Huzhou, and Changzhou are close to major economic centres. They tend to receive more substantial radiation effects from core cities (Liao and Wei, 2015), which helps to enhance their correlations with other cities. Cities farther from the core area would have lower centrality and are at the edge of the water network, such as most cities in Anhui provinces. It is apparent that the correlation between urban water consumption is related to economic scale and is also impacted by geographic location. The larger the city’s economic scale is, the more water the city consumes, the more significant gravitational force it has, and the more critical its position in the water network. The water network in the YRDUA has experienced the homogeneous discrete, single-core agglomeration stage. Currently, it is experiencing the multi-core stage, which aligns with the characteristics of the polycentric mega-city region in the YRDUA. The two core areas of the water network, the Shanghai-Wuxi-Suzhou region, and Hangzhou Bay, have formed a stable spatial pattern with other cities, while each node city has its corresponding role. According to the water network structure, it is necessary to exert the brokerage role of Jiangsu province in the whole network as a bridge and transit hub to enhance the water correlations between Anhui province and other cities.
5 Conclusion
Water problems, such as water shortages, water pollution, and water ecosystem deterioration, have put significant pressure on the country’s sustainable development. Urban areas have become influential consumers of water resources and producers of waste and pollution. Urban water consumption is worth paying much more attention to. China has suffered from water problems for a long time. The country focused on regional water conflicts and improving overall water use efficiency. However, current national macro-water policy making and implementation do not fully consider the correlations among region water usage. This study employed the SNA method to investigate the spatial correlation of urban water consumption in the Yangtze River Delta urban agglomeration (YRDUA). According to the results, urban water use in the YRDUA has moved from independent operations to cycle networks. With the increase of network density and closeness, the water network shows remarkable spillover effects between different cities. Shanghai, Wuxi, Suzhou, and Hangzhou are four critical cities of the water network, and they obtain comparatively higher individual centralities. Therefore, it is essential to optimize the improvement of water management in the four regions and exert their radiation effects on other cities.
Water consumption in the YRDUA will continue to increase due to accelerating urbanization and industrialization. The dilemma between rapid growth demand and diminishing water resources will potentially undermine sustainable development in the YRDUA. As the study shows, the water network efficiency has decreased in recent years, and the current network structure will gradually be detrimental to the effective dissemination of water use information. Governments need to create appropriate policies to enhance cooperation and synergy of regional water management. First, since the different urban water affairs have formed into a system, a global spatial network perspective should be emphasized while coordinating regional collaborative water resources management. We need to optimize the structure and improve the efficiency of a regional multi-centre water network. Furthermore, reduce the provincial administrative borders and trade barriers to create more cross-regional water allocation and management channels. For example, the government could formulate strategies to guide the rational flow of water resources across regions and industries and explore more effectively interrelated ways for increasing the number of ties in regional water networks. Besides, the core cities need to set the appropriate objective to reduce water use, enhance water use efficiencies, and control water pollution, which is based on the strictest water resource management (SWRM) system. They also need to develop and apply new water-saving technologies, strengthen water-saving publicity, increase the overflow channels of water-use information, and play the lead role of these core city nodes in the water network.
Data Availability Statement
The original contributions presented in the study are included in the article/Supplementary Material, further inquiries can be directed to the corresponding author.
Author Contributions
JC and TQ conceived of the idea and outlined the brief. YZ calculated the results and wrote the paper. TW, ZW, and JK contributed to data preparation, revision, and drawing. All authors contributed to the article revision and approved the submitted version.
Funding
Research reported in this publication was supported by funding from the National Natural Science Foundation of China (Grant No. 42071278), the Fundamental Research Funds for the Central Universities (Grant No. B210207036), the National Social Science Foundation of China (Grant No. 20BGL191) and the Zijin Cultural Talent Project in Jiangsu Province (Grant NO. PDJPC [2020] No.96).
Conflict of Interest
The authors declare that the research was conducted in the absence of any commercial or financial relationships that could be construed as a potential conflict of interest.
Publisher’s Note
All claims expressed in this article are solely those of the authors and do not necessarily represent those of their affiliated organizations, or those of the publisher, the editors and the reviewers. Any product that may be evaluated in this article, or claim that may be made by its manufacturer, is not guaranteed or endorsed by the publisher.
Acknowledgments
We would like to thank reviewers and the editor-in-charge for valuable time on the article. And we are grateful to all the foundations that support us. We thank Xinhui Wang for her contribution to the data preparation.
Supplementary Material
The Supplementary Material for this article can be found online at: https://www.frontiersin.org/articles/10.3389/fenvs.2022.924246/full#supplementary-material
References
Abildtrup, J., Garcia, S., and Stenger, A. (2013). The Effect of Forest Land Use on the Cost of Drinking Water Supply: A Spatial Econometric Analysis. Ecol. Econ. 92, 126–136. doi:10.1016/j.ecolecon.2013.01.004
Abrahamson, E., and Rosenkopf, L. (1997). Social Network Effects on the Extent of Innovation Diffusion: A Computer Simulation. Organ. Sci. 8 (3), 289–309. doi:10.1287/orsc.8.3.289
Abramo, G., D’Angelo, C. A., and Di Costa, F. (2020). The Role of Geographical Proximity in Knowledge Diffusion, Measured by Citations to Scientific Literature. J. Inf. 14 (1), 101010. doi:10.1016/j.joi.2020.101010
Babuna, P., Yang, X., and Bian, D. (2020). Water Use Inequality and Efficiency Assessments in the Yangtze River Economic Delta of China. Water 12 (6), 1709. doi:10.3390/w12061709
Bao, C., and Fang, C.-l. (2012). Water Resources Flows Related to Urbanization in China: Challenges and Perspectives for Water Management and Urban Development. Water Resour. Manage 26 (2), 531–552. doi:10.1007/s11269-011-9930-y
Bertinelli, L., and Black, D. (2004). Urbanization and Growth. J. Urban Econ. 56 (1), 80–96. doi:10.1016/j.jue.2004.03.003
Bilecen, B., Gamper, M., and Lubbers, M. J. (2018). The Missing Link: Social Network Analysis in Migration and Transnationalism. Soc. Netw. 53, 1–3. doi:10.1016/j.socnet.2017.07.001
Bodin, Ö., and Crona, B. I. (2009). The Role of Social Networks in Natural Resource Governance: What Relational Patterns Make a Difference? Glob. Environ. Change 19 (3), 366–374. doi:10.1016/j.gloenvcha.2009.05.002
Bodin, Ö., and Norberg, J. (2005). Information Network Topologies for Enhanced Local Adaptive Management. Environ. Manag. 35 (2), 175–193. doi:10.1007/s00267-004-0036-7
Borgatti, S. P., Mehra, A., Brass, D. J., and Labianca, G. (2009). Network Analysis in the Social Sciences. Science 323 (2009), 892–895. doi:10.1126/science.1165821
Brelsford, C., and Abbott, J. K. (2017). Growing into Water Conservation? Decomposing the Drivers of Reduced Water Consumption in Las Vegas, NV. Ecol. Econ. 133, 99–110. doi:10.1016/j.ecolecon.2016.10.012
Bu, Y., Wang, E., Bai, J., and Shi, Q. (2020). Spatial Pattern and Driving Factors for Interprovincial Natural Gas Consumption in China: Based on SNA and LMDI. J. Clean. Prod. 263, 121392. doi:10.1016/j.jclepro.2020.121392
Chang, H., Bonnette, M. R., Stoker, P., Crow-Miller, B., and Wentz, E. (2017). Determinants of Single Family Residential Water Use across Scales in Four Western US Cities. Sci. Total Environ. 596-597, 451–464. doi:10.1016/j.scitotenv.2017.03.164
Chen, W., Yenneti, K., Wei, Y. D., Yuan, F., Wu, J., and Gao, J. (2019). Polycentricity in the Yangtze River Delta Urban Agglomeration (YRDUA): More Cohesion or More Disparities? Sustainability 11 (11), 3106. doi:10.3390/su11113106
Cosgrove, W. J., and Loucks, D. P. (2015). Water Management: Current and Future Challenges and Research Directions. Water Resour. Res. 51 (6), 4823–4839. doi:10.1002/2014wr016869
Ding, T., Chen, J., Fang, Z., and Chen, J. (2021). Assessment of Coordinative Relationship between Comprehensive Ecosystem Service and Urbanization: A Case Study of Yangtze River Delta Urban Agglomerations, China. Ecol. Indic. 133, 108454. doi:10.1016/j.ecolind.2021.108454
Dou, P., Zuo, S., Ren, Y., Rodriguez, M. J., and Dai, S. (2021). Refined Water Security Assessment for Sustainable Water Management: A Case Study of 15 Key Cities in the Yangtze River Delta, China. J. Environ. Manag. 290, 112588. doi:10.1016/j.jenvman.2021.112588
Fengting, W., Chang, Y., Lichun, X., and Yuan, C. (2019). How Can Agricultural Water Use Efficiency be Promoted in China? A Spatial-Temporal Analysis. Resour. Conserv. Recycl. 145, 411–418. doi:10.1016/j.resconrec.2019.03.017
Franczyk, J., and Chang, H. (2009). Spatial Analysis of Water Use in Oregon, USA, 1985-2005. Water Resour. Manage 23 (4), 755–774. doi:10.1007/s11269-008-9298-9
Hartmann, D., Bezerra, M., Lodolo, B., and Pinheiro, F. L. (2020). International Trade, Development Traps, and the Core-Periphery Structure of Income Inequality. EconomiA 21 (2), 255–278. doi:10.1016/j.econ.2019.09.001
He, C., Liu, Z., Wu, J., Pan, X., Fang, Z., Li, J., et al. (2021). Future Global Urban Water Scarcity and Potential Solutions. Nat. Commun. 12 (1), 1–11. doi:10.1038/s41467-021-25026-3
Huang, C., Yin, K., Liu, Z., and Cao, T. (2021). Spatial and Temporal Differences in the Green Efficiency of Water Resources in the Yangtze River Economic Belt and Their Influencing Factors. Int. J. Environ. Res. Public Health 18 (6), 3101. doi:10.3390/ijerph18063101
Jiang, Y. (2009). China's Water Scarcity. J. Environ. Manag. 90 (11), 3185–3196. doi:10.1016/j.jenvman.2009.04.016
Jingxue, W., Yalin, L., Huajun, Y., Jianping, G., Wu, S., and Lingna, L. (2021). Estimation and Influencing Factors of Agricultural Water Efficiency in the Yellow River Basin, China. J. Clean. Prod. 308, 127249. doi:10.1016/j.jclepro.2021.127249
Kahouli, B., and Maktouf, S. (2015). The Determinants of FDI and the Impact of the Economic Crisis on the Implementation of RTAs: A Static and Dynamic Gravity Model. Int. Bus. Rev. 24 (3), 518–529. doi:10.1016/j.ibusrev.2014.10.009
Kai, L., Wenrui, L., Jialing, W., Zhongfei, C., Wen, Z., and Fang, L. (2022). Spatial Differences and Influencing Factors of Urban Water Utilization Efficiency in China. Front. Environ. Sci. 10, 890187. doi:10.3389/fenvs.2022.890187
Kharanagh, S. G., Banihabib, M. E., and Javadi, S. (2020). An MCDM-Based Social Network Analysis of Water Governance to Determine Actors' Power in Water-Food-Energy Nexus. J. Hydrology 581, 124382. doi:10.1016/j.jhydrol.2019.124382
Krueger, E. H., Borchardt, D., Jawitz, J. W., Klammler, H., Yang, S., Zischg, J., et al. (2019). Resilience Dynamics of Urban Water Supply Security and Potential of Tipping Points. Earth's Future 7 (10), 1167–1191. doi:10.1029/2019ef001306
Kunz, N. C., Kastelle, T., and Moran, C. J. (2017). Social Network Analysis Reveals that Communication Gaps May Prevent Effective Water Management in the Mining Sector. J. Clean. Prod. 148, 915–922. doi:10.1016/j.jclepro.2017.01.175
Kurian, M., Portney, K. E., Rappold, G., Hannibal, B., and Gebrechorkos, S. H. (2018). “Governance of Water-Energy-Food Nexus: a Social Network Analysis Approach to Understanding Agency Behaviour,” in Managing Water, Soil and Waste Resources to Achieve Sustainable Development Goals (Cham: Springer), 125–147. doi:10.1007/978-3-319-75163-4_6
Lang, Y., Song, W., and Zhang, Y. (2017). Responses of the Water-Yield Ecosystem Service to Climate and Land Use Change in Sancha River Basin, China. Phys. Chem. Earth Parts A/B/C 101, 102–111. doi:10.1016/j.pce.2017.06.003
Li, Z., Zhou, Y., Li, K., Xiao, H., and Cai, Y. (2021). The Spatial Effects of City-Level Water-Energy Nexus: A Case Study of Hebei Province, China. J. Clean. Prod. 310, 127497. doi:10.1016/j.jclepro.2021.127497
Liao, F. H., and Wei, Y. D. (2015). Space, Scale, and Regional Inequality in Provincial China: A Spatial Filtering Approach. Appl. Geogr. 61, 94–104. doi:10.1016/j.apgeog.2014.12.022
Lienert, J., Schnetzer, F., and Ingold, K. (2013). Stakeholder Analysis Combined with Social Network Analysis Provides Fine-Grained Insights into Water Infrastructure Planning Processes. J. Environ. Manag. 125, 134–148. doi:10.1016/j.jenvman.2013.03.052
Lipscomb, M., and Mobarak, A. M. (2016). Decentralization and Pollution Spillovers: Evidence from the Re-drawing of County Borders in Brazil. Rev. Econ. Stud. 84 (1), 464–502. doi:10.1093/restud/rdw023
Liu, G., Yang, Z., Fath, B. D., Shi, L., and Ulgiati, S. (2017). Time and Space Model of Urban Pollution Migration: Economy-Energy-Environment Nexus Network. Appl. Energy 186 (2), 96–114. doi:10.1016/j.apenergy.2016.06.132
Liu, L., and Jensen, M. B. (2018). Green Infrastructure for Sustainable Urban Water Management: Practices of Five Forerunner Cities. Cities 74, 126–133. doi:10.1016/j.cities.2017.11.013
Liu, S., and Xiao, Q. (2021). An Empirical Analysis on Spatial Correlation Investigation of Industrial Carbon Emissions Using SNA-ICE Model. Energy 224, 120183. doi:10.1016/j.energy.2021.120183
Long, K., and Pijanowski, B. C. (2017). Is There a Relationship between Water Scarcity and Water Use Efficiency in China? A National Decadal Assessment across Spatial Scales. Land Use Policy 69, 502–511. doi:10.1016/j.landusepol.2017.09.055
Ma, H., Shi, C., and Chou, N.-T. (2016). China's Water Utilization Efficiency: An Analysis with Environmental Considerations. Sustainability 8 (6), 516. doi:10.3390/su8060516
Muller, E., and Peres, R. (2019). The Effect of Social Networks Structure on Innovation Performance: A Review and Directions for Research. Int. J. Res. Mark. 36 (1), 3–19. doi:10.1016/j.ijresmar.2018.05.003
Munia, H., Guillaume, J. H. A., Mirumachi, N., Porkka, M., Wada, Y., and Kummu, M. (2016). Water Stress in Global Transboundary River Basins: Significance of Upstream Water Use on Downstream Stress. Environ. Res. Lett. 11 (1), 014002. doi:10.1088/1748-9326/11/1/014002
O’Donnell, M., and Berrens, R. P. (2018). Spatial Analysis of Municipal Water Demand: A Panel Data Approach. Appl. Econ. Lett. 25 (16), 1157–1160. doi:10.1080/13504851.2017.1403552
Oh, H., Chung, M.-H., and Labianca, G. (2004). Group Social Capital and Group Effectiveness: The Role of Informal Socializing Ties. Acad. Manag. J. 47 (6), 860–875. doi:10.5465/20159627
Oki, T., and Kanae, S. (2006). Global Hydrological Cycles and World Water Resources. Science 313 (5790), 1068–1072. doi:10.1126/science.1128845
Olawuyi, D. (2020). Sustainable Development and the Water-Energy-Food Nexus: Legal Challenges and Emerging Solutions. Environ. Sci. Policy 103, 1–9. doi:10.1016/j.envsci.2019.10.009
Pappalardo, L., Rinzivillo, S., and Simini, F. (2016). Human Mobility Modelling: Exploration and Preferential Return Meet the Gravity Model. Procedia Comput. Sci. 83, 934–939. doi:10.1016/j.procs.2016.04.188
Peng, B., Wang, Y., and Wei, G. (2020). Energy Eco-Efficiency: Is There Any Spatial Correlation between Different Regions? Energy Policy 140, 111404. doi:10.1016/j.enpol.2020.111404
Pradhan, P., Costa, L., Rybski, D., Lucht, W., and Kropp, J. P. (2017). A Systematic Study of Sustainable Development Goal (SDG) Interactions. Earth's Future 5 (11), 1169–1179. doi:10.1002/2017ef000632
Rombach, P., Porter, M. A., Fowler, J. H., and Mucha, P. J. (2017). Core-Periphery Structure in Networks (Revisited). SIAM Rev. 59 (3), 619–646. doi:10.1137/17m1130046
Ruzol, C., Banzon-Cabanilla, D., Ancog, R., and Peralta, E. (2017). Understanding Water Pollution Management: Evidence and Insights from Incorporating Cultural Theory in Social Network Analysis. Glob. Environ. Change 45, 183–193. doi:10.1016/j.gloenvcha.2017.06.009
Sandström, A., and Carlsson, L. (2008). The Performance of Policy Networks: The Relation between Network Structure and Network Performance. Policy Stud. J. 36 (4), 497–524. doi:10.1111/j.1541-0072.2008.00281.x
Shi, C., Li, L., Chiu, Y.-H., Pang, Q., and Zeng, X. (2022). Spatial Differentiation of Agricultural Water Resource Utilization Efficiency in the Yangtze River Economic Belt under Changing Environment. J. Clean. Prod. 346, 131200. doi:10.1016/j.jclepro.2022.131200
Sohn, J. (2011). Watering Cities: Spatial Analysis of Urban Water Use in the Southeastern United States. J. Environ. Plan. Manag. 54 (10), 1351–1371. doi:10.1080/09640568.2011.575188
Srinivasan, V., Seto, K. C., Emerson, R., and Gorelick, S. M. (2013). The Impact of Urbanization on Water Vulnerability: A Coupled Human-Environment System Approach for Chennai, India. Glob. Environ. Change 23 (1), 229–239. doi:10.1016/j.gloenvcha.2012.10.002
Wang, F., Yu, C., Xiong, L., and Chang, Y. (2019). How Can Agricultural Water Use Efficiency Be Promoted in China? A Spatial-Temporal Analysis. Resour. Conserv. Recycl. 145, 411–418. doi:10.1016/j.resconrec.2019.03.017
Wang, X.-J., Zhang, J.-Y., Gao, J., Shahid, S., Xia, X.-H., Geng, Z., et al. (2018). The New Concept of Water Resources Management in China: Ensuring Water Security in Changing Environment. Environ. Dev. Sustain 20 (2), 897–909. doi:10.1007/s10668-017-9918-8
Ye, C., Zhu, J., Li, S., Yang, S., and Chen, M. (2019). Assessment and Analysis of Regional Economic Collaborative Development within an Urban Agglomeration: Yangtze River Delta as a Case Study. Habitat Int. 83, 20–29. doi:10.1016/j.habitatint.2018.10.010
Zhi, Y., Zhang, F., Wang, H., Qin, T., Tong, J., Wang, T., et al. (2022). Agricultural Water Use Efficiency: Is There Any Spatial Correlation between Different Regions? Land 11 (1), 77. doi:10.3390/land11010077
Zhou, K., Wu, J., and Liu, H. (2021). Spatiotemporal Variations and Determinants of Water Pollutant Discharge in the Yangtze River Economic Belt, China: A Spatial Econometric Analysis. Environ. Pollut. 271, 116320. doi:10.1016/j.envpol.2020.116320
Keywords: water network, spatial overflow, social network analysis, Yangtze River Delta, China
Citation: Zhi Y, Chen J, Qin T, Wang T, Wang Z and Kang J (2022) Spatial Correlation Network of Water Use in the Yangtze River Delta Urban Agglomeration, China. Front. Environ. Sci. 10:924246. doi: 10.3389/fenvs.2022.924246
Received: 20 April 2022; Accepted: 16 May 2022;
Published: 03 June 2022.
Edited by:
Xudong Zhou, The University of Tokyo, JapanCopyright © 2022 Zhi, Chen, Qin, Wang, Wang and Kang. This is an open-access article distributed under the terms of the Creative Commons Attribution License (CC BY). The use, distribution or reproduction in other forums is permitted, provided the original author(s) and the copyright owner(s) are credited and that the original publication in this journal is cited, in accordance with accepted academic practice. No use, distribution or reproduction is permitted which does not comply with these terms.
*Correspondence: Junfei Chen, Y2hlbmp1bmZlaUBoaHUuZWR1LmNu