Abstract
Due to a lack of plausible kinetic modeling for contaminant attenuation, this study first proposed a “bi-exponential disposition” model to demonstrate the feasibility of wide-ranging applications for the biotic and abiotic degradation of pollutant(s). As a consequence of under-determined systems of bisphenol A (BPA) degradation via advanced oxidation processes (AOPs), a previous study proposed asymptotic approximation singular perturbation for kinetic modeling. The present study extended this model to provide the key performance indicator (KPI); namely, the area under the time course (AUC) of pollutant concentrations from time zero to the endpoint (i.e., ), quantitatively revealing the most promising strategy for pollutant (bio)degradation. Compared to the typical KPI (percentage of pollutant removal), AUC better illustrated the overall efficiency. Compartmental modeling predicted maximal pollutant mitigation through optimal schemes of operation for global optimization. The feasibility of adopting AUC for system prediction was confirmed in cases of azo and anthraquinone dye biodecolorization and acetaminophen (APAP), glyphosate, and bisphenol A (BPA) degradation. Regarding azo dye biodecolorization, the AUC and SDRmax indicated the need to consider cell concentrations. Compartment kinetics could be used for the serial acclimation of anthraquinone dye removal. Moreover, compartmental assessment upon glyphosate and acetaminophen abiotic degradation was also feasible for further applications. To minimize the AUC for optimal degradation of , the maximal forward rate constants k1 and k2 and minimal backward rate constant k3 should be satisfied simultaneously. Thus, this AUC approach might be broadened to demonstrate overall optimization via Pontryagin’s maximum principle.
1 Introduction
Although the degradation of environmental pollutants is important for environmental protection in the context of green sustainability, different biological or abiotic catalysts have been proposed for reaction-efficient decontamination. To maximize pollutant-degrading performance for cost-effective and system-appealing operation, kinetic modeling is required for system optimization. Bi-exponential models on pollutant remediation or product production generally suggest that pollutants degrade to two subcompartments, with one compartment degrading (or producing) faster than the other (Shu, 1961). For example, if pollutant degradation follows bi-exponential characteristics, the kinetics require the sampled compartment (compartment 1) to reversibly transfer the target pollutant to another compartment (compartment 2), with one or both compartments giving rise to predominant pathways. However, the detailed mechanism(s) describing this behavior remain unelucidated, leading to difficulties in concluding the overall optimization of an operation system. Moreover, from a kinetic perspective, abiotic and biotic pollutant degradation could be considered as consecutive unimolecular type first-order reactions, such as with reversible reactions, where A and B indicate the target pollutant (TP) and evolved intermediate, respectively. The system equations described as non-zero square 2 × 2 matrix could be given as A X = λX, where A is a given 2 × 2 square matrix , the eigenvalue λ as an unknown scalar, and X is an unknown matrix . Thus, the eigenvalues of the system equations could be determined by the characteristic equation via the determinant |A-λI| = 0. Then, the eigenvalues and satisfy the criteriaFor non-trivial solutions of (A-λI) X = 0, the determinant |A-λI| = 0 must be satisfied.
That is,where
Due to the presence of the two eigenvalues and , a bi-exponential model to exhibit the characteristics of TP degradation is appropriate with these two parameters. This model provided solutions for the inner (i.e., the region of rapidly changing solutions) and outer layer (i.e., the domain of the slowly altered solutions) layers. That is, this model suggested that the pollutant degrades to two subcompartments with one compartment degrading faster than the other. The pollutant decontamination in each subcompartment is thus presented through autonomous differential equations. The sum of the two subcompartments is equal to the breakdown intermediate(s) or follow-up product(s).
According to practice in environmental engineering (Ghanbari and Moradi, 2017; Silva-Rackov et al., 2017), the efficiency of pollutant degradation is usually determined as the percentage of residual pollutant at a specific end-time (tf) of treatment. However, the use of a single endpoint characteristic to represent the overall performance without considering the transient dynamics does not precisely indicate the degradation performance (i.e., KPI = , very likely leading to a failed prediction of the operation efficiency. Therefore, novel two-compartment modeling was adopted to describe the overall system efficiency by analyzing the transient dynamics of pollutant (bio)degradation.
As shown in R7.5, Figure A, B in Fogler (2006), the pharmacokinetics models of drug delivery for medication could also be described as differential equations as follows:The solution would be typical bi-exponential response curves as follows:That is, the form of is a typical characteristic of bi-exponential dispositions.
As the equation shows, the process of drug metabolism can be classified into two phases: α and β. Phase α is the stage during which the drug is rapidly metabolized (i.e., the “inner layer”), while phase β is the second stage, in which the drug is metabolized slowly to elimination (i.e., the “outer layer”). Theoretically, the ideal model of drug therapy follows a mono-exponential model (i.e., ) as drugs are assumed to be eradicated from the body at a rate directly proportional to the amount present (Farlow, 2006). This model also postulates that drug elimination in the human body occurs in the absence of any mass transfer resistance. However, the kinetics of drug metabolism in the human gastrointestinal tract are categorized into two compartments, perhaps due to the inevitable mass-diffusion limited phenomena (e.g., two fractional order differential equations) (Petráš and Magin, 2011; Świętaszczyk and Jødal, 2019). Moreover, Chen et al. (2020) described an innovative approach of asymptotic singular perturbation to propose a plausible rationale for kinetic modeling (e.g., some criteria to inhibit the “vanishing exponential”- k3 dominance of operation failure) in advanced oxidation processes (AOPs) for oxidation-dominant treatment. This work completely modified the “two-compartment model” (or bi-exponential disposition), as described by Baker (2014), to illustrate adequate reaction kinetics and adopt inner and outer approximations of “boundary layer analysis” for system optimization (Murdock, 1991; Nayfeh 1993; Logan, 2006). Mathematical formulations to describe the exponential function or various combinations have been proposed in the physical, biological, and social sciences (Banks 1994). However, the lack of detailed discussion on reaction mechanisms has led to difficulties in evaluating system operation. That is, this 2 × 2 system of differential equations with two solutions and with two eigenvalues and could be kinetically favorable for model representation. For example, in the case of bisphenol A (BPA) as a target pollutant (TP), combinations of exponential functions could be reasonably applied to exhibit the transient dynamics of BPA degradation (Chen et al., 2020).
According to the US EPA (2010), BPA is a reproductive and developmental toxicant. For example, doses of >50 mg/kg-bw/day delayed puberty in male and female rats. Moreover, doses of >235 mg/kg-bw/day resulted in reduced fetal or birth weights or, delayed growth early in life, and negative effects on the testis of male rats. At > 500 mg/kg-bw/day, decreased fertility in mice, altered estrous cycling in female rats, and reduced fetus survival may occur. In addition, the ecological risk assessment of BPA has been evaluated using at least three different models by the European Union (EC), Canada, and Japan (Guo al., 2015). A novel low-dose (ca. 1.75 µg/L) study in Canada (Lahnsteiner et al., 2005) reported reduced sperm quality and delayed ovulation in brown trout. Other toxicological effects (e.g., intersex induction - testes-ova in males and females), decreased spermatogenesis, induction of vitellogenin, delayed or stopped ovulation, or histological liver changes) were also observed in hazard evaluations in the EU and Japan. These findings identified BPA as a top-priority contaminant requiring effective attenuation. Therefore, precise kinetic modeling for BPA degradation was also required.
With a single dose of BPA for treatment, the process of degradation should be separated into (I) the α phase (fast), in which sufficient radicals are provided for the adequate attenuation of BPA alone and (II) the β phase (slow), in which radicals are used for the degradation of progressively decreased BPA and gradually increased intermediates.
The present study extended the approach of asymptotic singular perturbation to combine it with “the area under the concentration-time curve” (AUC) for the wide-range evaluation of pollutant-degrading efficiency. The use of AUC as the overall KPI to assess the transient dynamics of residual contaminants allows quantitative determination of the optimal efficiency of pollutant treatment, thus demonstrating optimal remediation at a global scale. That is, the minimization of AUC suggests stable maintenance of the most favorable pollutant-degrading capability for long-term operation. This study demonstrated that bi-exponential modeling could be applied to show the transient characteristics of pollutant (bio)decontamination (e.g., azo dye-reactive red 22 (Chen, 2002), bisphenol A (BPA; Chen al., 2020), anthraquinone dyes, glyphosate, acetaminophen), showing the global optimization of abiotic and/or biological treatment of TP(s). Thus, these results suggest the optimal operation strategy and criteria for further applications of new (bio)materials and/or system designs for economically feasible pollutant degradation.
2 Materials and Methods
2.1 Model Formulation
To evaluate the performance of pollutant (bio)degradation, the bi-exponential disposition function was applied to depict two phases (i.e., α and β) of target pollutant (TP) elimination through a two-compartment model. The relative concentration of TP (i.e., y(t) = [A]/[A]0) significantly declined in the initial rapid-decay phase (i.e., α phase) (ca. t < 1 h). Then, due to the parallel degradation of both TP(s) and the accumulation of derived intermediates (Chen, 2002, Wu al., 2019), the slower decay of TP degradation (β phase) predominated through shifting from the first to the second compartment. During the β phase, TP concentration slowly declined due to the consumption of more degradable chemical species and the accumulation of recalcitrant compositions (i.e., progressively decreased TP(s) and gradually increased intermediates). Defining A, B, and C as TP, main degraded/oxidized intermediates, and mineralized product(s), respectively, the consecutive unimolecular type first-order reactions of degradation can be written as follows [refer to the kinetics of feedback repression for BPA oxidation; in (Chen et al., 2020)]:The state equations can be formulated with the constraint of mass balance to determine as follows:where the relative concentrations of A, B, and C at specific times are defined as , respectively, and [A]0 is the initial concentration (IC) of TP at time zero. A Laplace transform of A(t) and B(t) to , respectively, results in the followingwhere the relationships of these two real roots areandAt sufficient time duration, a nearly constant ratio of is obtained. The hybrid rate constantscan also be determined as follows:
Like the concept of residence time distribution (RTD), the following secondary parameters adopted from non-compartmental analysis could be determined from the model-evaluated parameters as shown below:
1) Area under the concentration-time curve (AUC) (or area under the C curve):
2) Area under the first moment curve (AUMC):
3) Mean residence time (MRT) (or mean of the C curve):
Furthermore, to evaluate the performance of the two-compartment model for the appropriate operation of dye decolorization, the bi-exponential disposition function was adopted to depict two phases (i.e., α phase and β phase) of dye elimination. With A, B, and C defined as TP (dye), main degraded intermediates, and mineralized product(s), respectively, the first-order reactions of dye decolorization could be written as follows (Zhang et al., 2012):The state equations can be formulated with the constraint of mass balance () to determine as follows:The solutions of the above-mentioned system ODEs could thus be obtained as follows:
Here, if all dye-derived concentrations (i.e., TP = dye) were based on the spectrophotometric absorbance at a specific wavelength , the time courses of the overall “concentrations” would be expressed by the following equation
Postulating that the ratio of absorbance of the TP dye and amine intermediates was a constant k, the overall absorbance could be elucidated as follows:
This analysis also demonstrated that the bi-exponential disposition characteristics of the “two-compartment model” could be reasonably applied to this dye-degrading system as follows:Where denoted a dimensionless concentration. Therefore, the PI of pollutant degradation (AUC) could be obtained as follows:
For the best degradation, the AUC value should be minimized to clearly illustrate the optimal operation strategy in the overall response. The AUC is the definite integral of such transient dynamics that describe the variation of residual TP in the reacting vessel from time zero to infinity. This depends upon the rate of TP degradation and the TP concentration. The AUC also reflects the degree of residual TP exposure following treatment of such pollutant from the beginning to infinity (Gabrielsson and Weiner, 2012). Meanwhile, the corresponding area under the first moment curve from time zero to infinity was defined as AUMC. In addition, MRT theoretically defines the average time a TP molecule spent in the reacting vessel.
2.2 Rate Constant Determination for Bi-Exponential Models
Two steps of semilogarithmic plots were used to determine the “hybrid” constants () of the compartmental kinetics for Y = (), including two first-order processes of rate constants (Kumar et al., 2020). Regarding the bi-exponential profiles of decline, C1 and C2 are macro-constants and α and β correspond to the initial and terminal slopes, respectively. By convention, assuming that , a plot of y versus time on semi-logarithmic paper was first made. The negative slope of the log-linear terminal phase could be assigned the rate constant and the intercept could be extrapolated to obtain Second, a linear regression of versus time was implemented, with its negative slope indicating the rate constant
3. Results and Discussion
3.1 Compartmental Kinetics of Dye Bioremediation
As a prior study (Murdock, 1991) indicated, due to the lack of information on the transient dynamics of oxidized intermediates and reacting radicals, solving such under-determined systems required the introduction of “singular perturbation approximation” to elucidate the feasibility of the compartmental analysis of BPA oxidation via AOPs (Chen et al., 2020). This method selected the minimization of the AUC as the KPI to suggest possible operating strategies and conditions for maximal degradation efficiency. This model was also adopted to determine whether serial acclimation upon dye-degrading mixed consortia for the most effective dye decolorization was ecologically stable and environmentally feasible within the criteria of minimal AUC. As examples supporting the bi-exponential model for pollutant degradation, prior studies (Chen, 2002; Kumar et al., 2020) were chosen to quantitatively evaluate the wide-ranged feasibility of this minimal AUC for system optimization.
Using azo dye-decolorizing data in
Chen (2002)for comparative assessment, both the rankings of AUC (
Figure 1;
Table 1) and maximal specific decolorization rate (SDR
max) (in decreasing order) at different concentrations (mg L
−1) were determined, as follows:
1) AUCs (unit: h) at different dye concentrations (mg L−1) were rated as follows: 61 (4.196 h) > 106 (3.345 h) > 145 (3.190 h) > 205 (2.762 h) > 293 (2.551 h) > 353 (2.434 h);
2) SDRmax (unit: mg L−1 h−1 ODU−1) at different dye concentrations could be ordered: 293 (∼30) > 205 (∼23) > 353 (∼22.5) > 145 (∼21) > 106 (∼15) > 61 (∼6).
FIGURE 1
TABLE 1
| Initial concentration C0 (mg L−1) | Kinetic parameter | KPI | |||
|---|---|---|---|---|---|
| C1 (−) | k1 (h−1) | C2 (−) | k2 (h−1) | AUC(h) | |
| 353 | 0.858 | 0.466 | 0.142 | 0.240 | 2.434 |
| 293 | 0.925 | 0.514 | 0.075 | 0.100 | 2.551 |
| 205 | 0.922 | 0.480 | 0.078 | 0.093 | 2.762 |
| 245 | 0.928 | 0.445 | 0.072 | 0.065 | 3.190 |
| 106 | 0.931 | 0.408 | 0.069 | 0.065 | 3.345 |
| 61 | 0.843 | 0.291 | 0.157 | 0.121 | 4.196 |
Predicted kinetic parameters of bi-exponential models for reactive red 22 dye decolorizationa.
Data adopted from Chen (2002)
Comparisons of both rankings showed that in the range of 61–293 mg L−1, the AUC values decreased nearly in parallel to the gradually increasing SDRmax. However, at 353 mg L−1, some inconsistencies required further elucidation for clarification. As shown in Chen (2002), at 61–293 mg L−1, the specific growth rate increased with increased dye concentration. The AUC values also followed in a decreasing manner. This inconsistency was likely due to a lack of consideration of the effect of cell population density. The SDR and AUC terms were defined as follows:
As SDR was defined upon a per “capita” basis of cell concentration, the slight irregularity at a dye concentration of 353 mg L−1 (i.e., ∼OD600 = 1.85 ca. 10% higher than OD600∼1.7 at 293 mg L−1) was due to the cell population density-dependent phenomena of dye biodegradation. This led to some deviation from the predicted response. According to biochemical engineering, if pollutant degradation was growth-associated, using the AUC approach to evaluate the efficiency of pollutant degradation required moderate modification due to the effects of cell concentration. Hence, the AUC method was more appropriate for non-growth-related biodegradation/bioproduction.
Unexpectedly, this compartmental model with AUC scrutiny quantitatively demonstrated not only the definite efficiency of dye biodegradation but also a delayed response to inhibitory potency at different dye concentrations, as shown in Figure 1. The ranking of delay response time (h) of biodecolorization was 353 mg L−1 (t1 = 5.45 h) > 293 mg L−1 (t2 = 3.25 h) > 205 mg L−1 (t3 = 2.50 h) > 145 mg L−1 (t4 = 2.25 h) > 106 mg L−1 (t5 = 1.05 h) > 61 mg L−1 (t6∼0 h). Thus, higher dye concentrations expressed significantly higher inhibitory potency to metabolically active microbes for the expression of enzymatic activity (e.g., azoreductase, laccase) in color removal.
In addition, the AUC analysis through the compartmental model was also used to quantitatively assess serial acclimation upon anthraquinone dye–degrading mixed consortia for favorable bacterial decolorizers (
Reyes et al., 2021). During the serial domestication process, with selection pressure of exogenous dyes, mixed cultures gradually adapted to evolve bacterial populations to not only resist but also treat such dye-laden environments. To produce well-acclimated bacteria, mixed cultures follow the “survival of the fittest” rule for successful population propagation and dye biodegradation (
Figure 2;
Table 2). As shown in
Table 2, the AUC values progressively decreased with increasing acclimation cycles. The rankings of the area under the concentration-time curve (AUC) (unit: h) in serial acclimation were as follows:
1) AB25: 3.39 (1st) ∼ 3.40 (2nd) > 1.39 (3rd) > 1.22 (4th),
2) RB19: 8.57 (3rd) > 7.74* (2nd) > 6.16 (4th) > 3.36 (5th) > 2.64 (6th),
3) AB40: 3.47 (2nd) > 2.15 (3rd) > 1.36* (1st) > 1.25 (4th).
FIGURE 2
TABLE 2
| Cycle | C1 (−) | k1 (h−1) | C2 (−) | k2 (h−1) | AUC (h) |
|---|---|---|---|---|---|
| (a) AB25 | |||||
| 1st | 0.709 | 0.330 | 0.291 | 0.234 | 3.39 |
| 2nd | 0.597 | 0.352 | 0.403 | 0.237 | 3.40 |
| 3rd | 0.535 | 0.785 | 0.465 | 0.657 | 1.39 |
| 4th | 0.955 | 0.873 | 0.045 | 0.371 | 1.22 |
| (b) RB19 | |||||
| 1st | - | - | - | - | - |
| 2nd | 0.705 | 0.183 | 0.295 | 0.076 | 7.74 |
| 3rd | 0.347 | 0.094 | 0.653 | 0.134 | 8.57 |
| 4th | 0.578 | 0.355 | 0.422 | 0.093 | 6.16 |
| 5th | 0.757 | 0.508 | 0.243 | 0.130 | 3.36 |
| 6th | 0.636 | 0.693 | 0.364 | 0.211 | 2.64 |
| (c) AB40 | |||||
| 1st | 0.949 | 1.135 | 0.051 | 0.097 | 1.36 |
| 2nd | 0.756 | 0.325 | 0.244 | 0.213 | 3.47 |
| 3rd | 0.273 | 0.263 | 0.727 | 0.651 | 2.15 |
| 4th | 0.813 | 1.154 | 0.187 | 0.340 | 1.25 |
Tabulated list of kinetic parameters for the biodecolorization of anthraquinone dyes using the HS consortium: (a) acid blue 25 (AB25); (b) reactive blue 19 (RB19); and (c) acid blue 40 (AB40).
For first and second acclimations (superscript *), the microbial population switched to adapt to dye-stress, leading to slightly fluctuating profiles of color removal (e.g., (b) RB19, (c) AB40 in Figure 2) due to the ecological evolution. Once the consortia predominantly selected superior and eliminated inferior constituents for color removal, the microbial population would favor a switch to cellular metabolism for sufficient expression of dye-degrading activities. This explains why the most ecologically stable decolorizer(s) to attenuate dye burden could be optimally achieved for total survival and maximal degradation, as indicated by the minimization of AUC (Table 2).
3.2 Bi-exponential Characteristics of Abiotic Treatment
A previous study (Chen et al., 2020) reported that abiotic treatment was more appropriate for compartmental modeling in time-course prediction, likely due to the absence of biological interference. For example, regarding AOPs, owing to the reactivity complexity of the diverse radicals and oxidants generated, kinetic modeling to elucidate treatment dynamics was challenging. This essentially led to an inconsistency in the degree of freedom to count the system variables and the equations relating them. This explained why the appropriate kinetic modeling of pollutant degradation for the overall optimization of abiotic systems (e.g., AOPs) was challenging. As mentioned by Chen et al. (2020), “vanishing exponentials” (i.e., ≥1 zero eigenvalues) leading to failure operation should be prevented to maintain stable and effective characteristics of degradation. As a too-steep slope of the α phase implies surplus oxidants to generate overload radical formation, this accumulation and unused radicals would result in immediate and ineffective pollutant degradation. In addition, the rapid generation of degraded intermediate(s) beyond the permissible threshold level would consume most of the radicals and oxidants for pollutant deterioration, resulting in a significant attenuation of the efficiency of BPA degradation (e.g., AUC→∞ for 7 mM PS dose in Table 3). In such over-loading conditions, interactive self-quenching of excessive radicals would antagonistically annihilate their oxidative capabilities, escalating the reduction of BPA-degrading capacity, resulting in further treatment collapse. Hence, the generation of reasonably sufficient levels of radicals (i.e., levels for effective utilization) would be required to guarantee effective BPA-treating capability for optimal treatment. Thus, the most promising characteristics of treatment are as follows: first, the BPA pollutant is instantly and completely dispersed with oxidants/radicals to implement efficient contaminant elimination at a constant concentration-dependent rate (i.e., a first-order rate law) without radical accumulation. Owing to the lack of effective process manipulation for optimal reacting power, the introduction of more compartments (undesired reactions to guarantee more intermediates) for BPA removal (i.e., more rate-determining reaction steps in parallel-and-series degradation) for the oxidation processes (e.g., AOPs) would reduce operation performance. That is, to achieve maximal efficiency of BPA degradation, this study proposes a two-compartment model [or “bi-exponential disposition”; (Notari, 1987; Banks 1994)] for the most appropriate pollutant treatment. In general, this “two-compartment model” could be applied to various practical situations. As there are three possibilities to present wide-ranged reactions-in-series (i.e., R = 2×n-1 = 2×2-1 = 3; R and n denoted the number of rate constants and compartments, respectively) (Wu et al., 2019), they are kinetically “identical” (or indistinguishable) to “bi-exponential loss of target pollutant (e.g., BPA) from the first compartment (i.e., compartment A)” (Notari, 1987), as shown below (k1, k2, k3, and k1’ are reaction rate constants) (Figure 3):
TABLE 3
| Case | C1 | C2 | α | β | k2+k3 (C1β+C2α) | k1+k2+k3(α+α) | k1k2 (αβ) | k1 | k2 | k3 | AUC | MRT | k2/(k2+k3) | k3/(k1k2) |
|---|---|---|---|---|---|---|---|---|---|---|---|---|---|---|
| [Figure 1]a,b | ||||||||||||||
| 100-HCFO/PS | 0.144 | 0.856 | 5.406 | 0.506 | 4.700 | 5.912 | 2.734 | 1.212 | 2.256 | 2.444 | 1.719 | 1.950 | 0.480 | 0.894 |
| 200-HCFO/PS | 0.031 | 0.969 | 4.170 | 3.416 | 4.146 | 7.586 | 14.245 | 3.440 | 4.141 | 0.005 | 0.291 | 0.291 | 0.999 | 0.00035 |
| [Figure 2]a,c | ||||||||||||||
| PS | 0.057 | 0.943 | 3.385 | 0.188 | 3.202 | 3.573 | 0.635 | 0.371 | 1.712 | 1.490 | 5.045 | 5.316 | 0.535 | 2.347 |
| CFO/PS | 0.029 | 0.971 | 3.753 | 0.263 | 3.651 | 4.016 | 0.987 | 0.364 | 2.707 | 0.944 | 3.701 | 3.796 | 0.741 | 0.957 |
| 200-HCFO/PS | 0.031 | 0.969 | 4.170 | 3.416 | 4.146 | 7.586 | 14.245 | 3.440 | 4.141 | 0.005 | 0.291 | 0.291 | 0.999 | 0.00035 |
| 200-HCFO | 0.027 | 0.974 | 1.730 | 0.431 | 1.696 | 2.161 | 0.745 | 0.465 | 1.602 | 0.094 | 2.276 | 2.310 | 0.945 | 0.126 |
| [Figure 3]a,d | ||||||||||||||
| 0 g/L | 0.114 | 0.886 | 3.674 | 0.133 | 3.269 | 3.807 | 0.489 | 0.538 | 0.910 | 2.359 | 6.681 | 7.474 | 0.278 | 4.821 |
| 0.05 g/L | 0.277 | 0.723 | 4.645 | 0.319 | 3.449 | 4.964 | 1.483 | 1.516 | 0.978 | 2.470 | 2.326 | 3.059 | 0.284 | 1.666 |
| 0.3 g/L | 0.128 | 0.872 | 12.10 | 2.821 | 10.92 | 14.92 | 34.13 | 4.006 | 8.521 | 2.394 | 0.320 | 0.346 | 0.781 | 0.070 |
| 0.5 g/L | 0.440 | 0.560 | 5.884 | 2.668 | 4.468 | 8.552 | 15.70 | 4.084 | 3.844 | 0.624 | 0.285 | 0.321 | 0.860 | 0.040 |
| [Figure 4]a,e | ||||||||||||||
| 0 mM | 0.026 | 0.974 | 1.730 | 0.431 | 1.696 | 2.161 | 0.745 | 0.465 | 1.602 | 0.093 | 2.275 | 2.309 | 0.945 | 0.125 |
| 1 mM | 0.361 | 0.639 | 12.63 | 0.090 | 8.101 | 12.72 | 1.142 | 4.620 | 0.247 | 7.854 | 7.095 | 11.02 | 0.031 | 6.876 |
| 5 mM | 0.294 | 0.706 | 26.35 | 2.162 | 19.25 | 28.51 | 56.97 | 9.264 | 6.150 | 13.10 | 0.338 | 0.449 | 0.320 | 0.230 |
| 7 mM | 0.473 | 0.527 | 0.700 | N/A | N/A | N/A | N/A | N/A | N/A |
Comparative list of kinetic parameters of the compartmental model for BPA degradation via AOPs
Experimental data adopted from ref (Chen et al., 2020) (Figures 1–4) and original data from (Wu et al., 2019)).
(PS-present catalyst).
(PS-absent catalyst).
(200-HCFO, dose).
(PS dose).
Bold values indicated k1, k2, k3 and the optimal values of (k3/k1k2).
FIGURE 3
The target pollutant could be either A or B in Figure 3 and interchanged. Thus, the solution of a linear system of differential equations with initial condition could be obtained as (i.e., the matrix form of the multiple exponential disposition). That is, for practical consideration, the general form of two consecutive first-order reactions [i.e., the two-compartment model (A-1)] could be proposed to elucidate the “bi-exponential disposition” type of pollutant degradation, since the two-compartmental treatment was the most appropriate mode of operation for BPA degradation, as reported by Chen et al. (2020). As scheme (A-1) proposed, Eqs 2 and 3 and the AUC could be obtained as follows:
This result suggested that the reverse reaction should be suppressed to achieve the minimal AUC value for optimal treatment. For the critical case (i.e., k1→0), the complete “failure operation” to resist oxidation power for treatment (i.e., AUC< ) should be avoided. That is, to minimize the AUC for maximal BPA degradation, the rate constants of the forward reactions k1 and k2 must be maximized and the backward rate constant k3 should be minimized simultaneously (or sufficiently large k1 and k2 much larger than k3). The greatest lower bound at k3→0 suggested that the most promising case of maximal BPA-degrading efficiency of AOPs would result in the complete repression of the backward reaction (i.e., totally irreversible reactions in series (k3 = 0): ). The necessary condition for the most effective pollutant treatment would be any reaction type or/and mode that triggers a fast rate of TP degradation and prevents a significant accumulation of unreacted radicals. Vanishing exponential [i.e., k2, k3 dominance (k1→0)] of the failure operation and bi-exponential disposition (k3→0) were also possible, as indicated through an asymptotic approximation of singular perturbations (Murdock, 1991). However, to guarantee the operation trajectory following the most promising irreversible reactions in series for maximal BPA degradation, determining the optimal transient dynamics of the intermediates is required. That is, at least one more condition would be required to be solvable, as the degree-of-freedom analysis revealed. Despite the presence of some unspecified conditions, this compartmental analysis still proved a novel approach to confirm that the most appropriate AOPs should have the characteristics of bi-exponential disposition. This also explained why and how the effective kinetics to describe AOPs for system optimization remain for further exploration.
Taking BPA degradation as an example, there are several explanations for why the “single compartment model” (i.e., oxidative degradation in the absence of the second (β) phase) was not technically viable. First, extremely fast BPA degradation without any formation of intermediate(s) was not practically feasible, implying that overcoming the activation energy barrier to reach the transition state for BPA oxidation required the effective degradation of accumulated intermediates. As the collision theory of reaction rates indicated, for a reaction to take place, the reaction particles must effectively and efficiently collide. However, not all collisions between molecules are frequency-sufficient to be reaction-effective. Thus, reactions for successful triggers must satisfy at least three points: 1) the colliding particles must have energy exceeding the activation energy, 2) the particles require correct orientation for effective collisions, and 3) reactive particles (e.g., radicals) may need to be simultaneously generated and reacted without considerable accumulation. Thus, the 𝛽 phase cannot be prevented due to an unavoidable energy barrier between reactants and intermediate(s). Second, the radicals and pollutant BPA cannot be instantly and completely dispersed to “every corner” of the reacting vessel (i.e., homogeneously distributed) to be completely eliminated from the system at a constant concentration-dependent rate. Moreover, as the formation of intermediates and the decrease in BPA would occur simultaneously, reacting radicals and/or oxidants could not be solely consumed for BPA degradation. That is, the concept of a single uniform compartment showing that only BPA effectively collided with oxidants for oxidation was not feasible. These all supported the use of the “bi-exponential disposition” (two compartment) model to describe the kinetic characteristics of BPA degradation.
This bi-exponential model was also applied to acetaminophen degradation with ferrous/copper oxide activated persulfate (Zhang et al., 2018) using AUC as KPI for system analysis Figure 4; Table 4). As the results indicate in Zhang et al. (2018), both predicted AUC and efficiency of degradation were consistent. The most promising was obtained at Fe(II), CuO, and PS concentrations of 0.7 mM, 0.3 g/L, and 0.8 g/L, respectively. The percentage of degradation and AUC were 91% and 34.49 h, respectively. Using minitab for system optimization, the optimal condition to have minimal AUC was at ca. (Fe(II), CuO catalyst, PS)=(1.0 mM, 0.3 g/L, 0.8 g/L) (data not shown). That is, as Zhang et al. (2018) exhibited, the “optimal” conditions were still not overall optimal possibly due to a lack of statistical design of experiments (e.g., Box’s DOEs) and misinterpretation of end-point determination for optimization. However, as Zhang et al. (2018) pointed out, excess Fe(II) load would form abundant to over-consume persulfate ions, attenuating the efficiency of APAP degradation. That is, the mechanism of advanced oxidation under such conditions would differ from expectations, resulting in altered kinetics as well as bi-exponential modeling. The bi-exponential disposition model might require modification (ca. 20% KPI variance) for overall optimization with practical significance.
FIGURE 4
TABLE 4
| Concentration | C1 | α | C2 | β | AUC | |
|---|---|---|---|---|---|---|
| (a)a | 0.3 mM | 0.605 | 0.047 | 0.395 | 0.006 | 123 |
| 0.5 mM | 0.588 | 0.062 | 0.412 | 0.012 | 70.11 | |
| 0.7 mM | 0.847 | 0.091 | 0.153 | 0.007 | 34.49 | |
| 1.0 mM | 0.693 | 0.088 | 0.307 | 0.012 | 43.1 | |
| (b)a | 0.1 g/L | 0.616 | 0.059 | 0.384 | 0.016 | 53.7 |
| 0.2 g/L | 0.628 | 0.064 | 0.372 | 0.016 | 50.22 | |
| 0.3 g/L | 0.847 | 0.091 | 0.153 | 0.007 | 34.49 | |
| (c)a | 0.2 g/L | 0.666 | 0.056 | 0.334 | 0.002 | 252.4 |
| 0.4 g/L | 0.674 | 0.072 | 0.326 | 0.012 | 50.49 | |
| 0.6 g/L | 0.655 | 0.071 | 0.345 | 0.015 | 45.84 | |
| 0.8 g/L | 0.847 | 0.091 | 0.153 | 0.007 | 4.49 |
Comparative list of kinetic parameters for APAP degradation using different concentrations of (A) Fe2+; (B) CuO catalyst; and (C) PS.
Data adopted from Figure 10(a–c) in ref (Zhang et al., 2018).
3.3 Series-and-Parallel Reaction Analysis
Regarding the chemical reaction mechanisms of AOPs, Wu et al. (2019) reported at least three direct routes that acted in parallel to degrade BPA (e.g., oxidation and aromatic ring cleavage; Chen al., 2020). Due to the complication of advanced oxidation (e.g., free radicals, cationic, anionic species), this also raised the question of whether multiple routes of serial reactions in parallel for BPA degradation were thermodynamically or kinetically favorable or appropriate. The competing two-compartmental models for “indistinguishable reacting system” were proposed since the different reaction routes of BPA degradation evolved to have identical mineralized product(s) (e.g., CO2 and H2O) via different routes of intermediate formation. That is, two single-point “elimination” models were not distinguishable due to their identical input-output behaviors (i.e., pollutant BPA and final mineralized products- CO2 and H2O). This concept could also be used to elucidate the transient dynamics of electro-oxidation for glyphosate degradation through AOPs (Kumar et al., 2020). The overall reaction rate of series-and-parallel sequences of the elementary reaction steps (B and B’, denoted rate-controlling intermediates) could be determined by the summation of the rates of the rate-controlling steps, as shown below:
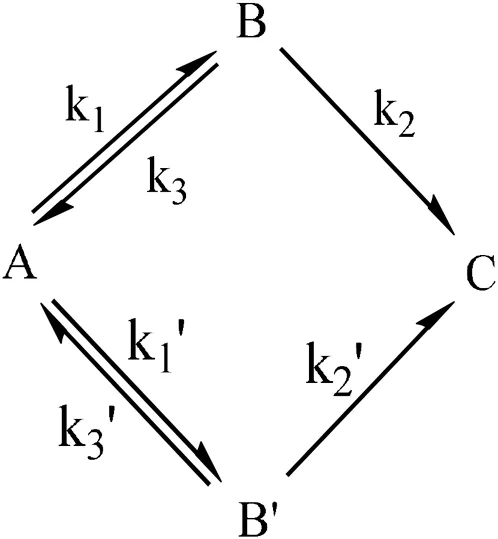
These state equations can be formulated with the constraint of mass balance () as follows:Laplace transform of A(t), B(t), and B’(t) to , respectively, results in the followingwhereInverse Laplace transform of then showsThus, the area under the curve can be obtained as follows:or and to have, where After simplification, one can also obtain
The inequality must be held as indicated afterwards: . The results of this analysis suggested that the performance of employing either only one serial reaction (or ) of BPA degradation was inferior to the operation efficiency via multiple routes of BPA degradation. That is, a newly developed AOP that efficiently generated more intermediates through different reaction routes might provide a more promising treatment for BPA. Regarding the complex mechanisms of BPA oxidation, AOPs provided some sets of chemical-treating procedures for organic degradation in the aqueous phase with the aid of hydroxyl (•OH) and sulfate () radicals, thereby creating additional routes for parallel-and-series reactions as the most reaction-promising to minimize the AUC for maximal performance in BPA degradation. However, sufficient generation of active radicals might be a prerequisite for the creation of more parallel routes for promising degradation. However, according to Wu et al. (2019), the threshold PS levels to prevent radical self-quenching (e.g., ) should be determined for the global optimization of BPA degradation. That is, follow-up studies should identify the keystone route(s) in the mechanism (i.e., either A↔B→C or A↔B’→C) to trigger the largest number of serial reactions in BPA degradation to minimize the AUCΣ for system optimization. In addition, the minimal accumulation of unreacted radicals in the reacting system should be targeted. Regarding the application of Pontryagin’s maximum principle (Ross, 2015), the time-series profiles of various intermediates should be both quantitatively and qualitatively determined to attain overall process optimization (Chen et al., 2020).
3.4 Global Optimization of Pollutant Degradation
As mentioned in Section 3.2, the minimization of compartment number is the most appropriate operation strategy for BPA degradation via AOPs. That is, the bi-exponential type of pollutant degradation is the most promising. Thus, the maximal performance of AOPs for the ideal case (even not practically viable) might be theoretically obtained in the form of mono-exponential decline (i.e., ). Therefore, the operational deviation from such a mono-exponential decline profile should be minimized for the global optimization of AOPs. According to the “two-compartment model” (Eq. 1), the most favorable case of AOPs for BPA degradation should presumably provide an effective strategy to completely degrade BPA before the considerable accumulation of intermediate(s). Hence, for system optimization, the deviation from this “one-compartment model” set as PI: δ(t)= should be minimized (i.e., ; u denoted control variable). A Laplace transform of A(t) for Eq. 1, yieldsTherefore,Then, the inverse Laplace transform of yieldsThus, the area under the curve can be obtained as follows:
The results of this deviation analysis also supported that any strategy seeking sufficiently large forward rate constants k1 and k2 and appropriately small backward rate constant k3 should be globally optimized for pollutant degradation. This analysis clarified some outstanding questions regarding the most favorable interactive synergy to trigger reactions for maximal degradation (Zhang et al., 2018). Meanwhile, as Chen et al. (2020) revealed through asymptotic approximation of singular perturbation, both k1 and k2 dominance are mathematically equivalent (or kinetically indistinguishable) since they were all forward rate constants to manage effective degradation. In contrast, k3 dominance must be prevented as a higher backward reaction rate constant has a stronger capability to resist BPA removal. This study specifically supported that the necessary conditions of minimal k3 and maximal k1 and k2 (i.e., maximal values of α, β) should be satisfied simultaneously to guarantee global optimization for the maximal performance of BPA degradation (i.e., Moreover, k3 dominance would significantly increase the likelihood of a “vanishing exponential” resulting in operation failure (i.e., considerable increases in AUC, AUCδ or α or β→0). As the aforementioned analyses disclosed, k1 and/or k2 dominance would attenuate AUC, resulting in a kinetically promising “bi-exponential disposition.” These results are consistent with previous findings (Chen et al., 2020). Therefore, the optimal operation strategy in the α and β phases should 1) maximize k1 in the α phase as the first superior necessary condition and 2) maximize k2/k3 as a second necessary condition for the maximal performance of BPA degradation. These strategies supported the minimum accumulation of unreacted radicals for AOP optimization. These operation criteria should be followed to guarantee the most efficient and effective methods to clean up pollutants in a reasonably reduced time.
As indicated in Table 3, comparison of data adopted from Figures 1 and 2 in Chen et al. (2020) showing the degrading performance of a variety of cases suggested that 200-HCFO/PS showed more promising degradation for PS-present and PS-absent catalysts due to the smallest AUC (0.291). This promising performance was due to a much smaller k3 value compared to k2 ( and ) and a higher k1 value (3.44). Comparisons of different doses of 200-HCFO and PS catalysts (i.e., data adopted from Figure 3 in Murdock (1991) showed an optimal 200-HCFO dose of 0.5 g L-1 (AUC = 0.285), since k3 was relatively less than k2 ( and ), while k1 (4.08) was also higher. In addition, as shown in Figure 4 in Chen et al. (2020), the suboptimal dose of PS was 5 mM (AUC ≅0.338) due to relatively large k3 (k3 = 13.1, and k1 (9.26) values. As shown, 7 mM was a typical case of failure operation (𝛽≈0). These results all followed the model predictions described previously. Moreover, this analysis clearly explained why the transient dynamics of intermediates might be inevitably required to conclude the overall optimization of AOPs. To decipher the relationships between kinetic parameters and operation variables, sufficient time-series profiles of intermediates should be provided to satisfy solvable conditions through degree-of-freedom analysis (i.e., the equation number equals the number of unknowns). Comparison of the MRTs in Table 3 also showed that MRT minimization was not the appropriate KPI to present cases of optimal BPA degradation. That is, a system with the most effective degradation may not be the fastest treatment operation. In particular, the least amounts of radicals and/or intermediates should be accumulated.
In another example of the feasibility of bi-exponential compartment modeling, Kumar et al. (2020) applied a newly-developed electro-oxidation system for glyphosate degradation. Their simulated results revealed that AUC was strongly correlated with the degradation rate of glyphosate transient dynamics. As shown in Arun et al. (data adopted from Figure 2 in Kumar et al. (2020), the increased degradation rates occurred in parallel with decreases in AUC values. Although different conditions were carried out, bi-exponential decrease and mono-exponential attenuation profiles were observed for low (e.g., % efficiency=C1+(1-C1) at 1.0, 1.5 V) and high (e.g., % efficiency = at 2.0, 2.5 V) applied voltages, respectively. Thus, AUC evaluation still coincided with the degradation efficiency to reveal the optimal treatment conditions. However, possibly due to different reaction conditions for electro-oxidation, why and how the characteristics of glyphosate degradation could result in discrepancies between mono-exponential and bi-exponential profiles remain open to further discussion for system optimization.
4 Conclusion
The results of this study demonstrated the kinetic feasibility of the compartmental model for abiotic and biological treatment of diverse pollutants. These consecutive first-order reaction rate equations for series-and-parallel reactions are very likely applicable due to the unimolecular rate-determining step to address effective contaminant removal. That is, the compartment model was plausible to elucidate the transient dynamics of effective pollutant degradation for later process control and optimization. The target pollutant was solely degraded in the α phase; however, due to the gradual accumulation of inhibitory intermediate(s), the degradation rate progressively decreased. Thus, target pollutant(s) (e.g., dye, BPA, glyphosate, and APAP) were simultaneously disintegrated in the β phase. The results of this analysis also suggested that a kinetically promising strategy of reactions should create multiple routes of reactions to more effectively implement pollutant removal. The existence of one compartment directly reflected one exponential term (or one more rate-controlling “phase”) present in the time course of pollutant degradation. That is, the minimization of the total number of compartments would minimize the number of exponential terms to reach a reactivity-favorable treatment for optimal pollutant removal. In summary, the most appropriate control strategy is to significantly increase the forward rate constants k1 and k2 and considerably decrease the backward rate constant k3 for the complete expression of the maximal performance characteristics of (bio)degradation. In addition, AUC evaluation was more promising than % removal efficiency at specific times (tf) for the assessment of pollutant degradation in environmental engineering.
Statements
Data availability statement
The original contributions presented in the study are included in the article further inquiries can be directed to the corresponding author.
Author contributions
Conceptualization and methodology B-YC, Y-HL, C-CH, and J-MH. Writing original draft: B-YC and Y-HL. Writing, review, editing, and supervision: B-YC.
Funding
The authors sincerely appreciate the financial support provided by the Taiwan Ministry of Science and Technology (109-2221-E-197-016-MY3, and 110-2221-E-197-008).
Acknowledgments
Part of the study was completed as a cooperative achievement for an Academic Exchange Program between Huaqiao University (China) and National I-Lan University (Taiwan) partially supported by Fujian Province’s Minjiang Scholar Expert Lectures by endowed professors (2019–2022).
Conflict of interest
The authors declare that the research was conducted in the absence of any commercial or financial relationships that could be construed as a potential conflict of interest.
Publisher’s note
All claims expressed in this article are solely those of the authors and do not necessarily represent those of their affiliated organizations, or those of the publisher, the editors, and the reviewers. Any product that may be evaluated in this article, or claim that may be made by its manufacturer, is not guaranteed or endorsed by the publisher.
References
1
Baker SDR.M. (2014). “Pharmacokinetic modeling,” in Handbook of anticancer pharmacokinetics and pharmacodynamics (Totowa, NJ: Humanna Press Inc.), 129–137.
2
BanksR. (1994). “Growth and diffusion phenomena,” in Growth and diffusion phenomena (Berlin; New York: Springer-Verlag).
3
ChenB.-Y.WuL.HongJ. (2020). Kinetics of bisphenol a degradation by advanced oxidation processes: Asymptotic approximation of singular perturbation. J. Taiwan Inst. Chem. Eng.109, 90–96. 10.1016/j.jtice.2020.02.004
4
ChenB.-Y. (2002). Understanding decolorization characteristics of reactive azo dyes by Pseudomonas luteola: toxicity and kinetics. Process Biochem.38 (3), 437–446. 10.1016/s0032-9592(02)00151-6
5
FarlowS.J. (2006). “The Laplace transform,” in An introduction to differential equations and their applications (McGraw-Hill), 243–312.
6
FoglerH.S. (2006). Elements of chemical reaction engineering. New Jersey: Prentice-Hall.
7
GabrielssonJ.WeinerD. (2012). “Non-compartmental analysis,” in Computational toxicology (Springer), 377–389.
8
GhanbariF.MoradiM. (2017). Application of peroxymonosulfate and its activation methods for degradation of environmental organic pollutants: Review. Chem. Eng. J.310, 41–62. 10.1016/j.cej.2016.10.064
9
KumarA.ShrivastavaS.VermaN.HsuehC.-C.ChangC.-T.ChenB.-Y. (2020). Electrolyte-free electro-oxidation of aqueous glyphosate: CuPc-ACF electrode and optimization of operating parameters. Process Saf. Environ. Prot.142, 260–271. 10.1016/j.psep.2020.06.022
10
LahnsteinerR.BergerB.KletzlM.WeismannT. (2005). Effect of bisphenol A on maturation and quality of semen and eggs in the brown trout, Salmo trutta f. fario. Aquat. Toxicol75 (3), 213–224.
11
LoganJ.D. (2006). “Perturbation methods,” in Applied mathematics (New York: John Wiley & Sons, Inc. Wiley-Interscience), 85–152.
12
MurdockJ.A. (1991). “Boundary layers,” in Perturbations: Theory and methods (New York: John Wiley & Sons, Inc.Wiley-Interscience.), 417–443.
13
NayfehA.H. (1993). “Boundary-layer problems,” in Introduction to perturbation techniques. 1 ed (Wiley VCH), 257–324.
14
NotariR.E. (1987). “Pharmacokinetics,” in Biopharmaceutics and clinical pharmacokinetics: an introduction. 4 ed (New York and Basel: Marcel Dekker), 45–129.
15
PetrášI.MaginR.L. (2011). Simulation of drug uptake in a two compartmental fractional model for a biological system. Commun. Nonlinear Sci. Numer. Simul.16 (12), 4588–4595. 10.1016/j.cnsns.2011.02.012
16
ReyesK.R.E.TsaiP.-W.TayoL.L.HsuehC.-C.ChenB.-Y. (2021). Biodegradation of anthraquinone dyes: Interactive assessment upon biodecolorization, biosorption and biotoxicity using dual-chamber microbial fuel cells (MFCs). Process Biochem.101, 111–127. 10.1016/j.procbio.2020.11.006
17
RossI.M (2015). A primer on Pontryagin's principle in optimal control. New York. Collegiate publishers.
18
ShuP. (1961). Mathematical models for the product accumulation in microbiolgical processes. Biotechnol. Bioeng.3 (1), 95–109. 10.1002/jbmte.390030111
19
Silva-RackovC.K.AguiarL.G.SouzaA.R.SilvaS.S.CâmaraA.G.ViannaM.M.et al (2017). Remediation of phenanthrene-contaminated soil by persulfate activated with Fe-modified diatomite: kinetic and statistical approaches. Water Air Soil Pollut.228 (8), 271–310. 10.1007/s11270-017-3456-8
20
ŚwiętaszczykC.JødalL. (2019). Derivation and presentation of formulas for drug concentrations in two-three-and four-compartment pharmacokinetic models. J. Pharmacol. Toxicol. Methods100, 106621. 10.1016/j.vascn.2019.106621
21
US EPA (2010). Bisphenol A action plan. Washington, DC: U.S. Environmental Protection Agency
22
WuL.ZhangQ.HongJ.DongZ.WangJ. (2019). Degradation of bisphenol A by persulfate activation via oxygen vacancy-rich CoFe2O4–x. Chemosphere221, 412–422. 10.1016/j.chemosphere.2019.01.049
23
ZhangQ.JingY.H.ShiueA.ChangC.-T.ChenB.-Y.HsuehC.-C. (2012). Deciphering effects of chemical structure on azo dye decolorization/degradation characteristics: Bacterial vs. photocatalytic method. J. Taiwan Inst. Chem. Eng.43 (5), 760–766. 10.1016/j.jtice.2012.03.001
24
ZhangY.ZhangQ.DongZ.HongJ. (2018). Degradation of acetaminophen with ferrous/copperoxide activate persulfate: synergism of iron and copper. Water Res.146, 232–243. 10.1016/j.watres.2018.09.028
Summary
Keywords
Compartmental modeling of pollutant degradation, area under the curve, bi-exponential model, pollutant degradation, system optimization
Citation
Chen B-Y, Lin Y-H, Hsueh C-C and Hong J-M (2022) Feasibility Analysis Upon Optimal Pollutant Degradation via Compartmental Modeling. Front. Environ. Sci. 10:923980. doi: 10.3389/fenvs.2022.923980
Received
20 April 2022
Accepted
22 June 2022
Published
29 September 2022
Volume
10 - 2022
Edited by
Kun-Yi Andrew Lin, National Chung Hsing University, Taiwan
Reviewed by
Alagarasan Jagadeesh Kumar, Jiangsu University, China
Adel Al-Gheethi, Universiti Tun Hussein Onn Malaysia, Malaysia
Joao Frederico Monteiro, Universidade Estadual de Ponta Grossa, Brazil
Updates
Copyright
© 2022 Chen, Lin, Hsueh and Hong.
This is an open-access article distributed under the terms of the Creative Commons Attribution License (CC BY). The use, distribution or reproduction in other forums is permitted, provided the original author(s) and the copyright owner(s) are credited and that the original publication in this journal is cited, in accordance with accepted academic practice. No use, distribution or reproduction is permitted which does not comply with these terms.
*Correspondence: Bor-Yann Chen, bychen@niu.edu.tw
This article was submitted to Toxicology, Pollution and the Environment, a section of the journal Frontiers in Environmental Science
Disclaimer
All claims expressed in this article are solely those of the authors and do not necessarily represent those of their affiliated organizations, or those of the publisher, the editors and the reviewers. Any product that may be evaluated in this article or claim that may be made by its manufacturer is not guaranteed or endorsed by the publisher.