 Yanyong Hu
 Rui Zhang
 Xiaotong Qie
- School of Management, China University of Mining and Technology (Beijing), Beijing, China
Facing the increasingly severe climate situation, China strives to improve its Nationally Determined Contributions, promising to reach its carbon peak by 2030. Accurately predicting the future demand quantity and changing the trends of coal resources is the key to maintaining national energy security and achieving the goal of “carbon peak” and is also an important research topic in the future. To improve the prediction accuracy, this study sorts out eight common factors affecting the coal demand from the aspects of the economy, population, and energy. The grey relational analysis method was used to describe the degree of importance of each factor and screen out the relatively vital factors. The system dynamics model for coal demand in Shanxi Province was also established. The coal demand and carbon emission trends in Shanxi Province from 2021 to 2030 were predicted under business-as-usual, low-speed and high-speed development scenarios. The study results show that: 1) During the 14th Five-Year Plan to 15th Five-year Plan, the trend of coal demand has changed from increasing to decreasing. Under the three scenarios, the coal demand in 2021 is expected to be 372.03 million tons, 365.97 million tons, 360.04 million tons, and it is expected that the coal demand will peak in 2025, and will reach 394.77 million tons, 390.27 million tons, and 385.66 million tons under the three scenarios, respectively. 2) With the development of population and economy, the total energy demand shows a continuously increasing trend. It is estimated that the total energy consumption will reach 237.46-242.93 million tons of standard coal in 2030, and the total energy demand will continue to grow in the foreseeable future. 3) The carbon dioxide emission is closely related to the coal demand, showing a similar variation trend. Under the business-as-usual development scenario, carbon emissions in 2021 are 699.62 million tons, and carbon emissions are expected to reach 681.12 million tons in 2030. The low-speed development and high-speed development scenarios have different degrees of energy saving and emission reduction benefits. Compared with the business-as-usual development scenario in 2030, the carbon dioxide emissions will be reduced by 1.64 million tons and 3.56 million tons respectively. Finally, we put forward important policy measures to promote the economic transformation and upgrading of Shanxi Province and accelerate the realization of the “carbon peak” goal.
1 Introduction
Energy is an important material basis for the industrial production and socio-economic development. China’s resource endowment characteristics of “poor oil, little gas, and rich coal” determine the dominance of coal resources in the energy structure. According to the National Bureau of Statistics of China, the total energy consumption in 2020 was 4.98 billion tons of standard coal. The coal consumption accounted for 56.8% of the total energy consumption, which is 0.9 percentage lower than that in 2019. Affected by the transformation of economic development, the adjustment of energy structure, and the COVID-19 outbreak, the growth rate of demand for coal resources has slowed down. However, from the perspective of energy structure and actual energy consumption, coal resources will still be the safest and most reliable energy source in China for a long time in the coming future. While promoting economic development, coal resources also cause serious environmental pollution and health problems due to the emission of a large amount of poisonous air pollutants, mainly CO2 and SO2, in the process of conversion and utilization (Irfan et al., 2020). China is considered as the largest greenhouse gas emitter globally, mainly due to the lack of cleanliness and efficient coal resource utilization (Hu and Cheng, 2017). Facing the increasingly severe climate situation, China has introduced a series of ambitious energy conservation and emission reduction policies, intensified efforts to regulate coal resources, and set stricter carbon dioxide emission reduction targets (Abbasi et al., 2022). In September 2020, General Secretary Xi Jinping proposed that China will increase its nationally determined contribution at the United Nations General Assembly, strive to peak carbon dioxide emissions by 2030, and strive to achieve overall carbon neutrality by 2060 (Wang et al., 2021). Given China’s dependence on coal resources and the high carbon content of coal, the possibility of achievement of the carbon dioxide emission reduction target depends largely on the amount of coal used (Hao et al., 2015). For a long time, “coal reduction” has been considered as one of the main ways of “carbon reduction (Liu et al., 2020).” From the perspective of production (such as de-capacity policy), it is important to regulate the amount of coal supply, curb the disorderly growth of coal supply, eliminate outdated production capacity, and improve environmental quality. However, the “coal reduction” policy implementation has not been smooth. For example, in September 2021, due to the “power shortage” caused by the tightening of coal supply, many places have sequentially pulled the floodgates to limit electricity consumption, the strength and speed of “reducing coal and controlling coal” have been questioned and reflected. Coal is the cornerstone of China’s energy security, related to national energy security and achieving the goal of “carbon peak”. The “carbon peak” goal proposal is bound to speed up the replacement of coal consumption. However, there have been different debates on how much coal supply share needs to be retained to meet the bottom line of China’s energy demand in the new era.
Under the dual pressure of environmental governance and economic growth, it is urgent to deeply analyse the actual demand for coal demand-side and do forward-looking planning for coal use. In addition to vigorous development on clean energy, scientific planning of coal consumption is the key to ensuring national energy security, achieving the “dual carbon” goal, and sustainable development. Exploring the changing trend of coal demand in the foreseeable future is of great significance for promoting the upgradation of energy-intensive industries, adjusting the energy structure, and formulating carbon reduction policies. As one of the important coal production bases in China, Shanxi Province is not only a large province of coal production and consumption but also a gathering place for the high coal consuming industries. In 2019, Shanxi Province was established as China’s first comprehensive reform pilot for the energy revolution. According to “the statistics table of National Mineral Resources reserves in 2020” released by the Ministry of Natural Resources, by the end of 2020, coal reserves in Shanxi Province reached 50.725 billion tons, accounting for 31.26% of the national reserves. Coal output accounted for 27.66% of the country’s total coal output, ranking first in the country. It is typical and representative to take Shanxi Province as an example to conduct coal demand forecast research. The study results can not only provide support for Shanxi Province to formulate the development plan under the “carbon peak” goal, help Shanxi Province reach carbon peak by 2030, but also have important reference value for carrying out research on coal demand in other coal resource-based provinces and even the whole country.
Therefore, this study considered Shanxi Province as the primary research body, started from the demand side, and aimed to analyse the key factors affecting the coal demand changes in high coal consuming industries. Under the premise of fully considering the reasonable needs of the high coal consuming industries, the system dynamics model was used, and different future development scenarios were designed according to the national policies and plans. Predicting the changing trend of coal resource demand in Shanxi Province under different scenarios provides a basis for decision-making realizing the macro-control of coal in Shanxi Province and even the country.
2 Literature review
At present, many scholars have carried out research on coal demand. The demand forecast cycle can be roughly divided into three types: short-term (Wang et al., 2011) (less than 5 years), medium and long-term (Wang et al., 2019) (5-15 years), and long-term (Mirjat et al., 2018) (more than 15 years). The forecasting methods used by different scholars are also different and increasingly diversified. Roozbeh et al. Roozbeh Nia et al. (2021) summarized the literature on demand forecasting from 2000 to 2020. It was found to cover 73 different forecasting methods, among which regression model, simulation model, time-series model, grey model, meta-heuristic algorithm, fuzzy logic, machine learning and neural network were the most used eight models. Li et al. Li et al. (2015) predicted China’s total coal demand from 2006 to 2012 under five models, including vector autoregressive model (VAR), radial basis function neural network model (RBF), genetic algorithm demand estimation model (GA-DEM), particle swarm optimization demand estimation model (PSO-DEM) and input–output model (IO). They found that the PSO-DEM model has higher accuracy than the other four models by comparing the predicted results with the actual situation. Yang C et al. (2021) used the Markov chain model to predict the changes in China’s energy consumption structure from 2020 to 2060, and examined the changes in the proportion of coal resources in the primary energy consumption structure. Wu and Zhang. (2016) comprehensively considered the impact of domestic demand, import and export trade, industrial structure adjustment, and other factors on China’s coal demand. They used the input-output structural decomposition analysis (I-OSDA) model to explore the key driving factors of coal consumption growth to grasp the future changes in the coal demand. Jia et al. (2020) introduced the Markov chain method to correct the prediction error of the GM (1,1) model based on the grey prediction model. They proposed a grey-Markov chain model, which was used to predict the coal consumption in Gansu province for the next 15 years. Duan and Luo. (2021) also improved the gray prediction model and established the MVGM (1, N) model. The coal demand in Gansu and Inner Mongolia was forecasted considering the influence of population and GDP on the coal demand. He and Lin. (2018) believed that the appropriateness of index selection and model selection was crucial to the accuracy of prediction results. They selected critical indicators based on previous research and constructed an ADL-MIDAS model to predict the changes in China’s energy demand and energy structure. In terms of research on the factors affecting coal demand, Tong et al. (2021) believed that the coal demand is closely related to the level of economic development, industrialization, and urbanization. Chai et al. (2019) analyzed the driving factors for coal demand using the Logarithmic Mean Divisia Index (LMDI) method and revealed that four factors including, per capita income, industrial structure, energy structure, and energy intensity, have a significant impact on the changes in coal demand. Wang and Li. (2017) referring to the research report of the International Energy Agency, believed that GDP, the proportion of tertiary industry in GDP, and the proportion of non-fossil energy in energy consumption are the key factors influencing China’s coal consumption. Qiao et al. (2019) emphasized the importance of indicators such as economic growth, urbanization, and trade development, among various coal demand factors. However, Li et al. (2021) pointed out that the traditional influencing factor system is not suitable for the demand prediction research under the carbon neutrality target. The proposal of the carbon neutrality target will inevitably bring about new influencing factors such as technological progress and the growth rate of the proportion of renewable energy. It is necessary to rebuild the influencing factor system in line with the background of the times.
In the process of coal demand forecasting, in addition to using various forecasting methods to deduce the future ups and downs based on the historical state of the previous samples, it is also necessary to consider the actual impact of unquantifiable factors such as policies and strategies, to prevent the distorted forecast results. Some scholars have attempted to use the scenario analysis in this regard. The scenario analysis method, widely used by various researchers, can consider different development trends, combine quantitative analysis with qualitative analysis, and can predict the subject from multiple dimensions. For example, Wang C et al. (2018) used hybrid methods to forecast China’s coal demand in 2016-2020 under three development scenarios of optimism, business-as-usual, and pessimism. Wang D et al. (2018) also set up three scenarios, namely Policy Regulation Scenario, Baseline as Usual Scenario, and Policy Strengthening Scenario, and used the system dynamics model to predict China’s future coal demand. Yang Q et al. (2021) used the Markov chain model to predict the structure of primary energy consumption and set three scenarios according to different economic growth rates to test whether the carbon intensity target can be achieved under the three scenarios. Then, the Dynamic Stochastic General Equilibrium model (DSGE) was used to investigate the impact of economic structure adjustment on the economic development and carbon emissions. Based on the analysis the historical data on coal consumption, Shi et al. (2021) selected the influencing factors of coal consumption from different levels, such as economy, technology, population, and environment, and constructed three simulation scenarios of rapid growth, baseline level, and slow growth. They also used a hybrid coal demand forecasting algorithm combining adaptive differential evolution and support vector machine to forecast China’s coal demand. Jie et al. (2021) subdivided the coal types and proposed a bottom-up coal supply model, in the context of considering the adjustment of energy system and the transformation of the coal industry. They explored the possible development trends of coal and non-fossil energy under the BUA (business-as-usual) and GREEN scenarios, and pointed out that under the BUA scenario, coal production will peak in 2030.
Judging from the existing research, the research on coal demand forecast has achieved fruitful results, but there is still a large room for expansion. The innovations of this study are as follows: Firstly, taking the high coal consuming industry as the starting point, examining the changing trend of coal demand in the high coal consuming industry under the “carbon peak” target, and predicting the future coal demand in Shanxi Province from the perspective of the industry. Secondly, most of the existing literature predicts coal demand on a national and regional scale. However, there are considerable differences in the actual coal demand among different provinces in the same region. For example, despite Shanxi Province and Jiangxi Province belonging to the central region, the coal consumption of Shanxi Province in 2019 was 6.42 times that of Jiangxi Province, and there were differences in the high coal consuming industries in the two places. The high coal consuming industries in Shanxi Province are dominated by power and heat production industries, supply industries, petroleum processing, coking, and nuclear fuel processing industries, ferrous metals smelting and pressing industries, coal mining and washing industries, nonferrous metals smelting and pressing industries, chemical raw materials, and chemical products manufacturing industries. Jiangxi Province mainly includes six high coal consuming industries namely power and heat production, supply industries, non-metallic mineral products, ferrous metals smelting, pressing industries, coal mining and washing industries, and papermaking and paper products chemical raw materials and chemical products manufacturing industries. Therefore, the present study fully considers the differences in coal demand caused by regional differences and conducts in-depth and targeted research on coal demand in a single province. Shanxi Province was selected as the representative as the research objective is to help the national and local governments achieve the “carbon peak” goal and formulate more timely, effective, and targeted coal control policies. Thirdly, the influencing factors system of coal demand was rebuilt under the background of carbon peak. Considering the changes in the speed of population growth, economic development, and industrial adjustment in the context of the new era, carbon sinks were incorporated into the indicator system to modify the model in line with the future development trends. Fourthly, various studies used a single model to predict future coal demand, limiting the practical and scientific applicability. Compared with other forecasting models, the system dynamics model can reflect the influence, feedback, and interaction of various variables in the complex coal supply and demand system. It is also an effective tool for simulating and forecasting changes in the coal demand by setting future development scenarios and conducting simulations to assist decision-making, considering the choice of influencing factors that will have a significant impact on the model. Thus, this study adopts a combination of grey relational analysis, system dynamics model, and scenario analysis to improve the validity and credibility of the simulation results.
3 Data sets and methodology
3.1 The study area
The key reasons why this study selected the coal resource-based city of Shanxi Province as the research area are as follows: Firstly, Shanxi Province is an essential base for ensuring the safety of coal resources and energy in China. The province’s coal-containing area is 62,000 km2, accounting for 40.4% of the country’s land area. According to data from the National Bureau of Statistics, Shanxi Province’s coal output was 1.063 billion tons in 2020, ranking first in the country. Secondly, Shanxi Province is the first pilot project of the comprehensive reform of the energy revolution in China. Facing the pressure of energy structure optimization and industrial structure adjustment, it is realistic and urgent to study the coal demand system for Shanxi Province. Thirdly, In 2019, the coal consumption ranked first in the country, with a total of 513.3161 million tons. Shanxi Province can reflect the overall trend of the change in national total coal demand. Fourthly, the study found that high coal consuming industries tend to cluster in regions with abundant resource endowments (Song et al., 2018). Therefore, Shanxi Province, as a coal resource-rich area in China, is very suitable as a sample subject to research coal demand in high coal consuming industries. Shanxi Province has derived a series of high coal consuming industries due to its resource endowment characteristics. As seen from the coal flow in Shanxi Province in 2020 (Figure 1), it mainly includes six high coal consuming industries such as power and heat production and supply industries, petroleum processing, coking, and nuclear fuel processing industries, ferrous metals smelting and pressing industries, nonferrous metals smelting and pressing industries, chemical raw materials and chemical products manufacturing industries, coal mining and washing industries. The coal demands of the six high coal consuming industries greatly affect the overall coal demand.
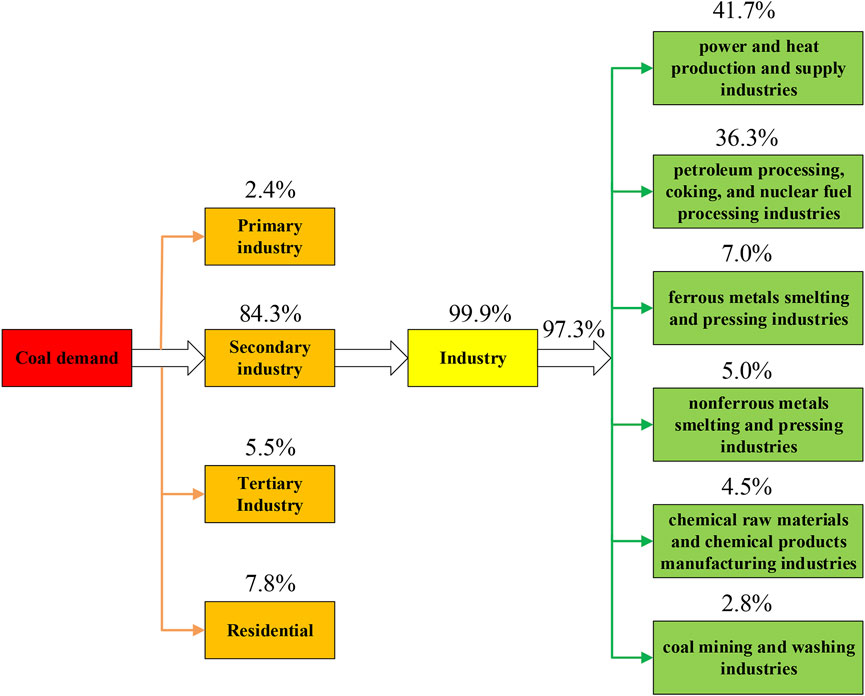
FIGURE 1. Coal flow map of Shanxi Province in 2020.
3.2 Methodology
3.2.1 Grey relational analysis
Since the grey relational analysis model was proposed by Professor Deng Julong (Deng, 1982) in 1982, it has rapidly developed and has been widely used in the fields of the economy (Yi et al., 2021), society (Weng et al., 2021), environment (Sun et al., 2019; Rehman et al., 2022), and energy (Duan and Pang, 2021; Wu et al., 2019). Compared with other mathematical statistics methods (such as principal component analysis, regression analysis), the gray correlation analysis model has the advantage of strong applicability. It has no special requirements for sample size and distribution law and is suitable for research problems with a small amount of information and uncertainty. The grey relational degree method mainly analyses the degree of influence of various factors in the system on the development of the system through the similarity degree of the geometry of the sequence curve. The closer the change rate of the sequence curve is, the greater the correlation degree is, and vice versa. This study uses gray correlation analysis to screen out the factors that significantly impact China’s coal demand. The specific calculation steps are listed as follows:
① Determination of the comparison sequence and the reference data sequence. There are
② Second step is to perform dimensionless processing of the indicator data. Dimensionless data can also be called as normalization or normalization of data. To make the statistical data comparable and comprehensive, before comparing and evaluating the statistical index system composed of coal demand and coal demand influencing factors, the index data must be processed dimensionless. The commonly used methods of dimensionless processing include the mean value method, initial value method, and standardized transformation. In the present study, the averaging method was selected, and the calculation formula is shown in Eq. 3:
③ Calculating the absolute difference between the comparison sequence and the corresponding data of the reference sequence, and determining the two-level minimum value and the two-level maximum value:
④ Calculating the correlation coefficient. The correlation coefficient of the parameters corresponding to the comparison sequence and the reference sequence was calculated using Eq. 5:
In Eq. 5,
⑤ Measuring the grey relational degree. By calculating the mean value of the correlation coefficient between each index in the comparison sequence and the corresponding element of the reference sequence, the relationship between each evaluation object and the reference sequence was reflected. The calculation formula of grey relational degree
Among them, the value range of the grey relational degree is between 0 and 1, and the closer it is to 1, the stronger the correlation between the influencing factors and coal demand, and vice versa.
3.2.2 System dynamics model
Professor Jay W. Forrester from MIT first proposed the System Dynamics Model (SD) in the 1950s to solve business management problems. It has been widely welcomed and applied to solve various complex system problems (Forrester, 1958; Yadav et al., 2021). The system dynamics model can reveal the nonlinear relationship and multiple feedback mechanisms among the internal factors of the system. The coal demand is affected by many factors, and the complex relationship between various factors forms a complex system. In addition to the complexity, the coal demand system also has the characteristics like nonlinear, dynamic, and time delay. It is affected by the insufficient data and the difficulty of quantifying some parameters or relations, making the system dynamics more suitable for the research of the coal demand system than the general econometric model (Li et al., 2021; Yang Q et al., 2021; Hosseinipooya et al., 2022). Therefore, this paper uses the system dynamics model and analyzes the causal relationship between system variables according to the influencing factors, clarifies the stocks, variables, auxiliary functions and parameters in the model, and then draws the coal demand system dynamics flow diagram and constructs the coal demand system dynamics model, so as to achieve the purpose of exploring the changing trend of coal demand in the future. This study is an ex-ante forecast of coal demand in Shanxi Province, and predicts coal demand and carbon emissions in Shanxi Province from 2021-2030 under various scenarios, so as to provide reference for policy making in Shanxi Province, help Shanxi Province to accelerate the realization of high-quality economic development, and achieve the " carbon peak " target as soon as possible.
3.2.3 Emission factor method
Based on the 2006 IPCC Guidelines for National Greenhouse Gas Inventories (Ipcc, 2006), the emission coefficient method was used to measure the carbon dioxide emissions of Shanxi Province each year, and the boundary of investigation of CO2 emissions is grave-to-gate. This paper adopts a “top-down” approach to measure carbon dioxide emissions from raw material development to end use, and the specific formula is shown as follows:
In Eq. 7,
In addition, although electricity belongs to secondary energy and will not directly result in carbon dioxide emissions. However, considering the high coal consuming industries in Shanxi Province and huge electricity consumption by the residents, electricity generation will consume a large amount of primary energy in the production process, indirectly affecting the atmospheric environment. To ensure that the carbon emission accounting results tend to be closer to the actual value, the “Calculation Tool for Greenhouse Gas Emissions Caused by Energy Consumption” published by the World Institute was referred, and the electricity emission factor index was used as 10.942tCO2/104 KWh.
3.3 Data sets
The data we used in this study are mainly from the 2006-2021 “Shanxi Statistical Yearbook,” “China Statistical Yearbook,” and “China Energy Statistical Yearbook.”
4 Empirical analysis
4.1 Analysis of influencing factors of coal demand
The coal demand system is a complex multi-index, high-latitude, and nonlinear time-varying system involving many factors such as economy, society, environment, and energy. Under the development goals of carbon peak, the Chinese government and the Shanxi provincial government have issued a series of development plans and action plans, including the 14th Five-Year Plan, the action plan for carbon peak before 2030 formulated by the State Council, and the “Shanxi Action” for carbon peak proposed by the Shanxi Provincial Government. In the context of the development of the new era, the influencing factors of coal demand are increasingly diversified and complicated, and we need to rebuild the system of influencing factors of coal demand. The selection of factors affecting coal demand is closely related to the accuracy of the simulation results of the system dynamics model. However, the selection and determination of factors affecting coal demand are often based on the traditional experience and are set artificially, which is highly subjective and affects the accuracy of the results. To overcome this problem, this study proposes to apply the grey relational analysis model to the system dynamics modelling and select the influencing factors by combining qualitative and quantitative methods.
By summarizing the existing literature, we initially screened out eight common factors that affected coal demand from the aspects of the economy, population, and energy: total population, gross domestic product, per capita GDP, output value of secondary industry, total energy demand, gasoline demand, electricity demand, and natural gas demand. Based on the statistical data from 2005 to 2020, the correlation between various factors and coal demand was determined. Firstly, the dimensionless treatment is carried out for each factor. Then the correlation degree between each influencing factor and coal demand is calculated according to the grey relational degree calculation Eq. 6 (Table 1).
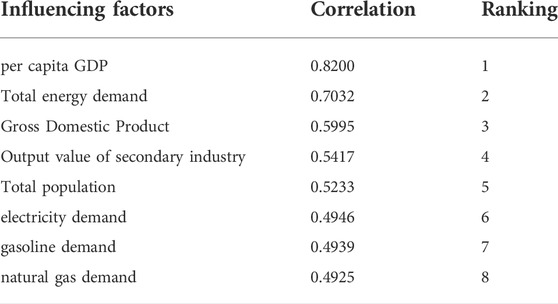
TABLE 1. The correlation degree between various influencing factors and coal demand.
It can be seen from Table 1 that all the correlation coefficients between each influencing factor and coal demand were above 0.4. It shows that the above indicators are closely related to the coal demand system in Shanxi Province and can be incorporated into the system dynamics model as system variables. Among them, per capita GDP has the most significant impact, while natural gas demand has the least impact. As higher the per capita GDP, greater the energy consumption by people, which drives the increase in coal demand. During the study period, the demand for natural gas accounted for a small proportion of the energy consumption structure, and its substitution effect on coal was relatively weak. Therefore, this study focused on the impact of gasoline and electricity on coal demand.
4.2 Boundary definition and flow diagram drawing
This study considers the coal demand system in Shanxi Province as the research object. Based on the above grey relational analysis of the influencing factors and system variables of coal demand, the coal demand system of Shanxi Province is centred on six high coal consuming industries namely power and heat production and supply industries, petroleum processing, coking, and nuclear fuel processing industries, ferrous metals smelting and pressing industries, nonferrous metals smelting and pressing industries, chemical raw materials and chemical products manufacturing industries, coal mining and washing industries. Considering the influence of economic, energy, environment, population, and other factors, combined with the above correlation analysis, the system dynamics VENSIM software was used to establish a dynamic flow diagram of coal demand in Shanxi Province, as shown in Figure 2. Based on the complexity of coal demand, the following assumptions were made for model construction and related variables:
1) During the inspection period, the social and economic status was basically stable, and the influence of force majeure factors such as marginal politics and major natural disasters on the coal demand in Shanxi Province was not considered.
2) Given the small foreign trade export volume of coal in Shanxi Province and the lack of relevant statistical data after 2013, the impact of foreign trade export volume on coal demand was not considered.
3) The adjustment of industrial structure is expressed by the change of the proportion of the secondary industry in the gross regional product.
4) The coal demand is the coal consumption, and the coal demand over the years is represented by coal consumption.
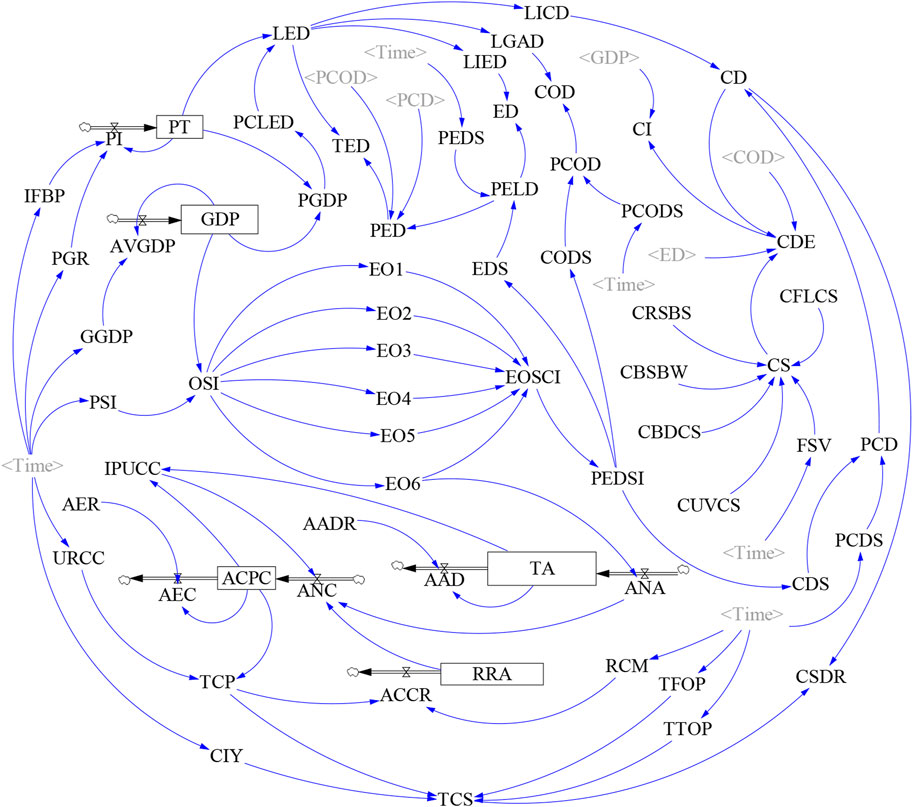
FIGURE 2. System dynamic flow diagram of coal demand in Shanxi Province.
4.3 Parameter setting and equation construction
This study used VENSIM PLE software for the system simulation. Initial time of the model was set to 2005 and the end time to 2030, the time step was set to one and the time unit to a year, of which 2005-2020 is the statistical period of historical data, which is used for relevant parameter setting, model debugging, and verification of model accuracy. 2021-2030 is the forecast period of the system simulation, forecasting the changing trend of coal demand in Shanxi Province in the next 10 years under the carbon peak target. The setting of model parameters mainly adopts the methods of arithmetic mean, table function, econometric model calculation, and reference to existing literature. The specific settings of the related parameters are shown in Table 2.
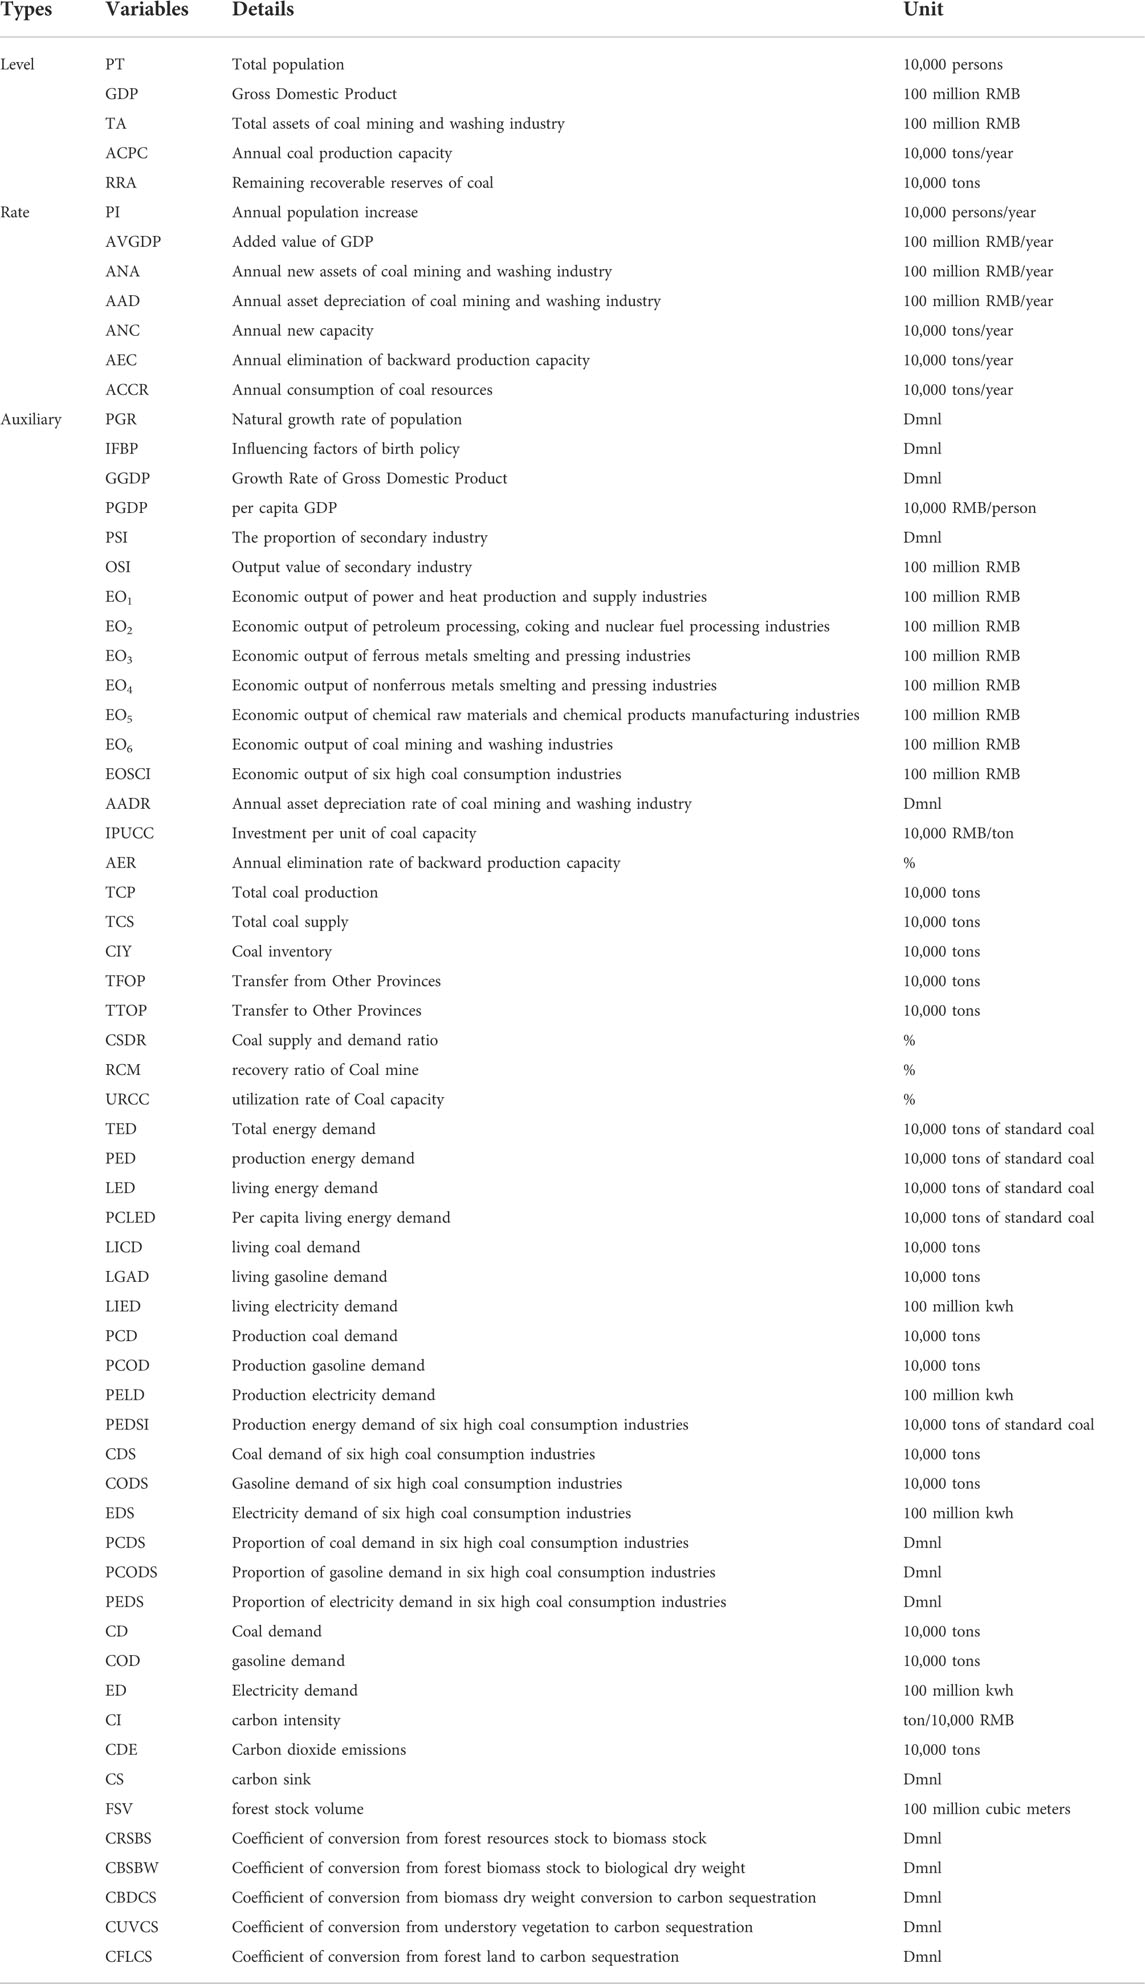
TABLE 2. Parameter settings in the model.
Through the model analysis and parameter setting of the coal demand system in Shanxi Province, the system dynamic equations of the coal demand in Shanxi Province were obtained. The key equations are shown in Eqs 8–34.
3,355.21 in Eq. 8 represents the total population of the initial year, that is, the total population of Shanxi Province in 2005 was 33.5521 million; Similarly, the data in Eqs 9–12 also represent the data of each indicator in the initial year. Eqs 13,14 are obtained by multiplying relevant indicators; Eq. 15 is the relationship between (EO6) Economic output of coal mining and washing industries as the independent variable and (ANA) Annual new assets of coal mining and washing industry as the dependent variable, which is constructed by regression fitting; In the same way, Eqs 24–29 represent the regression equation between the economic output of each high coal consuming industry and the output value of the secondary industry. In addition, IF THEN ELSE is a condition function in system dynamics. For example, in Eq. 21, when Time>2017, IFBP (Influencing factors of birth policy) takes the value of 1.001, otherwise it is 1.
4.4 Model test
After the system structure and model were constructed, the validity test was carried out to verify the feasibility of the model and to ensure the credibility of the simulation results. To verify the validity of the model, we used the historical data comparison method and sensitivity test method.
1) Historical data comparison method. This study used the historical data comparison method to test the model’s accuracy. The error between the simulated and real values was calculated to test the SD model accuracy. The prediction accuracy values specifically include relative error value (W), Average of relative error value (AW), Mean squared error (MSE), Root Mean Square error (RMSE), Mean Absolute Percentage Error (MAPE), and Theil’s U1-statistic, Theil’s U2-statistic. Among them, If the relative error is within
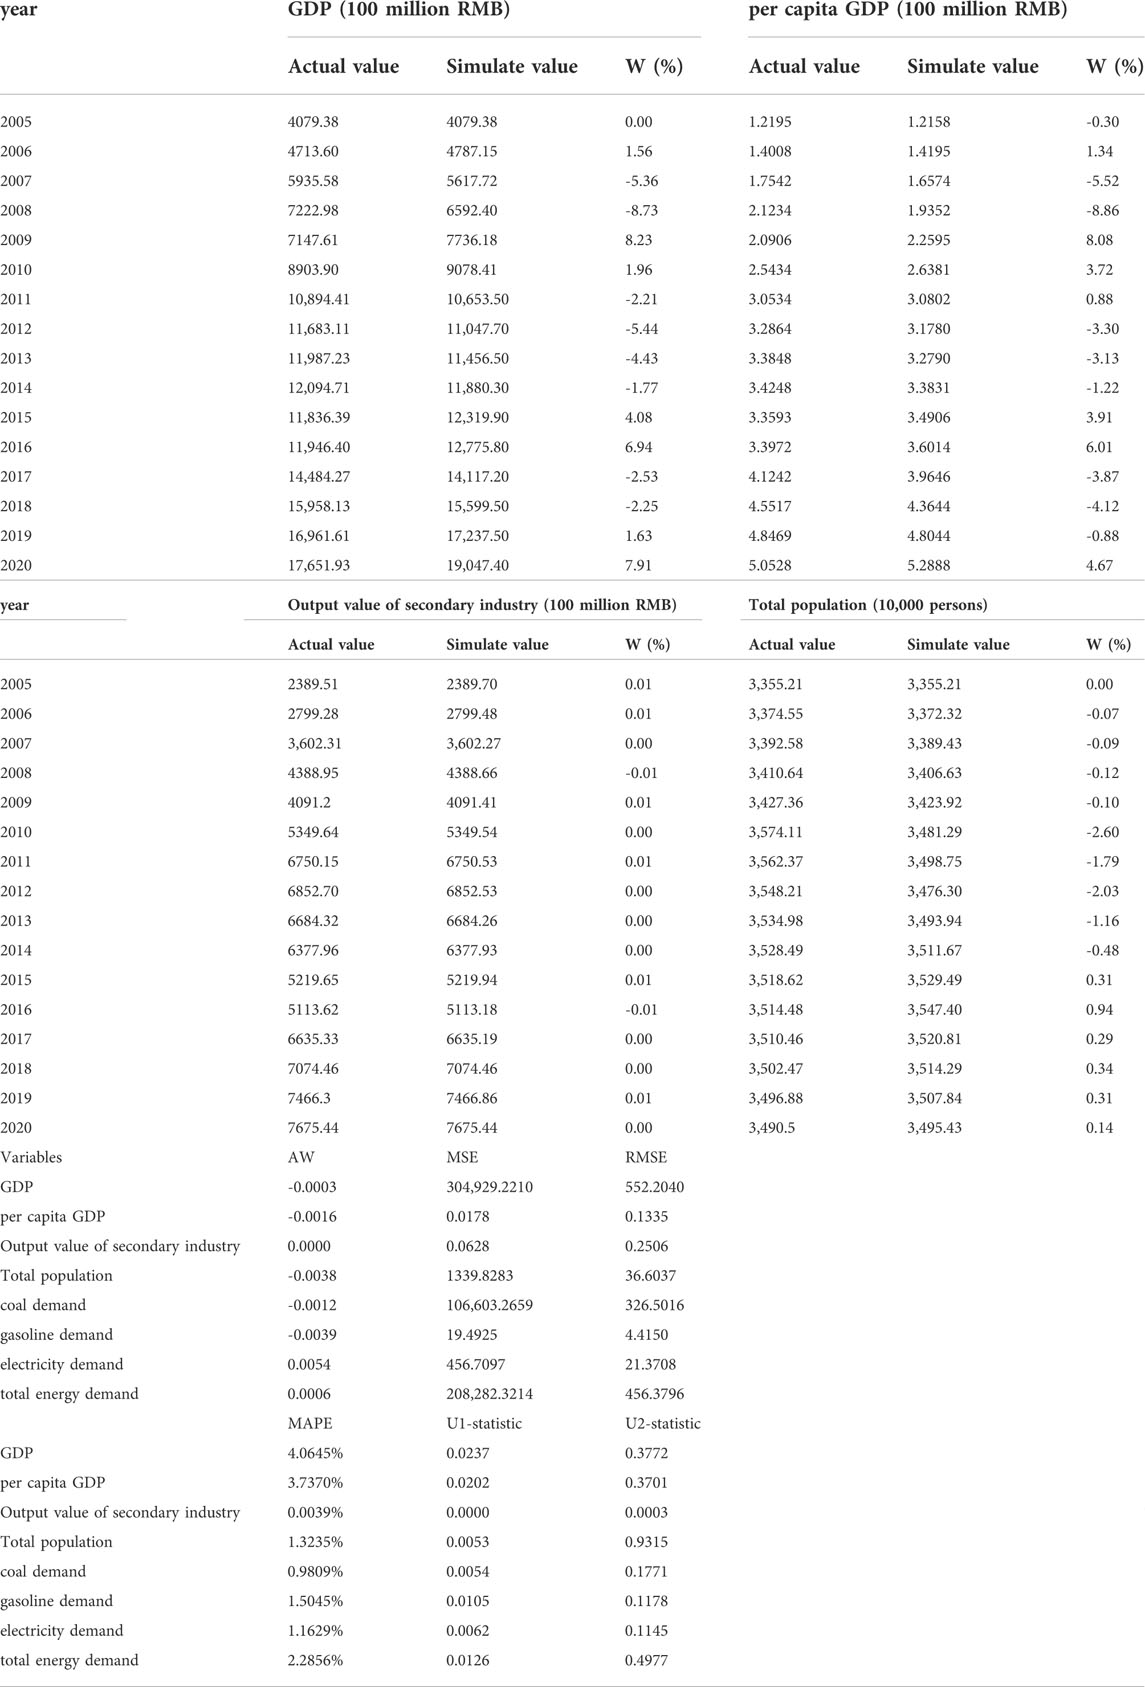
TABLE 3. Historical test results for some variables.
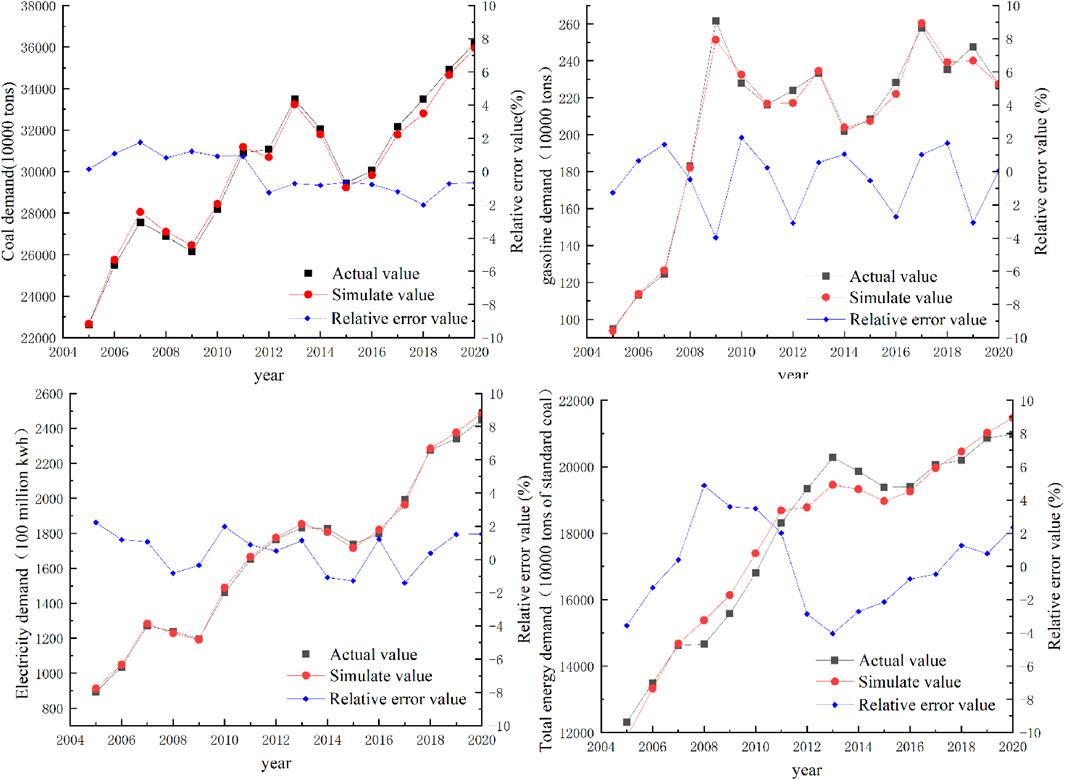
FIGURE 3. Validity test chart of relevant energy indicators.
It can be seen from Table 3 that the relative error between the simulated value and the actual value of the GDP, per capita GDP, output value of secondary industry and total population from 2005 to 2020 were both less than 10%, and the average relative error was within 5%, meeting the error requirements. It is worth noting that the values of Mean squared error and Root Mean Square error are relatively large, which may be caused by the number itself being larger of the Actual value and Simulated value. The original acceptable error value is calculated by square, and the error value will be amplified. To further verify the effectiveness of the prediction model, we also checked the Mean Absolute Percentage Error, Theil’s U1-statistic, and Theil’s U2-statistic values. As can be seen from Table 3, the Mean Absolute Percentage Error values obtained are all within 5%, which meets the normal Error requirements of the prediction model (Khan and Osińska, 2023). In addition, Theil’s U1-statistic values are all close to 0, indicating that the prediction accuracy of the model is high. Theil’s U2-statistic values are all less than 1, which also indicates that the Forecast to compare has a higher degree of accuracy than the naive one, which proves the excellent forecasting ability of the prediction model (Said et al., 2022). We use a variety of statistical data error values to verify that the prediction model in this paper has high simulation accuracy, strong explanatory power, and credibility.
It can be seen from Figure 3 that the simulated values of coal and gasoline demand fit well with the actual values. The relative error interval of coal demand is from negative 2 to positive 2, and the relative error interval of gasoline demand is similar to coal demand, with an error interval of gasoline demand from negative 3 to positive 2. The relative error between the simulated value and the actual value of electricity demand and total energy demand fluctuates between -1.5% and 2%, -4% and 5% respectively, and neither exceeds 5%. It shows that the system model can effectively simulate the changes and interrelationships between variables in the coal demand system in Shanxi Province and can be used to predict the future trend of coal demand in Shanxi Province.
2) Model sensitivity test. To detect the response degree of the model to the change of input parameters, while keeping other inputs unchanged, we changed the six key parameters by
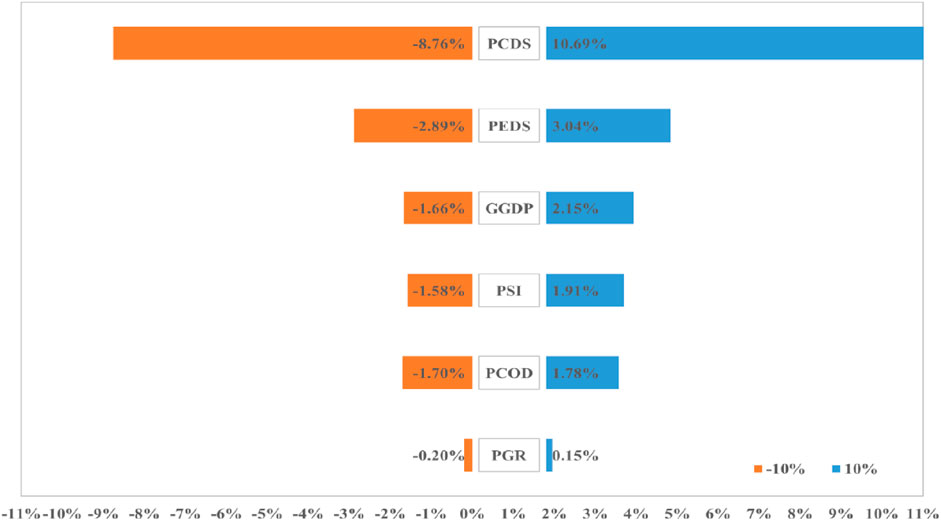
FIGURE 4. System model parameter sensitivity test chart.
It can be seen from Figure 4 that the model is relatively sensitive to the proportion of coal demand in the six high coal consuming industries but does not show high sensitivity to other parameters. It is shown that the behavior of the system model has good stability and reliability and will not produce large abnormal fluctuations due to small changes in exogenous variables, which confirms that the model can be used for simulation analysis.
4.5 Scenario simulation
4.5.1 Scenario setting
Under the vision of carbon peak, we explored the regulatory role of changes in Shanxi’s population, economy, and industrial structure on coal demand in the next few years. This study used 2020 as the base year for model simulation, combined with Shanxi Provincial government documents such as “the Outline of the 14th Five-Year Plan for National Economic and Social Development of Shanxi Province and the Outline of Long-term Goals for 2035” (Shanxi, 2021), “Carbon Peak Action Plan by 2030” and the Shanxi Provincial Government Report. This study sets three different scenarios, including different population growth rates, economic growth trends and industrial structure adjustment (the proportion of secondary industry structure), which are called business-as-usual development, low-speed development, and high-speed development scenarios (see Table 4). Under these three development scenarios, the Shanxi coal demand system dynamics model was run to forecast the coal demand in Shanxi Province from 2021 to 2030. Combined with the forecast of the possible future changes in coal, the coal demand under different development scenarios was determined.
1) The population growth rate setting. The number of people is closely related to the demand for living energy, and the increase in the population will increase the demand for coal resources to a certain extent. The three-child policy has been implemented since 31 May 2021, which will further expand the population size. Therefore, the natural population growth rate is selected as the decision variable of the population subsystem. The natural population growth rate of the business-as-usual development continues to be the current growth rate of 0.00124. Based on the base period level, the natural population growth rate under the low-speed development scenario was increased by 0.5 per thousand points. Under the high-speed scenario, it was increased by one per thousand points.
2) Economic development speed setting. The increase in coal consumption results from Shanxi’s economic development, which directly affects coal consumption. Therefore, this study selected the GDP growth rate as the controllable variable of the economic subsystem. Based on the long-term goal of basically realizing socialist modernization in 2035 put forward by the Fifth Plenary Session of the 19th Central Committee and “the Outline of the 14th Five-Year Plan for National Economic and Social Development of Shanxi Province and the Outline of Long-term Goals for 2035”. It is proposed that by 2035, the total economic volume of Shanxi Province would reach the level of the middle reaches of the country, basically realize socialist modernization at the same time as the whole country and strive to achieve high-quality development. The economy of China and Shanxi Province will show an overall growth trend in the future. This study refers to the GDP growth rate of Shanxi Province over the years. The benchmark development was set at 0.036 and 0.034 respectively during the 14th Five-Year Plan to 15th Five-Year Plan period according to the current growth rate, while the low-speed development and high-speed development scenarios were the basis for the base period. The GDP growth rate was increased by two thousand points and four thousand points, respectively.
3) Industrial structure adjustment setting. Industrial structure is one of the important factors affecting coal demand. Coal consumption in Shanxi Province is mainly concentrated in the six high coal consuming industries under the secondary industry, and the coal demand in the primary and tertiary industries is relatively low. The State Council issued the “Carbon Peak Action Plan before 2030”, which pointed out that it is necessary to develop strategic emerging industries vigorously. It is planned to make obvious progress in the adjustment and optimization of the industrial structure during the 14th Five-Year Plan period and make significant progress during the 15th Five-Year Plan period. The “14th Five-Year Plan for Future Industry Development of Shanxi Province” also proposes to promote high-quality and high-speed economic transformation through accelerated development and cultivation of the technologically innovative future industries. In future, China will continue to optimize the industrial structure and reduce the proportion of the secondary industry. Therefore, the proportion of the secondary industry was set at 0.4348 and 0.4300 respectively during the 14th Five-Year Plan to 15th Five-Year Plan period, which decreased by one percentage point and two percentage points respectively under the low-speed development and high-speed development scenarios.
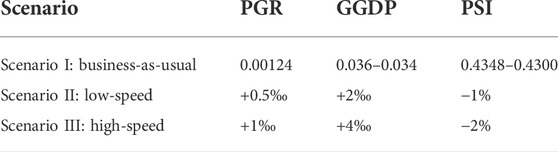
TABLE 4. Scenario setting of coal demand system in Shanxi Province.
4.5.2 Analysis of simulation results
According to the three different scenarios, the system dynamics model was used to obtain the simulation results of the total population, GDP, output value of the secondary industry, total energy demand (Table 5), and the changing trends of coal demand, gasoline demand, electricity demand, and carbon dioxide emissions in Shanxi Province (Figure 5).
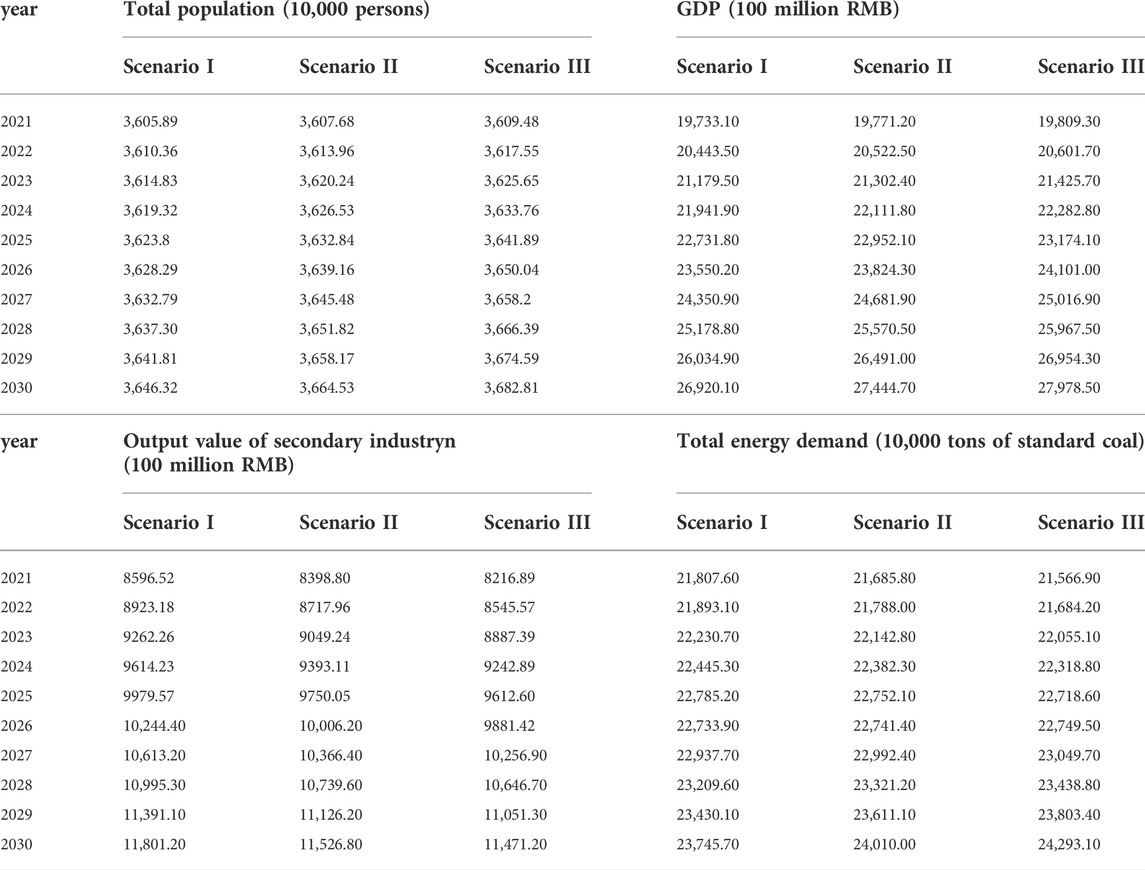
TABLE 5. Simulation results of population-economy-energy in Shanxi Province under different development scenarios.
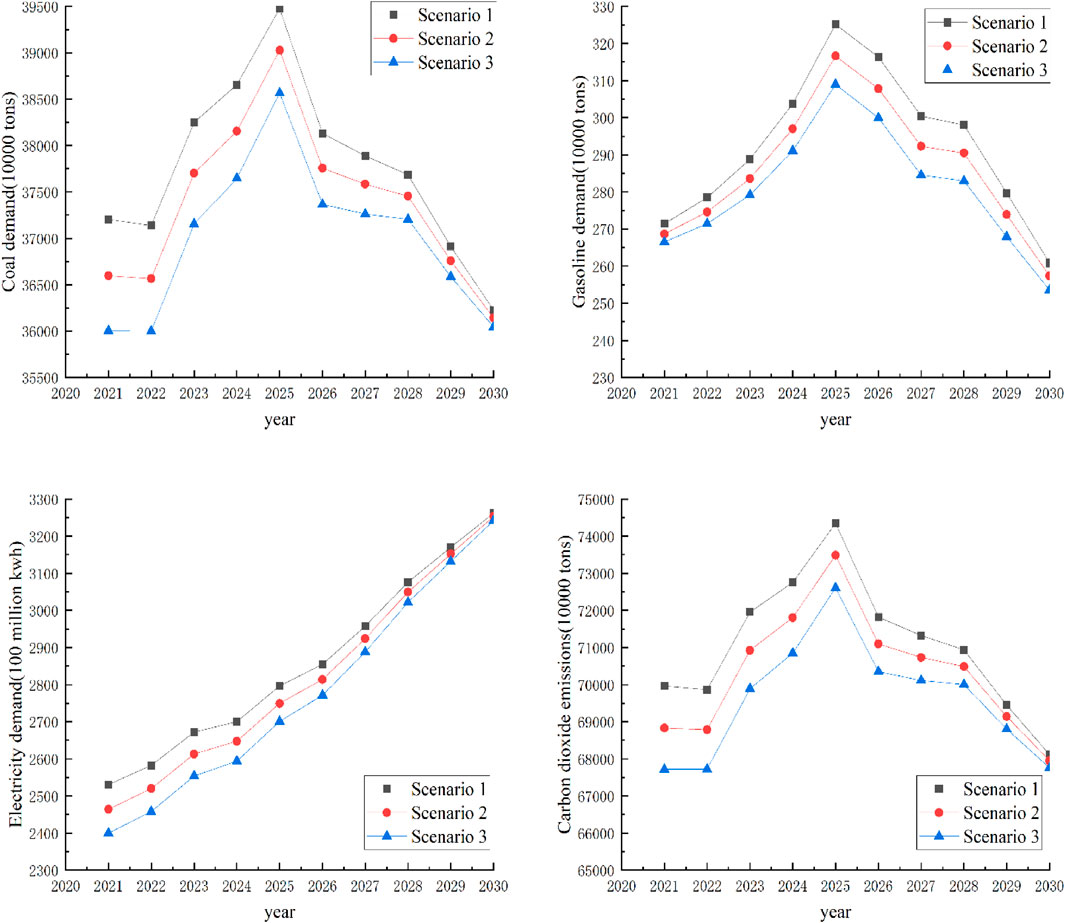
FIGURE 5. The changing trend of coal, gasoline, electricity demand and carbon dioxide emission.
From Table 5, the total population, GDP, output value of the secondary industry, and total energy demand generally show an increasing trend year by year under the three scenarios. Due to the different settings of the natural population growth rate, under the high-speed development scenario compared with the business-as-usual development and low-speed development scenarios, the total population of Shanxi in 2030 will increase by 364,900 and 182,800, respectively. Under the three scenarios, the GDP will reach 2,692,010 million yuan, 2,744,470 million yuan, and 2,797,850 million yuan in 2030, respectively. Influenced by the intensity of industrial structure adjustment, compared with the business-as-usual development scenario, the output value of the secondary industry under the high-speed development scenario and the low-speed development scenario will be reduced by 33 billion yuan and 27.44 billion yuan in 2030, respectively.
Figure 5 shows the changing trends of coal, gasoline, electricity demand and carbon dioxide emissions under different scenarios. It can be observed from Figure 5 that the demand for coal, gasoline and electricity is maximum under the business-as-usual development scenario and minimum under the high-speed development scenario. Because under the high-speed development scenario, the industrial transformation structure is accelerated, the secondary industry structure declines, the demand for primary energy is reduced, and the energy structure is further cleaned. In addition, the changes in demand for coal and gasoline under the three scenarios were the same, all peaking in 2025 and tending to intersect after 2028, and the gap between the three gradually narrowed. Under the three scenarios, coal demand is expected to reach 385-395 million tons in 2025, and the overall change trend is in line with the coal regulation plan of “first controlling increase and then decreasing” proposed in the “Carbon Peak Action Plan before 2030”, that is, to further promote the substitution, transformation and upgrading of coal consumption, speed up the pace of coal reduction, strictly and reasonably control the growth of coal consumption during the 14th Five-Year Plan period, and gradually reduce coal demand during the 15th Five-Year Plan period. This result is in line with the research results of Cui et al. The coal demand in Shanxi Province will generally show a continuous growth trend from 2020 to 2025 (Cui et al., 2018), and it is in line with the overall change trend of national coal demand, and the demand will decline after 2025 (Shi et al., 2021). In 2030, the demand for coal will be 362.2450 million tons, 361.4170 million tons, and 360.4450 million tons in the business-as-usual development scenario, low-speed development scenario, and the high-speed development scenario, respectively. During the 14th Five-Year Plan and 15th Five-Year Plan period, gasoline demand also showed a trend of first increase and then decrease, respectively. The demand scale of gasoline demand will be 3.0894-3.2513 million tons in 2025, and it will drop to 2.5354-2.6086 million tons in 2030. The overall electricity demand will continue to grow. In 2030, the electricity demand is expected to reach 3,262.4500, 3,253.3900 and 324.2620 billion kWh under the business-as-usual development, the low-speed development and the high-speed development scenarios, respectively.
It is worth noting that the carbon dioxide emissions and coal demand show similar change trends, indicating that the carbon dioxide emissions in Shanxi Province are mainly from the process of development and utilization of coal resources. It can be seen from the simulation results that under the three scenarios, the growth trend of carbon dioxide emissions is relatively flat from 2020 to 2022 and will begin to increase rapidly from 2022 to 2025, the development trend will change after 2025, showing a downward trend. This phenomenon may be due to the sudden impact of the COVID-19. Shanxi Province’s economic growth slowed down from 2020 to 2022, resulting in a reduction in coal demand, which in turn resulted in a drop in carbon dioxide emissions. From 2022 to 2025, under the general tone of economic development in the 14th Five-Year Plan of “seeking progress while maintaining stability”, the economy will achieve further development, and carbon dioxide emissions will continue to grow along with the increase in energy consumption. However, under the 15th Five-Year Plan to adjust the industrial structure, optimize the energy consumption structure and other measures, carbon dioxide emissions trend has changed from an upward trend to a downward trend. In 2025 and 2030, carbon dioxide emissions will be 726.0611-743.4704 million tons and 677.5641-681.1248 million tons respectively. In the context of population growth and economic development, the demand for coal and gasoline has declined, while the electricity demand has continued to grow. The impact of industrial structure adjustment on the type and quantity of energy consumption was found to be crucial.
5 Conclusion and suggestions
The present study used the grey relational degree method, integrating the strength of key indicator screening and the advantages of the system dynamics feedback mechanism, at the same time combined with the scenario analysis, to predict the dynamic evolution trend of coal demand and carbon emission in Shanxi Province from 2021 to 2030 under the background of a carbon peak. This research mainly investigated the related factors numbering population growth, economic growth and industrial structure adjustment bringing the effects on the coal demand system in Shanxi Province. The key conclusions are listed as follows:
1) Through grey relational analysis, it was found that some key indicators, including the total population, gross regional product, gross regional product per capita, output value of the secondary industry, total energy consumption, gasoline demand, and electricity demand have a close relationship with the coal demand. All of them can be incorporated into the system dynamics model as a system variable, among which the gross regional product per capita has the greatest impact on the coal demand. In addition, coal demand in Shanxi Province is less affected by natural gas consumption, and the correlation is less than gasoline demand and electricity demand.
(2) Under three scenarios, the total population, gross regional product, output value of the secondary industry, and total energy demand generally show an increasing trend over the years. The total energy demand would be expected to reach 237.4570-242.9310 million tons of standard coal in 2030. It can be seen that the total energy demand will grow continuously in the foreseeable future with the development of population and economy.
3) Under the business-as-usual development scenario, during the 14th Five-Year Plan to 15th Five-Year Plan period, the trend of coal demand has changed from increasing to decreasing. Coal demand will reach its peak in 2025, reaching 394.7670 million tons, 390.2730 million tons, and 385.6580 million tons under the three scenarios, respectively. In 2030, the demand for coal will be 362.2450 million tons, 361.4170 million tons, and 360.4450 million tons in the business-as-usual development scenario, low-speed development scenario, and the high-speed development scenario, respectively. Carbon dioxide emission shows a similar trend as that of the coal demand, and carbon emissions are expected to reach 681.1248 million tons in 2030 under the business-as-usual development scenario. The low-speed development and high-speed development scenarios have produced different degrees of energy-saving and emission reduction benefits. Compared with the business-as-usual development scenario, the carbon dioxide emissions will be reduced by 1.6412 million tons and 3.5607 million tons respectively in 2030.
4) The adjustment of industrial structure is the key to “reducing coal and reducing carbon” in Shanxi Province. Under the circumstances of population and economic development growth, coal and gasoline demand see a decreasing trend during the forecast period, while electricity demand will continue to increase. It can be seen that the adjustment of industrial structure has a great impact on the type and quantity of energy consumption.
Based on the above research conclusions, this study puts forward the following policies and suggestions to promote the transformation and upgradation of Shanxi Province:
1) Given the large demand for coal in high coal consumption industries, and the significant impact of industrial structure adjustment on reducing primary energy consumption and reducing carbon dioxide emissions, Shanxi Province should accelerate industrial transformation, promote the upgradation of high-energy-consuming industries, focus on developing advanced production capacity for coal, close and exit outdated production capacity, and actively cultivate emerging industries, high-tech industries and future industries.
2) According to the simulation results of the continuous growth of total energy demand under the three scenarios, while reducing the use of coal, alternative energy sources like renewable energy and clean energy should be actively developed to satisfy energy needs while maintaining the high-quality and stable development of the economy.
3) Fundamentally, the essence of carbon peak is not de-coalization but it is transformation and upgradation of the way of coal production, conversion, and utilization. Shanxi Province should be based on its own endowment characteristics, taking the “dual carbon” goal as the driving force, accelerate the transformation of traditional coal mines to intelligent, clean, digital, and efficient mines. Shanxi Province should deepen the depth and breadth of integration with modern information technologies such as big data, artificial intelligence, 5G communications, and robots, and make full use of the technology to improve the efficiency of coal resource utilization.
4) From the forecast results of carbon dioxide emissions, the amount of carbon dioxide emissions is closely related to the size of coal demand. The extensive development and utilization of the coal resources is a key to the huge carbon dioxide emissions in Shanxi Province and the clean and efficient utilization of coal should be vigorously promoted. Not only Shanxi Province should continue to strengthen technology research and development, reduce the number of pollutants generated by high coal consumption industries, it should also improve the “Exhaust gas, wastewater and waste residue” treatment capacity. For instance, the promotion and application of high-efficiency pulverized coal boiler technology should be strengthened in the process of coal power generation in the power and heat production and supply industries, At the same time, it is necessary to improve the clean coal production mechanism and the whole life cycle evaluation mechanism of energy consumption, emission, and cost, formulate industrial standards, work norms, and attach importance to the efficient use of resources and the protection of the ecological environment in each production link.
Finally, it is worth noting that the forecast of coal demand in Shanxi Province has contributed to grasping the general trend of national coal changes in the future, but it has not been able to conduct a comprehensive study of coal demand in various provinces across the country. Therefore, future research can carry out national coal demand forecast research at the provincial level, as well as carry out development forecasts for other energy sources, such as the future share of renewable energy.
Data availability statement
The original contributions presented in the study are included in the article/Supplementary Material, further inquiries can be directed to the corresponding author.
Author contributions
YH: Conceptualization, Methodology, Investigation, Visualization, Writing—original draft. RZ: Resources, Methodology, Supervision, Funding acquisition. XQ: Data curation, Writing—review and editing. XZ: Data curation, Software.
Funding
This research was funded by the Major Science and Technology Projects in Shanxi Province (No. 20181102017); Fundamental Research Funds for the Central Universities, China (No. 2022YJSGL13).
Acknowledgments
The authors are grateful to reviewers and editors for helpful comments and suggestions.
Conflict of interest
The authors declare that the research was conducted in the absence of any commercial or financial relationships that could be construed as a potential conflict of interest.
Publisher’s note
All claims expressed in this article are solely those of the authors and do not necessarily represent those of their affiliated organizations, or those of the publisher, the editors and the reviewers. Any product that may be evaluated in this article, or claim that may be made by its manufacturer, is not guaranteed or endorsed by the publisher.
References
Abbasi, K. R., Shahbaz, M., Zhang, J., Irfan, M., and Alvarado, R. (2022). Analyze the environmental sustainability factors of China: The role of fossil fuel energy and renewable energy. Renew. Energy 187, 390–402. doi:10.1016/j.renene.2022.01.066
Chai, J., Du, M., Liang, T., Sun, X. C., Yu, J., and Zhang, Z. G. (2019). Coal consumption in China: How to bend down the curve? Energy Econ. 80, 38–47. doi:10.1016/j.eneco.2018.12.016
Chang, T. C., and Lin, S. J. (1999). Grey relation analysis of carbon dioxide emissions from industrial production and energy uses in Taiwan. J. Environ. Manage. 56 (4), 247–257. doi:10.1006/jema.1999.0288
Cui, H., Wu, R., Zhao, T., and Bianco, V. (2018). Dynamic decomposition analysis and forecasting of energy consumption in Shanxi province based on VAR and GM (1, 1) models. Math. Probl. Eng. 2018, 1–11. doi:10.1155/2018/4234206
Deng, J. L. (1982). Control problems of grey systems. Syst. Control Lett. 1 (5), 288–294. doi:10.1016/S0167-6911(82)80025-X
Duan, H., and Luo, X. (2021). A novel multivariable grey prediction model and its application in forecasting coal consumption. ISA Trans. 3, 110–127. doi:10.1016/j.isatra.2021.03.024
Duan, H., and Pang, X. (2021). A multivariate grey prediction model based on energy logistic equation and its application in energy prediction in China. Energy 229, 120716. doi:10.1016/j.energy.2021.120716
Forrester, J. W. (1958). Industrial dynamics: A major breakthrough for decision makers. Harv. Bus. Rev. 36 (4), 141–172. doi:10.1007/978-3-642-27922-5_13
Hao, Y., Zhang, Z., Liao, H., and Wei, Y. (2015). China’s farewell to coal: A forecast of coal consumption through 2020. Energy Policy. 86, 444–455. doi:10.1016/j.enpol.2015.07.023
He, Y., and Lin, B. (2018). Forecasting China's total energy demand and its structure using ADL-MIDAS model. Energy 151, 420–429. doi:10.1016/j.energy.2018.03.067
Hosseinipooya, S. A., Hu, G., Lee, K., Li, J., Ng, K. T. W., and Vu, H. L. (2022). A system dynamics modeling approach for estimation of oily waste generation from marine oil spill response: A case study of an oil spill in central coast of British columbia. Front. Environ. Sci. 10, 902229. doi:10.3389/fenvs.2022.902229
Hu, Y., and Cheng, H. (2017). Displacement efficiency of alternative energy and trans-provincial imported electricity in China. Nat. Commun. 8, 14590. doi:10.1038/ncomms14590
Ipcc (2006). IPCC Guidelines for national greenhouse gas Inventories. Available at: https://www.ipcc-nggip.iges.or.jp/public/2006gl/chinese/pdf/2_Volume2/V2_0_Cover.pdf (Accessed 310 2022, 2022).
Irfan, M., Hao, Y., Panjwani, M. K., Khan, D., Chandio, A. A., and Li, H. (2020). Competitive assessment of south asia's wind power industry: SWOT analysis and value chain combined model. Energy Strategy Rev. 32, 100540. doi:10.1016/j.esr.2020.100540
Jia, Z., Zhou, Z., Zhang, H., Li, B., and Zhang, Y. (2020). Forecast of coal consumption in Gansu Province based on Grey-Markov chain model. Energy 199, 117444. doi:10.1016/j.energy.2020.117444
Jie, D., Xu, X., and Guo, F. (2021). The future of coal supply in China based on non-fossil energy development and carbon price strategies. Energy 220, 119644. doi:10.1016/j.energy.2020.119644
Khan, A. M., and Osińska, M. (2023). Comparing forecasting accuracy of selected grey and time series models based on energy consumption in Brazil and India. Expert Syst. Appl. 212, 118840. doi:10.1016/j.eswa.2022.118840
Li, B., Liang, Q., and Wang, J. (2015). A comparative study on prediction methods for China's medium- and long-term coal demand. Energy 93, 1671–1683. doi:10.1016/j.energy.2015.10.039
Li, J., Luo, Y., and Wei, S. (2021). Long-term electricity consumption forecasting method based on system dynamics under the carbon-neutral target. Energy 244, 122572. doi:10.1016/j.energy.2021.122572
Liu, H., Liu, Y., Wang, H., Yang, J., and Zhou, X. (2019). Research on the coordinated development of greenization and urbanization based on system dynamics and data envelopment analysis——a case study of tianjin. J. Clean. Prod. 214, 195–208. doi:10.1016/j.jclepro.2018.12.046
Liu, L., Cheng, L., Zhao, L., Cao, Y., and Wang, C. (2020). Investigating the significant variation of coal consumption in China in 2002-2017. Energy 207, 118307. doi:10.1016/j.energy.2020.118307
Mirjat, N. H., Uqaili, M. A., Harijan, K., Walasai, G. D., Mondal, M. A. H., and Sahin, H. (2018). Long-term electricity demand forecast and supply side scenarios for Pakistan (2015–2050): A leap model application for policy analysis. Energy 165, 512–526. doi:10.1016/j.energy.2018.10.012
Qiao, H., Chen, S., Dong, X., and Dong, K. (2019). Has China's coal consumption actually reached its peak? National and regional analysis considering cross-sectional dependence and heterogeneity. Energy Econ. 84, 104509. doi:10.1016/j.eneco.2019.104509
Rehman, S., Rehman, E., Mumtaz, A., and Jianglin, Z. (2022). A multicriteria decision-making approach in exploring the nexus between wind and solar energy generation, economic development, fossil fuel consumption, and CO2 emissions. Front. Environ. Sci. 9, 819384. doi:10.3389/fenvs.2021.819384
Roozbeh Nia, A., Awasthi, A., and Bhuiyan, N. (2021). Industry 4.0 and demand forecasting of the energy supply chain: A literature review. Comput. Ind. Eng. 154, 107128. doi:10.1016/j.cie.2021.107128
Said, Z., Cakmak, N. K., Sharma, P., Sundar, L. S., Inayat, A., Keklikcioglu, O., et al. (2022). Synthesis, stability, density, viscosity of ethylene glycol-based ternary hybrid nanofluids: Experimental investigations and model -prediction using modern machine learning techniques. Powder Technol. 400, 117190. doi:10.1016/j.powtec.2022.117190
Shanxi, P. P. G. (2021). The outline of the 14th five-year plan for national economic and social development of Shanxi province and the outline of long-term goals for 2035. Available at: http://fgw.shanxi.gov.cn/fggz/wngz/fzgh2/202104/t20210416_177332.shtml (Accessed 8, 2022).
Shi, M., Huang, Y., Xiaofeng, X., and Liu, D. (2021). China's coal consumption forecasting using adaptive differential evolution algorithm and support vector machine. Resour. Policy 74, 102287. doi:10.1016/j.resourpol.2021.102287
Song, M., Wang, J., and Zhao, J. (2018). Coal endowment, resource curse, and high coal-consuming industries location: Analysis based on large-scale data. Resour. Conservation Recycl. 129, 333–344. doi:10.1016/j.resconrec.2016.08.005
Sun, X., Hu, Z., Li, M., Liu, L., Xie, Z., Li, S., et al. (2019). Optimization of pollutant reduction system for controlling agricultural non-point-source pollution based on grey relational analysis combined with analytic hierarchy process. J. Environ. Manage. 243, 370–380. doi:10.1016/j.jenvman.2019.04.089
Tong, M., Dong, J., Luo, X., Yin, D., and Duan, H. (2021). Coal consumption forecasting using an optimized grey model: The case of the world's top three coal consumers. Energy 242, 122786. doi:10.1016/j.energy.2021.122786
Wang, C., Li, B., Liang, Q., and Wang, J. (2018). Has China’s coal consumption already peaked? A demand-side analysis based on hybrid prediction models. Energy 162, 272–281. doi:10.1016/j.energy.2018.08.031
Wang, D., Nie, R., Long, R., Shi, R., and Zhao, Y. (2018). Scenario prediction of China’s coal production capacity based on system dynamics model. Resour. Conservation Recycl. 129, 432–442. doi:10.1016/j.resconrec.2016.07.013
Wang, J., Dong, Y., Wu, J., Mu, R., and Jiang, H. (2011). Coal production forecast and low carbon policies in China. Energy Policy. 39 (10), 5970–5979. doi:10.1016/j.enpol.2011.06.058
Wang, Q., and Li, R. (2017). Decline in China's coal consumption: An evidence of peak coal or a temporary blip? Energy Policy. 108, 696–701. doi:10.1016/j.enpol.2017.06.041
Wang, Q., Li, S., and Li, R. (2019). Will trump's coal revival plan work? - comparison of results based on the optimal combined forecasting technique and an extended IPAT forecasting technique. Energy 169 (15), 762–775. doi:10.1016/j.energy.2018.12.045
Wang, S., Balta-Ozkan, N., Yildirim, J., Chen, F., and Wang, Y. (2021). Can compulsory ecological compensation for land damaged by mining activities mitigate CO2 emissions in China? Front. Environ. Sci. 9, 778937. doi:10.3389/fenvs.2021.778937
Weng, L., Zhang, Q., Lin, Z., and Wu, L. (2021). Harnessing heterogeneous social networks for better recommendations: A grey relational analysis approach. Expert Syst. Appl. 174, 114771. doi:10.1016/j.eswa.2021.114771
Wu, D., Zhou, P., and Zhou, C. Q. (2019). Evaluation of pulverized coal utilization in a blast furnace by numerical simulation and grey relational analysis. Appl. Energy 250, 1686–1695. doi:10.1016/j.apenergy.2019.05.051
Wu, Y., and Zhang, W. (2016). The driving factors behind coal demand in China from 1997 to 2012: An empirical study of input-output structural decomposition analysis. Energy Policy. 95, 126–134. doi:10.1016/j.enpol.2016.05.007
Yadav, K., Geli, H. M. E., Cibils, A. F., Hayes, M., Fernald, A., Peach, J., et al. (2021). An integrated food, energy, and water nexus, human well-being, and resilience (FEW-WISE) framework: New Mexico. Front. Environ. Sci. 9, 667018. doi:10.3389/fenvs.2021.667018
Yang, C., Hao, Y., and Irfan, M. (2021). Energy consumption structural adjustment and carbon neutrality in the post-COVID-19 era. Struct. Change Econ. Dyn. 59, 442–453. doi:10.1016/j.strueco.2021.06.017
Yang, Q., Zhang, L., Zhang, J., and Zou, S. (2021). System simulation and policy optimization of China's coal production capacity deviation in terms of the economy, environment, and energy security. Resour. Policy 74, 102314. doi:10.1016/j.resourpol.2021.102314
Keywords: coal demand, high coal consumption industries, grey relational degree, system dynamics, carbon emission
Citation: Hu Y, Zhang R, Qie X and Zhang X (2022) Research on coal demand forecast and carbon emission reduction in Shanxi Province under the vision of carbon peak. Front. Environ. Sci. 10:923670. doi: 10.3389/fenvs.2022.923670
Received: 19 April 2022; Accepted: 31 October 2022;
Published: 10 November 2022.
Edited by:
Faik Bilgili, Erciyes University, TurkeyReviewed by:
Shijin Wang, Jiangsu Normal University, ChinaYuan Jiang, Pacific Northwest National Laboratory (DOE), United States
Xilong Yao, Taiyuan University of Technology, China
Copyright © 2022 Hu, Zhang, Qie and Zhang. This is an open-access article distributed under the terms of the Creative Commons Attribution License (CC BY). The use, distribution or reproduction in other forums is permitted, provided the original author(s) and the copyright owner(s) are credited and that the original publication in this journal is cited, in accordance with accepted academic practice. No use, distribution or reproduction is permitted which does not comply with these terms.
*Correspondence: Rui Zhang, enJjdW10YkAxNjMuY29t