 Jie Wang
 Zhi-cheng Wang1
 Yu-huan Cui
 Shuang Hao
94% of researchers rate our articles as excellent or good
Learn more about the work of our research integrity team to safeguard the quality of each article we publish.
Find out more
ORIGINAL RESEARCH article
Front. Environ. Sci., 26 July 2022
Sec. Environmental Informatics and Remote Sensing
Volume 10 - 2022 | https://doi.org/10.3389/fenvs.2022.922505
This article is part of the Research TopicMethods and Applications in Environmental Informatics and Remote SensingView all 9 articles
Phycocyanin (PC) concentration is used as an indicator to characterize cyanobacteria biomass while monitoring eutrophication in inland water. Remote sensing provides useful methods for quantifying PC concentration; however, there is a shortage of datasets for the long-term monitoring of PC concentration when only a single remote sensing data is used. Therefore, PC concentrations obtained from multisource remote sensing images should be compared before integrating them for long-term monitoring. In this study, machine learning (ML) regression algorithms are used to develop PC concentration retrieval models suitable for Moderate Resolution Imaging Spectroradiometer (MODIS) and Sentinel-3 Ocean and Land Colour Instrument (OLCI) images, and their accuracies are compared. The two optimal retrieval models are applied to satellite images acquired on the same days to compare the spatial consistency of the two PC concentration retrieval results. The results show that the sensitive spectral range of PC concentration is 560–680 nm. Among the ML regression algorithms, gradient boosted tree (GBT) regression exhibits the highest PC retrieval accuracy for both the MODIS images (R2 = 0.82, RMSE = 61.9 μg/L) and OLCI images (R2 = 0.86, RMSE = 45.44 μg/L). The PC concentrations retrieved from the MODIS and OLCI images acquired in bloom and no-bloom periods have a high spatial consistency in most areas of Chaohu Lake. Their correlation coefficient also exceeds 0.7, and the average relative error reaches 0.293 μg/L. However, a large difference exists in areas with high PC concentrations, which may cause by the poor applicability of atmospheric correction algorithms and PC retrieval models in these areas. The proposed PC concentration retrieval models developed using GBT regression in this paper can expend the idea for the quantitative retrieval of other inland water quality parameters in inland water, and the conclusions should enable the effective integration of MODIS and OLCI images for the time series monitoring of PC concentrations in reservoirs and lakes.
In recent years, cyanobacterial blooms caused by eutrophication in lakes and reservoirs have become one of the major global environmental problems. Cyanobacterial blooms disrupt the normal food chain through the production of algal toxins and oxygen depletion by decomposition, thus harming water ecosystems and posing risk to the safety of drinking water (Yang et al., 2019). The concentration of Phycocyanin [PC], the signature pigment of cyanobacteria in lakes and reservoirs, is an important indicator characterizing cyanobacterial biomass in inland lakes (Matthews and Odermatt, 2015; Beck et al., 2017). The long-term monitoring of PC concentrations in lakes and reservoirs can help effectively track and monitor the formation, spread, and extinction of cyanobacterial blooms. Ultraviolet–visible [UV–VIS] spectrophotometry is the most commonly used method of measuring PC concentration in water; it requires cell crushing, separation and extraction, concentration determination, and other processes performs via field sampling and laboratory analysis (Zhang et al., 2014). Although the measurement accuracy of this method is high, it is difficult to effectively obtain the spatiotemporal variation of PC concentration in large-scale water bodies. Satellite remote sensing technology, which features a wide range, periodic observation and real-time dynamics, provides an important means for quantitative monitoring of water quality parameters in lakes and reservoirs. This approach can compensate for the shortcomings of water quality monitoring based on discrete sampling sites. Thus, the remote sensing retrieval of PC concentrations in lakes and reservoirs is of great significance and offers application potential for the quantitative monitoring and early warning of cyanobacterial blooms.
PC concentration in inland water has an absorption peak at ∼620 nm and a significant fluorescence peak at ∼650 nm, which distinguishes PC from other algae. Considering this optical feature, the reflection spectrum measurements of water (Guo et al., 2016; Liu et al., 2018), multispectral remote sensing images (Thematic Mapper/Enhanced Thematic Mapper [TM/ETM+], Medium Resolution Imaging Spectrometer [MERIS], Moderate Resolution Imaging Spectroradiometer [MODIS], Ocean and Land Colour Instrument [OLCI]) (Vincent et al., 2004; Tao et al., 2017; Qi et al., 2014; Miao et al., 2018) and airborne hyperspectral images (Compact Airborne Spectrographic Imager [CASI], Hyperspectral Imaging Spectroscopy [HIS]) (Beck et al., 2017; Pyo et al., 2018) have been used as remote sensing data sources, and PC concentrations in water bodies have been retrieved by establishing relationships between the remote sensing reflectance of water bodies and the PC concentration measured in recent studies (Varunan and Shanmugam, 2017; Yan et al., 2018). Envisat MERIS and Sentinel-3 OLCI images were extensively used data sources because of their high radiometric and temporal resolutions, but MERIS images were discontinued in early 2012. As the successor of the MERIS images, OLCI images have a higher spectral resolution in the spectral range of 400–900 nm, and the central wavelength of band seven is located near the absorption peak (620 nm) of PC; however, their Earth observations only began in 2016 (Tao et al., 2017; Yan et al., 2018). MODIS images have been continuously acquired since 2000, but lacks a band with a central wavelength of 620 nm. In the long-term remote sensing monitoring of PC concentration in inland water, the use of a single data source is often limited by the acquisition of weather conditions. This results in a scarcity of high-quality images and long monitoring intervals, which are not conducive to the dynamic monitoring of rapid changes in water quality. Due to the 4-years data gap between OLCI and MERIS sensors, some studies have seamlessly integrated MODIS sensor with these two sensors through cross-calibration for remote sensing algorithms, such as the maximum chlorophyll index [MCI], to generate long-term remote sensing reflectance, chlorophyll a and algal bloom remote sensing products (Wynne et al., 2021; Zeng and Binding, 2021; Tilstone et al., 2022). Therefore, for monitoring the long-term dynamics of PC concentrations in reservoirs and lakes, MODIS and OLCI images should be combined to retrieve these concentrations, and their consistency and spatial differences must be identified.
Currently, several studies on PC concentration retrieval have been performed based on measured hyperspectral data or remote sensing images. The retrieval algorithms include empirical model, semianalytical model, and machine learning model. The most common retrieval methods of PC concentration are empirical models, which establish a functional relationship between the remote sensing reflectance of a certain band (or band combinations) and measured PC concentration through statistical regression (Ma et al., 2009; Qi et al., 2014; Matsushita et al., 2015; Woźniak et al., 2016; Tao et al., 2017). However, because of differences in atmospheric conditions, water quality conditions, sensor characteristics, and other factors, there are considerable uncertainties in the relationship between water optical properties and water components, which limit the retrieval accuracy and universality of these models (Zhou et al., 2009; Vanhellemont and Ruddic, 2018). Semianalytical methods have been proposed on the basis of the inherent optical properties of water and the radiative transfer theory in water, including nested band ratio algorithms (Lyu et al., 2013; Matthews et al., 2020; Miao et al., 2020) and three-band (Song et al., 2012) and four-band algorithms (Liu et al., 2018). These methods have the well physical mechanism and strong applicability, but need several environmental input parameters, and the calculation process is complicated. Because of the application limitations of traditional empirical and semianalytical models in the spatial and temporal dimensions, many researchers have introduced machine learning [ML] regression models in the remote sensing retrieval of water quality parameters. With Sentinel-2 Multi-Spectral Imager [MSI], Landsat-8 Operational Land Imager [OLI], ENVISAT MERIS and other optical remote sensing data, different ML algorithms such as support vector machines (Keller et al., 2018; Peterson et al., 2018), artificial neural network (Riha and Krawczyk, 2011; Peterson et al., 2018), random forest [RF] regression (Miao et al., 2018; Ruescas et al., 2018; Wu et al., 2018), extreme random trees (Keller et al., 2018), and extreme learning machines (Peterson et al., 2018) have been used to train and learn a large number of water samples and simulate the complex relationship between the remote sensing reflectance of water bodies and various water quality parameters (total suspended solids, chlorophyll a, Components Of Dissolved Organic Matte [CDOM]). Their results demonstrate that the ML regression models can involve all remote sensing spectral bands and optimal band combinations as feature variables, which can improve the retrieval accuracy of water quality parameters (Ruescas et al., 2018).
Chaohu Lake is one of the five largest freshwater lakes in China. In recent years, the rapid development of surrounding towns has severely damaged the lake water environment and ecosystem, resulting in frequent outbreaks of algal blooms (Zhang et al., 2016; Huang et al., 2020; Qin et al., 2022). In this study, based on the spectral reflectance and PC concentration of Chaohu Lake measured in different seasons, the sensitive bands or band combinations of PC concentration were analyzed for the MODIS and OLCI sensors, respectively. Then, RF, K-nearest neighbor [KNN], multiple linear regression [MLR], and gradient boosted tree [GBT] regression models were developed for PC concentration retrieval from the MODIS and OLCI images that were obtained, and their accuracies were evaluated. Finally, the optimal PC concentration retrieval models were applied to MODIS and OLCI images of Chaohu Lake acquired on the same dates, and the PC concentration results retrieved from the images were compared. Our study can be a scientific reference for generating long-term PC concentration remote sensing products and for the time series monitoring of cyanobacterial blooms at Chaohu Lake.
Chaohu Lake is in the central part of Anhui Province, China, on the north bank of the lower reaches of the Yangtze River. The lake is 61.7 km long and 12.47 km wide, with an area of 769.55 km2 (Figure 1). The average water level is ∼8.37 m, and the average water depth is∼2.89 m. The eutrophication in Chaohu Lake has intensified in recent years because of pesticide and the nonpoint source pollution of farmland around the lake and the discharge of domestic sewage and industrial wastewater from surrounding cities and towns (Huang et al., 2020; Guo et al., 2022). Under the comprehensive influence of environmental factors such as nitrogen and phosphorus concentrations, temperature, wind speed, and wind direction, in the water body, cyanobacterial blooms frequently appear in Chaohu Lake from the end of May to the beginning of October every year with dense blooms concentrated in the northwest area of the lake (Zhao et al., 2018). The frequency and duration of cyanobacterial blooms in Chaohu Lake have been increasing since the 1980s, with the beginning of bloom time gradually becoming earlier and the affected area broadening (Tang et al., 2017).
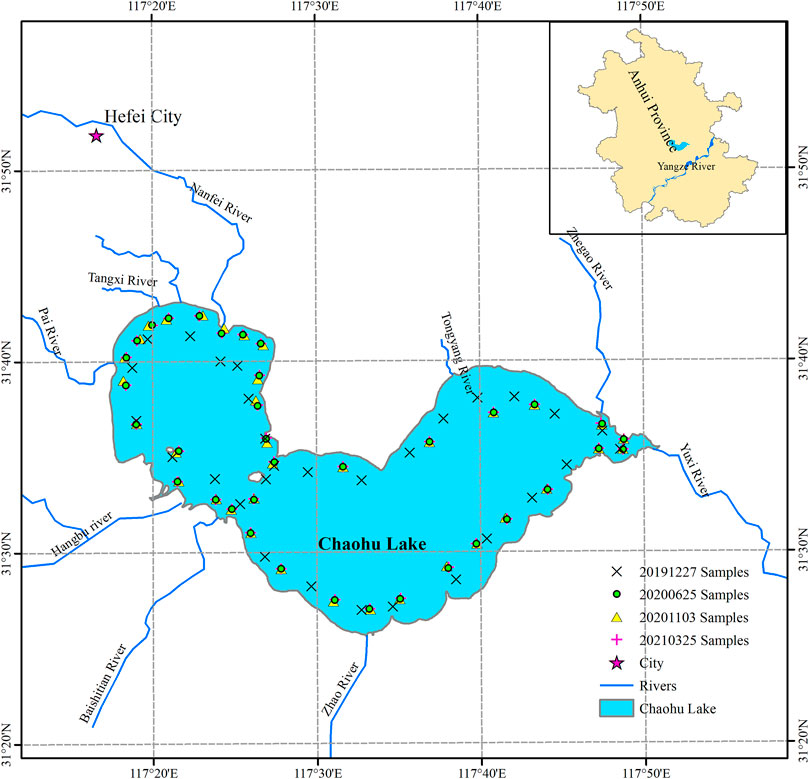
FIGURE 1. Location of Chaohu Lake and sampling sites.
In this study, four field surveys were conducted in Chaohu Lake in different seasons in 2019–2021. The survey dates were: 27 December 2019; 25 June 2020; 3 November 2020; and 25 March 2021; moreover, a total of 138 water samples were collected (Figure 1). The water samples were obtained and measured in situ from 09:00 to 14:00 (Beijing time), and the time difference with the corresponding remote sensing image was maintained in 3 h. One-Liter water samples with a maximum depth of 30 cm were collected at each sampling site using brown plastic bottles, and the geographical location of each sample was recorded using a Trimble Juno five Global Positioning System [GPS] receiver. As per the water surface measurement method proposed by Tang et al. (2004), the reflectance spectra of the water surface with wavelengths of 400–1,020 nm were also collected using an AvaField-1 spectrometer made in Netherlands, with observation azimuth and zenith angles of 135° and 40°, respectively. The following remote sensing parameters were measured: the upward radiances from water surface (Lu), scattered light from the sky (Lsky), and the downward solar radiation on a standard plate (Lp). Then the measured remote sensing reflectance (Rrs) was calculated by formula (1).
where Lu represents the radiance measured above the water surface; Lsky represents the radiance of the sky measured at a zenith angle of 45°; ρp represents the reflectance of the standard plate; Lp represents the downward radiation above the plate; ρ represents the dimensionless air–water reflection, with a constant value of 0.025.
The water samples were brought to the laboratory under refrigerated conditions (4°C), filtered, and measured for PC concentration; the sampling was performed in 24 h to prevent the decomposition of water pigments. UV-vis spectrophotometry was used to determine the PC concentrations in the water samples, based on the absorption spectral properties of PC at 500–700 nm (Pyo et al., 2017). This method is commonly used to determine PC concentration in water in laboratories, because it does not require chemical reagents, avoids secondary pollution, requires little pretreatment of water samples, enables rapid detection, and meets the requirements of online detection. The PC concentration was calculated using formula (2) which improved based on the methods proposed by Pang et al. (2014).
Where, A615, A652, A750 represent the measured absorbance of water samples at 615 nm, 652 and 750 nm, respectively, shown in Supplementary Table S1. V1 represents the original water sample volume, and V2 represents the water sample volume after fixed capacity to 15 ml.
The National Aeronautics and Space Administration [NASA] Ocean Water Color website (https://oceancolor.gsfc.nasa.gov/) provides the Rrs products (MODIS/Aqua) for surface water, which are usually used for remote sensing estimation of water color parameters such as ocean turbidity and chlorophyll concentration (Bian et al., 2013; Jiang et al., 2020); however, affected by the turbid water of Chaohu Lake, MODIS/Aqua Rrs products lacked the valid Rrs values on the four sampling dates. Therefore, MOD09GA reflectance product was used to replace the MODIS/Aqua Rrs product in this paper, which provide daily surface reflectance images from bands B1-B7, with spatial resolution of 500 m. Its projection type is sinusoidal. Each pixel contains the most probable reflectance observations for the whole day, considering the effects of a high observation coverage, low viewing angles, absence of clouds and cloud shadows, and aerosol concentrations (Tang et al., 2013; Breunig et al., 2016). In accordance with the sampling dates, MOD09GA products acquired on the four survey dates were obtained from the LAADS DAAC website (https://ladsweb.modaps.eosdis.nasa.gov/) in this paper. Then, the projection conversion of MOD09GA product was carried out by the MODIS Reprojection Tool software, and the reflectance image was extracted in the Environment for Visualizing Images [ENVI] software to obtain the Rrs values in the B1-B7 band.
The OLCI sensor is a medium-resolution imaging spectrometer aboard the Sentinel-3A and Sentinel-3B satellites. It has the features of the MERIS sensor and sets up multiple bands in the red-to-near-infrared wavelength region for the sensitive detection of phytoplankton spectral features (Yan et al., 2018). Sentinel-3 OLCI images acquired on the four survey dates were downloaded from the ESA website (https://scihub.copernicus.eu/). Then, the Case 2 Regional Coast Color [C2RCC] algorithm in Sentinel Application Platform [SNAP] software, which has been proved accurate and reliable to use with MSI and OLCI images and obtain the optical water features (Kaire et al., 2017; Uudeberg et al., 2019), was used to radiometrically correct the OLCI images, and the Rrs images were extracted using ENVI.
ML regression models can capture the rich features of input variables by constructing neural networks with complex structures to fit nonlinear relationships between input and output variables (Ruescas et al., 2018; Huang et al., 2019). In this study, we analyzed the sensitive spectral bands or band combinations of PC concentration. Then, based on the measured PC concentrations in Chaohu Lake and the remote sensing images acquired on four survey dates, we developed various PC concentration retrieval models for MODIS and OLCI images using various machine learning regression algorithms, namely, RF, extreme random tree [ERT], KNN, support vector regression [SVR], GBT, and deep neural network [DNN], and determined the best PC concentration retrieval models via accuracy evaluation.
In ML modeling, grid search is used to determine the key parameters of each model to improve the fitting accuracy and prevent overfitting (Li et al., 2014; Erten et al., 2021). The accuracy of the constructed model was evaluated via K-fold cross-validation (Kokkinos and Margaritis, 2018). The samples were sorted and randomly divided into K pieces, K-1 pieces were obtained as the training dataset, and one piece served as the validation dataset. Finally, the validation accuracy results of K times were averaged. This procedure was implemented using the Keras and Scikit-learn libraries in Python.
Existing atmospheric correction algorithms are unsuitable for MODIS images in inland water (Zhou et al., 2009). Moreover, the spatial scale conversion from field measurement to satellite observation will further increase the error of the PC retrieval value (Lehmann et al., 2021). Therefore, we adopt the retrieval method based on the measured PC concentration and the Rrs from remote sensing images to improve the accuracy of the PC concentration retrieval model.
As per the central wavelength settings of the bands in the MODIS and OLCI sensors, the correlation analysis was conducted between the measured PC concentrations and the bands or band combinations of water remote sensing reflectance (Rrs) to explore the sensitive spectral bands of PC concentration in Chaohu Lake. For the MODIS sensor, the correlation coefficient (R) between PC concentration and the Rrs in bands one and four was >0.65. These two bands were combined with other bands, and the band combinations with the highest correlations were selected as the sensitive spectral bands of PC concentration for MODIS image (Table 1). Because PC concentration in water has strong absorption characteristics at 620 nm, bands 6-12 of OLCI sensor are usually used to retrieve PC concentration (Yan et al., 2018; Ogashawara, 2019). For the OLCI sensor, the correlation coefficient between the measured PC concentration in water and the Rrs was the highest in band 7, with a central wavelength of 620 nm. This band was combined with bands 6-12, and correlation analysis was performed between the various bands and measured PC concentration. The band combinations with correlation coefficients of >0.5 were selected as the sensitive spectral bands of PC concentration for OLCI image (Table 2).
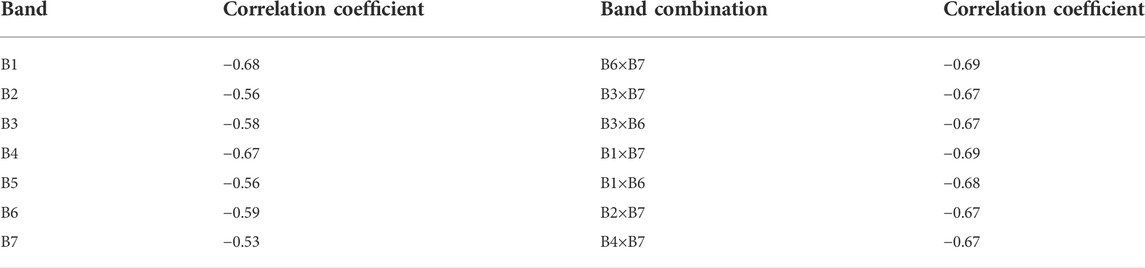
TABLE 1. Sensitive spectral bands of PC concentration for MODIS sensor.
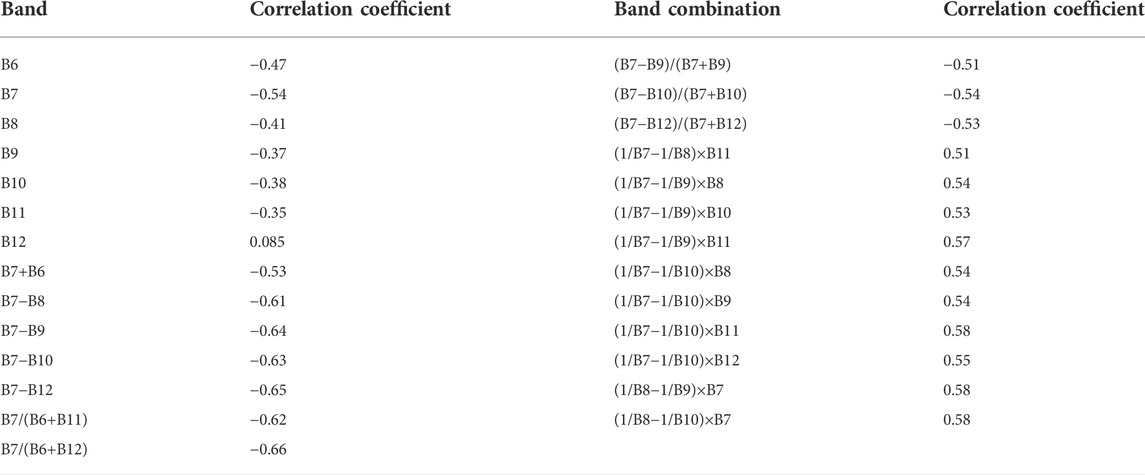
TABLE 2. Sensitive spectral bands of PC concentration for OLCI sensor.
The sensitive spectral bands in Table 1 were selected as the input variables of the PC concentration retrieval model for the MODIS images to prevent the model from over-fitting and ensure retrieval efficiency. Based on the measured PC concentration in Chaohu Lake and the sensitive spectral bands of the MODIS images acquired on the days of sampling, the ML regression algorithms in Section 2.4 were used to establish PC concentration retrieval models for MODIS images, and the models’ accuracies were confirmed via six-fold cross-validation. In the modeling based on the measured datasets, the samples are sorted in ascending order by the PC concentration values, and then randomly divided into six pieces. Five pieces were used as the training dataset and one piece developed the validation dataset. The average values were obtained to determine the training and validation accuracies of the different retrieval models. Table 3 shows the four PC concentration retrieval models with the highest accuracies.
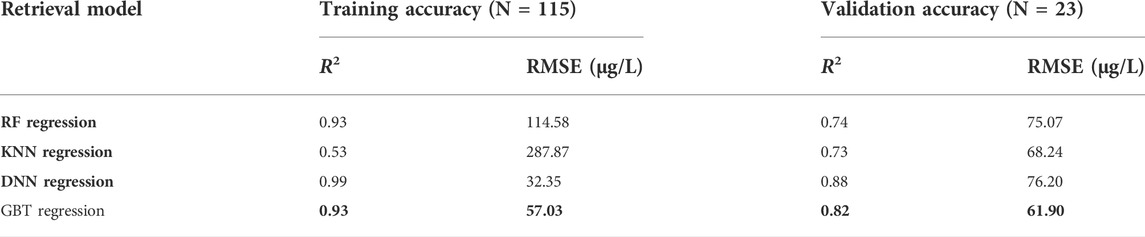
TABLE 3. Accuracy evaluation of PC concentration retrieval models for MODIS images.
Among the above PC concentration retrieval models, the RF and the KNN regression models had low validation accuracies, and the DNN regression model suffered from severe overfitting. Therefore, the GBT regression model was the optimal PC concentration retrieval model suitable for MODIS images. Then, we obtained the validation dataset in this model for testing, and compared the estimated PC concentrations in the validation samples with the measured concentrations (Figure 2A). The retrieval accuracy of the GBT regression model in our study was high (R2 = 0.82, RMSE = 61.90 μg/L, MAPE = 45.57%), which was higher than that of the hybrid empirical orthogonal function (EOF) model constructed in Chaohu Lake by Tao et al. (2017), and the corresponding sample points were mostly distributed close to the 1:1 line, which indicated that the developed GBT regression model was suitable for the remote sensing retrieval of PC concentration in water from the MODIS images.
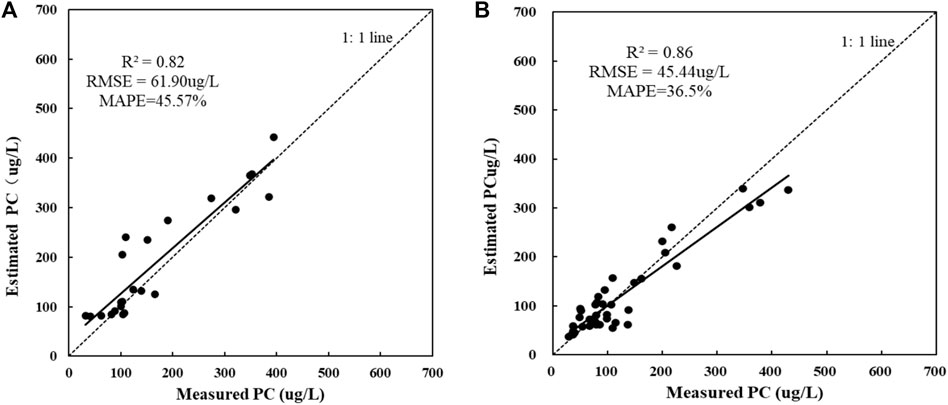
FIGURE 2. Comparison of retrieved PC concentrations (using GBT regression model) and measured concentrations. (A) MODIS images; (B) OLCI images.
For the Sentinel three OLCI images, the sensitive spectral bands in Table 2 were used as the input variables of the retrieval models, and the PC concentrations measured on the image capture dates were used as the dependent variable to develop the retrieval models of the PC concentration in Chaohu Lake using the ML regression algorithms in Section 2.4. The accuracies of the PC concentration retrieval models were evaluated via six-fold cross-validation. Table 4 shows the four PC concentration retrieval models with the highest accuracies.
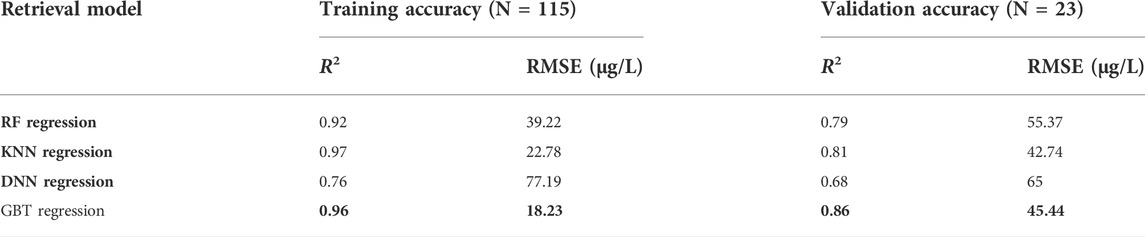
TABLE 4. Accuracy evaluation of PC concentration retrieval models for OLCI images.
Among the four machine learning regression algorithms, the GBT regression model was the optimal PC concentration retrieval model for the OLCI images, with R2, RMSE, and MAPE values reaching 0.86, 45.44 μg/L, and 36.5%, respectively. This is because GBT regression trains different weak learners by multiple iterations and assigns corresponding weights to these learners to generate strong learners (Huang et al., 2018), i.e., those that have high cross-validation accuracy on the treatment of small samples and are, more capable of handling low-dimensional and nonlinear datasets (Schonlau, 2005).
Then, the validation dataset was brought in the GBT regression retrieval model for the OLCI images to evaluate the model’s accuracy, and the retrieved PC concentrations of the validation samples were compared with the measured values (Figure 2B). The GBT regression model for OLCI images had a higher retrieval accuracy than that for MODIS images, mainly because the latter’s band setting does not cover the PC feature absorption band of 620 nm. The accuracy of the developed GBT regression model in our study (R2 = 0.86, RMSE = 45.44 μg/L, MAPE = 63.5%) is slightly lower than the RF regression model built by Miao et al. (2018). The reason may be that the validation samples we selected are from different seasons, the PC concentration values of which range much wider (36–457 μg/L). The validation samples in Figure 3B were mostly distributed around the 1:1 line, although there was a slight underestimation at higher PC concentrations (>200 μg/L) and overestimation at lower PC concentrations (<50 μg/L). Thus, the developed GBT regression retrieval model was suitable for the remote sensing retrieval of PC concentration in water from the OLCI images.
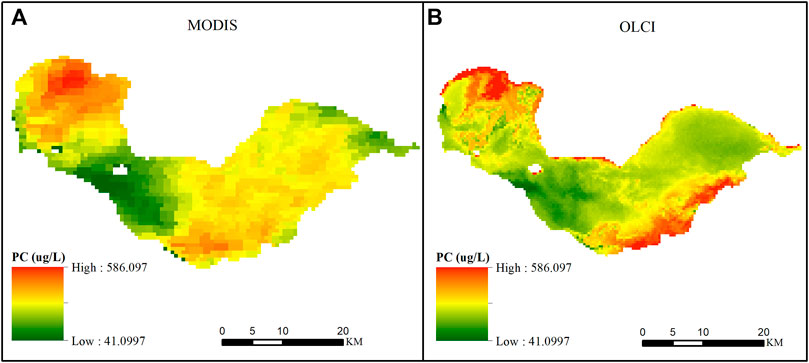
FIGURE 3. Retrieved PC concentrations in Chaohu Lake based on MODIS and OLCI images (2020-06-25). (A) MODIS image; (B) OLCI image.
The MODIS and OLCI images used in this study can provide the data source for monitoring PC concentration in water; however, there is still a lack of an ideal atmospheric correction algorithm for inland water (Miao et al., 2018; Yang et al., 2022). In this study, various atmospheric correction algorithms have been attempted to correct the water images. Among them, the C2RCC algorithm has high accuracy for the atmospheric correction of OLCI images, however, there is still a certain error. In particular, MOD09GA reflectance product contains the reflected energy from water surface, which caused the accuracy of the Rrs values inland water is not high. In addition, due to the spatial heterogeneity of PC concentrations in water bodies, the spatial scale difference between the field measurements and satellite observations in this study is also an important factor negatively affecting the performance of PC concentration retrieval models.
The PC concentration retrieval models established above using GBT regression were applied to the MODIS and OLCI images acquired on 25 June 2020 (for Bloom period) and 3 November 2020 (for No-bloom period), and the corresponding PC concentration retrieval maps in Chaohu Lake for these two periods were obtained (Figures 3, 4). As shown in Figures 3, 4, the PC concentrations in the bloom and no-bloom periods ranged from 37.77 to 586.15 μg/L, and their spatial distribution patterns were similar. In the bloom period, the PC concentrations in the central part of the lake were lower than those in other regions, and the difference between the MODIS and OLCI images was not significant. The PC concentrations in the northwestern and southeastern parts of the lake were higher than those in other areas, and the spatial heterogeneity caused by wind and waves was large, thus resulting in considerable differences between these two images. In the No-bloom period, the PC concentrations in the eastern and central parts of the lake were lower than those in other regions, and the differences between the MODIS and OLCI images were not significant. The PC concentrations in the northwestern and southeastern parts of the lake were higher than those in other areas, and the large spatial variability led to the substantial variations between these two images.
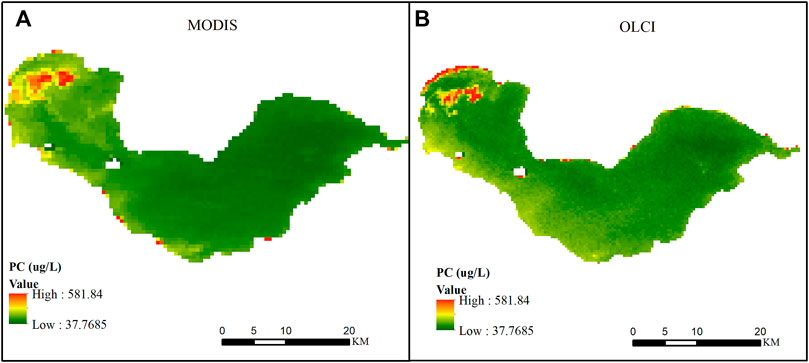
FIGURE 4. Retrieved PC concentrations in Chaohu Lake based on MODIS and OLCI images (2020-11-03). (A) MODIS image; (B) OLCI image.
For additional analysis of the spatial consistency of the retrieved concentrations, the PC concentration values retrieved from the MODIS and OLCI images acquired on 25 June 2020, and 3 November 2020, were obtained pixel by pixel, and the correlation between the two images was analyzed. As shown in Figure 5, the correlation coefficient between the PC concentrations retrieved from the MODIS and OLCI images on 25 June 2020, was ∼0.67, and the RMSE was ∼86.88 μg/L. The correlation between the PC concentrations retrieved from these two images on 3 November 2020, was higher, with a correlation coefficient of ∼0.7 and an RMSE of ∼54.06 μg/L. This phenomenon was related to the PC concentrations in Chaohu Lake and their spatial variability in different periods (Tang et al., 2017; Zhao et al., 2018). The higher PC concentration and larger spatial variability in the bloom period led to the lower correlation. However, the PC concentration in the no-bloom period decreased with temperature, and the spatial variability was smaller, thus resulting in higher correlation.

FIGURE 5. Correlation analysis of PC concentrations retrieved from MODIS and OLCI images (A) 2020-06-25; (B) 2020-11-03.
The relative errors between the concentrations retrieved from the images were calculated using the raster calculator tool of ArcGIS to examined spatial differences between the retrieved PC concentrations.
As shown in Figure 6, the relative errors between the PC concentrations retrieved from the MODIS and OLCI images acquired on 25 June 2020, were mostly <40%. The central area of the western part and the eastern part of Chaohu Lake exhibited large discrepancies. However, the relative errors between the retrieved concentrations from the MODIS and OLCI images acquired on 3 November 2020, were mostly <70%, and large differences were primarily observed in the central area of the western part of the lake and the whole eastern part. This phenomenon was primarily attributed to the poor retrieval accuracy of the proposed PC concentration retrieval model in cyanobacterial bloom areas. The relative error between the PC concentrations retrieved from the MODIS and OLCI images acquired in the no-bloom period was larger than that in the bloom period, which may be attributed to the lower PC concentration in Chaohu Lake in autumn.
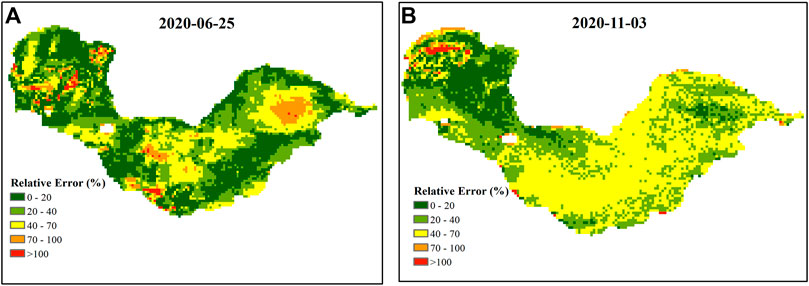
FIGURE 6. Relative errors of retrieved PC concentrations based on MODIS and OLCI images. (A) 2020-06-25; (B) 2020-11-03.
Furthermore, for MODIS images, there is currently no ideal atmospheric correction algorithm to obtain high-precision Rrs values for inland water bodies (Zhou et al., 2009; Vanhellemont and Ruddic, 2018; Yang et al., 2022). The MOD09GA reflectance product used in our paper includes the reflected radiation from the water surface, and the accuracy of Rrs values is not high, resulting in the lower PC concentration retrieval in water based on the MODIS image, which caused certain errors were expected to arise in the retrieved PC concentrations from MODIS and OLCI images acquired on the same day.
In this study, PC concentration retrieval models suitable for MODIS and OLCI images were constructed using ML regression methods, and their accuracies were evaluated. The optimal PC concentration retrieval model were then applied to MODIS and OLCI images acquired on the same days to examine the consistency and spatial differences of the retrieved concentrations. The sensitive spectral wavelength of PC concentration in water was 560–680 nm, which corresponded to bands one and four of the MODIS sensor and bands six to eight of the OLCI sensor. The PC concentration retrieval model using GBT regression exhibited the best accuracy for both images (MODIS: R2 = 0.82, RMSE = 61.9 μg/L; OLCI: R2 = 0.86, RMSE = 45.44 μg/L), thus providing a new idea for the remote sensing retrieval of water quality parameters in lakes and reservoirs. The retrieved PC concentrations from the MODIS and OLCI images had a high spatial consistency, demonstrating that the spatial distribution of PC concentration in most regions of Chaohu Lake was consistent. The correlation coefficient between the two images exceeded 0.7, with a mean relative error of 0.293 μg/L.
The above results can serve as a scientific reference for integrating MODIS and OLCI images into the long-term monitoring of PC concentration dynamics in inland water. However, the two retrieved PC concentration products in water differs substantially with high PC concentrations, because the MODIS sensor lacks an indicative band for PC concentration and lacks an ideal atmospheric correction algorithm to obtain Rrs in inland water bodies. Currently, spectral matching and neural network algorithms have been used to simulate the missing band with a central wavelength of 708 nm in MODIS sensor to generate the long-term products of cyanobacterial blooms in lakes and reservoirs (Wynne et al., 2021; Zeng and Binding, 2021). In future work, a spectral shape algorithm will be proposed to intercalibrate MODIS and OLCI sensors to effectively generate time-series PC concentration products from 2000 to 2020. In addition, the other atmospheric correction algorithms (such as l2gen, 6S) for MODIS images of inland water will be used to obtain the higher precision Rrs values.
The raw data supporting the conclusions of this article will be made available by the authors, without undue reservation.
Conceptualization, JW and YC; methodology, ZW; software, ZW and SH; validation, ZW and HY; formal analysis, YC; investigation, JW, SH, ZW; resources, JW and HY; data curation, SH; writing—original draft preparation, JW; writing—review and editing, YC; visualization, ZW; supervision, JW; project administration, YC; funding acquisition, JW and YC. All authors have read and agreed to the published version of the manuscript.
This research was funded by the National Natural Science Foundation of China (No. 32171573 and No. 41801332), the Natural science research project of colleges and universities in Anhui Province (No. KJ 2021A0178), and the Natural Science Foundation of Anhui Province (No. 201903a07020014 and No. 2008085ME158).
The authors declare that the research was conducted in the absence of any commercial or financial relationships that could be construed as a potential conflict of interest.
All claims expressed in this article are solely those of the authors and do not necessarily represent those of their affiliated organizations, or those of the publisher, the editors and the reviewers. Any product that may be evaluated in this article, or claim that may be made by its manufacturer, is not guaranteed or endorsed by the publisher.
The Supplementary Material for this article can be found online at: https://www.frontiersin.org/articles/10.3389/fenvs.2022.922505/full#supplementary-material
Beck, R., Xu, M., Zhan, S., Liu, H., Johansen, R. A., Tong, S., et al. (2017). Comparison of satellite reflectance algorithms for estimating phycocyanin values and cyanobacterial total biovolume in a temperate reservoir using coincident hyperspectral aircraft imagery and dense coincident surface observations. Remote Sens. (Basel). 9, 538. doi:10.3390/rs9060538
Bian, C. W., Jiang, W. S., Quan, Q., Wang, T., Greatbatchb, R. J., Wei, L., et al. (2013). Distributions of suspended sediment concentration in the Yellow Sea and the East China Sea based on field surveys during the four seasons of 2011. J. Mar. Syst. 121–122 (5), 24–35. doi:10.1016/j.jmarsys.2013.03.013
Breunig, F. M., Pereira, W., Galvao, L. S., and Wachholz, F. (2016). Assessing the long-term variability of TSS and chlorophyll in subtropical reservoirs using MODIS data. IEEE J. Sel. Top. Appl. Earth Obs. Remote Sens. 9 (12), 5406–5412. doi:10.1109/jstars.2016.2589820
Erten, G. E., Keser, S. B., and Yavuz, M. (2021). Grid search optimised artificial neural network for open stope stability prediction. Int. J. Min. Reclam. Environ. 35 (8), 600–617. doi:10.1080/17480930.2021.1899404
Guo, H. L., Liu, H. Q., Lyu, H., Bian, Y. C., Zhong, S. K., Li, Y. Y., et al. (2022). Is there any difference on cyanobacterial blooms patterns between Lake Chaohu and Lake Taihu over the last 20 years? Environ. Sci. Pollut. Res. 29, 40941–40953. doi:10.1007/s11356-021-18094-x
Guo, Y. Y., Zhu, L., Wu, C. Q., Li, J. S., and Zhang, F. F. (2016). The retrieval of phycocyanin concentrations in Taihu Lake based on water reflectance spectra classification. Acta Sci. Circumstantiae 36 (8), 2905–2910.
Huang, J. C., Ko, K. M., Shu, M. H., and Hsu, B. M. (2019). Application and comparison of several machine learning algorithms and their integration models in regression problems. Neural comput. Appl. 32 (11), 5461–5469. doi:10.1007/s00521-019-04644-5
Huang, J. C., Zhang, Y. J., Arhonditsis, G. B., Gao, J. F., Chen, Q. W., Peng, J., et al. (2020). The magnitude and drivers of harmful algal blooms in China's lakes and reservoirs: A national-scale characterization. Water Res. 181, 115902. doi:10.1016/j.watres.2020.115902
Huang, Y. F., Liu, Y. H., Li, C. H., and Wang, C. B. (2018). GBRTVis: Online analysis of gradient boosting regression tree. J. Vis. (Tokyo). 22 (1), 125–140. doi:10.1007/s12650-018-0514-2
Jiang, L. L., Guo, X. Y., Wang, L., Sathyendranath, S., Evers-King, H., Chen, Y. L., et al. (2020). Validation of MODIS ocean-colour products in the coastal waters of the yellow sea and east China sea. Acta Oceanol. Sin. 39 (1), 91–101. doi:10.1007/s13131-019-1522-3
Kaire, T., Tiit, K., Rivo, U., Age, A., Kaimo, V., Birgot, P., et al. (2017). Mapping water quality parameters with Sentinel-3 Ocean and land colour instrument imagery in the Baltic Sea. Remote Sens. 9 (10), 1070. doi:10.3390/rs9101070
Keller, S., Maier, P. M., Riese, F. M., Norra, S., Holbach, A., Borsig, N., et al. (2018). Hyperspectral data and machine learning for estimating CDOM, chlorophyll a, diatoms, green algae and turbidity. Int. J. Environ. Res. Public Health 15, 1881. doi:10.3390/ijerph15091881
Kokkinos, Y., and Margaritis, K. G. (2018). Managing the computational cost of model selection and cross-validation in extreme learning machines via Cholesky, SVD, QR and eigen decompositions. Neurocomputing 295, 29–45. doi:10.1016/j.neucom.2018.01.005
Lehmann, M. K., Schuett, E. M., Hieronymi, M., Dare, J., and Krasemann, H. (2021). Analysis of recurring patchiness in satellite-derived chlorophyll a to aid the selection of representative sites for lake water quality monitoring. Int. J. Appl. Earth Observation Geoinformation 104, 102547. doi:10.1016/j.jag.2021.102547
Li, L., Zhang, X. L., Zhang, K., and Liu, J. (2014). Bilinear grid search strategy based support vector machines learning method. Informatica 38, 51–58.
Liu, G., Simis, S. G. H., Li, L., Wang, Q., Li, Y., Song, K., et al. (2018). A four-band semi-analytical model for estimating phycocyanin in inland waters from simulated MERIS and OLCI data. IEEE Trans. Geosci. Remote Sens. 56 (3), 1374–1385. doi:10.1109/tgrs.2017.2761996
Lyu, H., Wang, Q., Wu, C. Q., Zhu, L., Yin, B., Li, Y. M., et al. (2013). Retrieval of phycocyanin concentration from remote-sensing reflectance using a semi-analytic model in eutrophic lakes. Ecol. Inf. 18, 178–187. doi:10.1016/j.ecoinf.2013.09.002
Ma, R. H., Kong, W. J., Duan, H. T., and Zhang, S. X. (2009). Quantitative estimation of phycocyanin concentration using MODIS imagery during the period of cyanobacteria blooming in Taihu Lake. China Environ. Sci. 29 (3), 254–260.
Matsushita, B., Yang, W., Yu, G. L., Yoshimura, K., and Fukushima, T. (2015). A hybrid algorithm for estimating the chlorophyll-a concentration across different trophic states in Asian inland waters. ISPRS J. Photogrammetry Remote Sens. 102, 28–37. doi:10.1016/j.isprsjprs.2014.12.022
Matthews, M. W., Bernard, S., Evers-King, H., and Lain, L. R. (2020). Distinguishing cyanobacteria from algae in optically complex inland waters using a hyperspectral radiative transfer inversion algorithm. Remote Sens. Environ. 248, 111981. doi:10.1016/j.rse.2020.111981
Matthews, M. W., and Odermatt, D. (2015). Improved algorithm for routine monitoring of cyanobacteria and eutrophication in inland and near-coastal waters. Remote Sens. Environ. 156, 374–382. doi:10.1016/j.rse.2014.10.010
Miao, S., Li, Y. Y., Wu, Z. M., Lyu, H., Li, Y. M., Bi, S., et al. (2020). A semianalytical algorithm for mapping proportion of cyanobacterial biomass in eutrophic inland lakes based on OLCI data. IEEE Trans. Geosci. Remote Sens. 58 (7), 5148–5161. doi:10.1109/tgrs.2020.2973400
Miao, S., Wang, R., Li, J. C., Wu, Z. M., Shi, L., Lyu, H., et al. (2018). Retrieval algorithm of phycocyanin concentration in inland lakes from Sentinel 3A-OLCI images. J. Infrared Millim. Waves 37 (5), 621–630. doi:10.11972/j.issn.1001-9014.2018.05.016
Ogashawara, I. (2019). The use of Sentinel-3 imagery to monitor cyanobacterial blooms. Environments 6 (6), 60. doi:10.3390/environments6060060
Pang, X. Y., Duan, H. T., Zhang, Y. C., and Ma, R. H. (2014). Comparison of the extraction methods of phycocyanin pigments in eutrophic lake waters. J. Lake Sci. 26 (5), 799–806. doi:10.18307/2014.0519
Peterson, K. T., Sagan, V., Sidike, P., Cox, A., and Martinez, M. (2018). Suspended sediment concentration estimation from Landsat imagery along the lower Missouri and middle Mississippi rivers using an extreme learning machine. Remote Sens. 10, 1503. doi:10.3390/rs10101503
Pyo, J. C., Pachepsky, Y., Baek, S. S., Kwon, Y., Kim, M., Lee, H., et al. (2017). Optimizing semi-analytical algorithms for estimating chlorophyll-a and phycocyanin concentrations in inland waters in korea. Remote Sens. 9 (6), 542. doi:10.3390/rs9060542
Pyo, J., Ligaray, M., Kwon, Y., Ahn, M. H., Kim, K., Lee, H., et al. (2018). High-spatial resolution monitoring of phycocyanin and chlorophyll-a using airborne hyperspectral imagery. Remote Sens. 10, 1180. doi:10.3390/rs10081180
Qi, L., Hu, C. M., Duan, H. T., Cannizzaro, J., and Ma, R. H. (2014). A novel MERIS algorithm to derive cyanobacterial phycocyanin pigment concentrations in a eutrophic lake: Theoretical basis and practical considerations. Remote Sens. Environ. 9, 298–317. doi:10.1016/j.rse.2014.08.026
Qin, X. M., Xia, W., Hu, X. X., and Shao, Z. (2022). Dynamic variations of cyanobacterial blooms and their response to urban development and climate change in Lake Chaohu based on Landsat observations. Environ. Sci. Pollut. Res. 29, 33152–33166. doi:10.1007/s11356-022-18616-1
Riha, S., and Krawczyk, H. (2011). Development of a remote sensing algorithm for cyanobacterial phycocyanin pigment in the Baltic Sea using neural network approach. Proc. SPIE 8175, 1–7. doi:10.1117/12.898081
Ruescas, A. B., Hieronymi, M., Mateo-Garcia, G., Koponen, S., Kallio, K., and Camps-Valls, G. (2018). Machine learning regression approaches for colored dissolved organic matter (CDOM) retrieval with S2-MSI and S3-OLCI simulated data. Remote Sens. 10, 786. doi:10.3390/rs10050786
Schonlau, M. (2005). Boosted regression (boosting): An introductory tutorial and a Stata plugin. Stata J. 5 (3), 330–354. doi:10.1177/1536867x0500500304
Song, K. S., Li, L., Li, S., Tedesco, L., Hall, B., Li, Z. C., et al. (2012). Hyperspectral retrieval of phycocyanin in potable water sources using genetic algorithm-partial least squares (GA-PLS) modeling. Int. J. Appl. Earth Observation Geoinformation 18, 368–385. doi:10.1016/j.jag.2012.03.013
Tang, H. R., Yu, K., Hagolle, O., Jiang, K., Geng, X. R., Zhao, Y., et al. (2013). A cloud detection method based on a time series of modis surface reflectance images. Int. J. Digital Earth 6 (1), 157–171. doi:10.1080/17538947.2013.833313
Tang, J. W., Tian, G. L., Wang, X. Y., Wang, X. M., and Song, Q. J. (2004). The methods of water Spectra measurement and analysis I: Above-water method. Natl. Remote Sens. Bull. (01), 37–44. doi:10.11834/jrs.20040106
Tang, X. X., Shen, M., and Duan, H. T. (2017). Temporal and spatial distribution of algal blooms in Lake Chaohu, 2000-2015. J. Lake Sci. 29 (2), 276–284. doi:10.18307/2017.0203
Tao, M., Duan, H. T., Cao, Z. G., Loiselle, S. A., and Ma, R. (2017). A hybrid EOF algorithm to improve MODIS cyanobacteria phycocyanin data quality in a highly turbid lake: Bloom and nonbloom condition. IEEE J. Sel. Top. Appl. Earth Obs. Remote Sens. 10, 4430–4444. doi:10.1109/jstars.2017.2723079
Tilstone, G. H., Pardo, S., Simis, S. G. H., Qin, P., Selmes, N., Dessailly, D., et al. (2022). Consistency between satellite ocean colour products under high coloured dissolved organic matter absorption in the baltic sea. Remote Sens. 14, 89. doi:10.3390/rs14010089
Uudeberg, K., Ansko, I., Poru, G., Ansper, A., and Reinart, A. (2019). Using optical water types to monitor changes in optically complex inland and coastal waters. Remote Sens. 11 (19), 2297. doi:10.3390/rs11192297
Vanhellemont, Q., and Ruddic, K. (2018). Atmospheric correction of metre-scale optical satellite data for inland and coastal water applications. Remote Sens. Environ. 216, 586–597. doi:10.1016/j.rse.2018.07.015
Varunan, T., and Shanmugam, P. (2017). An optical tool for quantitative assessment of phycocyanin pigment concentration in cyanobacterial blooms within inland and marine environments. J. Gt. Lakes. Res. 43, 32–49. doi:10.1016/j.jglr.2016.11.001
Vincent, R. K., Qin, X., Mckay, R. M. L., Miner, J., Czajkowski, K., Savino, J., et al. (2004). Phycocyanin detection from LANDSAT TM data for mapping cyanobacterial blooms in Lake Erie. Remote Sens. Environ. 89 (3), 381–392. doi:10.1016/j.rse.2003.10.014
Woźniak, M., Bradtke, K. M., Darecki, M., and Krezel, A. (2016). Empirical model for phycocyanin concentration estimation as an indicator of cyanobacterial bloom in the optically complex coastal waters of the baltic sea. Remote Sens. 8 (3), 212. doi:10.3390/rs8030212
Wu, Z. M., Li, J. C., Wang, R., Shi, L., Miao, S., Lyu, H., et al. (2018). Estimation of CDOM concentration in inland lake based on random forest using Sentinel-3A OLCI. J. Lake Sci. 30 (4), 979–991. doi:10.18307/2018.0411
Wynne, T. T., Mishra, S., Meredith, A., Litaker, R. W., and Stumpf, R. P. (2021). Intercalibration of MERIS, MODIS, and OLCI satellite imagers for construction of past, present, and future cyanobacterial biomass time series. Remote Sens. 13, 2305. doi:10.3390/rs13122305
Yan, Y., Bao, Z. J., and Shao, J. G. (2018). Phycocyanin concentration retrieval in inland waters: A comparative review of the remote sensing techniques and algorithms. J. Gt. Lakes. Res. 44, 748–755. doi:10.1016/j.jglr.2018.05.004
Yang, H. B., Kong, J. L., Hu, H. H., Du, Y., Gao, M. Y., Chen, F., et al. (2022). A review of remote sensing for water quality retrieval: Progress and challenges. Remote Sens. 14 (8), 1770. doi:10.3390/rs14081770
Yang, L. Y., Yang, X. Y., Ren, L. M., Qian, X., and Xiao, L. (2019). Mechanism and control strategy of cyanobacterial bloom in Lake Taihu. J. Lake Sci. 31 (1), 18–27. doi:10.18307/2019.0102
Zeng, C. Q., and Binding, C. E. (2021). Consistent multi-mission measures of inland water algal bloom spatial extent using MERIS, MODIS and OLCI. Remote Sens. 13, 3349. doi:10.3390/rs13173349
Zhang, J., Wei, Y. C., Wang, G. X., Cheng, C. M., and Xia, X. R. (2014). UV-Vis spectrum characteristics of phycocyanin in water from Taihu Lake. Spectrosc. Spectr. Analysis 34 (05), 1297–1301. doi:10.3964/j.issn.1000-0593(2014)05-1297-05
Zhang, M., Zhang, Y. C., Yang, Z., Wei, L. J., Yang, W. B., Chen, C., et al. (2016). Spatial and seasonal shifts in bloom-forming cyanobacteria in Lake Chaohu: Patterns and driving factors. Phycol. Res. 64 (1), 44–55. doi:10.1111/pre.12112
Zhao, H., Zhu, L., Wu, C. Z., Meng, B., Zhou, Y. M., and Jia, X. (2018). Distribution characteristics analysis of algal bloom in Chaohu Lake based on the sky-earth collaborative method. China Environ. Sci. 38 (6), 2297–2303. doi:10.3969/j.issn.1000-6923.2018.06.033
Keywords: remote sensing retrieval, MODIS image, OLCI image, phycocyanin concentration, spatial consistency
Citation: Wang J, Wang Z-c, Cui Y-h, Hao S and Yi H-y (2022) Comparison of phycocyanin concentrations in Chaohu Lake, China, retrieved using MODIS and OLCI images. Front. Environ. Sci. 10:922505. doi: 10.3389/fenvs.2022.922505
Received: 18 April 2022; Accepted: 06 July 2022;
Published: 26 July 2022.
Edited by:
Marco Casazza, Surgery and Dentistry / University of Salerno, ItalyReviewed by:
Yanbin Li, Ocean University of China, ChinaCopyright © 2022 Wang, Wang, Cui, Hao and Yi. This is an open-access article distributed under the terms of the Creative Commons Attribution License (CC BY). The use, distribution or reproduction in other forums is permitted, provided the original author(s) and the copyright owner(s) are credited and that the original publication in this journal is cited, in accordance with accepted academic practice. No use, distribution or reproduction is permitted which does not comply with these terms.
*Correspondence: Jie Wang, d2FuZ2ppZUBhaHUuZWR1LmNu; Yu-huan Cui, Y3VpeWhAYWhhdS5lZHUuY24=
Disclaimer: All claims expressed in this article are solely those of the authors and do not necessarily represent those of their affiliated organizations, or those of the publisher, the editors and the reviewers. Any product that may be evaluated in this article or claim that may be made by its manufacturer is not guaranteed or endorsed by the publisher.
Research integrity at Frontiers
Learn more about the work of our research integrity team to safeguard the quality of each article we publish.