 Xiaohu Dang
 Lin Li
 Liangxin Fan
- 1College of Geology and Environment, Xi’an University of Science and Technology, Xi’an, China
- 2School of Surveying and Land Information Engineering, Henan Polytechnic University, Jiaozuo, Henan, China
Increasing water demand due to population growth and urbanization causes cities in arid and semiarid regions in China to face increasing water scarcity. Understanding the spatiotemporal patterns of water consumption and its driving factors is of considerable importance in formulating public policy and alleviating the urban water crisis. In this study, spatiotemporal variations of water consumption in 42 cities in Northwest China were identified, and their influencing factors were determined by cluster tree and factor analyses. Results indicate that per capita household water consumption decreased by 9.5% from 2003 to 2020, with significant spatiotemporal variations decreasing in cities with medium consumption (86.87–193.66 L/d per capita per day) but increasing in cities with low (<86.87 L/d per capita per day) and high consumption (>193.66 L/d per capita per day). The influencing factors vary across the three types of cities. An increase in the capacity of water supply and popularization of washing machines are the main reasons for the rise in water consumption for low and high-consumption cities, whereas the implementation of water-saving activities and improvements of reuse rate are the main reasons for reduction of water consumption for medium-consumption cities. Findings suggest that improving water-saving appliances and water-use efficiency in cities with high-water consumption and increasing water supply capacity in cities with low-water consumption requires consideration in urban sustainable water management strategies in Northwest China.
1 Introduction
Water scarcity is an emerging threat to sustainable development. It is caused by the rising water demand by increasing population and urbanization (Zhu and Chang, 2020). In 2020, approximately 63.9% of China’s population lived in urban areas, compared with that of 36.2% urban population in 2000 (NBSC, 2021). By 2050, 76% of China’s population, with an additional 279 million, are estimated to live in urban settlements (Nations, 2015). As the urban population grows, the endless demand of fresh water, uneven water endowment, and limited capacity of water supply have caused many cities in China to face increasing water shortages. Since 2010, out of the 668 cities in China, over 400 have experienced water scarcity, with at least 100 reaching severe conditions (Feng et al., 2017). In Northwest China, with its low precipitation of 230 mm and high evaporation of 1,200 mm per year (Chen et al., 2012) causing limited ground water endowment of 137.95 billion m3, cities suffer from severe water shortages.
To meet water demands, cities overuse their groundwater. An example is the Xi’an city in Northwest China where the groundwater level dropped by 20.6 m and the surface subsidence occurred at a maximum annual subsidence rate of approximately 146 mm/a (Li et al., 2018). The rising water demand has also led to an increasing use of surface water. In the Wei River Basin of North China, the surface runoff decreased by 26.6%, approximately 1.92 billion m3, because of agricultural production and urbanization during the period of 1971–2006 (Chang et al., 2015). Therefore, under severe water shortages, strategies to ensure sustainable water supply and to reduce household consumption remains a challenge in the cities of Northwest China.
Literature reports that residential water consumption is affected by climate features (e.g., precipitation, temperature) (Akuoko-Asibey et al., 1993; Rasifaghihi et al., 2020) and socioeconomic characteristics (e.g., population, water supply mode, water price) (Simukonda et al., 2018; Espey et al., 1997), household structure (e.g., household size, income, education) (Bich-Ngoc et al., 2022; Nieswiadomy and Molina 1989; Thompson and Stoutemyer 1991), and water-use behaviors (e.g., water-saving awareness, water-based appliances) (Syme et al., 1990; Geller et al., 1983; Carragher et al., 2012). In Phoenix, Unites States, Balling and Gober (2007) found that when annual precipitation decreases by 10%, the per capita water consumption of residents’ increases by 3.9%. In East Doncaster, Australia, Gato et al., (2007) also found that residential water consumption increased in hot summers and decreased during cool winters, the former being caused by the increase in the frequency of bathing, laundry, and courtyard water use. In Germany, water consumption per capita is, however, highly affected by price, which increased by 11% and caused a fall of 30% in water consumption (Schleich and Hillenbrand, 2009).
High-income households consume more water than low-income households (Nauges and Thomas, 2000). Eight water agencies in California (Renwick and Green 2000) observed that a 10% increase in income can increase household water demand by 2.5%. High-income families usually have more water facilities and greater external water use than low-income families (Barnett et al., 2020). Whitcomb (1991) found that households with a dishwasher consumed 21% more water than those without a dishwasher in Contra Costa County, United States in Phoenix, United States, Wentz and Gober (2007) found the proportion of households with swimming pools is the main reason for the increase in total water consumption. In addition, Nieswiadomy (1992) found that water consumption of residents is negatively correlated with their education level. Households with better education often have high environmental awareness, and are more likely to use water-saving devices and adopt conservation practices (Oliver, 1999; Wang et al., 2020). Water-saving equipment and subsidies are considered to be effective solutions to water management. Bartos and Chester (2014) investigated the benefits of water-saving practices in Arizona, United States, and showed that such appropriate behaviors can reduce regional water consumption by 1.9–15%.
In Northwest China, the main source of water consumption is household use, accounting for >80% of the total urban water use (NBSC, 2021). Thus, an understanding of household water consumption and its determinants in cities of Northwest China can help to improve the urban water-use efficiency and inform resource management strategies.
Although existing research provides a wide discussion on the influencing factors of urban residential water consumption, the same topics in water-stressed areas of Northwest China remain largely unknown, particularly in the context of climate change and urbanization. For example, the main factor for the increase of household water consumption in Xi’an is economic growth (Yang et al., 2019), but it was temperature in Urumqi (Yan, 2013). To discover the factors that affect household water consumption in the cities of Northwest China and provide effective water management strategies, we selected 42 major cities as the research sample. The objectives of this study were to 1) identify profiles of urban household consumption in Northwest China; 2) determine the factors that affect urban household consumption; and 3) explore and recommend policies and strategies for alleviating water crisis and achieving urban sustainable water management.
2 Materials and methods
2.1 Study area
According to Qian et al. (2004), Northwest China includes 55 prefecture-level cities considering the natural climate. Because of limited data availability, we selected 42 prefecture-level cities in Northwest China.
The region of Northwest China (73.7°–126.0°E, 31.7°–53.4°N; Figure 1) is the inner part of the Eurasian continent, and it includes the provinces of Xinjiang, Ningxia, Shaanxi, Gansu, Qinghai, and Inner Mongolia. This region covers an area of 3.69 × 10⁶ km2, or 38.4% of the nation’s land. Northwest China has a typical temperate continental climate, with the driest and most vulnerable ecological environment in the country (Chen et al., 2012).
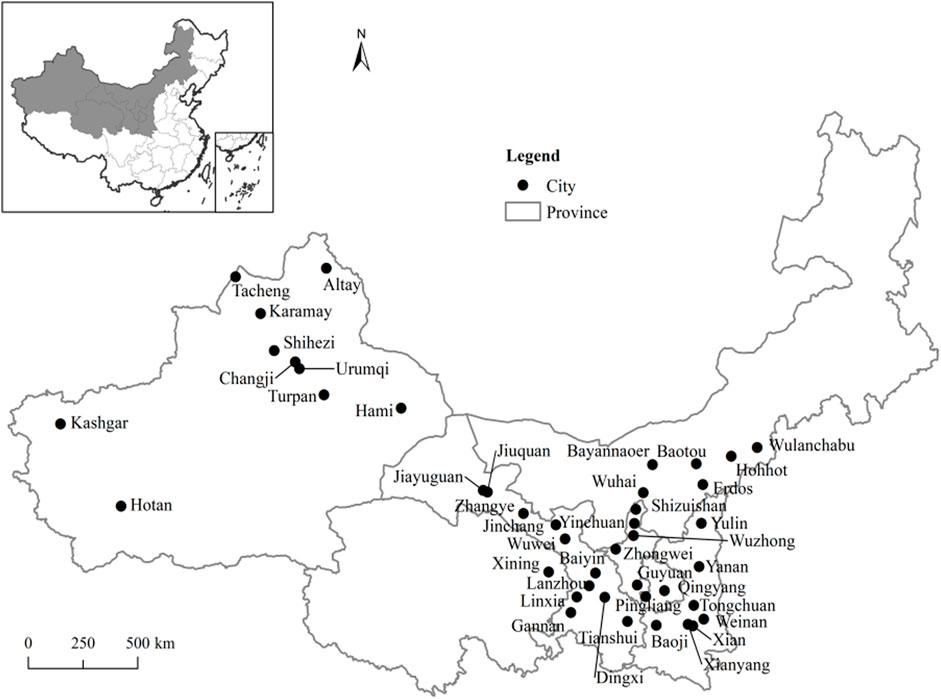
FIGURE 1. Location of study area. Note: The data of the map come from the National Geomatics Center of China (Available at ngcc. cn/ngcc/html/1/391/392/16114. html).
At the end of 2020, Northwest China had a population of 127.63 million, with an urbanization rate of 60.28%. The total water consumption is 105.98 billion m3 per year, accounting for 18.23% of water consumption in China. Approximately 80.37% of the total water consumption is used for agriculture, and only 6.02% is for household use (NBSC, 2021). Despite being <10%, water consumption for household use has received wide attention because of limitations in water delivery, high costs in water processing, and unpredictable increase in demands caused by economic growth and the popularization of water appliances.
2.2 Variables of residents’ water consumption
2.2.1 Population and sociodemographic characteristics
The accelerated urbanization of the population is considered as the major cause of discrepancy between water demand and supply, as growing populations increase water demands and intensify competition for scarce resources in arid and semiarid areas (Martin-Carrasco et al., 2013). Population density and growth rates are popular means of describing human demands on water resources (Renwick and Archibald, 1998; March and Saurí, 2010). Cities with high population densities are found to reduce household water demand through small residential areas and outdoor space and have high efficiency in water use (Hummel and Lux, 2007).
Apart from urban population, other sociodemographic determinants are education background and water-saving awareness. Environmental attitudes increase the possibility that people undertake environmental actions, and education improves the environmental behavior of residents in their daily water use (OECD, 2011).
2.2.2 Economic factors
The influence of income on household water use is difficult to assess. High income enables people to buy more goods and services that thereby affect water resources, regardless of their effects on water stress. For example, water-saving appliances are relatively expensive, but the process of using them can reduce operating costs (OECD, 2011). In converse, the cost of taking the time to reuse water is likely to be much greater for high-income households, while low-income households are more likely to develop water-conservation behaviors (Martinez-Espineira and Garcia-Valiñas, 2013).
Many studies focusing on water use consider the effect of water price on people’s water demand, and this impact has elasticity (Agthe and Billings, 1980; Espey et al., 1997). For a long time, the Chinese government has set low-water prices to ensure the normal water use by the people. Water charges account for a very small proportion of most households’ incomes, and thus strong economic incentives are too few to encourage people to save water (Arbués and Villanúa, 2006).
2.2.3 Urban water supply and water saving
The rising urban total water demand promotes the construction of new water supply facilities in cities. However, urban water supply is highly influenced by water resource endowment, especially in areas with scarce water resources (Li et al., 2020). Water supply capacity also varies greatly across cities. Wealthier cities have sufficient resources to build better water supply systems, some of which even obtain sufficient water quantities from distant places (McDonald et al., 2014).
The progress of water-saving technology has also an inhibitory effect on water consumption. Government investments in water-saving education and activities are found to reduce the daily water demand of urban residents (Nieswiadomy, 1992; Barnett et al., 2020).
2.2.4 Household water appliances
Household water consumption is directly related to the quantity and frequency of use of various water appliances, such as toilets, shower water heaters, washing machines, and faucets (Inman and Jeffrey, 2006; Gato et al., 2011). More than half of the various terminal water is used for showers and laundry (Roshan and Kumar, 2020; Willis et al., 2013).
As previously discussed, this study selected 11 factors that may potentially affect household water consumption as explanatory variables. The factors can be grouped into four aspects: population, including urban population, urban population density, and ratio of high education received; economic, including built-up area, gross domestic product (GDP) per capita and disposable income of urban households; water supply and water-saving factors, including water supply capacity per day, ratio of water saving and reuse and investment in water conservation; and water appliances including number of washing machines and of water heaters for showering. Data were derived from the China City Statistical Yearbook and collected from the Chinese city statistics (available at eng.acmr.com.cn/member/city/).
2.3 Data analysis
To analyze the variations of residents’ water consumption characteristics, we adopted the hierarchical clustering method using the SPSS version 23.0 platform to cluster the 42 cities in Northwest China. In hierarchical clustering, the square Euclidean distance was employed to represent the similarity between the groups, gradually obtained by using the intergroup connection, to determine the best number of clusters. The K-means method allows cities with similar characteristics of residential daily water-use characteristics to be grouped into the same cluster, according to the predetermined number of groups. The water consumption of urban residents in each group shows high internal similarity and prominent differences. Simple correlation analyses are carried out to identify potential factors that affect water consumption. Statistical significance is set at p < 0.05. Given the possibility of multicollinearity among the variables (factors) and its effect on outcomes, we use factor analysis to eliminate collinearity and identify key factors across each cluster city.
3 Results
3.1 Urban household water consumption in Northwest China
Total household water consumption in urban Northwest China increased by 74.6%, from 1.22 billion m3 in 2003 to 2.13 billion m3 in 2020 (Figure 2A). The liters per capita per day (LPCD) of urban residents decreased by approximately 9.5% from 168.63 L in 2003 to 152.58 L in 2020 (Figure 2B). Cluster analysis was carried out on the water consumption of 42 cities, which were divided into three clusters, as follows: cluster 1—17 cities and LPCD <86.87 ± 25.45 L, considered as low-consumption city; cluster 2—10 cities, 86.87 ± 25.45 L < LPCD <193.66 ± 24.81 L, considered as medium-consumption city; and cluster 3—15 cities, LPCD >193.66 ± 24.81 L, considered as high-consumption city (Figure 3). The three cluster cities have significant spatial heterogeneity. Cluster 3 is concentrated in the central and northwest, while cluster 1 is located in the southeast of the study area (Figure 4). Water consumption change also varied across the types of cities from 2003 to 2020 (Figure 5). Thus, in cluster 1, twelve cities showed significant changes (8 cities increased, p < 0.05; 4 cities decreased, p < 0.05). In cluster 3, six cities experienced significant changes (5 cities increased, p < 0.05; 1 city decreased, p < 0.05), and in cluster 2, five cities showed a significant decrease (p < 0.05).
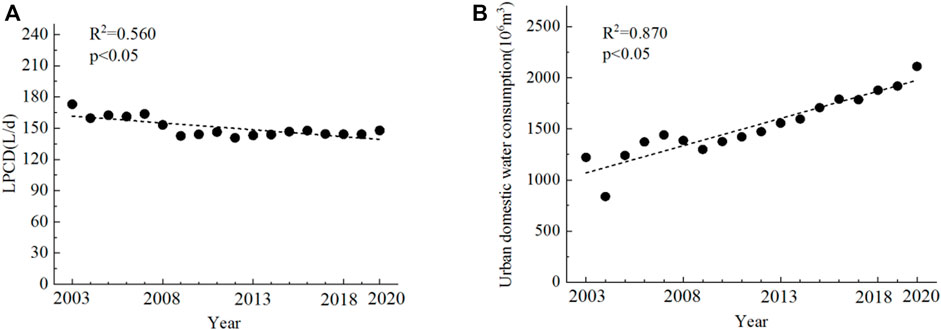
FIGURE 2. Profiles of urban domestic water consumption in Northwest China. Note: (A,B) represent liters of water consumption per capita per day (LPCD) and total water consumption of urban residents, respectively.
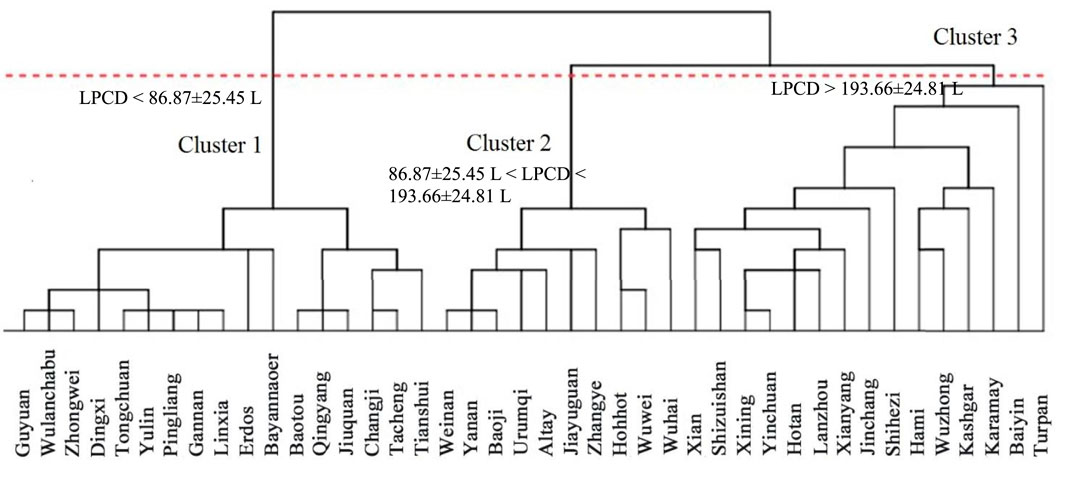
FIGURE 3. Clusters of liters per capita per day in 42 cities located in Northwest China. Note: The dashed red line corresponds to a classification cut-point.
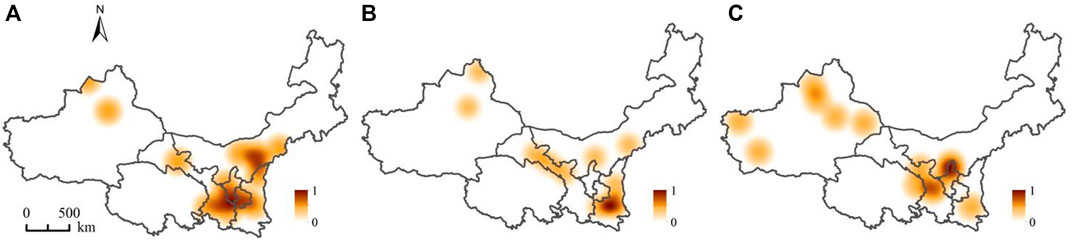
FIGURE 4. Spatial distribution of cities based on water consumption. Note: (A–C) represent the cities of clusters 1, 2, and 3, respectively. Value 1 and 0 in the map represents highest spatial aggregation (1) and none spatial agglomeration (0) of cities.
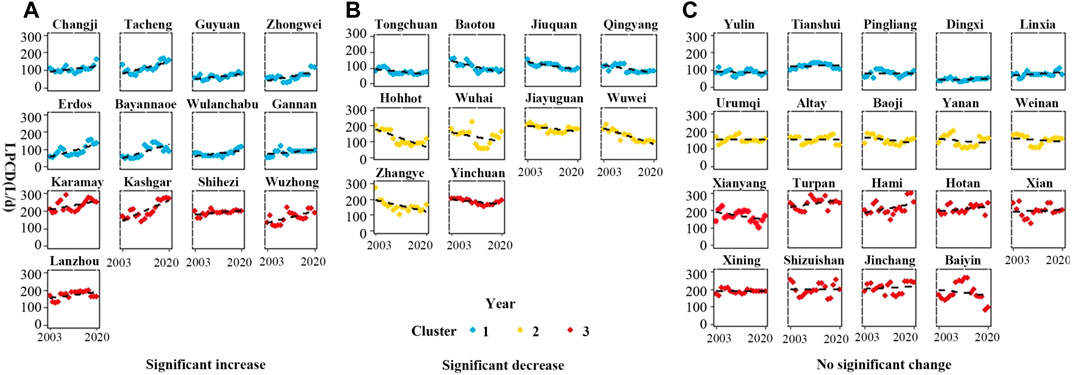
FIGURE 5. Changes of liters per capita per day in the three clusters. Note: (A–C) represents cities with significant increase, significant decrease and no significant change of water consumption from year of 2003 to year of 2020, respectively.
3.2 Changes of household water consumption among cluster cities
The changes in LPCD among three cluster cities vary. Thus, from 2003 to 2020, the LPCDs of clusters 1 and 3 increased from 85.20 and 189.37 L to 100.22 and 222.51 L, an increase of 17.63 and 17.50%, respectively. For cluster 2, the LPCDs decreased from 178.27 to 133.78 L, a decrease of 25.0%. The gaps of LPCD between clusters 2 and 3 becomes larger, where the significant difference appears since 2005 (p > 0.05). By contrast, the gaps of LPCD between clusters 1 and 2 are narrowing, and no significant difference is observed since 2018 (p > 0.05) (Figure 6).
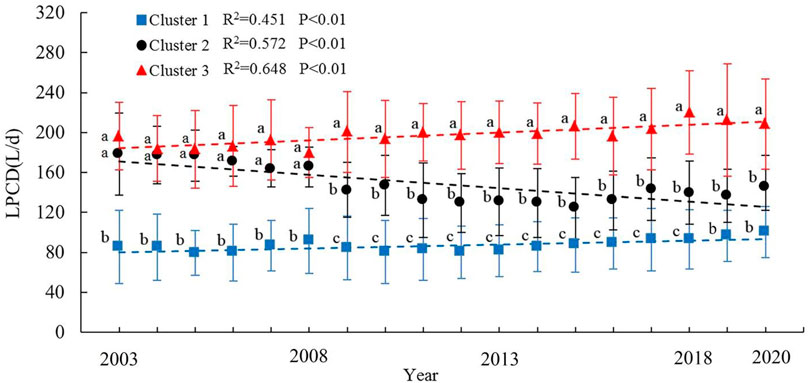
FIGURE 6. Comparison of liters per capita per day in clusters 1, 2, and 3. Note: The bar represents the mean ± standard deviation.
3.3 Driving factors of urban household water consumption among cluster cities
Correlation analysis was carried out to ascertain 11 variables that potentially affect water consumption in urban households. Six variables: urban population, ratio of high education received, GDP per capita, disposable income of households, built-up area, and water supply capacity were strongly associated with LPCD (p < 0.05) in all three clusters (Table 1). The rest of variables varied across three clusters. Urban population density, water saving and reuse rate, and investment in water conservation and number of water heaters for showering were significantly associated with LPCD (p < 0.05) in clusters 2 and 3, but have no significant associations with LPCD (p > 0.05) in cluster 1. By contrast, the number of washing machines is significantly associated with LPCD (p > 0.05) in cluster 1, but not in cluster 3 (Table 1).
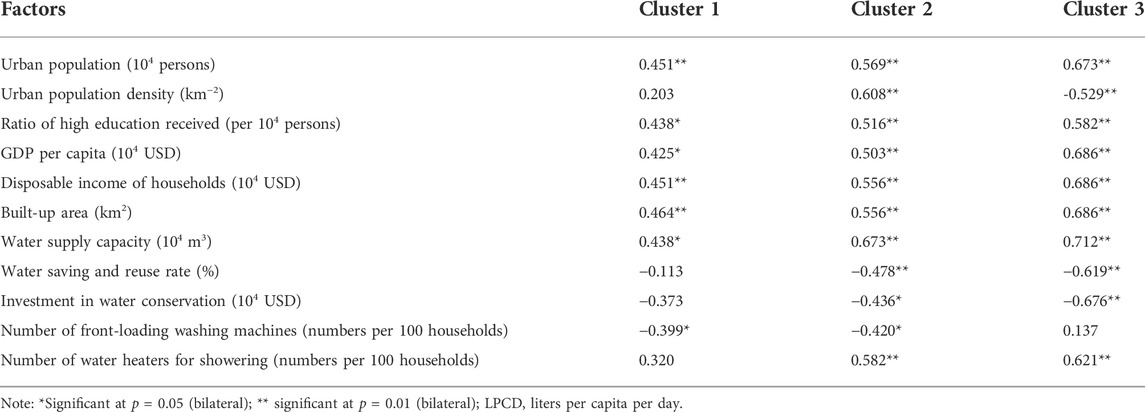
TABLE 1. Correlation coefficient between the liters per capita per day and influencing factors in the three clusters.
Furthermore, factor analysis indicates that strong causal effects on LPCD were observed for cluster 1 cities due to water supply capacity and number of front-loading washing machines exert; for cluster 2 due to investment in water conservation and number of front-loading washing machines; and for cluster 3, due to water saving and reuse rate and number of front-loading washing machines (Figure 7).
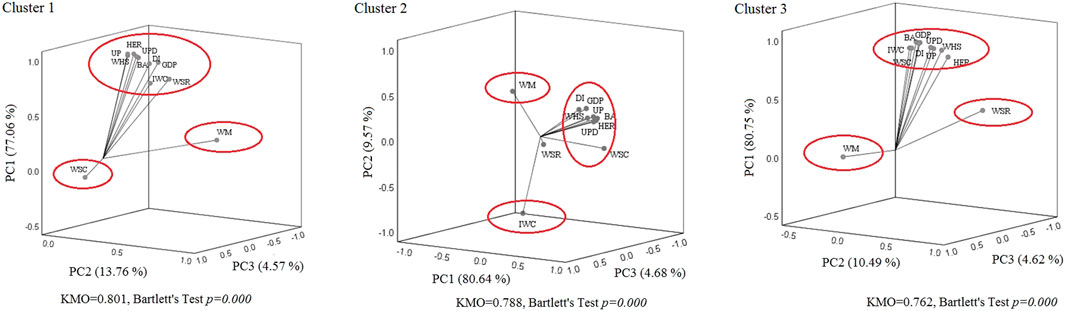
FIGURE 7. Affecting factors of liters per capita per day in clusters 1, 2, and 3. UP, urban population; UPD, urban population density; HER, ratio of high education received; GDP, gross domestic product; DI, disposable income of households; BA, built-up area; WSC, water supply capacity; WSR, water saving and reuse rate; IWC, investment in water conservation; WM, the number of front-loading washing machines; WHS, the number of water heaters for showering.
4 Discussion
This study found that the total urban household water consumption in Northwest China has increased by over 50% in the last 20 years, but by contrast, urban residential LPCD has gradually declined. The LPCD of 42 cities in Northwest China were divided into three clusters, with low-, medium-, and high-water consumption. Approximately two-fifths of the sample cities had low-water consumption, with an average of 86.83 L/d used, which does not meet the minimum household water demand of 100 L/d per capita as determined by the World Health Organisation (WHO) based on family daily living needs and the level of health concerns (WHO, 2011). However, we also found that one-third of the cities in Northwest China used domestic water over 193.66 L/d, thus being classified as cities with high-water consumption. Such usage is higher than in Singapore (151 L) (Singapore Government, 2017), Bangkok (219.5 L) (Bangkok, 2015), and cities in Spain (132 L) (David, 2019) and The Netherlands (127.5 L) (Linkola et al., 2013). Given the water scarcity in arid and semiarid Northwest China, such a level of water consumption is noteworthy.
In addition, we found that the influencing factors of water consumption varied across the three clusters. In the cities with low-water consumption, the LPCD was affected by water supply capacity, which is in turn directly related to resident’s livelihoods and bottleneck of water use. The Chinese government exert great efforts in improving water supply capacity in cities, which resulted in an increase from 218 × 106 m3 in 2000 to 321 × 106 m3 in 2020 (MOHURD, 2002). However, restricted by geographical conditions and water endowments of arid and semiarid areas in Northwest China, the water supply capacity of low-water consumption cities has not significantly improved. Insufficient water supply, seasonal drought, and high demand of water sources cause high pressures in cities with low-water consumption.
In cities with medium and high-water consumption, investments in water conservation and water saving and reuse rate serve an important role in water consumption. Furthermore, China has increased its investment in water conservation since 1998 when it introduced national policies to encourage people to save water, including providing education and campaigns on water conservation for enterprises, schools, and communities (Wang et al., 2007). In 2006, Chinese government has initiated the “Water-Saving Society” campaign (MWR, 2007), and a subsidy of $4.2 billion USD since 2012 to encourage buying “green” products, including water-efficient appliances (Wang, 2012), which can partially explain why LPCD in cities with medium consumption has significantly decreased in the past decade.
Household water consumption can be reduced by changing water-use behaviors and the popularization of water-saving appliances. However, the high prices of water-efficient appliances discourage their widespread use. For example, in China, the costs of residents buying water-saving washing machines are more than twice that of ordinary washing machines (Fan et al., 2017). Residents with low income can still not afford expensive water-saving appliances, even with government subsidies. Therefore, more subsidies toward low-income families are needed for such appliances.
Meanwhile, achieving water saving through behavioral changes is also proven difficult, requiring a wide participation of residents in water supply management (Martinez-Espineira and Garcia-Valiñas, 2013). Tong et al. (2017) found that consumer participation in water supply management is beneficial for information communication between consumers and water managers during policy making (economic incentives, environmental education, and awareness) and implementation water-conservation instructions. Jorgensen et al. (2009) verified that consumer’s wide participation can improve resident’s trust in the authorities and public. Syme and Jorgensen (1999) found that public perceptions of institutions and their neighbors’ actions are a critical variable for behavioral change interventions. Therefore, trustworthy authorities and the public can promote individual willingness to change his/her behavior to adopt water-conservation practices by improving their capacity for behavior control. Mansaray et al. (2017) confirmed that if the public perceives that water-related authorities and the rest of the public are untrustworthy, they may not follow instructions to conserve water. Therefore, wide participation of residents in water supply management is essential for behavioral changes and for building water-saving society in water-stressed cities.
The urban scale and economic level are the main factors contributing to the rise of household water demand. The large population of a city usually means a high economic level. In cities with low incomes, families have few washing machines and shower heaters, which consume less water in washing clothes and bathing. This finding is consistent with those of Schleich and Hillenbrand (2009) that households with high income are more willing to buy water equipment and facilities, thus consuming more water. We can then believe that cities with low-water consumption are more prone to consuming more water when their incomes increase. Policies can therefore be developed to provide subsidies in cities with low-water consumption to encourage residents to buy water-efficient appliances, such as front-loading washing machines and water-saving toilets, and still meet their daily living and health needs.
The uneven temporal and spatial distribution of water consumption in the cities of Northwest China indicates that strategies for sustainable water supply must be tailored to specific situations. In the cities with low-water consumption, the priority is to ensure safe and sufficient water supply. Restricted by geographical conditions, low-water-resources endowment and high investments in the water delivery system, cities of Northwest China face water shortage. Therefore, investments in long-distance water transfer through canals (McDonald et al., 2014) and promotion of water reuse (Cheng et al., 2020) are feasible solutions to alleviate urban water shortage. In medium and high-water consumption cities, effective measures are the continued increase of subsidies for residents to use water-saving appliances. Promoting such efficient appliances is a low-cost solution to achieve sustainable water resources management (Willis et al., 2013). Replacing household water appliances with high-efficiency water-saving appliances can reduce indoor water consumption by more than one third (Inman and Jeffrey, 2006). Strategies that drive the development of water-saving technologies promote the upgrading of related product technologies and reduce manufacturing costs need emphasis.
5 Conclusion
Efficient water use and sound policies are essential for securing sustainable water supply in water-stressed cities located in arid and semiarid regions of Northwest China. Furthermore, urban water consumption is influenced by the urban scale and economic level, water supply capacity, investment in water conservation, water saving and reuse rate, and the number of front-loading washing machines. These factors vary across cities. The main factors for resident’s water consumption for low-consumption cities are the water supply capacity and the number of front-loading washing machines. For the cities with medium consumption, the main factors were investments in water conservation and number of front-loading washing machines, while for the cities with high consumption, these factors were the water saving and reuse rate and the number of front-loading washing machines. Ensuring sustainable water supply in cities of arid and semiarid Northwest China can be achieved by 1) enlarging the supply capacity in cities with low consumption to guarantee sufficient water for daily living needs and health concerns; 2) promoting water-saving appliances in cities with medium and high consumption and encouraging low-income families to reduce their current and future water consumption; and 3) residents’ wide participation in water supply management to encourage water-saving practices and to build a water-saving society.
Data availability statement
The original contributions presented in the study are included in the article/supplementary materials. Further inquiries can be directed to the corresponding author.
Author contributions
XD conceived the study conception and design. LL performed data collection and analysis. LF contributed in writing-reviewing and editing.
Funding
This work was supported by the Program for Innovative Research Team (in Philosophy and Social Science) in University of Henan Province grant number 2022-CXTD-02.
Acknowledgments
The authors thank two reviewers and the editor for their valuable comments and helps.
Conflict of interest
The authors declare that the research was conducted in the absence of any commercial or financial relationships that could be construed as a potential conflict of interest.
Publisher’s note
All claims expressed in this article are solely those of the authors and do not necessarily represent those of their affiliated organizations, or those of the publisher, the editors, and the reviewers. Any product that may be evaluated in this article, or claim that may be made by its manufacturer, is not guaranteed or endorsed by the publisher.
Abbreviations
GDP, gross domestic product; LPCD, liters of domestic water consumption per capita per day; MOHURD, Ministry of Housing and Urban-Rural Development of the People’s Republic China; MWR, Ministry of Water Resources of the People’s Republic China; NBSC, National Bureau of Statistics of China; OECD, Organisation for Economic Co-operation and Development; UN, United Nations; WHO, World Health Organization.
References
Agthe, D., and Billings, R. (1980). Dynamic models of residential water demand. Water Resour. Res. 16 (3), 476–480. doi:10.1029/WR016i003p00476
Akuoko-Asibey, A., Nkemdirim, L. C., and Draper, D. L. (1993). The impacts of climatic variables on seasonal water consumption in Calgary. Alta. Can. Water Resour. J. 18 (2), 107–116. doi:10.4296/cwrj1802107
Arbués, F., and Villanúa, I. (2006). Potential for pricing policies in water resource management: Estimation of urban residential water demand in zaragoza, Spain. Urban Stud. 43 (13), 2421–2442. doi:10.1080/00420980601038255
Balling, R., and Gober, P. (2007). Climate variability and residential water use in the city of phoenix, Arizona. J. Appl. Meteorol. Climatol. 46 (7), 1130–1137. doi:10.1175/JAM2518.1
Bangkok, P. (2015). Thailand's drought: Time to conserve water is now. Available at: https://www.bangkokpost.com/learning/learning-news/788433/thailand-drought-time-to-conserve-water-is-now (Accessed Jan 4, 2018).
Barnett, M. J., Jackson-Smith, D., Endter-Wada, J., and Haeffner, M. (2020). A multilevel analysis of the drivers of household water consumption in a semi-arid region. Sci. Total Environ. 712 (10), 136489. doi:10.1016/j.scitotenv.2019.136489
Bartos, M., and Chester, M. (2014). The conservation nexus: Valuing interdependent water and energy savings in Arizona. Environ. Sci. Technol. 48 (4), 2139–2149. doi:10.1021/es4033343
Bich-Ngoc, N., Prevedello, C., Cools, M., and Teller, J. (2022). Factors influencing residential water consumption in Wallonia, Belgium. Util. Policy 74, 101281. doi:10.1016/j.jup.2021.101281
Carragher, B. J., Stewart, R. A., and Beal, C. D. (2012). Quantifying the influence of residential water appliance efficiency on average day diurnal demand patterns at an end use level: A precursor to optimised water service infrastructure planning. Resour. Conserv. Recycl. 62, 81–90. doi:10.1016/j.resconrec.2012.02.008
Chang, J., Wang, Y., Istanbulluoglu, E., Bai, T., Huang, Q., Yang, D., et al. (2015). Impact of climate change and human activities on runoff in the Weihe River Basin, China. Quat. Int. 380-381 (4), 169–179. doi:10.1016/j.quaint.2014.03.048
Chen, Y., Yang, Q., and Luo, Y. (2012). Ponder on the issues of water resources in the arid region of northwest China. Arid. Land Geogr. 35 (1), 1–9. doi:10.1016/j.quaint.2014.03.048
Cheng, S., Ga, C., and Ns, C. (2020). A model-based optimization study on greywater reuse as an alternative urban water resource. Sustain. Prod. Consum. 22, 186–194. doi:10.1016/j.spc.2020.03.008
David, S. (2019). The decline of water consumption in Spanish cities: Structural and contingent factors. Int. J. Water Resour. Dev. 36 (6), 909–925. doi:10.1080/07900627.2019.1634999
Dean, A., Lindsay, J., Fielding, K., and Smith, L. D. (2016). Fostering water sensitive citizenship – community profiles of engagement in water-related issues. Environ. Sci. Policy 55, 238–247. doi:10.1016/j.envsci.2015.10.016
Espey, M., Espey, J., and Shaw, W. D. (1997). Price elasticity of residential demand for water: A meta-analysis. Water Resour. Res. 33 (6), 1369–1374. doi:10.1029/97WR00571
Feng, L., Chen, B., Hayat, T., Alsaedi, A., and Ahmad, B. (2017). The driving force of water footprint under the rapid urbanization process: A structural decomposition analysis for zhangye city in China. J. Clean. Prod. 163, S322–S328. doi:10.1016/j.jclepro.2015.09.047
Gato, S., Jayasuriya, N., and Roberts, P. (2007). Forecasting residential water demand: Case study. J. Water Resour. Plan. Manag. 133133 (4), 3094–3319. doi:10.1061/(asce)0733-9496(2007)133:4(309)
Gato, S., Jayasuriya, N., and Roberts, P. (2011). Understanding urban residential end uses of water. Water Sci. Technol. 64 (1), 36–42. doi:10.2166/wst.2011.436
Geller, E. S., Erickson, J. B., and Buttram, B. A. (1983). Attempts to promote residential water conservation with educational, behavioral and engineering strategies. Popul. Environ. 6 (2), 96–112. doi:10.1007/BF01362290
Hummel, D., and Lux, A. (2007). Population decline and infrastructure: The case of the German water supply system. Vienna Yearb. Popul. Res., 167–191. doi:10.1553/populationyearbook2007s167
Inman, D., and Jeffrey, P. (2006). A review of residential water conservation tool performance and influences on implementation effectiveness. Urban Water J. 3 (3), 127–143. doi:10.1080/15730620600961288
Jorgensen, B., Graymore, M., and O'Toole, K. (2009). Household water use behavior: An integrated model. J. Environ. Manage. 91, 227–236. doi:10.1016/j.jenvman.2009.08.009
Li, H., Ma, C., Zhou, W., Yan, Q., and Song, Y. (2018). Characterizing the evolution of groundwater flow field and its driving forces in Xi’an, China. J. Hydrol. Eng. 23 (8), 05018017. doi:10.1061/(ASCE)HE.1943-5584.0001668
Li, W., Hai, X., Han, L., Mao, J., and Tian, M. (2020). Does urbanization intensify regional water scarcity? Evidence and implications from a megaregion of China. J. Clean. Prod. 244 (3), 118592. doi:10.1016/j.jclepro.2019.118592
Linkola, L., Andrews, C. J., and Schuetze, T. (2013). An agent based model of household water use. Water 5 (3), 1082–1100. doi:10.3390/w5031082
Mansaray, A. S., Borsuah, J. F., Gogra, A. B., Fofana, B. P., and Koroma, B. M. (2017). The safety of water supplied at njala university, njala campus. Nat. Resour. 8, 81–93. doi:10.4236/nr.2017.82006
March, H., and Saurí, D. (2010). The suburbanization of water scarcity in the barcelona Metropolitan region: Sociodemographic and urban changes influencing domestic water consumption. Prof. Geogr. 62 (1), 32–45. doi:10.1080/00330120903375860
Martin-Carrasco, F., Garrote, L., Iglesias, A., and Mediero, L. (2013). Diagnosing causes of water scarcity in complex water resources systems and identifying Risk management actions. Water Resour. manage. 27 (6), 1693–1705. doi:10.1007/s11269-012-0081-6
Martinez-Espineira, R., and Garcia-Valiñas, M. (2013). Adopting versus adapting: Adoption of water-saving technology versus water conservation habits in Spain. Int. J. Water Resour. Dev. 29 (3), 400–414. doi:10.1080/07900627.2012.721695
McDonald, R., Weber, I. K., Padowski, J., Florke, M., Schneider, C., Green, P. A., et al. (2014). Water on an urban planet: Urbanization and the reach of urban water infrastructure. Glob. Environ. Change 27 (1), 96–105. doi:10.1016/j.gloenvcha.2014.04.022
MOHURD (2002). China urban construction statistical Yearbook. Beijing, China: China Statistics Press.
MWR (2007). The 11th five-year plan of national water resources development. China: Gazette of the Ministry of Water Resources of the People's Republic of China.
Nations, U. (2015). World urbanization prospects: The 2014 revision. New York, United Nations. Available at: https://www.un-ilibrary.org/content/books/9789210568098/read (Accessed June 6, 2021).
Nauges, C., and Thomas, A. (2000). Privately-operated water utilities municipal price negotiation, and estimation of residential water demand: The case of France. Land Econ. 76 (1), 68. doi:10.2307/3147258
NBSC (2021). China statistical Yearbook (2000-2020). Beijing, China: National Bureau of Statistics Press.
Nieswiadomy, M. L. (1992). Estimating urban residential water demand: Effects of price structure, conservation, and education. Water Resour. Res. 28 (3), 609–615. doi:10.1029/91WR02852
Nieswiadomy, M. L., and Molina, D. J. (1989). Comparing residential water demand estimates under decreasing and increasing block rates using household data. Land Econ. 65 (3), 280. doi:10.2307/3146672
OECD (2011). Greening household behaviour: The role of public policy. Paris, France: OECD Publishing.
Oliver, M. D. (1999). Attitudes and inaction a case study of the manifest demographics of urban water conservation. Environ. Behav. 31, 372–394. doi:10.1177/00139169921972155
Qian, Z. Y., Shen, G. F., and Pian, J. Z. (2004). Water resources allocation for ecological environment construction in the west region and its research on sustainable development strategy. Beijing: Sciences Press. (In Chinese).
Rasifaghihi, N., Li, S. S., and Haghighat, F. (2020). Forecast of urban water consumption under the impact of climate change. Sustain. Cities Soc. 52, 101848. doi:10.1016/j.scs.2019.101848
Renwick, M., and Archibald, S. (1998). Demand side management policies for residential water use: Who bears the conservation burden? Land Econ. 74 (3), 343. doi:10.2307/3147117
Renwick, M., and Green, R. (2000). Do residential water demand side management policies measure up? An analysis of eight California water agencies. J. Environ. Econ. Manage. 40 (1), 37–55. doi:10.1006/jeem.1999.1102
Roshan, A., and Kumar, M. (2020). Water end-use estimation can support the urban water crisis management: A critical review. J. Environ. Manage. 268, 110663. doi:10.1016/j.jenvman.2020.110663
Schleich, J., and Hillenbrand, T. (2009). Determinants of residential water demand in Germany. Ecol. Econ. 68 (6), 1756–1769. doi:10.1016/j.ecolecon.2008.11.012
Simukonda, K., Farmani, R., and Butler, D. (2018). Intermittent water supply systems: Causal factors, problems and solution options. Urban Water J. 15 (5), 488–500. doi:10.1080/1573062X.2018.1483522
Singapore Government (2017). Water demand - domestic water consumption per capita. Available at https://data.gov.sg/dataset/water-demand-domestic-water-consumption-per-capita (Accessed Jan 4th, 2021).
Syme, G. J., and Jorgensen, B. (1999). Setting levels of service for urban water services: Current and future customer issues. Social basis for urban water provision in the 21st century: Report by the Australian research centre for water in society. Perth, Australia: CSIRO urban water program CSIRO land and water.
Syme, G. J., Seligman, C., and Thomas, J. F. (1990). Predicting water consumption from homeowners’ attitudes. J. Environ. Syst. 20 (2), 157–168. doi:10.2190/FNV4-VCV2-L1T9-4R62
Thompson, S. C., and Stoutemyer, K. (1991). Water use as a commons dilemma: The effects of education that focuses on long-term consequences and individual action. Environ. Behav. 23 (3), 314–333. doi:10.1177/0013916591233004
Tong, Y., Fan, L., and Niu, H. (2017). Water conservation awareness and practices in households receiving improved water supply: A gender-based analysis. J. Clean. Prod. 141, 947–955. doi:10.1016/j.jclepro.2016.09.169
Verwymeren, A. (2017). Do front-Load Washers save Money, or Just water? Available at: https://www.foxnews.com/real-estate/do-front-load-washers-save-money-or-just-water (Accessed June 25, 2022).
Wang, L., Zuo, Q. T., and Gao, J. X. (2007). Study on the connotation and evaluation index system of resource-efficient society. Prog. Geogr. 26 (4), 86–92. doi:10.11820/dlkxjz.2007.04.011
Wang, Q., Lin, J., Zhou, K., Fan, J., and Kwan, M. P. (2020). Does urbanization lead to less residential energy consumption? A comparative study of 136 countries. Energy 202, 117765. doi:10.1016/j.energy.2020.117765
Wentz, E. A., and Gober, P. (2007). Determinants of small-area water consumption for the city of phoenix, Arizona. Water Resour. manage. 21 (11), 1849–1863. doi:10.1007/s11269-006-9133-0
Whitcomb, J. B. (1991). Water reductions from residential audits. J. Am. Water Resour. Assoc. 27 (5), 761–767. doi:10.1111/j.1752-1688.1991.tb01474.x
Who, (2011). Guidelines for drinking-water quality. 4th ed. Available at: https://apps.who.int/iris/bitstream/handle/10665/44584/9789241548151_eng.pdf (Accessed June 6, 2021).
Willis, R. M., Stewart, R. A., Giurco, D. P., Talebpour, M. R., and Mousavinejad, A. (2013). End use water consumption in households: Impact of socio-demographic factors and efficient devices. J. Clean. Prod. 60 (6), 107–115. doi:10.1016/j.jclepro.2011.08.006
Yan, D. (2013). Urban domestic water consumption response to climate change in Urumqi city. Int. Conf. Earth Sci. Environ. Prot. 189, 897–904. doi:10.2495/ICESEP131181
Yang, Z., Song, J., Cheng, D., Xia, J., Li, Q., and Ahamad, M. I. (2019). Comprehensive evaluation and scenario simulation for the water resources carrying capacity in Xi'an city, China. J. Environ. Manage. 230, 221–233. doi:10.1016/j.jenvman.2018.09.085
Keywords: residential water use, water conservation, policy, water resource management, arid and semiarid area
Citation: Dang X, Li L and Fan L (2022) Spatiotemporal variation of household water consumption and coping strategies in water-stressed city of arid and semiarid Northwest China. Front. Environ. Sci. 10:922144. doi: 10.3389/fenvs.2022.922144
Received: 17 April 2022; Accepted: 28 June 2022;
Published: 22 August 2022.
Edited by:
Doru Stelian Bănăduc, Lucian Blaga University of Sibiu, RomaniaReviewed by:
S Suresh, Sona College of Technology, IndiaXiaoqin Zhou, University of Science and Technology Beijing, China
Copyright © 2022 Dang, Li and Fan. This is an open-access article distributed under the terms of the Creative Commons Attribution License (CC BY). The use, distribution or reproduction in other forums is permitted, provided the original author(s) and the copyright owner(s) are credited and that the original publication in this journal is cited, in accordance with accepted academic practice. No use, distribution or reproduction is permitted which does not comply with these terms.
*Correspondence: Liangxin Fan, Fanliangxin@126.com