 Jean Vasile Andrei1*
 Sorin Avram1
 Irina Băncescu1,2*Ioan I Gâf Deac1Carmen Adriana Gheorghe1Anișoara Ionela Diaconu3
- 1National Institute for Economic Research “Costin C. Kiriţescu“, Bucharest, Romania
- 2Bucharest University of Economic Studies, Bucharest, Romania
- 3Department of Economic, Social and Legal Studies, School of Advanced Studies of the Romanian Academy, Bucharest, Romania
This research addresses the problem of CO2, CH4, and N2O emissions in the EU for the 2008–2018 period, and their contributing factors, through extensive and complex analysis. The research incubated in the manuscript answers the question of whether new state members managed to catch up with old state members regarding technology innovation and mitigation of N2O emissions from agriculture activities. The methodology used includes Tapio decoupling index and the metafrontier non-radial Malmquist N2O emission performance index. The research considers short-term, medium-term, and long-term decoupling analyses. Results suggest a shift of decoupling status is worse for the 2013–2018 period compared to the 2008–2013 period which should concern low-carbon agriculture policy-makers. Also, it was noticed an increase in total-factor N2O emission performance for the 2008–2018 period. New state members managed to catch up with old state members regarding technology innovation and mitigation of N2O emissions from agricultural activities; however, not all countries managed to do so. For example, Romania has experienced an efficiency loss due to a technology change and from this perspective, Romania should address first managing N2O and CO2 emissions. The findings extend the traditional framework of investigating the effects of CO2, CH4, and N2O in agriculture and highlight the necessity of addressing environmental aspects from a broader perspective of the policymakers and in developing innovative decoupling indexes. The research investigation is reporting from a post-transition country by prioritizing the measures to be implemented.
1 Introduction
Greenhouse gas emissions from European Union (EU) agriculture, although in a declining trend, continue to be high, which explicitly requires climate change. According to International Energy Agency, (2016) and EEA (2020), in the EU, agricultural emissions represent the second-largest greenhouse gas emissions (GHG) contributors after fossil fuel combustion, amounting to 4,300 million tons of CO2 equivalent, in 2016. Thus, the increased emphasis on agro–environmental targets, the promotion of resilient agriculture, and a sustainable food system with low greenhouse gas emissions have been added to the analysis dimensions of the European agricultural model. Reducing and implicitly mitigating climate change generated by agriculture and adapting it to the new environmental and green conditions have become priorities under the Common Agricultural Policy (CAP), especially after 2014. On the other hand, as is remarked in INCA (2021), the cultivated land and the European grasslands provide ecosystem services worth € 76 billion per year for the communities, one in less than a third of which comes from crop production and the rest from other ecosystem services. For instance, Lesschen et al. (2011) make an investigation review on greenhouse gas emission profiles of European livestock sectors and show that the expanding of the contemporary livestock sectors is associated with great effects on agricultural land expansion, deforestation, and an increase in the emission of greenhouse gases, while Coderoni and Esposti, (2018) document a farm-level assessment of the CAP payments and agricultural GHG emissions in Italy. Poveda et al. (2020) investigate the impact and a possible correlation between renewable energy consumption, agriculture production, urbanization, and economic growth which are rarely employed and studied together in literature. Jacobs et al. (2019) analyze the effects of climate change adaptation in the agriculture sector in Europe and argue that carbon sequestration measures doubled by an irreversible shift in consumer patterns and diets will probably be needed in a greater way than now.
This research fills the gap in the literature which focuses on decoupling analysis of agriculture output or production in restricted geographical areas, focusing mostly on emission studies in China; there are few studies in the European countries (Han et al., 2018; Hossain and Chen, 2021; Jiang et al., 2021). Moreover, most studies regarding decoupling analysis study the relationship between CO2 emissions from energy use and economic growth (Roinioti and Koroneos, 2017; Yan et al., 2017).
Metafrontier analysis is mostly used in assessing emission performance relative to CO2 emissions and fossil-fuel energy sources comparing different countries or companies within a region or assessing agriculture technical efficiency without taking into account undesirable output such as emissions (Yang et al., 2018; Wen and Li, 2019); only a few studies, as far as we know, deal with evaluating agriculture emission performance in this manner. For example, Vlontzos et al. (2017) constructed an efficiency index for agriculture environmental production assessment of the EU countries for the 1997–2012 period based on a directional distance function considering six inputs, a desirable output (total crop and animal output), and an undesirable output (total GHG emissions).
In 2020, Exposito and Velasco constructed a data envelopment analysis (DEA) model having as undesirable output the intensity of use of mineral fertilizer consumption per output unit exploring sustainability efficiency in the European agricultural sector (Expósito and Velasco, 2020). Staniszewski and Kryszak (2022) investigated the link between structures and sustainability by employing a DEA model with three undesirable outputs (CO2 and ammonia emissions, consumption of inorganic fertilizers). A Malmquist index was also constructed in order to assess regional differences in agricultural CO2 emissions performance in China (Lin and Fei, 2015). Nowak and Kubik (2019) addressed the issue of agriculture technical efficiency in Europe by comparing new and old state members (who joined the EU before 2004).
The main objective of this research is to examine the dynamics of GHG agriculture emissions, more specifically carbon dioxide (CO2), methane (CH4), and nitrous oxide (N2O), in relation to agriculture output, taking into account efficiency of production as well as innovation, in EU during 2008–2018. In this context, the investigations are centered on the decoupling status highlighted between three air pollutants emissions and intensities (CO2, CH4, and N2O) indicators and agriculture economic growth (given by agriculture output value), and examining the sequential order between these six indicators in the European Union countries. From this perspective, the research focuses on issues such as decoupling analysis of GHG emissions and intensities from output, production efficiency and technology changes. Also, we construct a metafrontier non-radial Malmquist N2O emission performance index to evaluate each EU member state’s agricultural efficiency.
The innovation and contribution of this research mainly lie in three aspects. First, this is the first study providing decoupling statuses of the European Union countries for agricultural activities. Second, this research innovatively proposed the examination of the sequential order of three main important agricultural air pollutants emissions indicators to provide policy-makers with the decoupling statuses based on the six indexes, which may serve as goals for pursuing a low-carbon agricultural economy in three steps. Third, we investigated the N2O emission efficiency from agricultualr activities in the EU through a metafrontier analysis. The research tries to provide answers to the following three key questions:
(i) Did new state members (who joined the EU after 2004) manage to catch up with old state members (who joined the EU before 2004) regarding technology innovation and mitigation of N2O emissions from agriculture activities?
(ii) Did the EU countries manage to reduce their agriculture GHG?
(iii) Did agriculture emissions and intensities decouple from agriculture output?
Summarizing, the article is structured into seven distinct sections. A literature review section on the agriculture emissions-economy based literature and decomposition analysis is following the introduction. Section 3 is dedicated on the on the description of the materials and methods employed in the study. Section 4 presents the main results of the research and the interpretation of the decoupling results by describing the decoupling status of agricultural growth from CO2, CH4, and N2O emissions/intensities and the Metafrontier non-radial Malmquist N2O emission performance index-empirical analysis. Section 5 gives a synopsis of the discussions on the different results regarding the decoupling analysis of the agricultural growth from CO2, CH4, and N2O emissions on short-term, middle-term and long-term perspective. Section 6 summarizes the main conclusions and policy implications. The research closes with the limitations and future directions for research section.
2 Literature review
The empirical literature that analyze the development of agriculture economic indicators in relation to greenhouse gas emissions indicators has grown significantly in the last decades (Rai et al., 2011; Sanz-Cobena et al., 2017; Tongwane and Moeletsi, 2018). While agriculture production releases into the atmosphere CO2 emissions as well as non-CO2 emissions, the dominant focus of this literature remains CO2 emissions which is surprising considering the fact that most farm-related emissions come in the form of CH4 and N2O emissions.
The agriculture emissions-economy literature can be divided in several broad topics: decoupling studies (Han et al., 2018; Hossain and Chen, 2021; Jiang et al., 2021), estimations of the environmental Kuznets curve (Qiao et al., 2019; Ridzuan et al., 2020), and regression analysis of drivers and effects (Appiah et al., 2018; Lin and Xu, 2018; Wang et al., 2020). Other authors have also addressed the issue of greenhouse gas emissions through metafrontier analysis (Zhang and Choi, 2013; Lin and Fei, 2015; Zhong et al., 2021).
The decoupling method is widely utilized due to its simplicity of use and interpretation, aiming to empirically quantify the relative change in GHG emissions in relation to an economic output indicator such as gross domestic product (GDP). Countries or industries that have a strong decoupling of GHG emissions exhibit an ideal pattern in which GHG emissions drop while the economic output increases. The environmental Kuznets curve states that agricultural emissions initially grow as production increases in value, slows down till they reach a turning point, and eventually drop, giving the relationship an inverted U-shape.
Another focus in the literature is the measurement of agricultural GHG emissions from different perspectives. For example, Wisniewski and Kistowsk, (2018) measured the GHG emissions in Poland as indicators of livestock intestinal fermentation, animal manure, plant residues, and soil management procedures. Senapati et al. (2016) measured the nitrous oxide emissions from grain planting by applying a biogeochemical model. Gorh and Baruah (2019) also determined GHG emissions levels from different rice varieties and argued that both agricultural productivity and reducing the GHG are achievable in the context of production optimization.
Agriculture GHG emission performance is influenced by many factors, such as capital, land, labor, energy, fertilizer use, and many others. Wang et al. (2020) showed through a CS-ARDL model that globalization, financial development, and natural resources lead to an increase in CO2 emissions. Other authors (Appiah et al., 2018) considered that not only economic development can increase CO2 emissions, but so do energy consumption (especially from fossil fuel sources) and population growth in the case of emerging countries. Some authors have addressed the effects of mitigation strategies on GHG emissions (van Meijl et al., 2018; Loboguerrero et al., 2019; McCarl, 2019).
Considering all of the aforementioned, estimating GHG emission performance takes into account many factors and is essential for policymakers. There are many methods suitable for estimating GHG emission performance; however, an efficient and complex method is through a multi-input and output efficiency frontier based on a production technology set. One of the most typically used methods is the DEA (Data Envelopment Analysis) which is a multicriteria relative efficiency evaluation method based on a production technology set which mimics as close as possible the reality.
3 Materials and methods
This section presents the methodology used in this research, starting with the Tapio decoupling index. The methodology employed in this research is developed based on the discussions and implementation of the DEA models and constructing their Malmquist index and its decomposition. The variables employed in this study (CO2, CH4, and N2O) are usually taken into consideration in literature, but fewer studies address the agriculture emissions in the EU member states. From this perspective, it was considered as a reference to the data sets available on EEA. (2020).
3.1 Decoupling analysis
In order to quantify the relative change in GHG emissions in relation to an agriculture output as well as the degree of decoupling between those two, the Tapio decoupling index is applied (Tapio, 2005) which is given by
where
With the aim of proposing the innovative six decoupling indexes, in this research, DT indicates the change of total carbon emission (TCO2), total methane emission (TCH4) and total nitrous oxide emission (TN2O), total carbon emission intensity (TCO2I), total methane emission intensity (TCH4I), total nitrous oxide emission intensity (TN2OI), respectively.
The most favorable status of a certain country is the strong decoupling status which indicates the agriculture output value is increasing (%∆AG>0) while agricultural-related air pollutant emission/intensity is decreasing (%∆AE<0). This status is corresponding to low-air pollutant agriculture. The least favorable status is the strong negative decoupling status which is the reverse of the strong decoupling status, meaning agricultural output value is decreasing (%∆AG<0) while agricultural-related air pollutant emission/intensity is increasing (%∆AE>0) corresponding to high air-pollutant agriculture. Moreover, when %∆AG<0, meaning agriculture output value is decreasing, we least desire a small DT value since it corresponds to a worsening of the dependency of agricultural development on air pollutant emissions/intensity. However, when %∆AG>0, meaning agriculture output value is increasing, we desire a small DT value since it corresponds to a weakening of the dependency of agricultural development on air pollutants emissions/intensity which is desirable in a low-carbon economy.
3.2 Metafrontier analysis
Following the decoupling analysis, we employ the use of data envelopment analysis (DEA) and metafrontier analysis in order to assess N2O emission efficiency from agriculture activities in the EU. The reason for analyzing only N2O emissions, using this methodology, is that this GHG is one of the most powerful gasses. Only one molecule of N2O released into the air is almost 300 times more damaging to climate change than a single molecule of CO2. Additionally, N2O emissions mostly come from agricultural activities and we think that it deserves special attention when analyzing agriculture activities. Furthermore, the vast majority of studies focus on CO2 emissions and less on N2O emissions. That being said, even though mitigation of CH4 and CO2 are equally important for environmental sustainability, we consider that there is a need for more N2O emissions studies.
Metafrontier analysis is based on the construction of a suitable production technology set that mimics reality as close as possible. Many such sets have been proposed in the literature, however, a suitable production set takes into account both undesirable and desirable output since any production will lead to some undesirable output (Song et al., 2012; Mardani et al., 2017; Coelli and Rao, 2005). Hence, in order to assess the N2O emission efficiency from agriculture activities, over the period studied and for every country, we construct a DEA model-based on the following production technology model, having as desirable output agriculture production, while the undesirable output is N2O emissions.
3.2.1 Production technology model
Suppose that there are D decision-making units (DMUs), represented, in this research, by the agriculture of each EU country. Every such economic activity uses nitrogen fertilizer, (N), labor (L) and utilized agricultural area (U) for production, these variables being the inputs of our production model. Also, we consider a desirable output in form of agricultural output (O) and an undesirable output represented by N2O emissions (denoted by NE). Hence, the two-output production model is defined as:
Also, we assume production set P satisfies the axioms of production theory (Fare and Grosskopf, 2006) such as weak-disposability and null-jointness on closed set P. Hence, the reduction of N2O emissions entails an opportunity cost in agricultural output proportional to the N2O emission reduction (weak-disposability assumption). Moreover, emissions of N2O are inevitable in agriculture production and the only way to remove all N2O emissions is to completely stop agricultural production (null-jointness assumption). These two assumptions are formulated as follows:
Production technology model P can be expressed as a DEA model as
where
The non-radial directional function is given by
where
If
Following the work of Zhou et al. (2012), we define the static total-factor N2O emission performance index (TCPI) as
where
3.2.2 Metafrontier non-radial Malmquist N2O emission performance index
Metafrontier non-radial Malmquist N2O emission performance index is constructed by resolving three more optimization problems based on three new production technology sets, contemporaneous, intertemporal, and global production technology. These three production technology sets are defined based on (Tulkens and Eeckaut, 1995; Oh, 2010; Oh and Lee, 2010; Zhang and Choi, 2013).
First, we consider H groups and defined for group
the intertemporal non-radial directional function
and the global non-radial directional function
For each non-radial direction function, we construct DEA-type models as follows:
Based on Eqs. 5, 6, and 7 we can obtain the corresponding TCPI defined in Eq. 4 as
where
MNMNPI measures changes in TCPI on
EC is an efficiency change index which measures how close a country’s agricultural activities move toward the contemporaneous production technology. A value EC > 1 suggests an efficiency gain, while a value EC < 1 suggests an efficiency loss.
The index BPC which stands for best-practice gap change measures changes in the best-practice ratio gap for the N2O emission reduction technology between the contemporaneous production technology and the intertemporal production technology during two periods. A value BPC >1 means that the contemporaneous frontier is drawing closer to the intertemporal frontier, while a value BPC<1 suggests the opposite. Due to its definition, BPC can be viewed as an innovation effect. The index TGN which stands for technology gap ratio for N2O emission reductions measures the changes in the technology gap ratio between the intertemporal production technology and global production technology during two periods. A value TGN>1 suggests a decrease in the technology gap between the intertemporal production technology frontier for a specific group and the global production technology frontier, while a value TGN<1 suggests an increase between these two frontiers.
Our goals and the reasons we used these methods are explained in the overall framework represented in Figure 1.
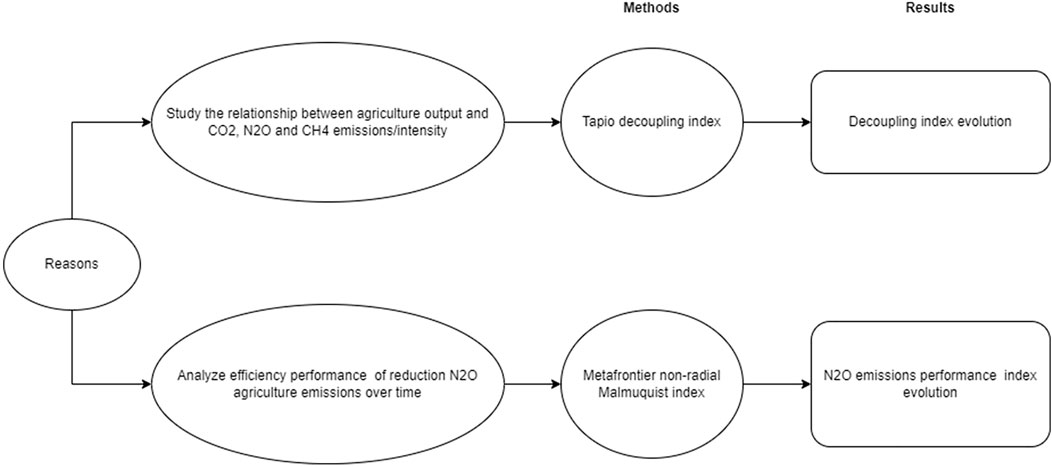
FIGURE 1. Theoretical structure of methods.
3.3 Preliminary data analysis
Data used in this research are annual agricultural output (million euro, current price), CO2, CH4, and N2O emissions from 2008 to 2018 of 28 countries collected from the Eurostat Database. Since we are interested in not only long-term analysis, we consider three types of decoupling time periods: short-term (i.e., every year from 2008 to 2018), middle-term (i.e., from 2008 to 2013 or from 2013 to 2018), and long-term (i.e., from 2008 to 2018).
Looking at the data, we notice that some EU countries have managed to reduce their air pollutants emissions and intensities, while others have not. In terms of CO2 emissions, only 11 countries registered an increase. However, a lot more countries registered an increase in terms of CH4 and N2O emissions. Greece had the most significant decrease in CO2 emissions, while Romania and Croatia managed to reduce their CH4 emissions. However, we notice an increase in air pollutants emissions and intensities in the 2013–2018 period compared to the 2008–2013 period. In the first period (2008–2103) 12 countries registered an increase in N2O emissions while in the second period this number increased to 22.
Comparing emissions and intensities, the evolution of intensities is less significant than emissions, meaning the intensities din not increase as much as emissions (Tables 1–3). The most significant decrease in CO2 intensities is given by Greece (−76.95%), while the most increase is given by Romania (+94.57%). In terms of CH4 intensities, we have the pair Malta (−51.03%) and Bulgaria (+43.63%). Also, Malta has the most decrease in N2O intensities (−48.57%), while Bulgaria has the most increase (+145.52%).
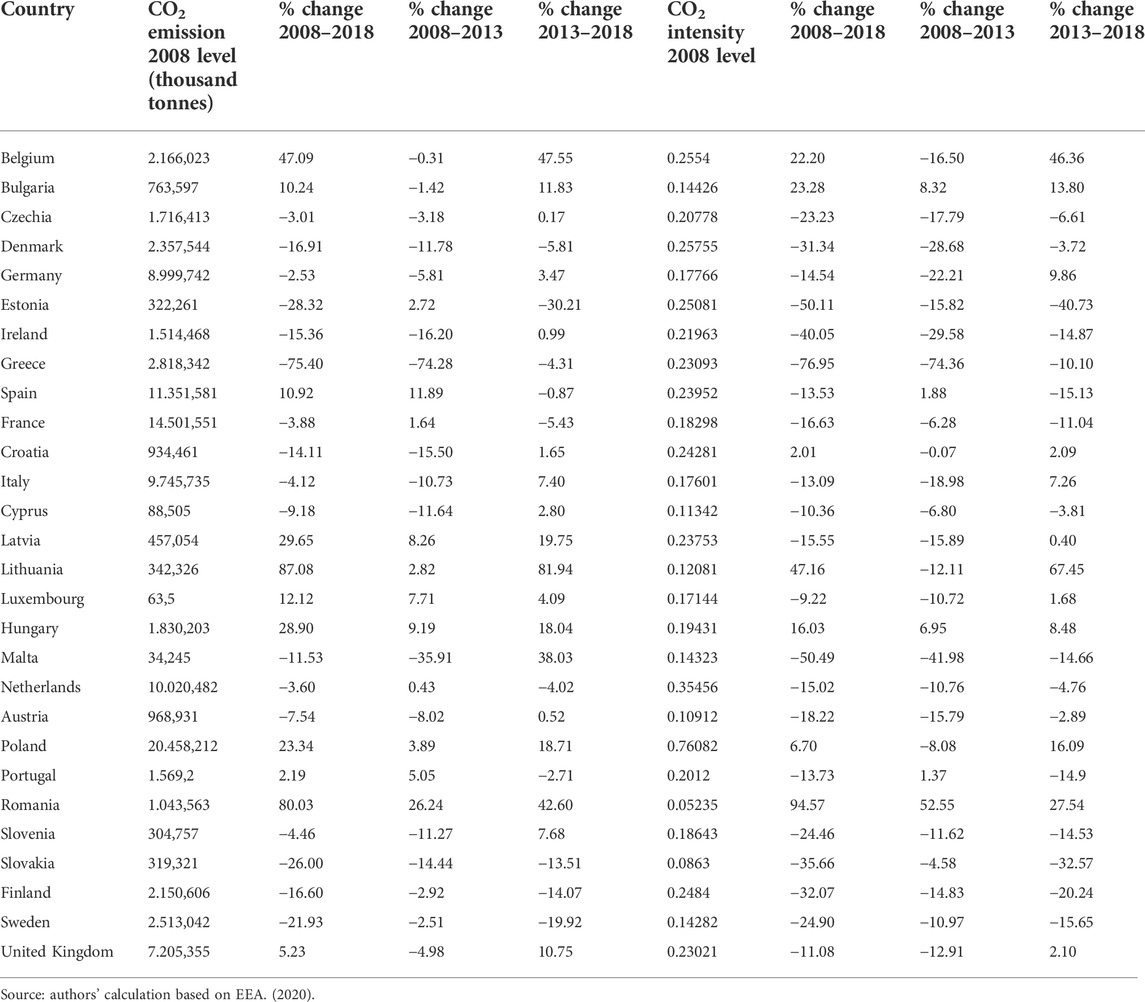
TABLE 1. CO2 emissions and intensity changes in EU, 2008–2018.
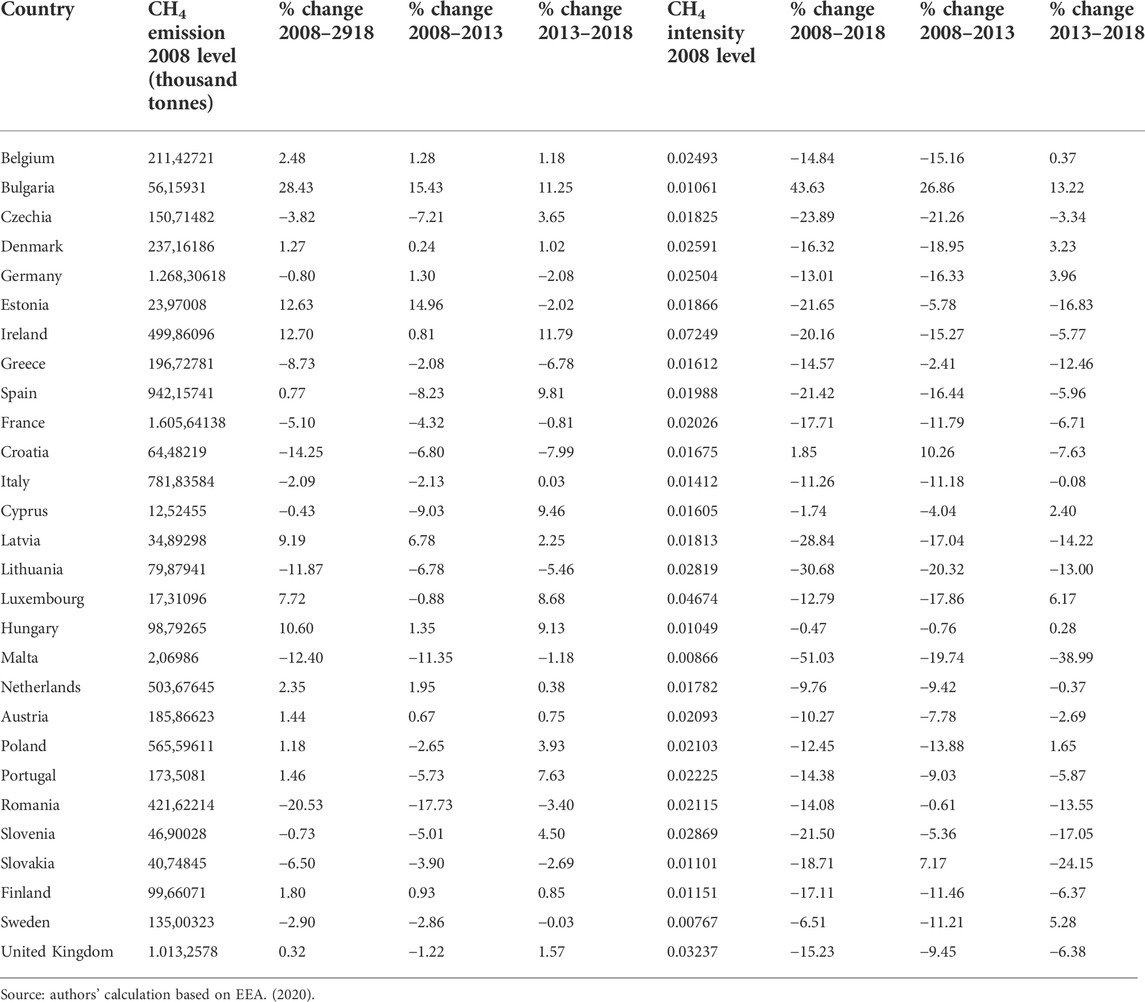
TABLE 2. CH4 emissions and intensity changes in EU, 2008–2018.
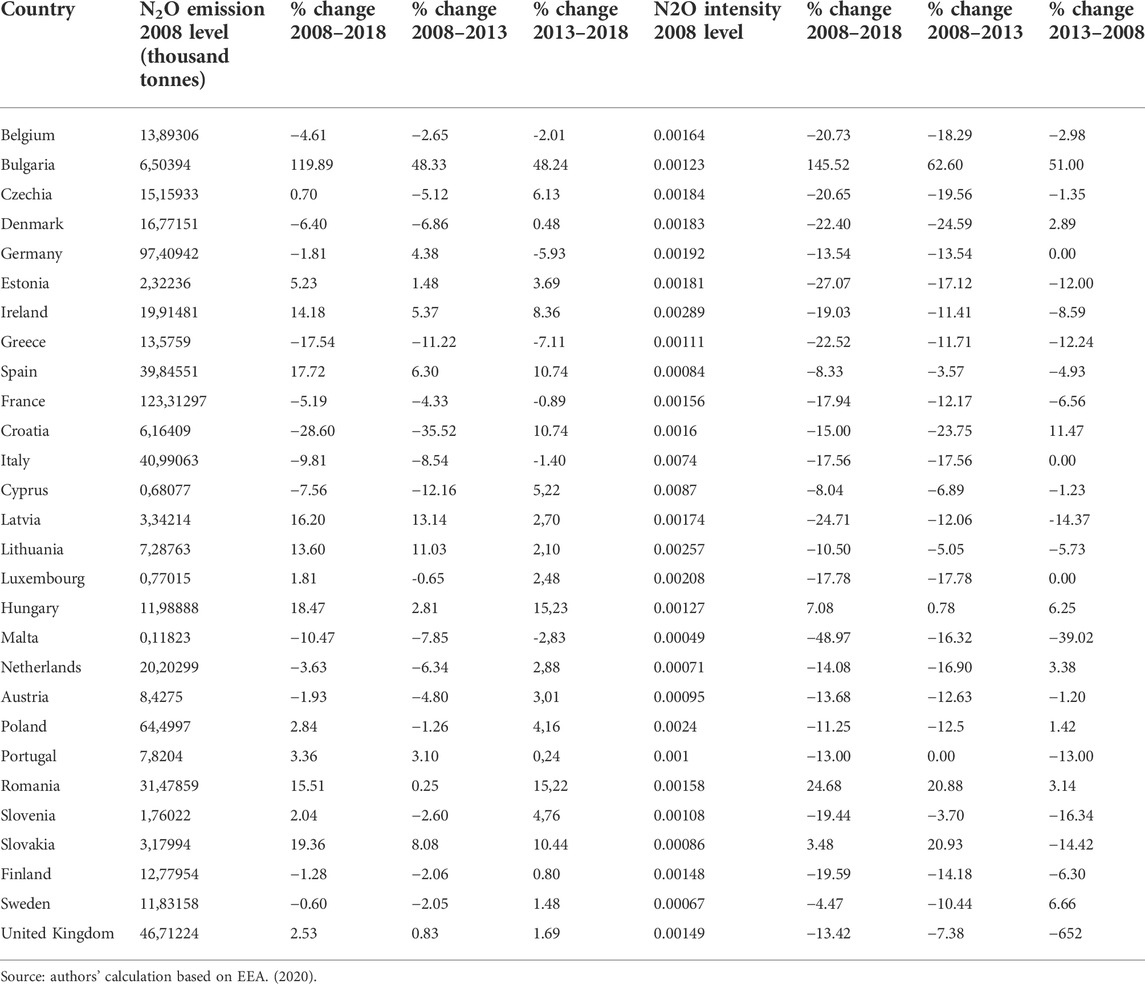
TABLE 3. N2O emissions and intensity changes in EU, 2008–2018.
Romania has managed to reduce its CH4 emissions and intensities; however, CO2 and N2O emissions and intensities have registered a regress. N2O emissions have increased by 15.51%, while intensities by 24.68%. Hence, policymakers in Romania should first address the issue of N2O and CO2 emissions.
Comparing changes that occurred in the groups of new and old state members of the EU, as defined in the introduction. We notice that in the case of CO2 and N2O intensities the differences between those two groups are large. The former group reduced, on average, by −1.54% their CO2 intensities, while the latter by−20%. The same can be said for N2O intensities, the changes being −0.37% and −15.87%, respectively. New state members increased their CO2 and N2O emissions, while the old state members decreased theirs.
4 Results
4.1 Decoupling results
In this section, we present the results of the decoupling analysis. First, we discuss the decoupling statuses of agricultural growth from CO2 emissions/intensities, then from CH4 emissions/intensities, and lastly from N2O emissions/intensities.
4.1.1 Decoupling statuses of agricultural growth from CO2 emissions/intensities
The decoupling statuses of agricultural–economic growth from CO2 emissions and intensities, in three types of periods (short-term, medium-term, and long-term) for the 28 individual countries are identified and presented in Figures 2, 3.
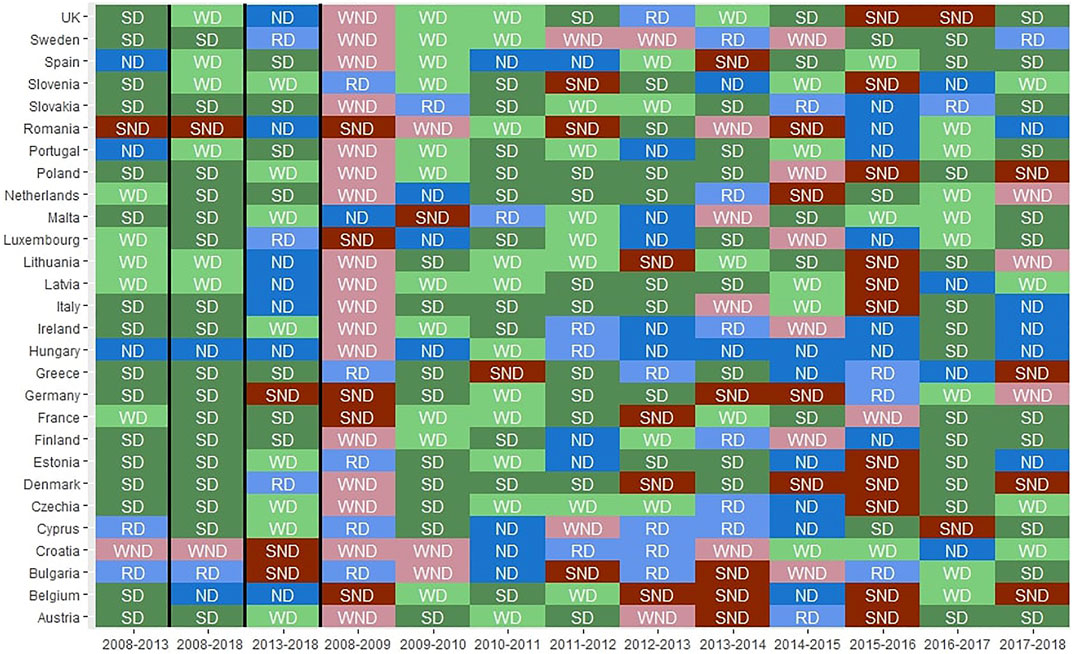
FIGURE 2. CO2 emissions decoupling. Source: authors’ calculation based on EEA, (2020).
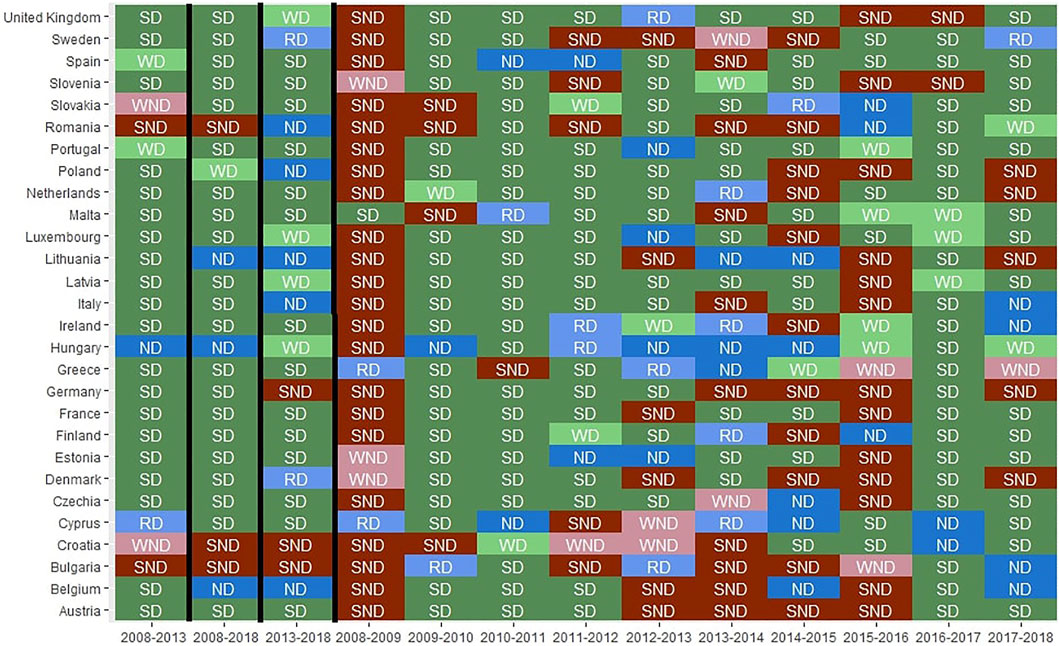
FIGURE 3. CO2 intensity emissions decoupling. Source: authors’ calculation based on EEA, (2020).
From 2008 to 2009, we notice a common trend between the countries, caused by the 2007–2008 economic crisis which affected all branches of the economy (International Energy Agency, 2016). During the 2008–2009 period, the short-term decoupling status for emissions is either SND, WND, or RD, while for intensities only Malta has an SD status, while 22 out of 28 countries have an SND status. This trend is also observed for N2O and CH4 emissions (Figures 4, 6). These results are consistent with those obtained by Shuai et al. (2019). As shown in Figures 2, 3, the short-term analysis results indicate the decoupling statutes of the 28 EU countries vary considerably with agricultural output.
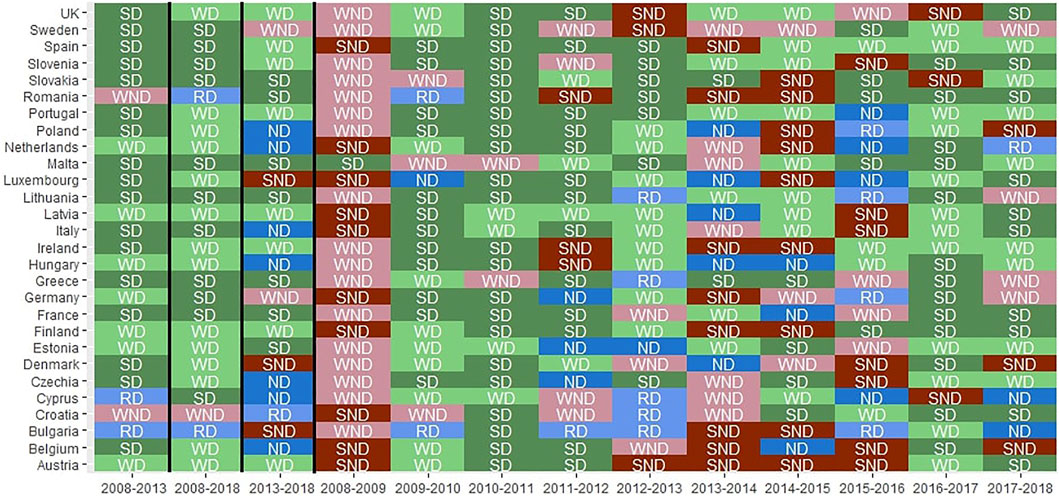
FIGURE 4. CH4 emissions decoupling. Source: authors’ calculation based on EEA, (2020).
For instance, for France, as a high-agriculture-level country and high-income country, the short-term decoupling status is mostly either WD or SD for emissions, and mostly either SD or SND for intensities. This comes as no surprise, since France, as a state member of the EU, has promoted organic agriculture as a way to mitigate greenhouse gas emissions from the agriculture sector, however, the percentage of fields fully converted or under conversion to organic agriculture was only 7% in 2018. This may explain why short-term decoupling of intensities is either one extreme or the other. Garnier et al. (2019) showed, under different scenarios that for France to reach its 2050 GHG emissions target an intensified transition from conventional agriculture to organic agriculture is necessary.
However, Austria which has the largest percentage of fields fully converted or under conversion to organic agriculture in 2019 in the EU of 24.08%, has five decoupling statutes in the short term for emissions, while for intensities only two, SD or SND. This may be due to the fact that Austrian agriculture is predominantly characterized by small-scale farms with more than 80% located in disadvantaged mountainous areas (Pinter and Kirner, 2014), making practicing organic agriculture difficult.
Moreover, there is no country which has short-term decoupling status only either SD or WD for either emissions or intensities, suggesting that there is still room for improvements in the EU agriculture sector.
On the other hand, in Romania, a low-income country with a long tradition of agriculture activities (20.92% of the employed population, in 2018), the short-term decoupling status is mostly either SND, WND, or RD for emissions, while for intensities is mostly dominated by an SND status. This situation is also observed in its neighbor, Bulgaria. It comes as no surprise, that there are plenty of reasons for this situation in those countries. Romania and its neighbor Bulgaria became members of the EU at the same time in 2007 having to deal with the intense competition of the liberal market of the EU. Hence, the pressure on farmers to produce and be competitively increased. This led to an increase of chemicals in agricultural practices. Moreover, the Romanian’s government’s lack of implication in promoting cleaner agricultural practices led to an increase in air pollutants emissions.
Middle-term analysis results show a less diversified pool of statutes. The middle-term decoupling status of 11 out of the 28 state members (∼43%) is either SD or WD for emissions. However, we notice a shift in decoupling status in the second period (2013–2018) of the middle-term analysis which confirms the observations notice in a previous section. In the 2008–2013 period, SD or WD decoupling status occurs in 75% of the countries, while in the second period the percentage drops to 53% for emissions. Moreover, regarding intensities, things are not different. This development should concern low-carbon agriculture policy-makers. The long-term analysis shows that 82% of countries are at SD or WD status when it concerns emissions, while 75% of countries have the same status when it comes to intensities. The Romania status is the most unfavorable (SND) for both emissions and intensities when the growth rate of agricultural emissions is positive and that of the agricultural economic activities is negative.
4.1.2 Decoupling statuses of agricultural growth from CH4 emissions/intensities
The decoupling statuses of economic growth from CH4 emissions and intensities in three types of periods for the 28 individual countries are identified and presented in Figures 4, 5. First, we noticed, compared to CO2 decoupling analysis, that the number of SD and WD short-term decoupling statuses is bigger for CH4 decoupling (180 compared to 134 for emissions), and EU state members managed to reduce their dependence on CH4 emissions in relation to the increase in agricultural activities. Also, in the short term, for intensities, the number of SD short-term decoupling statuses is 158, while the number of SND short-term decoupling statuses is 94, meaning that when it comes to intensities, the decoupling situation is significantly fluctuating from one extreme to the other.

FIGURE 5. CH4 intensity decoupling. Source: authors’ calculation based on EEA, (2020).
In the medium term, for the period 2013–2018, again, we observe a shift of decoupling status for many countries. SD or WD decoupling status occurs in ∼86% of the countries for the 2008–2013 period while for the 2013–2018 period the percentage is ∼53% for emissions. In the long term, only Romania, Croatia, and Bulgaria do not have an SD or WD decoupling status. Romania and Bulgaria have an RD CH4 decoupling status, while Croatia has a WND CH4 decoupling status, all these countries being the last state members which entered the EU. Concerning intensities, Romania has an RD decoupling status.
4.1.3 Decoupling statuses of agricultural growth from N2O emissions/intensities
The decoupling statuses of economic growth from N2O emissions and intensities in three types of periods for the 28 individual countries are identified and presented in Figures 6, 7. In the long term, Romania along with Bulgaria has an SND decoupling status for N2O emissions and intensities. Moreover, Hungary has an ND long-term decoupling status, Croatia has a RD decoupling status, while the rest of the countries analyzed in this research, have either SD or WD decoupling status for emissions. Also, in the short-term, for intensities, the number of SD short-term decoupling statuses is 141, while the number of SND short-term decoupling statuses is 85, meaning that when it comes to intensities, the decoupling situation is significantly fluctuating from one extreme to the other.
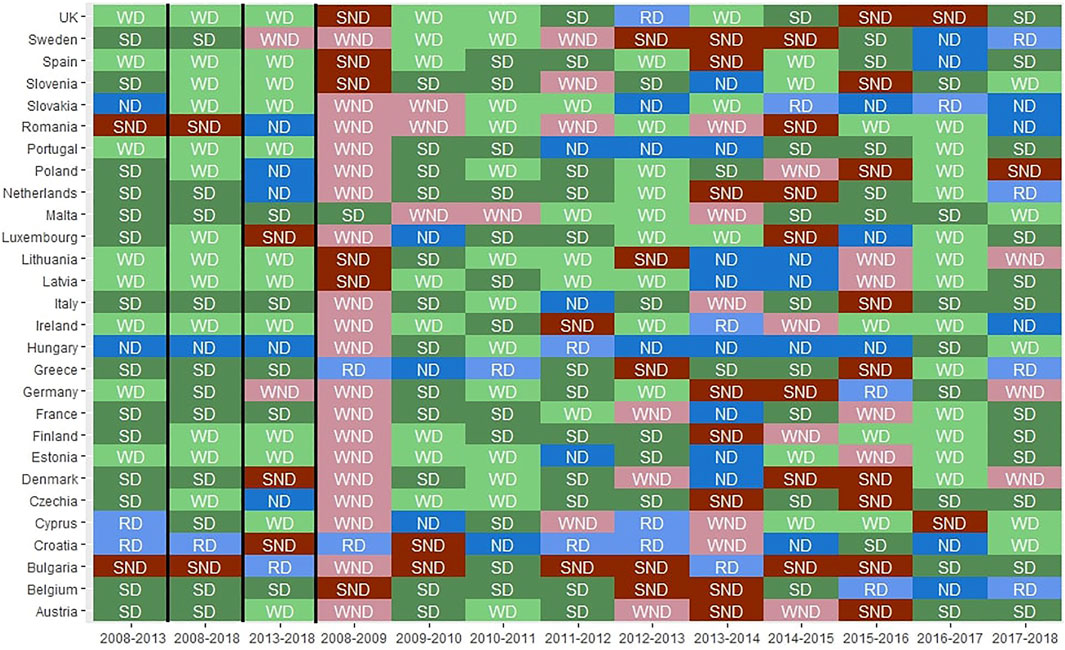
FIGURE 6. N2O emissions decoupling. Source: authors’ calculation based on EEA, (2020).
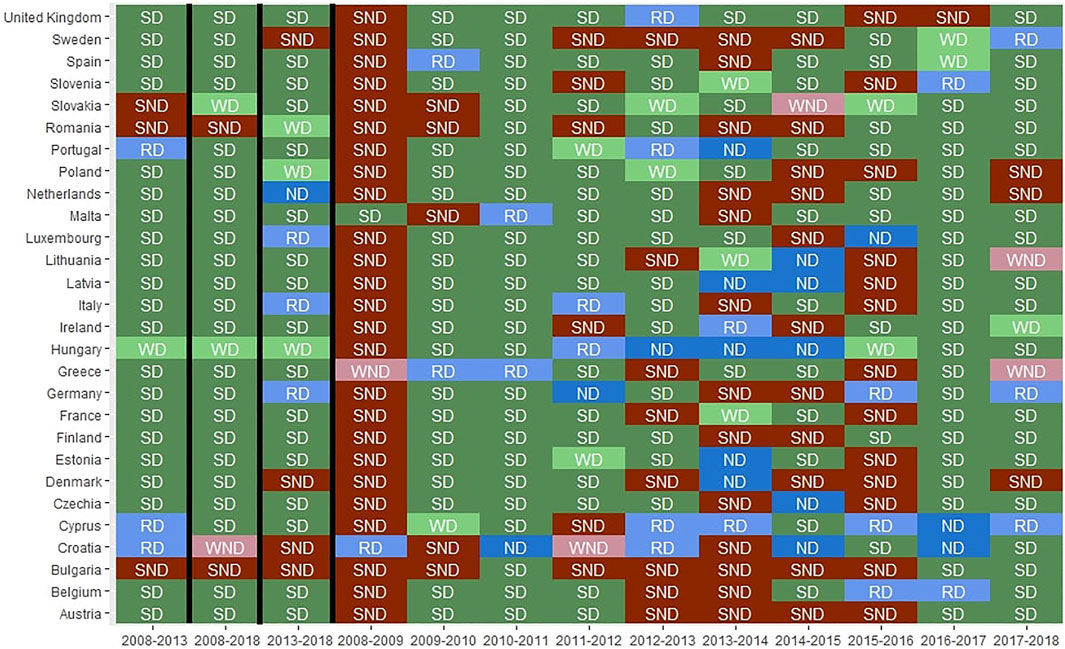
FIGURE 7. N2O intensity decoupling. Source: authors’ calculation based on EEA, (2020).
In Spain, the use of nitrogen inorganic fertilizers increased by 39.7%, while phosphorus inorganic fertilizers increased by 56.84%. Other countries with a significant increases of inorganic fertilizers used are Romania (nitrogen +67.43%, phosphorus + 83.96%), Bulgaria (nitrogen + 95.10%, phosphorus +149.43%), and Hungary (nitrogen+44.16%, phosphorus + 86.47%). As shown in the previous section, none of these three countries have, in the long term, an SD or WD decoupling status for CO2 and N2O for emissions or intensities.
The increase in N2O emissions in Romania can be explained by an increase in the use of chemical fertilizers (+80.50% from 2008 to 2018). This increase can be explained by increased imports of fruits and vegetables and the entering into a competitive market. Pearson coefficient between N2O agriculture emissions and the value of imports of fruit and vegetables is 0.81, the relationship being statistically significant (p-value = 0.002 < 0.05).
However, agricultural emissions can also be energy induced. Yan et al. (2017) analyzed energy-related agricultural emissions in the EU and showed that for France from 1995–2012 the period energy intensity increased along with agricultural production. Moreover, they concluded that energy efficiency improvement policies are necessary and feasible for reducing emissions. For CH4 emissions reduction, other measured necessary are feeding efficiency improvement and adaptive measures on livestock housing (Chathumini et al., 2021). Policymakers should formulate policies so that energy-related emissions, as well as inorganic fertilizers-related emissions, are reduced. Decoupling agriculture growth from agricultural emissions is an important step in a sustainable economy. Achieving a “win-win” situation for agricultural greenhouse gas emissions and agricultural economic growth is challenging, but necessary for future generations. As such, for these countries, there is a need for more studies in order to highlight the most important factors and systems that led to this increase. We showed earlier that in both countries inorganic fertilizers used have increased. The results also indicate that widespread application of organic agriculture can greatly reduce agricultural greenhouse emissions as many studies have shown (Bos et al., 2014; Muller et al., 2017; Saha et al., 2021). Also, improvement of efficiency in agricultural production is necessary.
4.2 Metafrontier non-radial malmquist N2O emission performance index-empirical analysis
We employ the methodology proposed in a previous section regarding a production technology model to examine the changes in the total-factor N2O emission performance of agriculture in the EU during the 2008–2018 period. We exclude from the analysis data regarding Croatia (due to lack of complete data) and Malta which has low agriculture activity intensity.
To calculate the MNMNPI, we first characterize groups and determine their members. In this section, we answer to the question of whether new state members managed to catch up with old state members regarding technology innovation and mitigation of N2O emissions from agriculture activities. Hence, the criterion for grouping EU state members is based on the year of start membership, before or after 2004. Group 1 (EU15) is characterized by state members which joined the EU before 2004, while Group 2 (EU11) is composed of countries that joined the EU after 2004.
To test whether the two groups are operating under the same technology, we use the non-parametric Mann-Whitney test for MNMNPI efficiency results of the pooled data. If we disregard the heterogeneity of groups, we may obtain biased results. The results show that the null hypothesis of a common technology is rejected (p-value
The results indicate an increase in total-factor N2O emission performance for the period considered. On average, the total-factor N2O emission performance of EU state-member agriculture activities increased by approximately 133% considering differences in the average MNMNPI index, from 0.38 in the 2008–2009 period to 0.89 in the 2017–2018 period. For group EU15, the total-factor N2O emission performance increased by 202% (from 0.32 to 0.97), while for group EU11, the emission performance increased by 94.88% (from 0.43 to 0.84).
At the country level, based on the TCPI index, 24 countries show an increase in N2O emission performance, whereas only 3 countries, a decrease (Romania, Hungary, and Bulgaria).
The average efficiency change (EC) index of N2O emission performance, for all countries and all years, is 2.51 suggesting efficiency gain. For group EU15 the EC has a value of 5.37 over unity, while group EU11 has a value under unity. This suggests that while state members which joined the EU after 2004 seem to have improved their agriculture efficiency, the “new” countries have diminished their efficiency. This may be due to a larger market for their products as well as having to comply with EU regulations.
The average best-practice change (BPC) index is approximately 1.57 indicating an increase in technology change. This implies that the contemporaneous frontier moves closer toward the intertemporal frontier. Previous results obtained in this research, confirm that there was indeed an improvement in technology although this change is not consistent in every country.
The average annual technology gap ratio change (TGN) index value is 0.87 which implies little change in the gap between the global frontier and the intertemporal frontier. For group 1 the average value of TGN is 0.6819 suggesting a medium change in the gap between the global frontier and the intertemporal frontier. However, for group 2 the average value of TGN is 1 suggesting no change between the two frontiers.
We examine the trends in dynamic total factor N2O emission performance and its decomposition. Figures 8–11 show the empirical results for the average MNMNPI for the 2008–2018 period and its decomposition for EU state-members, groups EU15 and EU15. The dynamic total-factor N2O emission performance evolution shows a significant increase from 0.38, in 2008–2009, to 0.89, in 2017–2018. During the 2008–2019 period, the MNMNPI showed values greater than unity for only three countries (Netherlands, Italy, and Slovenia), indicating a decrease in N2O emission performance. However, its value continued to increase towards unity, meaning towards increasing N2O emission performance (Figure 8).
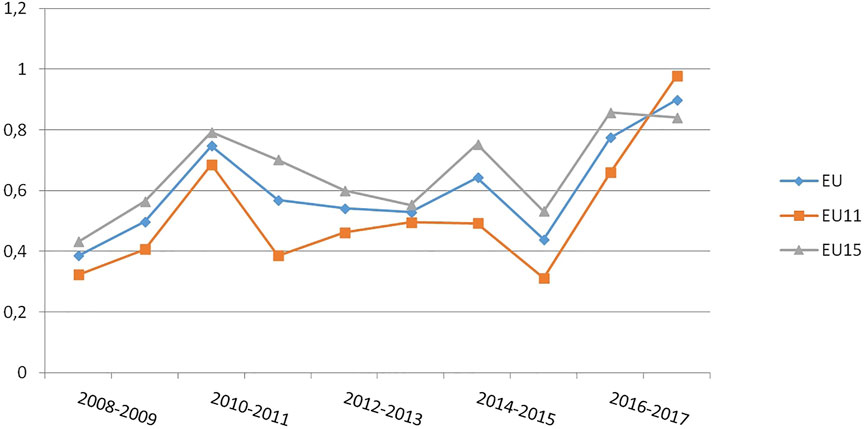
FIGURE 8. Changes in average MNMNPI index. Source: authors’ calculation based on EEA, (2020).

FIGURE 9. Changes in average EC index. Source: authors’ calculation based on EEA, (2020).
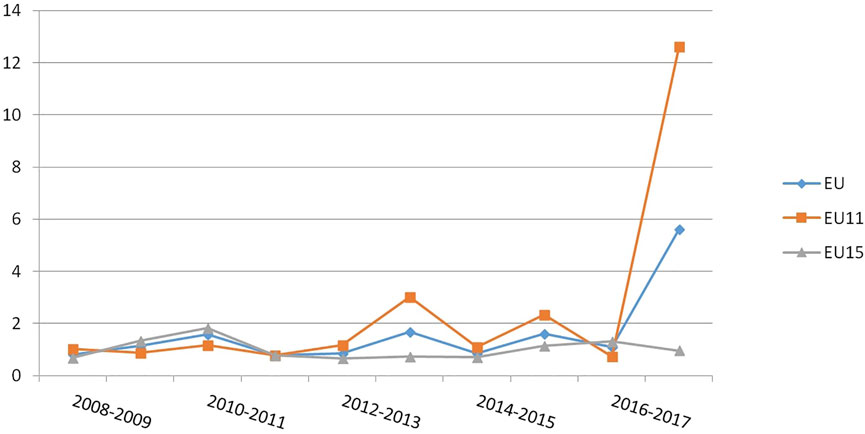
FIGURE 10. Changes in average BPC index. Source: authors’ calculation based on EEA, (2020).
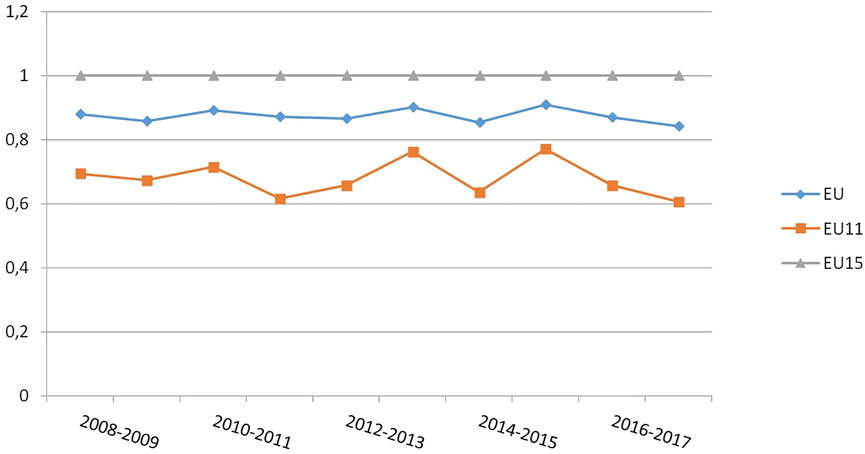
FIGURE 11. Changes in average TGN index. Source: authors’ calculation based on EEA, (2020).
The dynamic EC evolution shows a significant increase from 0.53 to 0.92. However, the EC index of N2O emissions shows a value greater than unity for only two periods of time, 2014–2015 and 2016–2017, indicating good catch-up performance. However, for the rest of the periods, the EC index shows a value less than unity, indicating an overall decline in efficiency.
The dynamic BPC evolution also shows a significant increase in value. The BPC index for the 2008–2009, 2011–2012, 2012–2013, and 2014–2015 periods is less than unity, indicating a period of technological decline, whereas for the rest of the periods the BPC index is greater than unity, suggesting technological progress.
We compare the MNMNPI and its decomposition at the group level. Group EU15 has an average MNMNPI index value of 0.52 which is less than the value for group EU11 which is 0.66. In terms of EC indexes, group EU15 has a value of 5.37 while group EU11 has a value of 0.65. Hence, group EU15 has a gain in efficiency, while group EU11 has a loss of efficiency. Both groups have a BPC index value greater than unity suggesting technological change. The changes in TGP are less than unity for both groups suggesting the lack of technology leadership.
The two groups show similar MNMNPI trends having an increasing trend, group EU15 showing a greater value for all years meaning the relationship between these two groups is not competitive. The two groups show similar EC trends with group EU11 showing a slightly higher average EC. In terms of the BPC index, the trends of the two groups are also similar. Group EU11 has a higher BPC index overall and as such state members in this group have a greater technology change. Both groups show TGN index values less than unity, and both show a lack of technology leadership.
The results of group differences could provide useful information for the European Commission in order to negotiate with individual state members as to the N2O emission reduction targets based on their performance. For example, Romania has an average MNMNPI of 0.43873, an EC index value of 0.6441 (suggesting efficiency loss), and a BPC value of 1.04708. As such, Romania has experienced an efficiency loss due to a technology change. This situation is confirmed by the increased sales of pesticides and chemical fertilizers. As such, Romania needs to tackle its N2O reduction emission targets from agriculture activities by changing the technology used and keeping in mind the necessity of increasing efficiency.
5 Discussion
Decoupling analysis of agricultural growth from CO2, CH4, and N2O emissions based on short-term, middle-term and long term status revealed different results. There is no country which has short-term decoupling status only either SD or WD suggesting that there is still room for improvements in EU agriculture. Moreover, we notice a shift in decoupling status in the second period (2013–2018) for all three air pollutants considered in this research. In the first period (2008–2013) 75% of countries have only SD or WD status, a percentage which dropped to 53% in the second period. This development should concern low-carbon agriculture policy-makers. Moreover, intensities did not increase as much as emissions suggesting agriculture practices did not change heavily, but the production increased causing environmental damage. This can be also observed by the slow adoption of sustainable agricultural practices in the form of organic agriculture. Although the numerous reforms of the Common Agricultural Policy (CAP) had among their long-term objectives the promotion of sustainable agriculture in accordance with environmental principles, the achievement of environmentally friendly agriculture is still an insufficiently addressed topic. As Erjavec and Rac, (2017) and Matthews, (2017) highlight the post-2020 CAP reform and framework determines a major impulse for greening justification and moves architecture forward to achieve more environmentally friendly agricultural practices.
The slow development of organic agriculture can be attributed, among other things, to product demand evolution. Sustainable foods are more costly and attract selective buyers, the reasons behind their purchases’ behaviors being subject to many studies. Lăzăroiu et al. (2019) show that consumers’ trust and perceptions of the nutritional benefits are shaping the consumers’ behavior when it comes to bio-foods. Another factor is price, such products being significantly more expensive. Even though humans are aware of the value of clean and sustainable foods, they may choose to not buy better quality items due to budget constraints (Pocol et al., 2021). Moreover, another obstacle in the adoption of organic agriculture is land yield which may not be sufficient to satisfy the world’s population needs.
Results obtained through a metafrontier analysis revealed an increase in total-factor N2O emission performance for the period considered. Moreover, the decomposition of the MNMNPI index suggests an efficiency loss and a technology change. At the country level, based on the TCPI index, 24 countries show an increase in N2O emission performance, whereas only 3 countries, a decrease (Romania, Hungary, and Bulgaria). While old state members (joined EU before 2004) more economically developed have managed to reduce their agriculture emissions through technology change (EC is greater than 1 suggesting efficiency gain), new state members experienced an efficiency loss (EC < 1). Entry into the free market of the European Union has been both an opportunity and a challenge for underdeveloped or developing countries. On the one hand, access to the open market meant more sales, on the other hand, the pressure to produce as much and as fast as possible increased. Therefore, in eastern countries, increasing production has meant using more chemicals.
The results of group differences could provide useful information for the European Commission in order to negotiate with individual state members as to the N2O emission reduction targets based on their performance. For example, Romania has experienced an efficiency loss due to a technology change. This situation is confirmed by the increased sales of pesticides and chemical fertilizers (Andrei et al., 2021). As such, Romania needs to tackle its N2O reduction emission targets from agriculture activities by changing the technology use and keeping in mind the necessity of increasing efficiency. Slowing down the intensification and specialization of agricultural systems but also maintaining the diversification of crops and permanent pastures are key elements in the process of ensuring a friendly environment. At the same time, financial measures to support areas with natural handicaps and income incentives for farmers support climate and environmental policies.
Moreover, while most studies focus on analyzing GHG from the use of chemical fertilizers and providing solutions in the form of organic farming (Djokoto, 2015; Skinner et al., 2019; Saffeullah et al., 2021), the introduction of renewable energy into agricultural production can also help reduce the adverse environmental effects (Yan et al., 2017; Așchilean et al., 2018; Rahman et al., 2022). Hence, reducing agricultural GHG relies not only on new, safer, and sustainable practices of land use but also on incorporating green energy into the production process.
Green energy mostly comes in the form of solar, wind, and hydro energy; moreover recently, a new path for energy sustainability has emerged in the form of renewable hydrogen production (Pflugmann and De Blasio, 2020). However, hydrogen production could indirectly or directly compete with agriculture due to the amount of water needed in production. As such, hydrogen production could not be possible in countries where water is scarce, for example, Saudia Arabia. Furthermore, in order to mitigate climate change, hydrogen production should only use energy from renewable energy sources.
Concerning the first research question of this research, the answer is yes and no. New state members, on average and based on pooled data, have an efficiency loss in terms of N2O performance; old state members experienced the opposite. However, there is an upward trend when it comes to efficiency, on average each year, for the former, while for the latter the increase is less pronounced, suggesting a narrowing of the gap between these groups over time.
Most EU countries managed to reduce their CO2, CH4, and N2O emissions, with a few exceptions. Of concern for EU Commission are the situations in three neighboring countries, Romania, Bulgaria, and Hungary. CO2 and N2O emissions have increased in Romania, and CO2 and CH4 emissions increased in Hungary. All three countries have a less than ideal decoupling status for either of the air pollutants considered.
Environmental sustainability is facing many problems, another issue being the plastic pandemic that agriculture can help remedy through the use of bioplastics (De Blasio and Fallon, 2022). The question that arises is “Would a sustainable production of bioplastics be possible without jeopardizing food security?“. The answer is given by van den Oever et al. (2017) and is affirmative. They show that producing bioplastics from biomass would only require about 5% of global biomass production. However, for bioplastics to be truly sustainable they should also be biodegradable, and as such a composite infrastructure is needed.
6 Conclusions and policy implications
Agricultural green gas emissions have sharply risen during the last decade, determining a massive impact on environmental policies and causing a severe decrease in land use value and degradation problems in most agricultural economies, especially the post-transition countries. As He et al. (2021) argue, agriculture is an important source of greenhouse gas (GHG) emissions, and it cannot be ignored in contemporary economies.
Our research aimed to provide insights into which countries could be the most relevant to be targeted by policymakers in order for the EU to obtain its Paris Agreement Climate Change targets. We focused on studying, by decoupling and metafrontier analysis, which EU state-members managed to improve their agriculture environmental efficiency and which have not. In our opinion, this is important, as metafrontier analysis can measure efficiency by constructing a production model which seeks to reduce nitrogen fertilizer use, labor, and agricultural area and increase output while reducing N2O emissions. From a literature perspective, this research contributes to the advancement of the greenhouse gas emissions field by highlighting the importance of agriculture GHG in contemporary society. Agriculture has a major impact on the land, on biodiversity, on the balance of nutrients in the soil, changing rural landscapes, and exerting a major, significant pressure on the environment in particular and rural communities in general. Studies on the importance of sustainable agriculture are increasingly becoming more important in the last years of its beneficial role for a pro-environmental society and healthy living (Martin et al., 2020; Shimoda et al., 2020; Zebardast and Radaei, 2022). Our research also enriches the literature on decoupling and metafrontier analysis which involves classifying countries/companies/individuals according to efficiency. Decoupling analysis is important since it is commonly appreciated that greenhouse gas emission has a strong relationship with agricultural income (Zafeiriou et al., 2018) and as such the research analysis the decoupling of GHG from agriculture income represented by output. Countries that have a strong decoupling status can achieve easily their agriculture climate change targets. Strong coupling implies that emissions grow at the same rate as income, making it difficult for that country to obtain sustainability. For those states, there is an imperative need for technology change and immediate measures to mitigate GHG emissions.
7 Limitations and future recommendations
The complexity of the research has determined a limited approach to the investigation of the decoupling of CO2, CH4, and N2O across EU agriculture emissions. In this context, some limitations of the study occur and include only considering one undesirable output for the DEA model, in the form of N2O emissions and three input variables (nitrogen fertilizer, labor, and utilized agricultural area). Further research should take into account more input variables such as livestock, irrigation, energy, capital, and machinery. Furthermore, future investigations can measure efficiency through new and more complex production models and DEA optimization problems which offer further insights into agriculture problems. Moreover, some undesirable outputs suitable for investigating agriculture environmental sustainability are the intensity of N2O emissions or the use of chemical fertilizer. Future directions of the research include constructing a synthetic index in the same manner and establishing links between the indicator and some effects and causes through econometric models, such as a panel linear regression.
Data availability statement
The original contributions presented in the study are included in the article/Supplementary Material, further inquiries can be directed to the corresponding authors.
Author contributions
All authors contributed to the study conception and design. Material preparation, data collection, and analysis were performed by JA, IB, SA, IG, CG, and AD. The first draft of the manuscript was written by IB and all authors commented on previous versions of the manuscript. All authors read and approved the final manuscript.
Funding
Open access funding under the Project Strategic pillar in the development of local communities and the business environment by strengthening administrative capacity in protected natural areas in Romania, SIPOCA/MySMIS 607/127638, National Agency for Protected Natural Areas (ANANP).This study was supported in part by the National Agency for Protected Natural Areas (ANANP) on the Project Strategic pillar in the development of local communities.
Conflict of interest
The reviewer EN declared a shared affiliation with the author IB to the handling editor at the time of review.
Publisher’s note
All claims expressed in this article are solely those of the authors and do not necessarily represent those of their affiliated organizations, or those of the publisher, the editors, and the reviewers. Any product that may be evaluated in this article, or claim that may be made by its manufacturer, is not guaranteed or endorsed by the publisher.
References
Andrei, J. V., Avram, S., Băncescu, I., Gâf Deac, I. I. G., and Gheorghe, C. (2021). Evolution of Romania's economic structure and environment degradation - an assessment through LMDI decomposition approach. Rmhp Vol. 14, 3505–3521. doi:10.2147/rmhp.s299617
Appiah, K., Du, J., and Poku, J. (2018). Causal relationship between agricultural production and carbon dioxide emissions in selected emerging economies. Environ. Sci. Pollut. Res. 25 (25), 24764–24777. doi:10.1007/s11356-018-2523-z
Aschilean, I., Rasoi, G., Raboaca, M. S., Filote, C., and Culcer, M. (2018). Design and concept of an energy system based on renewable sources for greenhouse sustainable agriculture. Energies 11 (5), 1201. doi:10.3390/en11051201
Bos, J. F., Haan, J., Sukkel, W., and Schils, R. L. (2014). Energy use and greenhouse gas emissions in organic and conventional farming systems in The Netherlands. NJAS Wageningen J. Life Sci. 68, 61–70. doi:10.1016/j.njas.2013.12.003
Chathumini, K. K. G. L., Dassanayake, N. P., Preethika, D. D. P., Wadanambi, R. T., Wandana, L. S., and Arachchige, U. S. (2021). Agriculture and greenhouse gas emissions. J. Res. Technol. Eng. 2 (2), 22–31.
Coderoni, S., and Esposti, R. (2018). CAP payments and agricultural GHG emissions in Italy. A farm-level assessment. Sci. Total Environ. 627, 427–437. doi:10.1016/j.scitotenv.2018.01.197
Coelli, T. J., and Rao, D. P. (2005). Total factor productivity growth in agriculture: A malmquist index analysis of 93 countries, 1980-2000. Agric. Econ. 32, 115–134. doi:10.1111/j.0169-5150.2004.00018.x
De Blasio, N., and Fallon, P. (2022). The plastic waste challenge in a post-COVID-19 world: A circular approach to sustainability. J. Self-Gov. Manag. Econ. 10 (1), 7–29. doi:10.22381/jsme10120221
Djokoto, J. G. (2015). Technical efficiency of organic agriculture: A quantitative review. Stud. Agric. Econ. 117 (2), 67–71. doi:10.7896/j.1512
EEA (2020). Annual European Union greenhouse gas inventory 1990–2018 and inventory report 2020. Available at: https://www.eea.europa.eu/publications/european-union-greenhouse-gas-inventory-2020 (accessed 0810, 2021).
Erjavec, E., and Rac, I. (20172021). The CAP Communication: Paradigmatic change or empty rhetoric. CAP Reform. Available at: http://capreform.eu/(Accessed 12 18, 2021).
Expósito, A., and Velasco, F. (2020). Exploring environmental efficiency of the European agricultural sector in the use of mineral fertilizers. J. Clean. Prod. 253, 119971. doi:10.1016/j.jclepro.2020.119971
Färe, R., and Grosskopf, S. (2006). New directions: Efficiency and productivity, 3. Springer Science & Business Media.
Fukuyama, H., and Weber, W. L. (2009). A directional slacks-based measure of technical inefficiency. Socio-Economic Plan. Sci. 43 (4), 274–287. doi:10.1016/j.seps.2008.12.001
Garnier, J., Le Noë, J., Marescaux, A., Sanz-Cobena, A., Lassaletta, L., Silvestre, M., and Thieu, G. (2019). Long-term changes in greenhouse gas emissions from French agriculture and livestock (1852–2014): From traditional agriculture to conventional intensive systems. Sci. Total Environ. 660, 1486–1501. doi:10.1016/j.scitotenv.2019.01.048
Gorh, D., and Baruah, K. K. (2019). Estimation of methane and nitrous oxide emission from wetland rice paddies with reference to global warming potential. Environ. Sci. Pollut. Res. 26 (16), 16331–16344. doi:10.1007/s11356-019-05026-z
Han, H., Zhong, Z., Guo, Y., Xi, F., and Liu, S. (2018). Coupling and decoupling effects of agricultural carbon emissions in China and their driving factors. Environ. Sci. Pollut. Res. 25 (25), 25280–25293. doi:10.1007/s11356-018-2589-7
He, Y., Zhu, S., Zhang, Y., and Zhou, Y. (2021). Calculation, elasticity and regional differences of agricultural greenhouse gas shadow prices. Sci. Total Environ. 790, 148061. doi:10.1016/j.scitotenv.2021.148061
Hossain, M. A., and Chen, S. (2021). The decoupling study of agricultural energy-driven CO2 emissions from agricultural sector development. Int. J. Environ. Sci. Technol., 1–16. doi:10.1007/s13762-021-03346-7
INCA (2021). Accounting for ecosystems and their services in the European Union (INCA)-2021 edition. Available at: https://ec.europa.eu/eurostat/en/web/products-statistical-reports/-/ks-ft-20-002 (accessed 1112, 2021).Final report from phase II of the INCA project aiming to develop a pilot for an integrated system of ecosystem accounts for the EU.
International Energy Agency (IEA) (2016). Decoupling of global emissions and economic growth confirmed. Available at: https://www.iea.org/newsroom/news/2016/march/decoupling-of-global-emissions-and-economic-growth-confirmed.html.
Jacobs, C., Berglund, M., Kurnik, B., Dworak, T., Marras, S., Mereu, V., et al. (2019). Climate change adaptation in the agriculture sector in Europe (No. 4/2019). Luxembourg: Publications Office of the European Union.
Jiang, J., Zhao, T., and Wang, J. (2021). Decoupling analysis and scenario prediction of agricultural CO2 emissions: An empirical analysis of 30 provinces in China. J. Clean. Prod. 320, 128798. doi:10.1016/j.jclepro.2021.128798
Lăzăroiu, G., Andronie, M., Uţă, C., and Hurloiu, I. (2019). Trust management in organic agriculture: Sustainable consumption behavior, environmentally conscious purchase intention, and healthy food choices. Front. Public Health 7, 340. doi:10.3389/fpubh.2019.00340
Lesschen, J. P., van den Berg, M., Westhoek, H. J., Witzke, H. P., and Oenema, O. (2011). Greenhouse gas emission profiles of European livestock sectors. Animal Feed Sci. Technol. 166, 16–28. doi:10.1016/j.anifeedsci.2011.04.058
Li, Y., Li, Y., Zhou, Y., Shi, Y., and Zhu, X. (2012). Investigation of a coupling model of coordination between urbanization and the environment. J. Environ. Manag. 98, 127–133. doi:10.1016/j.jenvman.2011.12.025
Lin, B., and Fei, R. (2015). Regional differences of CO2 emissions performance in China’s agricultural sector: A malmquist index approach. Eur. J. Agron. 70, 33–40. doi:10.1016/j.eja.2015.06.009
Lin, B., and Xu, B. (2018). Factors affecting CO2 emissions in China's agriculture sector: A quantile regression. Renew. Sustain. Energy Rev. 94, 15–27. doi:10.1016/j.rser.2018.05.065
Loboguerrero, A. M., Campbell, B. M., Cooper, P. J., Hansen, J. W., Rosenstock, T., and Wollenberg, E. (2019). Food and Earth systems: Priorities for climate change adaptation and mitigation for agriculture and food systems. Sustainability 11 (5), 1372. doi:10.3390/su11051372
Mardani, A., Zavadskas, E. K., Streimikiene, D., Jusoh, A., and Khoshnoudi, M. (2017). A comprehensive review of data envelopment analysis (DEA) approach in energy efficiency. Renew. Sustain. Energy Rev. 70, 1298–1322. doi:10.1016/j.rser.2016.12.030
Martin, L., White, M. P., Hunt, A., Richardson, M., Pahl, S., and Burt, J. (2020). Nature contact, nature connectedness and associations with health, wellbeing and pro-environmental behaviours. J. Environ. Psychol. 68, 101389. doi:10.1016/j.jenvp.2020.101389
Matthews, A. (20172021). Decoding the CAP communication. CAP reform. Available at: http://capreform.eu/(Accessed 12 18, 2021).
McCarl, B. A. (2019). Economic Issues In Global Climate Change: Agriculture, Forestry, 273.The role of agriculture in climate change: A preliminary evaluation of emission-control strategiesNat. Resour.
Muller, A., Schader, C., Scialabba, N. E. H., Brüggemann, J., Isensee, A., Erb, K. H., and Niggli, U. (2017). Strategies for feeding the world more sustainably with organic agriculture. Nat. Commun. 8 (1), 1–13. doi:10.1038/s41467-017-01410-w
Nowak, A., and Kubik, R. (2019). Changes in agricultural productivity in new and old member states of the European Union.
Oh, D. H. (2010). A metafrontier approach for measuring an environmentally sensitive productivity growth index. Energy Econ. 32 (1), 146–157. doi:10.1016/j.eneco.2009.07.006
Oh, D. H., and Lee, J. D. (2010). A metafrontier approach for measuring Malmquist productivity index. Empir. Econ. 38 (1), 47–64. doi:10.1007/s00181-009-0255-0
Pflugmann, F., and De Blasio, N. (2020). The geopolitics of renewable hydrogen in low-carbon energy markets. Geopolit. Hist. Int. Relat. 12 (1), 9–44. doi:10.22381/GHIR12120201
Pinter, M., and Kirner, L. (2014). Strategies of disadvantaged mountain dairy farmers as indicators of agricultural structural change: A case study of murau, Austria. Land Use Policy 38, 441–453. doi:10.1016/j.landusepol.2013.12.007
Pocol, C. B., Marinescu, V., Dabija, D. C., and Amuza, A. (2021). Clustering generation Z University students based on daily fruit and vegetable consumption: Empirical research in an emerging market. Br. Food J. 123, 2705–2727. doi:10.1108/BFJ-10-2020-0900
Qiao, H., Zheng, F., Jiang, H., and Dong, K. (2019). The greenhouse effect of the agriculture-economic growth-renewable energy nexus: Evidence from G20 countries. Sci. Total Environ. 671, 722–731. doi:10.1016/j.scitotenv.2019.03.336
Rahman, M. M., Khan, I., Field, D. L., Techato, K., and Alameh, K. (2022). Powering agriculture: Present status, future potential, and challenges of renewable energy applications. Renew. Energy 188, 731–749. doi:10.1016/j.renene.2022.02.065
Rai, R., Rajput, M., Agrawal, M., and Agrawal, S. B. (2011). Gaseous air pollutants: A review on current and future trends of emissions and impact on agriculture. J. Sci. Res. 55 (771), 1.
Ridzuan, N. H. A. M., Marwan, N. F., Khalid, N., Ali, M. H., and Tseng, M. L. (2020). Effects of agriculture, renewable energy, and economic growth on carbon dioxide emissions: Evidence of the environmental Kuznets curve. Resour. Conservation Recycl. 160, 104879. doi:10.1016/j.resconrec.2020.104879
Roinioti, A., and Koroneos, C. (2017). The decomposition of CO2 emissions from energy use in Greece before and during the economic crisis and their decoupling from economic growth. Renew. Sustain. Energy Rev. 76, 448–459. doi:10.1016/j.rser.2017.03.026
Saffeullah, P., Nabi, N., Liaqat, S., Anjum, N. A., Siddiqi, T. O., and Umar, S. (2021). “Organic agriculture: Principles, current status, and significance,” in Microbiota and biofertilizers (Cham: Springer), 17–37. doi:10.1007/978-3-030-48771-3_2
Saha, D., Kaye, J. P., Bhowmik, A., Bruns, M. A., Wallace, J. M., and Kemanian, A. R. (2021). Organic fertility inputs synergistically increase denitrification‐ derived nitrous oxide emissions in agroecosystems. Ecol. Appl. 31 (7), e02403. doi:10.1002/eap.2403
Sanz-Cobena, A., Lassaletta, L., Aguilera, E., del Prado, A., Garnier, J., Billen, G., and Smith, P. (2017). Strategies for greenhouse gas emissions mitigation in mediterranean agriculture: A review. Agric. Ecosyst. Environ. 238, 5–24. doi:10.1016/j.agee.2016.09.038
Senapati, N., Chabbi, A., Giostri, A. F., Yeluripati, J. B., and Smith, P. (2016). Modelling nitrous oxide emissions from mown-grass and grain-cropping systems: Testing and sensitivity analysis of DailyDayCent using high frequency measurements. Sci. Total Environ. 572, 955–977. doi:10.1016/j.scitotenv.2016.07.226
Shimoda, A., Hayashi, H., Sussman, D., Nansai, K., Fukuba, I., Kawachi, I., et al. (2020). Our health, our planet: A cross-sectional analysis on the association between health consciousness and pro-environmental behavior among health professionals. Int. J. Environ. health Res. 30 (1), 63–74. doi:10.1080/09603123.2019.1572871
Shuai, C., Chen, X., Wu, Y., Zhang, Y., and Tan, Y. (2019). A three-step strategy for decoupling economic growth from carbon emission: Empirical evidences from 133 countries. Sci. total Environ. 646, 524–543. doi:10.1016/j.scitotenv.2018.07.045
Skinner, C., Gattinger, A., Krauss, M., Krause, H. M., Mayer, J., Van Der Heijden, M. G., et al. (2019). The impact of long-term organic farming on soil-derived greenhouse gas emissions. Sci. Rep. 9 (1), 1–10. doi:10.1038/s41598-018-38207-w
Song, M., An, Q., Zhang, W., Wang, Z., and Wu, J. (2012). Environmental efficiency evaluation based on data envelopment analysis: A review. Renew. Sustain. Energy Rev. 16 (7), 4465–4469. doi:10.1016/j.rser.2012.04.052
Staniszewski, J., and Kryszak, Ł. (2022). Do structures matter in the process of sustainable intensification? A case study of agriculture in the European union countries. Agriculture 12 (3), 334. doi:10.3390/agriculture12030334
Tang, Z. (2015). An integrated approach to evaluating the coupling coordination between tourism and the environment. Tour. Manag. 46, 11–19. doi:10.1016/j.tourman.2014.06.001
Tapio, P. (2005). Towards a theory of decoupling: Degrees of decoupling in the EU and the case of road traffic in Finland between 1970 and 2001. Transp. Policy 12 (2), 137–151. doi:10.1016/j.tranpol.2005.01.001
Tongwane, M. I., and Moeletsi, M. E. (2018). A review of greenhouse gas emissions from the agriculture sector in Africa. Agric. Syst. 166, 124–134. doi:10.1016/j.agsy.2018.08.011
Tulkens, H., and Eeckaut, P. V. (1995). Non-parametric efficiency, progress and regress measures for panel data: Methodological aspects. Eur. J. Operational Res. 80 (3), 474–499. doi:10.1016/0377-2217(94)00132-v
Van den Oever, M., Molenveld, K., van der Zee, M., and Bos, H. (2017). Bio-basedand biodegradable plastics : Facts and Figures: Focus on food packaging in The Netherlands. Wageningen: Wageningen Food & Biobased Research. doi:10.18174/408350
Van Meijl, H., Havlik, P., Lotze-Campen, H., Stehfest, E., Witzke, P., Domínguez, I. P., et al. (2018). Comparing impacts of climate change and mitigation on global agriculture by 2050. Environ. Res. Lett. 13 (6), 064021. doi:10.1088/1748-9326/aabdc4
Vlontzos, G., Niavis, S., and Pardalos, P. (2017). Testing for environmental Kuznets curve in the EU agricultural sector through an eco-(in) efficiency index. Energies 10 (12), 1992. doi:10.3390/en10121992
Wang, H., Zhou, P., and Zhou, D. Q. (2013). Scenario-based energy efficiency and productivity in China: A non-radial directional distance function analysis. Energy Econ. 40, 795–803. doi:10.1016/j.eneco.2013.09.030
Wang, L., Vo, X. V., Shahbaz, M., and Ak, A. (2020). Globalization and carbon emissions: Is there any role of agriculture value-added, financial development, and natural resource rent in the aftermath of COP21? J. Environ. Manag. 268, 110712. doi:10.1016/j.jenvman.2020.110712
Wen, L., and Li, H. (2019). Estimation of agricultural energy efficiency in five provinces: Based on data envelopment analysis and Malmquist index model. Energy Sources, Part A Recovery, Util. Environ. Eff., 1–14. doi:10.1080/15567036.2019.1651798
Wiśniewski, P., and Kistowski, M. (2018). Assessment of greenhouse gas emissions from agricultural sources in order to plan for needs of low carbon economy at local level in Poland. Geografisk Tidsskrift-Danish J. Geogr. 118 (2), 123–136.
Yan, Q., Yin, J., Baležentis, T., Makutėnienė, D., and Štreimikienė, D. (2017). Energy-related GHG emission in agriculture of the European countries: An application of the Generalized Divisia Index. J. Clean. Prod. 164, 686–694. doi:10.1016/j.jclepro.2017.07.010
Yang, Z., Wang, D., Du, T., Zhang, A., and Zhou, Y. (2018). Total-factor energy efficiency in China’s agricultural sector: Trends, disparities and potentials. Energies 11 (4), 853. doi:10.3390/en11040853
Yao, X., Zhou, H., Zhang, A., and Li, A. (2015). Regional energy efficiency, carbon emission performance and technology gaps in China: A meta-frontier non-radial directional distance function analysis. Energy Policy 84, 142–154. doi:10.1016/j.enpol.2015.05.001
Zafeiriou, E., Mallidis, I., Galanopoulos, K., and Arabatzis, G. (2018). Greenhouse gas emissions and economic performance in EU agriculture: An empirical study in a non-linear framework. Sustainability 10 (11), 3837. doi:10.3390/su10113837
Zebardast, L., and Radaei, M. (2022). The influence of global crises on reshaping pro-environmental behavior, case study: The COVID-19 pandemic. Sci. Total Environ. 811, 151436. doi:10.1016/j.scitotenv.2021.151436
Zhang, N., and Choi, Y. (2013). Total-factor carbon emission performance of fossil fuel power plants in China: A metafrontier non-radial malmquist index analysis. Energy Econ. 40, 549–559. doi:10.1016/j.eneco.2013.08.012
Zhong, S., Li, Y., Li, J., and Yang, H. (2021). Measurement of total factor productivity of green agriculture in China: Analysis of the regional differences based on China. Plos one 16 (9), e0257239. doi:10.1371/journal.pone.0257239
Zhou, P., Ang, B. W., and Wang, H. (2012). Energy and CO2 emission performance in electricity generation: A non-radial directional distance function approach. Eur. J. operational Res. 221 (3), 625–635. doi:10.1016/j.ejor.2012.04.022
Keywords: agriculture emissions, environmental economics, agricultural economics, metafrontier analysis, decoupling analysis
Citation: Andrei JV, Avram S, Băncescu I, Gâf Deac II, Gheorghe CA and Diaconu AI (2022) Decoupling of CO2, CH4, and N2O agriculture emissions in the EU. Front. Environ. Sci. 10:920458. doi: 10.3389/fenvs.2022.920458
Received: 14 April 2022; Accepted: 04 July 2022;
Published: 12 August 2022.
Edited by:
Zhen Wang, Huazhong Agricultural University, ChinaReviewed by:
Elvira Nica, Bucharest Academy of Economic Studies, RomaniaJelena Pubule, Riga Technical University, Latvia
Matheus Koengkan, University of Aveiro, Portugal
Copyright © 2022 Andrei, Avram, Băncescu, Gâf Deac, Gheorghe and Diaconu. This is an open-access article distributed under the terms of the Creative Commons Attribution License (CC BY). The use, distribution or reproduction in other forums is permitted, provided the original author(s) and the copyright owner(s) are credited and that the original publication in this journal is cited, in accordance with accepted academic practice. No use, distribution or reproduction is permitted which does not comply with these terms.
*Correspondence: Jean Vasile Andrei, YW5kcmVpX2plYW52YXNpbGVAeWFob28uY29t; Irina Băncescu, aXJpbmEuYmFuY2VzY3VAaWUuYXNlLnJv