
94% of researchers rate our articles as excellent or good
Learn more about the work of our research integrity team to safeguard the quality of each article we publish.
Find out more
ORIGINAL RESEARCH article
Front. Environ. Sci., 05 July 2022
Sec. Environmental Economics and Management
Volume 10 - 2022 | https://doi.org/10.3389/fenvs.2022.920412
This article is part of the Research TopicFinancial and Trade Globalization, Greener Technologies and Energy TransitionView all 46 articles
 Huaping Zhang*
 Yuanyuan Ren
By setting up an evaluation indicator system (EIS) containing bad outcomes for green full-factor productivity (GFFP), this work utilizes the super epsilon-based measure (Super EBM) model to assess the GFFPs of 11 regional-level administrative regions (regions) in the Changjiang Economic Area (CEA) from 2005 to 2019, and goes on to analyze the regional difference and spatial correlation between the regional GFFPs. On this basis, spatial measurement models were adopted to analyze how GFFP is affected by foreign direct investment (FDI), industrial structure optimization (ISO), and their cross term. The results show that: During the sample period, the GFFPs in the CEA exhibited large regional differences. Shanghai’s GFFP fell on the efficient frontier. This state was not achieved by any other region in the CEA, leaving a room for improvement. In general, most regions in the lower basin of the CEA had satisfactory GFFPs, while those in the middle and upper basin had general GFFPs. Besides, the GFFP trends were similar in the upper, middle, and lower basin of the CEA. Before 2010, the GFFPs in all three regions did not change significantly. After that year, the GFFPs in the three regions began to decline. During the sample period, the Global Moran’s I values of CEA GFFPs remained positive, and went through the test of significance in most years. Thus, the GFFPs were clustered prominently in space. Considering the results of spatial measurement models, the CEA GFFPs were significantly inhibited by FDI, and promoted by ISO; the cross term between FDI and ISO positively affected GFFP. Among the control parameters, economic growth and environment regulation clearly promote GFFP, urbanization level strongly inhibits GFFP, and energy structure does not significantly affect GFFP. The research results disclose the internal correlations between FDI and ISO in the transformation to green development: the benign interaction between FDI and regional ISO paves the way to green development for the CEA.
The opening-up strategy has spurred the economic development in China. The economic aggregate of China is now only smaller than that of the United States (US). Behind the fast economic growth lay soaring resource consumption, and serious environmental damages. According to the US Energy Information Administration (EIA), China is heavily dependent on energy, and has overtaken the US as the largest energy consumer. The environmental quality in China is far from satisfactory. The country ranked low in the 2018 Global Environment Performance Indicator, an authoritative ranking of environmental quality. Against this backdrop, China has fully realized the importance of changing the model of economic growth, and pledged to develop the economy with a high quality. The full-factor productivity (TFP) is crucial to the quality of economic development. Under the dual constraints of resources and environment, improving the green TFP (GFFP) is the necessary path toward economic growth and eco-environmental protection (Ahmed, 2012).
The key to improving GFFP is the proper handling of the relationship between economic development and ecological protection. To speed up economic growth, developing countries tend to attract more foreign capital faster at the cost of local environment, in the early phase of economic development. Then, the pollution haven hypothesis of Walter and Ugelow (1979) will apply. If the government regulation is weak, China will face a severe pollution of the eco-environment: The entry of foreign-funded industries, which feature high consumption and high pollution, will stimulate economic development in China, a resource-rich country, at the expense of ecological environment. The regional industrial structure is closely related to the influence of foreign direct investment (FDI) over GFFP. If the region has a backward industrial structure, the entry of foreign capital will energize the resource-intensive industries, which seriously pollute the eco-environment. If the region has an advanced industrial structure, the entry of foreign capital will lead to the expansion of tertiary industries like high-tech or service industries, which improves the local environment and thus the GFFP. Thus, this paper intends to test the important impact of FDI on GFFP, and discusses whether ISO significantly affects GFFP, and whether FDI interacts well with ISO to boost GFFP. The previous studies mainly focus on the country level, and rarely tackles the Changjiang Economic Area (CEA) in China. Further research is needed to verify if the relevant results apply to the CEA.
As an economic engine of China, the Changjiang Economic Area (CEA) accounts 40% of the country’s population and gross domestic product (GDP), with only 21.4% of the country’s landmass. The population and economic densities of the CEA are greater than those in any other region of China. As a result, the CEA’s economic development faces tremendous pressures from resources and environment. The pressures are even greater, as China is poised to pilot the construction of ecological civilization in the CEA. Thus, the CEA must embark on a new road towards ecologic and green development. In this context, improving GFFP becomes the inevitable choice for the CEA to realize sustainable development.
To accelerate development, the CEA has been introducing a huge sum of foreign capital, and vigorously promoting ISO. The industrial structure of the region is constantly optimized. In 2019, the ratios between the three industries in the CEA changed from 8.1: 40.6: 51.1 to 7.8: 38.8: 53.5. The proportions of the first and second industries in the region further declined, while the proportion of the tertiary industry rose by 2.4% compared to the previous year. However, the CEA ISO still has an obvious provincial difference. Whether the difference greatly affects GFFP is worthy of further research.
How to improve GFFP has always been the focus of the academia. Many researchers have noticed the importance of foreign direct investment (FDI) to GFFP. In general, FDI has two different effects on the eco-environment of the host country: the pollution haven and pollution halo hypotheses. The former suggests that foreign investment brings high pollution industries, which directly or indirectly undermine local environmental quality (List and Co, 2000; Keller and Levinson, 2002). The latter argues that the FDI in the host country has a good technology spillover effect, which improves the governance of local environment (He, 2006).
Given the two different environmental effects of the FDI, different researchers draw different results on how the FDI affects GFFP. For example, Liu et al. (2016) studied the effect of the FDI on GFFP growth, using the data on 1,328 Chinese firms in 2003–2008, and discovered that FDI significantly promotes GFFP growth. Peng (2020) analyzed the panel data of 274 prefectures of China in 2005–2015, and concluded that the FDI has a prominent positive effect on GFFP. Focusing on 285 cities in China during 2003–2017, Yu et al. (2021) relied on the spatial Durbin model (SDM) to examine the clustering of the FDI, as well as its influence on urban GFFP. The results show that the FDI promotes the GFFP in cities falling in the high-high and high-low quadrants. Facing all regions in China, Luo et al. (2022) carried out quantile regression on the panel data, and found that the FDI negatively affects the green productivity. This finding supports the pollution haven hypothesis.
Some scholar also noted the relationship between industrial structure and GFFP. For instance, Wang et al. (2021) characterized industrial structure by the outcome of the secondary industry as a percentage of gross regional product (GRP), and revealed the significantly positive effect of industrial structure on GFFP. Xie et al. (2021) investigated the samples of 283 Chinese cities on the prefectural-level and above in 2003–2018, and also observed the significantly positive effect of industrial structure on urban GFFP. Lu et al. (2020) found that China’s GFFP could be promoted by rationalizing and optimizing the industrial structure. Overall, the existing studies mostly measure industrial structure with the proportion of secondary (tertiary) industry outcome in GDP, before exploring its relationship with the GFFP. Relatively few have directly probed into the influence of industrial structure optimization (ISO) on GFFP.
Besides, the capital and technical advantages of the FDI will cause technology spillover in the host country, which in turn promotes the ISO in that country (Grossman and Helpman, 2002). For example, Kippenberg (2005) discovered that the FDI promotes the industrial structure adjustment in Czech. However, there is no report on whether the interaction between FDI and ISO would affect GFFP.
To sum up, extensive studies have been conducted on GFFP, especially on the influence of FDI on GFFP, and the relationship between industrial structure and GFFP. The previous studies provide valuable experience about the measurement, influencing factors, and promoting paths of GFFP.
To address the problems of the previous studies, this paper makes two breakthroughs: Firstly, the existing studies on the effect of the FDI on GFFP mainly focus on the country level or the city level, but rarely tackle large regions like the CEA. Secondly, the literature either examines the relationship between the FDI and GFFP, or deals with the correlation between industrial structure and GFFP. But there is no report on whether the FDI interacts well with industrial structure, and whether the interaction significantly affects the GFFP. Thus, this work utilizes the super epsilon-based measure (Super EBM) model to measure the GFFPs in the CEA, and adopts spatial measurement models to examine the relationship between FDI, ISO, and GFFP. This work fills in the gaps of the relevant research fields.
Unlike stochastic frontier analysis (SFA), the commonly used tool of data envelopment analysis (DEA) adopts linear programming to determine the production frontier. DEA can process multi-intake and multi-outcome problems in efficiency evaluation, without needing to set up a production function. Therefore, this approach is highly flexible and applicable. That is why DEA becomes the mainstream approach of efficiency evaluation. In this paper, GFFP is treated as an efficiency evaluation problem. The index reflects the internal correlations between multiple intakes and outcomes. The accurate evaluation of GFFP calls for a suitable method. This paper aims to compare the GFFPs of multiple regions in the CEA. Therefore, the measured GFFPs must be a comparable relative efficiency. As a measuring tool for relative efficiency, DEA is precisely what is needed for GFFP measurement.
Since its nascence, DEA has been continuously evolving. The early DEA models are mostly radial ones, such as the model proposed by Banker et al. (BCC), and that proposed by Charnes et al. (CCR). These radial models can evaluate efficiency with multiple outcomes, provided that the outcomes could be maximized. However, neither BCC nor CCR could be directly adopted for efficiency assessment, when bad outcomes (e.g., pollutants) are present. It is necessary to process the bad outcomes before applying the radial models. The common practice is to take the bad outcomes as intakes, or take the log of the bad outcomes. But the processing of bad outcomes does not obey the realistic production law, resulting in a bias in efficiency evaluation (Zeng and Wei, 2021).
To deal with bad outcomes, Tone (2001) proposed the slack-based measure (SBM) model. Unlike the BCC and CCR models, the SBM model fully considers the slackness of intakes and outcomes, and includes it to the objective function, providing an effective solution to the efficiency evaluation with bad outcomes. As a non-angular, non-radial model, the SBM can prevent the bias arising from the selection of radial direction and angle.
Despite its popularity, the SBM faces a major defect: the inability to ensure the compatibility between radial and non-radial intakes and outcomes. The relationship between intakes and bad outcomes is radial. However, the intakes could be separated from good outcomes. The relationship between these two kinds of factors is non-radial. If an evaluation indicator system (EIS) contains both bad and good outcomes, the SBM cannot differentiate radial relationship from non-radial relationship, resulting in a deviation in the evaluated efficiency.
To ensure the compatibility between radial intakes and outcomes and non-radial ones, Tone and Tsutsui (2010) improved SBM into EBM. This hybrid model fully considers the radial relationship between intakes and outcomes, as well as the non-radial relationship between them. Nonetheless, when EBM measures efficiency, multiple decision-making units (DMUs) often have an efficiency of 1. Then, it is impossible to rank the DMUs by efficiency. The Super-EBM was soon developed to solve the problem. As the combination between EBM and super efficiency model, the Super-EBM overcomes the upper bound of 1 for DMU efficiency, and further improves the accuracy of efficiency measurement.
In the target problem, there is a production system with n DMUs. Each DMU is assumed to contain m intakes, u good outcomes, and v bad outcomes:
where,
This work intends to verify whether the regional GFFPs on the vast land of the CEA have significant spatial correlations. Also known as spatial dependence, spatial correlation refers to the possible correlations between the observation data on the research parameters in space, under the effects of spatial interaction and spatial diffusion. In general, spatial correlation could be measured by Global Moran’s I (Moran, 1948):
where, n is the number of regional-level administrative regions (regions) in the CEA; xi and xj are the observation values of the ith and jth regions, separately; Wij is the spatial weight matrix.
The Global Moran’s I falls between -1 and 1. If the indicator belongs to (0, 1] and goes through the test of significance on a certain level, then the two regions being examined have a significant positive correlation in space; if the indicator belongs to [−1, 0) and goes through the test of significance on a certain level, then the two regions have a significant negative correlation in space; only if the indicator equals 0, the two regions are independent, without any spatial correlation.
For simplicity, the spatial weight matrix Wij was expressed a Rook’s adjacency matrix of spatial weights:
The traditional measurement models, namely, ordinary least squares (OLS), fail to take account of the possible spatial dependence between parameters, and thus may make biased estimations. The emergence of spatial measurement models provides an effective solution to the potential spatial correlation between parameters in model regression. The current spatial measurement models could be roughly divided into spatial autoregressive model (SAR) and spatial error model (SEM) (Fan et al., 2021). The SAR could be represented by:
where, y is the dependent parameter; X is the matrix endogenous independent parameters;
The SEM could be represented by:
where,
Traditionally, the TFP only considers intakes like capital and labor, and good outcomes like GDP, without taking account of energy intake or bad outcomes like environmental pollution. With the rise of energy consumption and environmental pollution, the traditional TFP, which does not consider the constraints of resources and environment, cannot measure the level of economic development comprehensively. Some scholars pointed out that resources and environment are not merely endogenous parameters in economic development, but conditional constraints on economic growth. Based on the traditional TFP, it is necessary to incorporate relevant environmental factors (e.g., energy intake, and environmental outcomes) into the measurement framework, and formulate the GFFP, providing a guide to sustainable development. Referring to Lin B. and Chen G. (2018), this paper defines GFFP as the maximum good outcome and the minimum bad outcome obtained from a fixed quantity of intakes, such as labor, capital, and energy. The measured value is positively proportional to the quality of GFFP. The best GFFP should be greater than or equal to 1.
In this way, the authors established an EIS for GFFP (Table 1), which covers both intakes and outcomes. The intakes include labor, capital, and energy. The outcomes include a good outcome (real GDP), and two bad outcomes (pollutants). The indicators are dependent as follows:
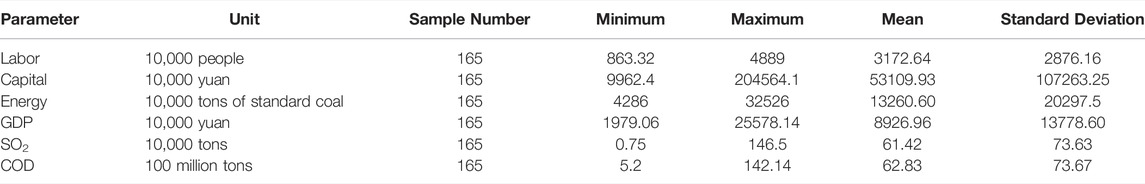
TABLE 1. Statistics on intakes and outcomes.
Considering data availability, and inspired by Liu and Xin (2019), this work characterizes labor with the year-end number of employees in each region of the CEA.
The capital was substituted by the capital stock of each region of the CEA, which was derived by the permanent inventory method:
Inspired by Song et al. (2018), energy was characterized by the total annual energy consumption of each region in the CEA (unit: 10,000 tons of standard coal).
In general, GDP is the final outcome of the production in a country or region within a year. Thus, it is a core indicator of national economic accounting. Thus, GDP was taken as the good outcome of the GFFP EIS. To prevent the data from being distorted by the price factor, this work uses the GDP indicator to deflate the nominal GDP of each region in the CEA to the actual GDP with 2005 as the base year.
The bad outcomes refer to the various pollutants produced during economic growth. Out of the many pollutants, SO2 and chemical oxygen demand (COD) were chosen as the bad outcomes, for China’s environmental pollution monitoring primarily focuses on water pollution and air pollution.
This work mainly studies whether the FDI, ISO, and their cross term significantly affect GFFP. Before further analysis, it is necessary to sort out the mechanism of FDI and ISO acting on GFFP. Apart from the two core parameters (FDI and ISO), it is necessary to consider a series of control parameters (Table 2).
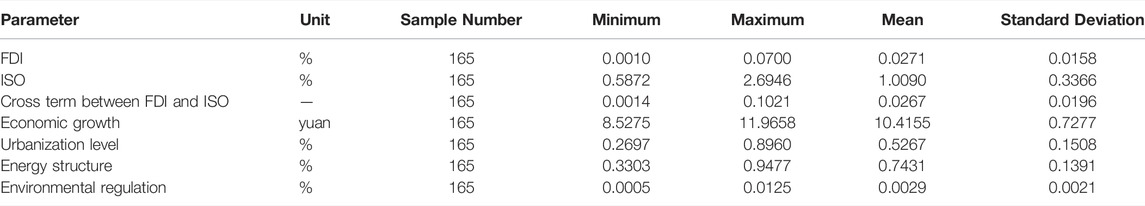
TABLE 2. Statistics on the factors affecting GFFP.
Considering data availability, this work converts the US dollar into RMB by the mean exchange rate, and then characterizes the FDI level with the ratio of the actual FDI to the GDP. The previous research suggests that the FDI affects the TFP via five paths: scale effect, demonstration effect, competitive effect, labor spillover effect and industrial-related effect (Khachoo et al., 2018; Wu et al., 2020).
The continuously utilization of foreign capital expands the production scale of the host country, which increases energy consumption, and releases lots of pollutants. Due to the huge cost of pollution control, some pollutants are difficult to treat effectively, and directly discharged to nature, without any treatment. As a result, the environmental quality of the host country enters a downward spiral.
The massive entry of foreign-funded firms brings many advanced technologies of clean production to the host country. These technologies could be transferred and spread via the demonstration effect of the FDI, thus stimulating the technological innovation of the local firms. Then, the local firms will be motivated to improve their clean technologies and energy utilization efficiency (Kumar and Sinha, 2014).
The massive entry of foreign-funded firms also exerts a large impact to the local firms, making the market in the host country more competitive. To maintain competitiveness, local firms must introduce many talents, improve the internal management, and enhance the learning ability of clean technologies. These moves help the host country to increase the TFP.
During the development in the host country, foreign-funded firms need to employ and train many local staff, which improve the quality level of regional labor. When the trained employees return to local firms, the development of these firms will be greatly promoted.
During trade circulation and exchange, foreign-funded firms would invest in the equipment and plants of upstream firms, and provide downstream firms with intermediate products with high added value and production technology. This will lead to technology spillover and transfer.
In summary, the influence of the FDI over GFFP remains uncertain. The specific influence needs to be determined according to the actual FDI situation of each region.
Here, the ISO is characterized by the ratio of the added value of tertiary industry to that of secondary industry. This factor reflects the shift from labor- and fund-intensive model to technology- and knowledge-intensive model. The traditional industries are gradually phased out by emerging industries with low energy consumption, low pollution, and high added value. This ongoing improvement of industrial structure is bound to affect the TFP (Lin B. and Chen Z., 2018). According to the structural bonus hypothesis, the productivity will increase if the production factors is transferred from the sectors with a low productivity level to those with a high productivity level (Peneder, 2003).
In short, the continuous advancement of the ISO, on the one hand, reduces the overall energy demand of industrial development, and on the other hand, spurs industrial transformation via technological upgrading. Hence, the ISO could promote the shift from high pollution industries to low pollution industries, downgrade pollutant emissions, and thus benefit the improvement of TFP.
There is a close relationship between FDI and ISO. The FDI has a major impact on the ISO through capital accumulation, technology spillover, and job creation. As a large amount of foreign investment enters the host country, the fund shortage would be alleviated, and the industrial restructuring would pick up speed in the host country. In addition, the foreign capital can improve the quality of funds in the host country, and change the backward production and management model of the host country through mergers and acquisitions. What is more, the entry of foreign capital brings advanced technologies, resulting in technology transfer and spillover. The local firms can learn advanced production technologies and management methods from foreign-funded firms, and improve their own research and development (R&D) ability and management level, thereby enhancing their production efficiency. Finally, the foreign-funded firms create new jobs, contributing to the employment of the host country, and train many talents in management, R&D, and technology, exerting a positive effect on the ISO. In summary, the FDI and ISO can interact well with each other. The benign interaction could promote GFFP.
The GFFP is not only affected by FDI, ISO, and their cross term, but also influenced by several other factors. Studies have shown that, GFFP may be significantly affected by economic growth (EG) (Lin B. and Chen G., 2018), urbanization level (UL) (Li and Lin, 2017), energy structure (ES) (Yan et al., 2020), and environmental regulation (ER) (Wang et al., 2019). These factors were treated as control parameters in our research. Specifically, economic growth was measured by the natural log of per-capita GDP in each region of the CEA in each year; urbanization level was measured by the year-end urban population as a percentage of total population in each region of the CEA in each year; energy structure was measured by the coal consumption as a percentage of the total energy consumption in each region of the CEA in each year; environmental regulation was measured by the investment in industrial environmental pollution control as a percentage of industrial added value in each region of the CEA in each year.
To ensure the completeness and availability of the data sources for the indicators of the Super-EBM and the spatial measurement models, this work decides to study the 11 regions in the CEA from 2005 to 2019. The original data on all indicators above were obtained from national and local statistical yearbooks in the sample period. These yearbooks are about the general statistics, energy, population, employment, and environment. Specifically, the original data were collected from China Statistical Yearbooks (2006–2020) (NBSC, 2006–2020a), China Energy Statistical Yearbooks (2006–2020) (NBSC, 2006–2020b), China Population and Employment Statistics Yearbooks (2006–2020) (NBSC, 2006–2020c), and China Statistics Yearbooks on Environment (2006–2020) (NBSC and MEE, 2006–2020), and the local statistical yearbooks of CEA regions. The missing original data of a few parameters in the panel data were supplemented through interpolation. Note that this paper only uses the data published before the end of 2019. The data published in 2020 were not used, because the data on some variables (e.g., energy, labor, SO2, and COD) some regions are not complete in 2020. For the completeness and reliability of data, the span of sample data was determined as 2005–2019.
With the aid of the GFFP EIS, this work collects the data on parameters like labor, capital, energy, GDP, SO2, and COD, processes the data, and imports all into MaxDEA. Then, the GFFPs of the CEA regions in 2005–2019 were measured by the Super-EBM.
According to the results in Table 3, the GFFPs in the CEA exhibited large regional differences. During the sample period, Shanghai was the only region with its mean GFFP (1.0823) falling on the efficient frontier. All the other regions failed to achieve this state. Zhejiang realized a quite satisfactory result (mean GFFP: 0.9199), with a certain potential for improvement. For most regions in the CEA, namely, as Jiangsu, Anhui, Jiangxi, Hubei, Hunan, and Sichuan, the mean GFFP fell between 0.7 and 0.9. These regions performed generally in terms of GFFP, leaving a large room for improvement. In addition, Chongqing, Guizhou, and Yunnan performed poorly in GFFP. During the sample period, their mean GFFPs were below 0.7. These three regions ranked at the bottom in the CEA by GFFP, and should be the focus of environmental protection in future.
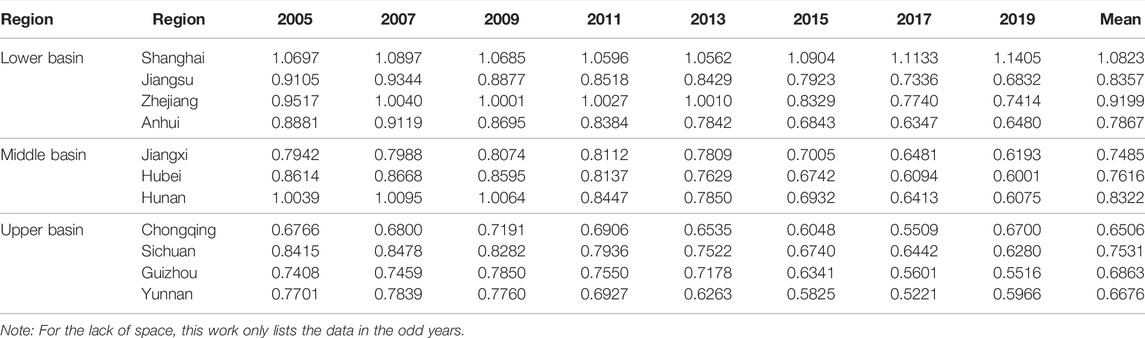
TABLE 3. Regional GFFPs in the CEA.
In general, most regions in the lower basin of the CEA had satisfactory GFFPs, while those in the middle and upper basin had general GFFPs. The heterogeneity of the CEA regions in green development must be considered by the government during the formulation of relevant environmental policies.
According to the Guiding Opinions of the State Council on Promoting the Development of the CEA Relying on the Golden Waterway (2014), the CEA could be divided into three major regions: the lower basin (Shanghai, Zhejiang, Jiangsu, and Anhui), the middle basin (Hubei, Hunan, and Jiangxi), and the upper basin (Chongqing, Sichuan, Guizhou, and Yunnan). Figure 1 shows the mean GFFP trends of the CEA, and the three regions.
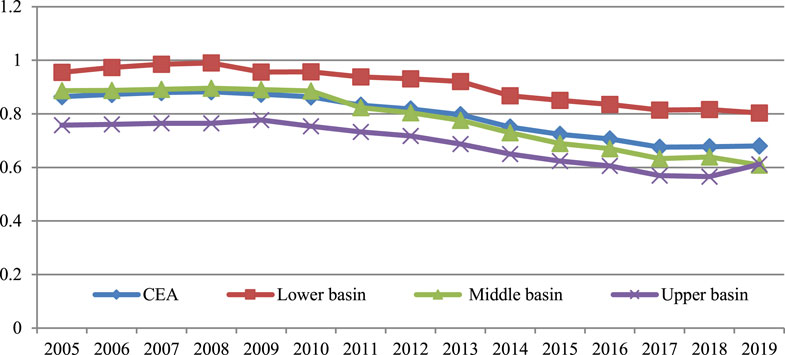
FIGURE 1. Mean GFFP trends of the CEA, the lower basin, the middle basin, and the upper basin.
As shown in Figure 1, the GFFP trends were similar in the upper, middle, and lower basin of the CEA, and could be split into two stages. During 2005–2010, the mean GFFPs of the CEA and the three regions remained stable, with little oscillations. During 2011–2019, the mean GFFPs of the CEA and the three regions declined slowly.
The mean GFFPs of the lower basin, the middle basin, and the upper basin were 0.9062, 0.7808, and 0.6894, separately. Spatially speaking, the GFFPs in the CEA gradually decreased from the lower basin, to the middle basin, and then to the upper basin. This law supports the environmental Kuznets curve: economic development has an inverted U-shaped linear relationship with environmental pollution. The environmental quality of the economically developed lower basin was much better than that of the less developed middle and upper basin.
By formulas (2)-(3), this work computes the Global Moran’s I values of the GFFPs in each year of the CEA on GeoDa, and carries out a p-value test. The specific calculation results are displayed in Table 4.
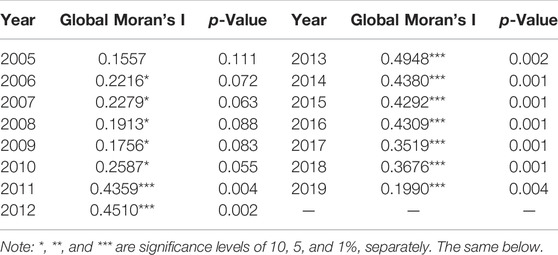
TABLE 4. Global Moran’s I values of the CEA GFFPs.
As can be seen from Table 4 that, through the sample period, the Global Moran’s I values of the GFFPs were all positive in the CEA. Except 2005, these values went through the test of significance at the level of 10% or 1% in the sample period. Thus, the GFFPs of the CEA were clustered prominently in space. Furthermore, it could be learned that the CEA regions with high GFFPs or those with low GFFPs were relatively clustered in space. In addition, the Global Moran’s I values first increased and then declined in the sample period, suggesting that the spatial clustering of the CEA GFFPs first strengthens and then weakens. Overall, the spatial clustering of the CEA GFFPs is objective. If this feature is ignored, the empirical results may have serious deviations.
The suitability of spatial measurement models needs further testing. Whether a spatial measurement model is applicable could be measured by two statistics, namely, LM-sar and LM-err. If both statistics are significant, and LM-sar is more significant than LM-err, then the SAR is the suitable spatial measurement model. Otherwise, the SEM is the suitable model (Anselin and Florax, 1995).
By combining different fixed effects with the general model, it is possible to obtain four types of models: non-, spatial, time, and two-way fixed effects models, respectively. The models with four different fixed effects should be compared to find the one with the strongest independent power. With the aid of MATLAB, this work computes the LM-sar and LM-err of the four different fixed effects models, and compares the LM-sar, LM-error, and their significance of different models, aiming to determine the best model for analyzing the correlations between FDI, ISO, and GFFP.
The empirical results in Table 5 were analyzed below. For the non-fixed effects model, the LM-sar and LM-err were 70.8738 and 15.3022, separately, and both went through the test of significance at the level of 1%. For the spatial fixed effects model and the time fixed effects model, the LM-sar values were 3.3233 and 11.7243, separately; the former went through the test of significance at the level of 10%, and the latter went through the test of significance at the level of 1%. However, the LM-err values of the two models were not significant. For the two-way fixed effects model, the LM-sar and LM-err both went through the test of significance at the level of 1%.
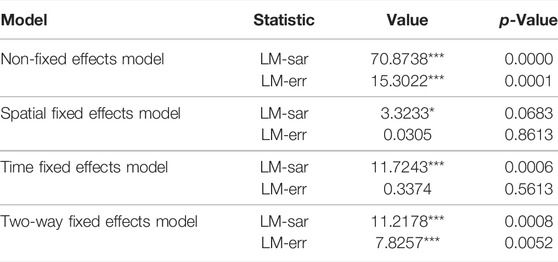
TABLE 5. Lagrange multiplier (LM) statistics under different fixed effects.
The above results indicate that the residuals of ordinary model have significant spatial correlations, making it reasonable to adopt spatial measurement models. For the models with four different fixed effects, the LM-sar was always greater than LM-err. Hence, the SAR is superior to the SEM, whichever the fixed effects.
Through the above analysis, it could be learned that ordinary models cannot solve the spatial correlations between residuals. Hence, the ordinary models were simulated again by formulas (4) and (5), and the panel SAR and panel SEM of each fixed effects model were obtained (Table 6). The relevant results show that the
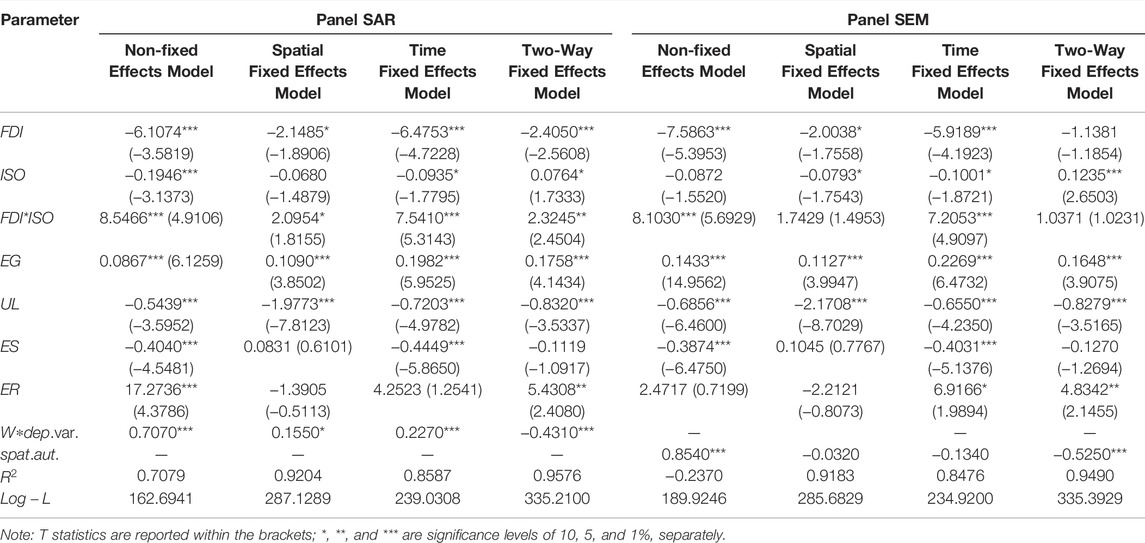
TABLE 6. Estimation results of spatial measurement models.
As for the factor of determination (R2) for goodness-of-fit, the two-way fixed effects model of panel SAR had an R2 of 0.9576, while that of panel SEM had an R2 of 0.9490. Both are greater than the R2 values of the other three models. Likewise, the log likelihood values of the two-way fixed effects model of panel SAR and that of panel SEM were 335.2100 and 335.3929, separately, which are the best among the four models. The two-way fixed effects model always achieved the best statistics, regardless of panel SAR or panel SEM. Since the two-way fixed effects model of panel SAR had a greater log likelihood than the two-way fixed effects model of panel SEM, the former model achieves better performance than the latter. Hence, the fixed effects model of panel SAR was selected to analyze the meaning of the factors of the parameters.
The estimation factor of the FDI was −2.4050, going through the test of significance at the level of 1%. Thus, a greater proportion of the FDI in GDP actually suppresses GFFP in the CEA. The possible reason is as follows: The significantly negative factor of the FDI testifies the apparent pollution haven effect of the FDI in the CEA. The continuous entry of FDI produces significant negative technology spillover, capital effect, and environmental effect in the CEA. As a developing country, China implements a weaker environmental regulation than developed countries. To evade the high environmental cost, development countries often choose to divert the FDI to pollution-intense firms in China. The CEA is an inland river economic belt with national and even global significance. There are many heavy pollution firms along the Yangtze River, including chemical firms, petrochemical firms, and nonferrous metal metallurgy firms. These heavy pollution firms are very attractive to foreign investors. Rafindadi et al. (2018) suggested that, most developing countries treat economic growth as the top priority, paying little attention to environmental governance. Hence, developed countries tend to transfer high pollution industries to development countries, which cause serious environmental pollution to the host countries. This is not conducive to the improvement of GFFP.
The ISO had a significant positive effect on GFFP at the level of 10%. The result validates the previous hypothesis: the sustained economic growth of the CEA is accompanied by the improvement of the industrial structure. In recent years, the tertiary industry develops rapidly in the CEA, taking up a growing portion in the national economy. By contrast, the proportion of the secondary industry in the national economy steadily decreases: Since China decided to pilot the construction of ecological civilization in the CEA, the study area has stepped up the regulation of high pollution industries, most of which belong to the secondary industry. From 2005 to 2019, the value added of the tertiary industry to that of the secondary industry increased from 0.8318 to 1.3429 in the CEA. It could be said that the ISO not only promotes the continued growth of the economy, but also advances regional green development. These effects undoubtedly promote the growth of GFFP.
The estimation factor of the cross term between FDI and ISO was positive, going through the test of significance at the level of 5%. Therefore, the benign interaction between FDI and ISO positively affects GFFP. As China raises the environmental threshold for the FDI, it is increasingly difficult for high pollution and high energy foreign-funded industries to enter the Chinese market. Instead, many high-tech, low pollution foreign industries flood in China, which promote the ISO of the CEA. As stated by Blomström et al. (1994), the positive technology spillover of the FDI increases with the economic level in the host country; the more advanced the economy, the stronger the positive technology spillover, and the better the ISO in the host country. Taking Canada and Australia as example, Caves (1974) investigated the technology spillover effect of FDI on manufacturing, and discovered that the FDI promotes the industrial structure adjustment in these countries.
The influence of the other control parameters on GFFP was analyzed as follows:
Economic growth (EG) had a positive effect on GFFP at the level of 1%. This means the CEA has already arrived at a high level of economic development. The focus of economic growth gradually shifts from quantity to quality. Under the premise of ensuring fast growth, more attention is paid to environmental quality. This shift obviously promotes GFFP.
There was a significant negative correlation between urbanization level (UL) and GFFP. This correlation is closely associated with the urbanization pattern in the region, which features high pollution, high consumption, and high investment. To solve the problem, it is necessary to blaze a new trail towards urbanization: minimizing the damages from urbanization to the natural environment by building environmentally friendly, resource-saving cities.
Energy structure (ES) exerted a negative impact on GFFP, which failed the test of significance. It is generally agreed in the academia that: the coal-dominated energy structure suppresses the environmental productivity of each sector (Shen et al., 2019). China attaches importance to the eco-environmental construction in the CEA. The region has been switching to clean energies, and gradually reducing the proportion of coal in the energy structure. In 2005, coal accounted for 77.04% of the total energy consumed in the CEA. In 2019, the proportion dropped to 65.58%, falling by 11.46% over 15 years.
Environmental regulation (ER) significantly promoted GFFP. In recent years, the CEA forcefully implemented energy saving and emission reduction, and ramped up the intensity of environment regulation, especially the investment in industrial pollution control. These efforts curb pollutant discharge by firms, mitigate the environmental damages of pollutants, and greatly improve the environmental quality in the CEA.
Improving GFFP is the fundamental path for China to realize sustainable development goals (Wang et al., 2021). Taking the whole country as the study area, Wang et al. (2021) discovered that GFFP declined from eastern China, central China, to western China. Our research draws similar conclusions, with the CEA as the study area. Targeting the countries along the Belt and Road, Wu et al. (2020) verified that China’s outward direct investment (ODI) significantly affects GFFP, and that China’s ODI is constrained by the institutional quality of the host country. Similarly, this paper confirms the important effect of CEA FDI on GFFP. In addition, the authors tested whether the interaction between FDI and ISO greatly affects GFFP. Since spatial econometric model is widely used in various research domains (Sun et al., 2014), it is necessary to explore GFFP through spatial econometrics, making the research more practical and scientific.
Targeting the panel data of 11 CEA regions in 2005–2019, this work establishes a GFFP EIS containing bad outcomes, measures the GTEPs in the CEA with the Super-EBM, computes the Global Moran’s I values of the CEA GFFPs. In addition, SAR and SEM were employed to analyze the influence of FDI, ISO, and their cross term over GFFP. The main conclusions are as follows:
1) During the sample period, the GFFPs in the CEA exhibited large regional differences. Shanghai’s GFFP fell on the efficient frontier. This state was not achieved by any other region in the CEA, leaving a room for improvement. Zhejiang realized a quite satisfactory result, with a certain potential for improvement. Jiangsu, Anhui, Jiangxi, Hubei, Hunan, and Sichuan performed generally in terms of GFFP, leaving a large room for improvement. Chongqing, Guizhou, and Yunnan performed poorly in GFFP. In general, most regions in the lower basin of the CEA had high GFFPs, while those in the middle and upper basin had low GFFPs.
2) During the sample period, the GFFP trends were similar in the upper, middle, and lower basin of the CEA. From 2005 to 2010, the mean GFFPs of the CEA and the three regions remained stable. From 2011 to 2019, the mean GFFPs of the CEA and the three regions declined slowly. The three regions differed significantly in GFFP, and could be ranked in descending order of GFFP as lower basin > middle basin > upper basin.
3) During the sample period, the Global Moran’s I values of CEA GFFPs were always positive, and went through the test of significance in most years. Further, the CEA GFFPs were clustered prominently in space, rather than stochastically distributed.
4) According to the results of spatial measurement models, the CEA GFFPs were significantly suppressed by FDI, and promoted by ISO; the good interaction between FDI and ISO positively affected GFFP. Among the control parameters, economic growth and environment regulation clearly promote GFFP, urbanization level strongly inhibits GFFP, and energy structure does not significantly affect GFFP.
There are several limitations of this research. Firstly, only two pollutants, namely, SO2 and COD, were selected as bad outcomes, for the completeness of data sources of the variables. This clearly limits the comprehensiveness of our analysis. Secondly, the sample data were all published before 2019 to ensure data availability. The short cycle hinders the long-span analysis and the selection of influencing factors. In future, the research will be deepened by including more environmental pollutants as bad outcomes, and expanding the data channels (e.g., finding data on relevant websites in addition to statistical yearbooks), thus extending the time span of samples.
The datasets presented in this study can be found in online repositories. The names of the repository/repositories and accession number(s) can be found in the article/Supplementary material.
HZ: Conceptualization, Methodology, Funding acquisition, Supervision, Writing—review and editing. YR: Writing—original draft, Investigation, Formal analysis.
This paper is supported by Colleges and Universities’ Young Key Teachers Fostering Program of Henan Province, China (Grant No.: 2019GGJS102), Program for Science and Technology Innovation Talents (Humanities and Social Sciences) in Universities of Henan Province, China (Grant No.: 2021-CX-006), Postgraduate Education Reform and Quality Improvement Project of Henan Province, China (Grant Nos.: YJS2022SZ03 and YJS2022JC03) and Academic Degrees and Graduate Education Reform Project of Henan Province, China (Grant No.: 2021SJGLX013Y).
The authors declare that the research was conducted in the absence of any commercial or financial relationships that could be construed as a potential conflict of interest.
All claims expressed in this article are solely those of the authors and do not necessarily represent those of their affiliated organizations, or those of the publisher, the editors and the reviewers. Any product that may be evaluated in this article, or claim that may be made by its manufacturer, is not guaranteed or endorsed by the publisher.
Ahmed, E. M. (2012). Green TFP Intensity Impact on Sustainable East Asian Productivity Growth. Econ. Analysis Policy 42 (1), 67–78. doi:10.1016/s0313-5926(12)50005-6
Anselin, L., and Florax, R. J. G. M. (1995). “Small Sample Properties of Tests for Spatial Dependence in Regression Models: Some Further Results,” in New Directions in Spatial Econometrics, 21–74. doi:10.1007/978-3-642-79877-1_2
Blomström, M., Kokko, A., and Zejan, M. (1994). Host Country Competition, Labor Skills, and Technology Transfer by Multinationals. Rev. World. Econ. 130 (3), 521–533. doi:10.1007/BF02707611
Caves, R. E. (1974). Multinational Firms, Competition, and Productivity in Host-Country Markets. Economica 41 (162), 176–193. doi:10.2307/2553765
Fan, F., Lian, H., Liu, X., and Wang, X. (2021). Can Environmental Regulation Promote Urban Green Innovation Efficiency? an Empirical Study Based on Chinese Cities. J. Clean. Prod. 287, 125060. doi:10.1016/j.jclepro.2020.125060
Grossman, G. M., and Helpman, E. (2002). Integration versus Outsourcing in Industry Equilibrium. Q. J. Econ. 117 (1), 85–120. doi:10.1162/003355302753399454
He, J. (2006). Pollution Haven Hypothesis and Environmental Impacts of Foreign Direct Investment: The Case of Industrial Emission of Sulfur Dioxide (SO2) in Chinese Provinces. Ecol. Econ. 60 (1), 228–245. doi:10.1016/j.ecolecon.2005.12.008
Keller, W., and Levinson, A. (2002). Pollution Abatement Costs and Foreign Direct Investment Inflows to U.S. States. Rev. Econ. Statistics 84 (4), 691–703. doi:10.1162/003465302760556503
Khachoo, Q., Sharma, R., and Dhanora, M. (2018). Does Proximity to the Frontier Facilitate FDI-Spawned Spillovers on Innovation and Productivity? J. Econ. Bus. 97, 39–49. doi:10.1016/j.jeconbus.2018.03.002
Kippenberg, E. (2005). Sectoral Linkages of Foreign Direct Investment Firms to the Czech Economy. Res. Int. Bus. Finance 19 (2), 251–265. doi:10.1016/j.ribaf.2004.12.004
Kumar, N. V., and Sinha, N. (2014). Transition towards a Green Economy: Role of FDI. Int. J. Technol. Glob. 7 (4), 288–306. doi:10.1504/IJTG.2014.066619
Li, K., and Lin, B. (2017). Economic Growth Model, Structural Transformation, and Green Productivity in China. Appl. Energy 187, 489–500. doi:10.1016/j.apenergy.2016.11.075
Lin, B., and Chen, G. (2018a). Energy Efficiency and Conservation in China's Manufacturing Industry. J. Clean. Prod. 174, 492–501. doi:10.1016/j.jclepro.2017.10.286
Lin, B., and Chen, Z. (2018b). Does Factor Market Distortion Inhibit the Green Total Factor Productivity in China? J. Clean. Prod. 197, 25–33. doi:10.1016/j.jclepro.2018.06.094
List, J. A., and Co, C. Y. (2000). The Effects of Environmental Regulations on Foreign Direct Investment. J. Environ. Econ. Manag. 40 (1), 1–20. doi:10.1006/jeem.1999.1095
Liu, W. S., Agbola, F. W., and Dzator, J. A. (2016). The Impact of FDI Spillover Effects on Total Factor Productivity in the Chinese Electronic Industry: a Panel Data Analysis. J. Asia Pac. Econ. 21 (2), 217–234. doi:10.1080/13547860.2015.1137473
Liu, Z., and Xin, L. (2019). Has China's Belt and Road Initiative Promoted its Green Total Factor Productivity?--Evidence from Primary Provinces along the Route. Energy Policy 129, 360–369. doi:10.1016/j.enpol.2019.02.045
Lu, X.-h., Jiang, X., and Gong, M.-q. (2020). How Land Transfer Marketization Influence on Green Total Factor Productivity from the Approach of Industrial Structure? Evidence from China. Land Use Policy 95, 104610. doi:10.1016/j.landusepol.2020.104610
Luo, Y., Lu, Z., Salman, M., and Song, S. (2022). Impacts of Heterogenous Technological Innovations on Green Productivity: An Empirical Study from 261 Cities in China. J. Clean. Prod. 334, 130241. doi:10.1016/j.jclepro.2021.130241
Moran, P. A. P. (1948). The Interpretation of Statistical Maps. J. R. Stat. Soc. Ser. B Methodol. 10 (2), 243–251. doi:10.1111/j.2517-6161.1948.tb00012.x
National Bureau of Statistics of China (NBSC), Ministry of Ecology and Environment (MEE) (2006–2020). China Statistics Yearbook On Environment. Beijing: China Statistics Press.
National Bureau of Statistics of China (NBSC) (2006–2020a). China Energy Statistical Yearbook. Beijing: China Statistics Press.
National Bureau of Statistics of China (NBSC) (2006–2020b). China Population and Employment Statistics Yearbook. Beijing: China Statistics Press.
National Bureau of Statistics of China (NBSC) (2006–2020c). China Statistical Yearbook. Beijing: China Statistics Press.
Peneder, M. (2003). Industrial Structure and Aggregate Growth. Struct. Change Econ. Dyn. 14 (4), 427–448. doi:10.1016/S0954-349X(02)00052-8
Peng, X. (2020). Strategic Interaction of Environmental Regulation and Green Productivity Growth in China: Green Innovation or Pollution Refuge? Sci. Total Environ. 732, 139200. doi:10.1016/j.scitotenv.2020.139200
Rafindadi, A. A., Muye, I. M., and Kaita, R. A. (2018). The Effects of FDI and Energy Consumption on Environmental Pollution in Predominantly Resource-Based Economies of the GCC. Sustain. Energy Technol. Assessments 25, 126–137. doi:10.1016/j.seta.2017.12.008
Shen, N., Liao, H., Deng, R., and Wang, Q. (2019). Different Types of Environmental Regulations and the Heterogeneous Influence on the Environmental Total Factor Productivity: Empirical Analysis of China's Industry. J. Clean. Prod. 211, 171–184. doi:10.1016/j.jclepro.2018.11.170
Song, M., Du, J., and Tan, K. H. (2018). Impact of Fiscal Decentralization on Green Total Factor Productivity. Int. J. Prod. Econ. 205, 359–367. doi:10.1016/j.ijpe.2018.09.019
Sun, C., Zhao, L., Zou, W., and Zheng, D. (2014). Water Resource Utilization Efficiency and Spatial Spillover Effects in China. J. Geogr. Sci. 24 (5), 771–788. doi:10.1007/s11442-014-1119-x
Tone, K. (2001). A Slacks-Based Measure of Efficiency in Data Envelopment Analysis. Eur. J. Operational Res. 130 (3), 498–509. doi:10.1016/S0377-2217(99)00407-5
Tone, K., and Tsutsui, M. (2010). An Epsilon-Based Measure of Efficiency in DEA - A Third Pole of Technical Efficiency. Eur. J. Operational Res. 207 (3), 1554–1563. doi:10.1016/j.ejor.2010.07.014
Walter, L., and Ugelow, J. L. (1979). Environmental Policies in Developing Countries. Ambio 8, 102–109.
Wang, H., Cui, H., and Zhao, Q. (2021). Effect of Green Technology Innovation on Green Total Factor Productivity in China: Evidence from Spatial Durbin Model Analysis. J. Clean. Prod. 288, 125624. doi:10.1016/j.jclepro.2020.125624
Wang, Y., Sun, X., and Guo, X. (2019). Environmental Regulation and Green Productivity Growth: Empirical Evidence on the Porter Hypothesis from OECD Industrial Sectors. Energy Policy 132, 611–619. doi:10.1016/j.enpol.2019.06.016
Wu, H., Ren, S., Yan, G., and Hao, Y. (2020). Does China's Outward Direct Investment Improve Green Total Factor Productivity in the "Belt and Road" Countries? Evidence from Dynamic Threshold Panel Model Analysis. J. Environ. Manag. 275, 111295. doi:10.1016/j.jenvman.2020.111295
Xie, R., Fu, W., Yao, S., and Zhang, Q. (2021). Effects of Financial Agglomeration on Green Total Factor Productivity in Chinese Cities: Insights from an Empirical Spatial Durbin Model. Energy Econ. 101, 105449. doi:10.1016/j.eneco.2021.105449
Yan, Z., Zou, B., Du, K., and Li, K. (2020). Do renewable Energy Technology Innovations Promote China's Green Productivity Growth? Fresh Evidence from Partially Linear Functional-Coefficient Models. Energy Econ. 90, 104842. doi:10.1016/j.eneco.2020.104842
Yu, D., Li, X., Yu, J., and Li, H. (2021). The Impact of the Spatial Agglomeration of Foreign Direct Investment on Green Total Factor Productivity of Chinese Cities. J. Environ. Manag. 290, 112666. doi:10.1016/j.jenvman.2021.112666
Keywords: foreign direct investment, industrial structure optimization, green fullfactor productivity, super epsilon-based measure, changjiang economic area
Citation: Zhang H and Ren Y (2022) Relationship Between Foreign Direct Investment, Industrial Structure Optimization, and Green Full-Factor Productivity: Empirical Evidence From Changjiang Economic Area. Front. Environ. Sci. 10:920412. doi: 10.3389/fenvs.2022.920412
Received: 14 April 2022; Accepted: 24 May 2022;
Published: 05 July 2022.
Edited by:
Umer Shahzad, Anhui University of Finance and Economics, ChinaReviewed by:
Ahmed Samour, Near East University, CyprusCopyright © 2022 Zhang and Ren. This is an open-access article distributed under the terms of the Creative Commons Attribution License (CC BY). The use, distribution or reproduction in other forums is permitted, provided the original author(s) and the copyright owner(s) are credited and that the original publication in this journal is cited, in accordance with accepted academic practice. No use, distribution or reproduction is permitted which does not comply with these terms.
*Correspondence: Huaping Zhang, emhhbmdodWFwaW5nQG5jd3UuZWR1LmNu
Disclaimer: All claims expressed in this article are solely those of the authors and do not necessarily represent those of their affiliated organizations, or those of the publisher, the editors and the reviewers. Any product that may be evaluated in this article or claim that may be made by its manufacturer is not guaranteed or endorsed by the publisher.
Research integrity at Frontiers
Learn more about the work of our research integrity team to safeguard the quality of each article we publish.