- 1Faculty of Geosciences and Environmental Engineering, Southwest Jiaotong University, Chengdu, China
- 2State-Province Joint Engineering Laboratory of Spatial Information Technology of High-Speed Rail Safety, Southwest Jiaotong University, Chengdu, China
The characteristics of active fault movements are essential for estimating the earthquake potential on the Tibetan Plateau (TP) in a complex geological setting. The 2022 Menyuan Mw6.7 earthquake was studied by a joint seismological and geodetic methodology to deepen the scientific understanding of the source parameters and deformation mechanisms. Firstly, the entire InSAR co-seismic deformation field is obtained based on ascending and descending Sentinel-1A imagery. Subsequently, a Bayesian algorithm is applied in fault geometry and slip distribution determination by combining InSAR measurements and teleseismic data. And the fault movement characteristics of the 2022 Menyuan earthquake are analyzed. Finally, a comprehensive “surface-subsurface" analysis of the effects caused by this earthquake was carried out by combining InSAR and fault data. The results demonstrate that the ground settlement and uplift induced by the 2022 Menyuan earthquake are significant, with a maximum relative deformation of 56 cm. The seismogenic fault is on the junction of the Lenglongling (LLL) and Tuolaishan (TLS) faults, and the main body is in the western part of the LLL fault, a high dip left-lateral strike-slip fault with NWW-SEE strike. The slip distribution results indicate that the largest slip of 3.45 m occurs at about 5 km below the ground, and the earthquake magnitude is Mw6.63. And further analysis by integrated geological structure and inversion results reveals that the earthquakes that occurred on the North Lenglongling Fault (NLLL) in 1986 and 2016 have contributed to the 2022 Menyuan earthquake.
1 Introduction
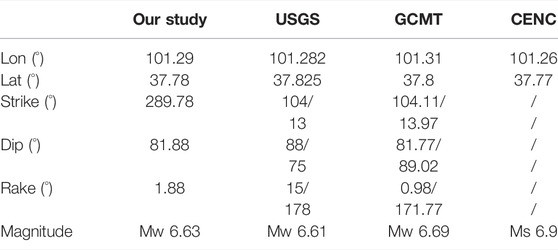
The China Earthquake Network Center (CENC) reported that an Ms6.9 magnitude earthquake occurred at 1:45 a.m. on 8 January 2022, in Menyuan County, China. The earthquake was felt significantly around the source, causing 1,662 households and 5,831 people affected, 9 people injured, and 4,052 houses damaged in Menyuan, Qilian, and Gangcha counties. As shown in Table 1, the fault geometry and source mechanisms determined by various institutions have some discrepancies due to the different raw data applied. The epicenter of this earthquake (37.77°N, 101.26°E) was located in the Qilian Mountains of the TP. It is the third moderate intensity earthquake since the Mw5.9 (data from the GCMT) Menyuan earthquake in 1986 and 2016. The epicenter is within 40 km of the 1986 and 2016 earthquakes, indicating a high-stress accumulation and seismic hazard in the region. Therefore, co-seismic deformation observation studies of the latest Menyuan earthquake can further improve the understanding of the fault characteristics and reference the tectonic motion of the northeastern Tibet Plateau.
Researchers have conducted several studies using different datasets and methods to rapidly understand seismogenesis and its impact on the 2022 Menyuan earthquake. Han (2022) converted the mainshock source mechanism and source depth using the generalized cut and paste algorithm (gCAP). It was concluded that this is a strike-slip earthquake of magnitude Mw6.7, and the optimal source depth is about 3 km. Yang et al. (2022) derived a 3.5 m for the mainshock co-seismic using InSAR. In addition, the calculation for the b and h values of the earthquake sequence indicates that the 2022 Menyuan earthquake follows the main-aftershock sequence characteristics. Li et al. (2022) used Sentinel-1A data for fault inversion and found that the maximum slip value of the seismogenic fault reached 3.5 m, which was about 4 km below the ground. It also clarifies the contribution of the 2016 Menyuan earthquake to the 2022 earthquake through static Coulomb stress triggering relations. Wang Q et al., 2022 investigated the deep tectonic setting of the 2022 Menyuan earthquake. The deep tectonic features of the Menyuan earthquake are discussed with information on crustal thickness, velocity structure, and anisotropy. It reveals that the 2022 Menyuan earthquake and its aftershock activity led to an adequate rupture of the LLL. Xu et al., 2022 inverted the source mechanism and the source moment center depth of the mainshock and Ms3.4 aftershock with the gCAP method. And based on the results of aftershock relocation, the relationship between earthquake magnitude and surface rupture, and shear stress, it can be found that there is partial stress accumulation in the Menyuan area, and the stress has not been fully released. There is still a risk of strong earthquakes in this region.
Related studies have applied a few methods to analyze the source mechanism, geological structure, aftershock sequences, and stress changes of the 2022 Menyuan earthquake. However, relatively limited observation data affected the accurate identification of regional geological tectonics. For example, Li et al., 2022 and Yang et al., 2022 used Sentinel-1A images with incomplete coverage of the deformation area, resulting in an inadequate establishment of the co-seismic deformation field precise source and fault parameters remaining undetermined. Furthermore, it has been demonstrated that the contribution of single-type observation data to source information inversion is relatively limited. And the diversity of the data contributes to overcoming the challenges that occur in source imaging using just a one-type dataset (Melgar and Bock, 2015; Zheng et al., 2020). InSAR and teleseismic data of the Menyuan earthquake were published and provided after the incident. The conditions for the joint inversion of seismic parameters and fault distribution are complete with the release of the InSAR and teleseismic data sources.
This contribution first establishes the entire co-seismic deformation field with InSAR data. Subsequently, we suppose the fault is a rectangular plane and estimated the fault parameters using InSAR and teleseismic data based on the Bayesian algorithm. After that, we determine the specific slip distribution of each subfault from the distributed slip results. According to the movement characteristics of the earthquake faults, the deformation field was decomposed into two dimensions to explore the impact of the 2022 Menyuan earthquake.
2 Geological and Tectonic Background
Menyuan is situated on the northeastern part of TP, subjected to continuous collision and extrusion between the NE-SW direction of the Indian plate and the Eurasian plate for a long time (Tapponnier and Molnar, 1977; Tapponnier et al., 2001; Liu et al., 2019). Many folds around this area, with active faults and complex geological structures (Yin et al., 2008). The northeastern margin of the TP is one of the most complex areas in China in terms of geological conditions and environment. It has been affected by many strong earthquakes, for example, the Mw8.3 Haiyuan earthquake in 1920 (Liu et al., 2007), the Mw7.7 Gulang earthquake under the Dongqingding Mountain (Xu et al., 2010), and the Mw7.0 Shandan earthquake at the Longshushan Fault in 1954 (Deng et al., 1986).
The Qilian-Haiyuan Fault (QH) consists of the TLS, Jinqianghe Fault (JQH), Maomaoshan Fault (MMS), Laohushan Fault (LHS), LLL, and Haiyuan Fault (HY) (Molnar and Qidong, 1984; Guo et al., 2019), which is about 1000 km long (Peltzer et al., 1988). The QHF controls the geometry and tectonic pattern of the TP. It regulates the eastward movement of the northeast margin of TP towards the Gobi-Alashan platform (Shi et al., 2020). The LLL is the middle section of the QHF (Zhang et al., 2020; Yang et al., 2022) and is recognized to have the highest slip rate of the HY. It is distributed along the watershed of the East Qilian Mountains, starting at Liuhuanggou and ending near Yangpanchang. (Zhang et al., 2012). The LLL is mainly characterized by left-slip (Gaudemer et al., 1995). Figure 1 provides an overview of the study area.
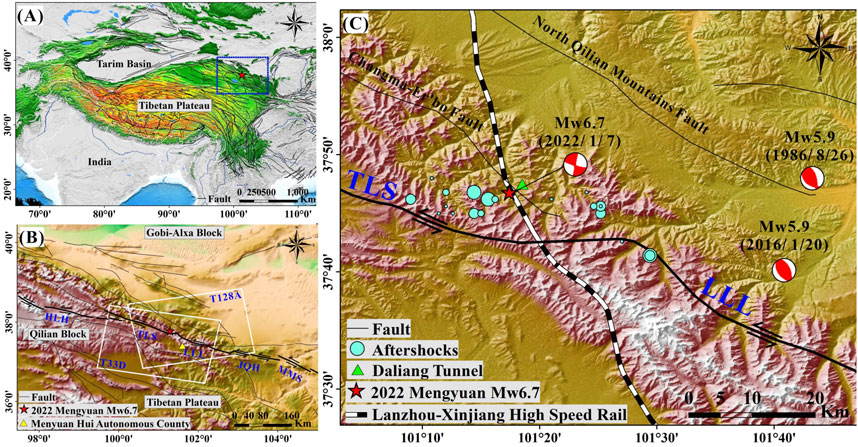
FIGURE 1. (A) Faults (lines) on the TP (Deng et al., 2003). The blue rectangle represents the extent of (B). (B) Major faults in the study area. HLH: Hala Lake Fault. The white boxes are the image coverage area of the Sentinel-1A. (C) Focal mechanisms of 1986, 2016, and 2022 Menyuan earthquakes (data from the GCMT) and aftershock locations (blue dots). The Lanzhou-Xinjiang high-speed railway (LHSR) crosses the fracture zone.
3 Material and Methods
3.1 Co-Seismic Data Processing
3.1.1 InSAR Data
InSAR technology is widely used to monitor ground deformation and plays a significant role in acquiring co-seismic deformation fields (Ganas et al., 2020; Taymaz et al., 2021). As shown in Table 2, ascending and descending imagery obtained by Sentinel-1A were exploited in this paper for co-seismic displacement mapping. GMTSAR was used to process these two pairs of Sentinel 1A data. The phase delay propagated through the atmosphere is very slight compared to the co-seismic signal, so it is neglected (Jin and Fialko, 2021). Co-registration of sentinel images is completed by the BESD approach (Sandwell et al., 2011; Wang K. et al., 2017), and a modified Goldstein filter was utilized to filter the generated interferograms (Goldstein and Werner, 1998; Li et al., 2008). We used the MCF (minimum cost flow) method for unwrapping the filtered interferogram (Chen and zebker, 2002; Bao et al., 2022). The processed interferogram is shown in Figure 2.
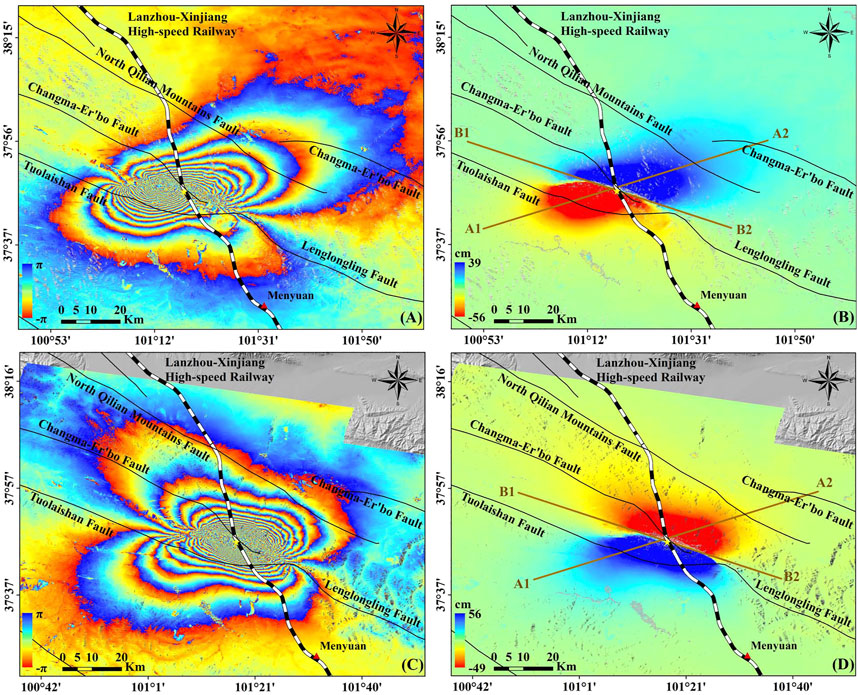
FIGURE 2. Co-seismic interferograms and the LOS deformation field of the Menyuan earthquake. (A) Interferogram and (B) LOS deformation of the ascending T128; (C) Interferogram and (D) LOS deformation of the descending T33.
3.1.2 Teleseismic Data
We selected the teleseismic data from 14 stations for the joint inversion. The epicenter distance was set between 30° and 90° to ensure and improve the azimuthal coverage (Zheng et al., 2020; Taymaz et al., 2022). The raw P-wave recordings were filtered using a band-pass filter (0.01 ∼ 0.1 Hz). We decomposed the P-wave into vertical displacements. And the waveform was tapered to a 120 s time window, including the initial 30 s of data that arrived. The global velocity model AK135 was used as the velocity model during the teleseismic calculation of Green’s function (Bassin, 2000; Xie et al., 2021).
3.2 Fault Inversion and Modeling
Bayesian algorithm (Bayes, 1763) is widely used to study earthquake mechanisms and fault characterization (Tarantola and valette, 1982; Fukuda and Johnson, 2008; Monelli and Mai, 2008; Duputel et al., 2012; Razafindrakoto and Mai, 2014; Dutta et al., 2018). Seismic and geodetic data were applied to constrain the geometry of the faults. And we use Bayesian methods to assess the uncertainty of the model and the data.
Combined considering different multiple independent observations
where
In the Bayesian Earthquake Analysis Tool (BEAT), the prior case of the parameters is given as a range of possible values that are independent and uniform, and we can numerically constrain it by adding upper and lower bounds beyond
4 Results
4.1 Co-Seismic Deformation of the 2022 Event
Based on the Sentinel-1A IW wide ascending and descending SAR imagery data, the co-seismic deformation field of the 8 January 2022, Menyuan Mw6.7 earthquake in Qinghai was reconstructed as shown in Figure 2. The interference fringes in the area of this co-seismic deformation are apparent and show a butterfly shape (see Figure 2A and Figure 2C). Only a few places appeared to have a decoherence phenomenon caused by lakes, complex topography, and large-gradient deformation (e.g., the epicenter area). Figure 2 displays that the ground subsidence and uplift are both evident, where the deformation range is about −56 cm–39 cm for the ascending track and about −49 cm–56 cm for the descending path.
To further understand the distribution of the co-seismic deformation field of this earthquake, two profiles across the fault are extracted from the deformation field acquired by the ascending and descending imagery, respectively. The profile lines A1-A2 and B1-B2 are distributed perpendicular to the line of LHSR and along the long axis of the deformation field, respectively. Figure 3 illustrates prominent centers of subsidence and uplift in both deformation profiles. Figure 3A indicates that the maximum deformation of the A1-A2 section in the ascending and descending images are 38 cm and 36 cm. And the minimum deformation values are −45 cm and −47 cm, respectively. Figure 3B illustrates that the deformation values of the B1-B2 section are in the range of −21 cm–15 cm.
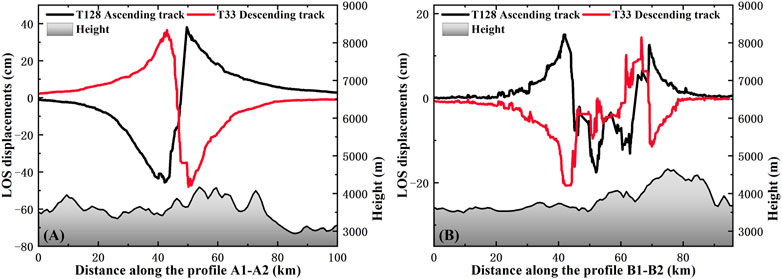
FIGURE 3. Cross-sections along (A) A1-A2 and (B) B1-B2 for the ascending T128 and descending T33 LOS deformation fields.
The earthquake impact area monitored by the two tracks is about 30 km × 15 km, and the long axis of the co-seismic deformation field is in the NWW-SEE direction. The footwall and hanging wall in Figure 2B and Figure 2D show opposite deformation patterns. At the same time, the footwall and hanging wall of the deformation field of the same track exhibit opposite movement (see Figure 3). This phenomenon indicates that this ground deformation is dominated by horizontal movement, which agrees with the motion features of a strike-slip fault earthquake.
4.2 Fault Geometry and Slip Distribution
We down-sampling the LOS deformation field using the quadtree algorithm to suppress noise and speed up the inversion process (Jónsson et al., 2002). The quadtree algorithm has different threshold settings to perform encrypted sampling for near-field deformation and sparse sampling for far-field areas according to the deformation gradient varying from near-field to far-field regions. The advantage of this algorithm is to preserve the near-field deformation characteristics while reducing the negative impact of far-field errors and noise on the inversion to some extent.
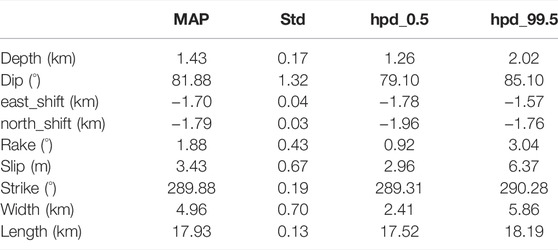
The InSAR monitoring results were down-sampled to obtain 1072 data points, including 572 points for the ascending track and 500 points for the descending track. We used 16 CPUs for parallel processing and built 992 Markov chains (MCs) in this experiment, each MC sampling 100 steps and taking 35 stages to complete the computation. After all estimated sample values are ranked, we take the lower limit of the confidence interval as 0.5% and the upper limit as 99.5%, respectively. The values of 99% confidence interval for each parameter are obtained then. Seismic parameters obtained by the USGS show that the geometric planes of the two possible seismogenic faults are both highly dip angles (75° and 88°) and strikes of 13° and 104°, respectively. We determine the large strike angle plane by combining the geographical location of the earthquake source and the LLL fault strike to explain this event. Thus, we set the initial a priori parameter intervals for the strike, dip, and rake to (270°, 360°), (50°, 90°), and (0°, 5°). As illustrated in Figure 4, most teleseismic station data are well resolved. The MAP is selected as the optimal fault parameter. And the MAP correlates well with the peak of Bayesian estimation (see Figure 5). The length and width of the fault obtained by uniform inversion are 17.93 km and 4.96 km. The strike, dip, and rake are 289.78°, 81.88°, and 1.88°, respectively. East_shift and North_shift represent offsets relative to the reference point (101.31°E, 37.8°N, the epicenter location provided by GCMT) in the UTM coordinate system, geometrically representing the upper boundary of the fault centroid, transformed by coordinates to (101.29°E, 37.78°N). Table 3 presents the parameter information in detail.
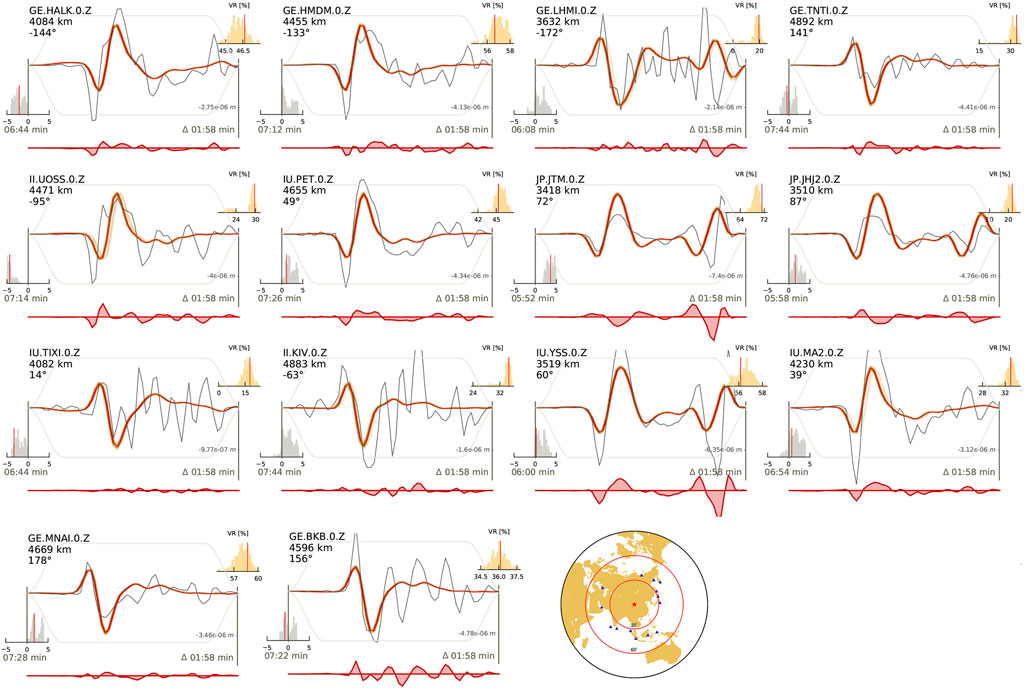
FIGURE 4. Waveform fitting of teleseismic data. The red and black curves represent the homogeneous dislocation model and the observed filtered P-wave records. The yellow background shadings are the 200 random synthetic waveforms. The variance reduction histogram is at the top right, and the time-shift histogram is at the bottom left. The red data traces in each waveform subplot are residual traces between the data and the synthetics. The lowest right subplot shows the spatial distribution of teleseismic stations.
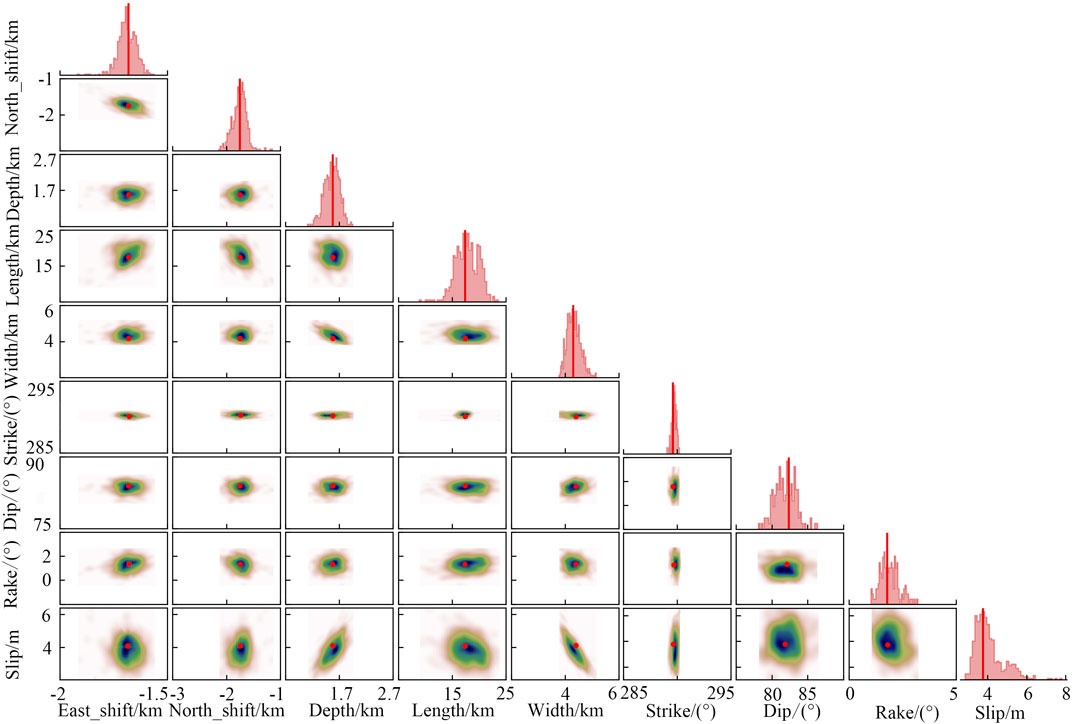
FIGURE 5. 1D and 2D posterior probability density distributions for the rectangular source of the 2022 Menyuan earthquake. Red lines and red points show the MAP. Cold colors indicate high probability areas.
After the fault geometry parameters inversion, the residuals obtained are shown in Figure 6. The light grey scattered points in Figure 6 indicate the sampling points, and the black and red straight lines indicate the lower and upper boundaries of the fault, respectively. Near the epicenter, the modeled values generally agree with the observed values. The residual range of the ascending and descending tracks was ±18 mm and ±25 mm. The large residuals near the epicenter are mainly due to the earthquake-induced ground rupture, causing partial decoherence, particularly in the descending track data. In summary, the data of both tracks are well fitted, indicating that the inversion results of the fault geometric parameters are accurate.
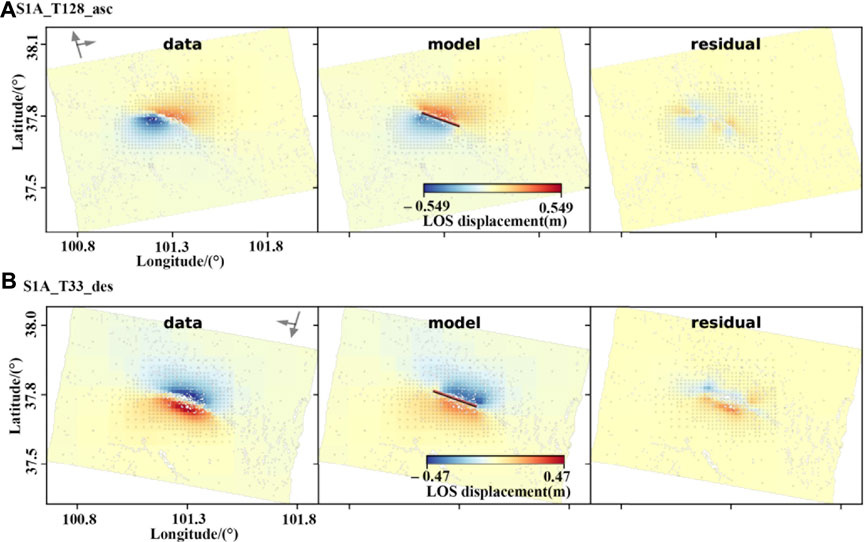
FIGURE 6. Uniform slip inversion result of the 2022 Menyuan earthquake, including observed, modeled, and residual data. (A) Sentinel-1A in ascending track (T128). (B) Sentinel-1A in descending track (T33).
To obtain a complete description of the specific distribution of fault slip, we determine the parameters of the fault plane based on the optimal model evaluated by the Bayesian method. The fault plane was expanded to 40 km × 17 km. Then the expanded fault was discretized into 680 subfaults with the size of 1 km × 1 km. As shown in Figure 7, the fault inversion results match the monitored seismic deformation field conditions. The comparison between Figure 6 and Figure 7 shows that the inversion result of Figure 7 is better and more consistent with the actual deformation caused by the earthquake. The maximum residual error of Figure 7 is less than ±20 mm. Although the residual errors in Figure 7 still exist, they have been improved to a large extent. In summary, the inversion results of fault-distributed slip are relatively reasonable and acceptable.
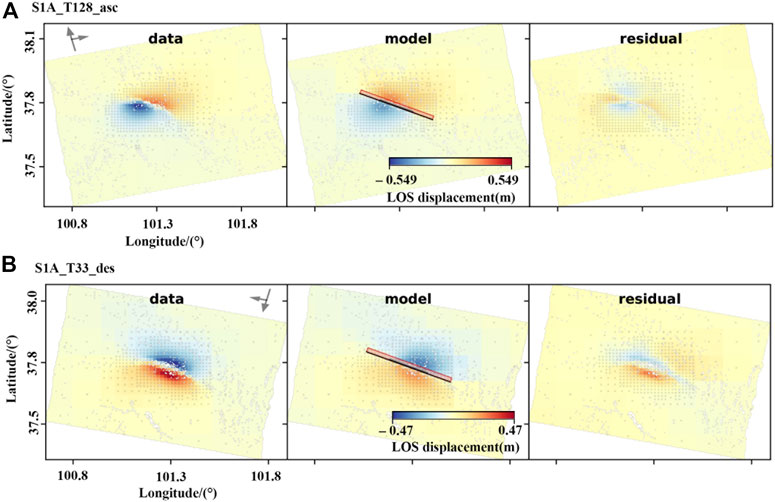
FIGURE 7. Distribution slip inversion results of the 2022 Menyuan earthquake, including observed, modeled, and residual data. (A) Sentinel-1A in ascending track (T128). (B) Sentinel-1A in descending track (T33).
Figure 8 shows the fault slip distribution obtained by distributed inversion. The movement direction of the subfaults indicates that the fault has left-lateral characteristics and belongs to the high dip strike-slip type of earthquake. The maximum slip of the subfault is 3.45 m, which occurs at about 5 km underground, and the main rupture area is concentrated at 3 ∼ 9 km underground. The estimated moment magnitude is
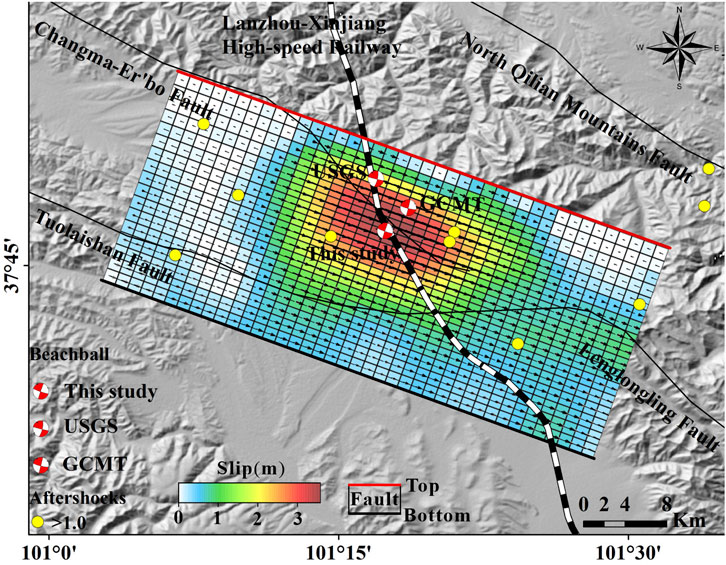
FIGURE 8. The surface projection of co-seismic slip distribution, the square size is 1
5 Discussions
5.1 Fault Movement Characterization
InSAR monitoring results show that the LLL, TLS, Changma-Er’bo Fault, and North Qilian Mountains Fault are all located within the earthquake deformation area. Significantly, the LLL and TLS are close to the seismogenic fault. The existing geological structure shows that the LLL is about 127 km long, strikes from NW 60° to NW 70°, and is an active fault of Holocene time (Lasserre et al., 2002; Han, 2022). This fault is a branch of the North Qilian Mountains active fault, mainly showing thrust and left-slip characteristics (Liang et al., 2017). The TLS is an active normal fault with a general trend in the WNW direction, and the LLL is connected to it (Qu et al., 2021). The fault conditions of the 2022 Menyuan earthquake, determined by combining teleseismic and InSAR data, are in accordance with the movement characteristics of the LLL. Moreover, the fault geometry inversion results demonstrate that the fault strike is compatible with the character of the TLS. The above analysis can tentatively determine that the seismogenic fault of the 2022 Menyuan earthquake is at the junction of the LLL and TLS, and the main body is in the LLL.
Yang et al. (2022) located and monitored the aftershocks of the 2022 Menyuan earthquake and found that the aftershocks extended more than 40 km long along the strike and more than 20 km deep. The early aftershocks occurred mainly in the west of the mainshock. Three days after the mainshock, the number of aftershocks decreased significantly. However, intense aftershock events occurred east of the mainshock, such as the Ms5.3 earthquake of 12 January 2022. This phenomenon means that the fault is in the stress accumulation stage during this time (Wang Z. D. et al., 2022). The slip distribution results from Figure 7 also show that the rupture scale and slip are more severe on the east side of the mainshock than on the west side. Therefore, it is speculated that this asymmetry of co-seismic rupture may have influenced the distribution of aftershocks.
Menyuan had two moderate-intensity earthquakes on 26 August 1986, and 21 January 2016, with Mw5.9 (data from the GCMT). The similarity of the source mechanisms of these two earthquakes suggests that they may have occurred on the same fault (Li et al., 2016b; Hu et al., 2016). Nevertheless, there is a significant difference between the 2022 Menyuan earthquake and the 1986 and 2016 earthquakes (see Figure 1). The main reason is that the 2022 earthquake happened on the LLL, while the two previous earthquakes occurred on the NLLL (Jiang et al., 2017). The NLLL is a secondary fault of the LLL (Li et al., 2016b; Wang H. et al., 2017; Liu et al., 2018). It also indicates the complexity of tectonic movements in the region. Since all three earthquakes were near the LLL and the LLL is located in the famous Tianzhu seismic gap (Lasserre et al., 2002), concerns about a possible large earthquake have increased (Gaudemer et al., 1995; Li et al., 2016a). The GPS velocity field study shows that the shear stress rate near the epicenter can reach 2000 Pa·a−1 (Wang and Shen, 2020), indicating a high degree of occlusion and significant stress accumulation. The 1986 and 2016 Menyuan earthquakes were thrust events. Such secondary thrust fault is likely to serve as an energy release channel for thrust crust deformation, where the LLL will absorb the strike-slip deformation. Therefore, we conclude that the 1986 and 2016 earthquakes contribute to the 2022 Menyuan earthquake, which agrees with the inferences of Qu et al. (2021) and Li et al. (2022).
5.2 Impact of the 2022 Menyuan Earthquake
The 2022 Menyuan earthquake had a relatively shallow source depth of about 5 km (Figure 8). Compared with previous earthquakes, a remarkable feature of this one is the large area of rupture on the ground. According to the site inspection, the ground rupture was about 22 km long, and the ground displacement can reach approximately 2.1 m (Han, 2022). It caused severe damage to the ground environment and surrounding facilities. We performed the ground rupture interpretation based on the Gaofen-7 (GF-7) satellite imagery. As shown in Figure 9, the interpreted results match the InSAR monitoring results in Section 4.1. The western part of the seismogenic region has a gentle topography, and the ground rupture is more continuous, with more obvious tension fissures and extrusion bulges. In the eastern part of the seismic region, the ground rupture is scattered because it passes through high mountains and is affected by snow and ice cover on the hills (Li et al., 2022).
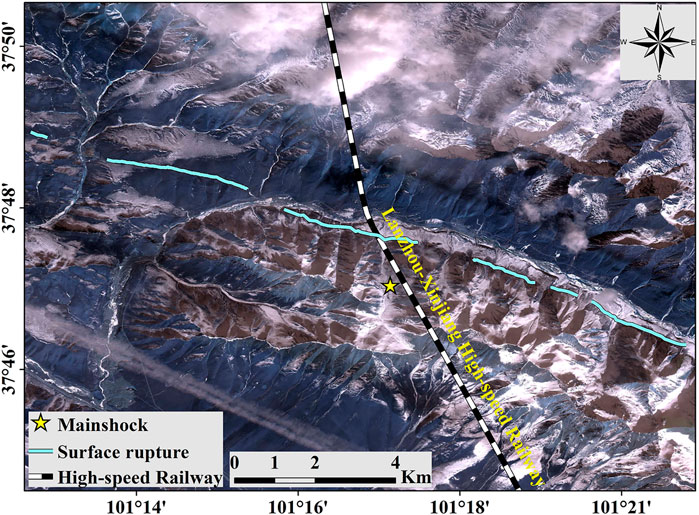
FIGURE 9. The ground rupture of the 2022 Menyuan earthquake was traced from the GF-7 image acquired on 8 January 2022.
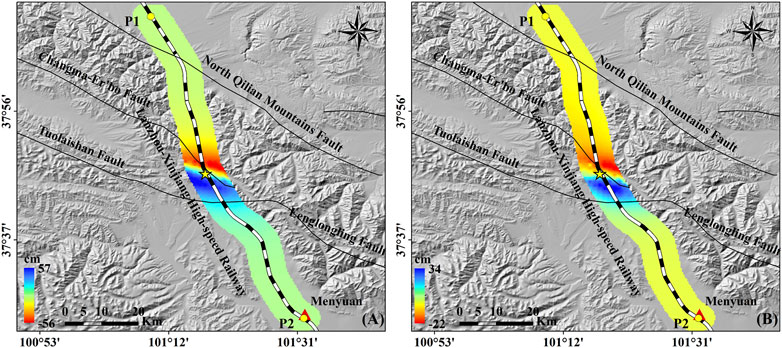
To show the impact of this earthquake on the surrounding area more clearly, we used InSAR monitoring results and fault data to establish a comprehensive “surface-subsurface” deformation field in the study area. And the deformation components in near east-west and vertical directions were obtained, respectively. (He et al., 2020). The north-south component is neglected due to the insensitivity of the Sentinel-1A satellite to the north-south direction. As shown in Figure 10, due to the blocking effect of the Gulang nappe, the LLL becomes the core area where the NE-directional extrusion expansion stress is transformed into SE-directional migration and escape on the Tibetan Plateau. Such a dynamic process makes the LLL as a tectonic directional shift zone, which in turn becomes the power source of the Menyuan Mw6.7 earthquake, promoting the occurrence of ground rupture and causing severe damage to the environment and infrastructure around the earthquake. Figure 10A displays a clear eastward and westward displacement of the ground with a roughly centrosymmetric shape and deformation range of -56 cm–57 cm. Regarding the vertical component shown in Figure 10B, the northern region exhibits settlement (with a maximum of 22 cm subsidence), while the southern region shows a significant ground uplift (with a maximum of 34 cm).
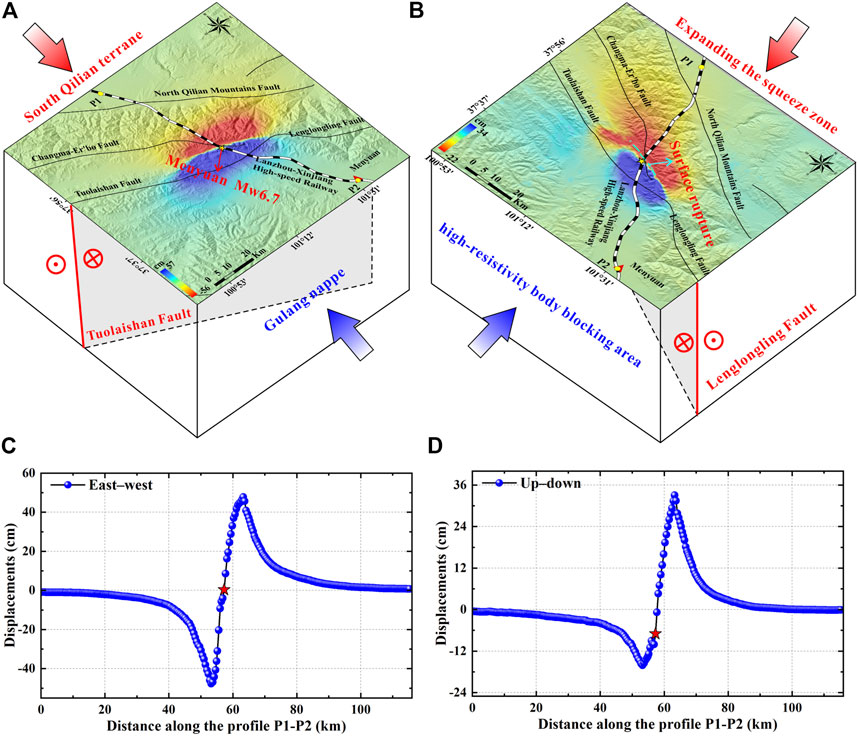
FIGURE 10. The (A) east-west and (B) up-down ground displacement components due to the 2022 Menyuan earthquake. Cross-sections along LHSR P1-P2 in (C) east-west and (D) up-down deformations.
The 2022 Menyuan earthquake posed a considerable safety hazard along the railroad line because the LHSR crossed the ground rupture (see Figure 10B). We extracted the deformation profile of the P1-P2 section of LHSR. As shown in Figure 10C, there is a significant uplift and subsidence center along the LHSR line in the east-west deformation component with a deformation range of
We conducted discrepancy detection, comparison, and analysis using multiple satellite optical images and photographs before and after the earthquake and rapidly monitored and assessed the damage. The monitoring results showed that the section of the LHSR from Menyuan to Minle, which passed through the epicenter area, showed apparent collapse damage. In particular, in the Daliang Tunnel (see Figure 1), the collapse of the tunnel entrance, cross-cutting misalignment of the railroad rails, and fracture of the bridge (see Figure 12) were observed. In addition, considering the fragile geological conditions after the earthquake that could easily lead to the intensification of secondary geological hazards, it is necessary to focus on checking the dangers along the subsequent railroad lines to make timely responses.
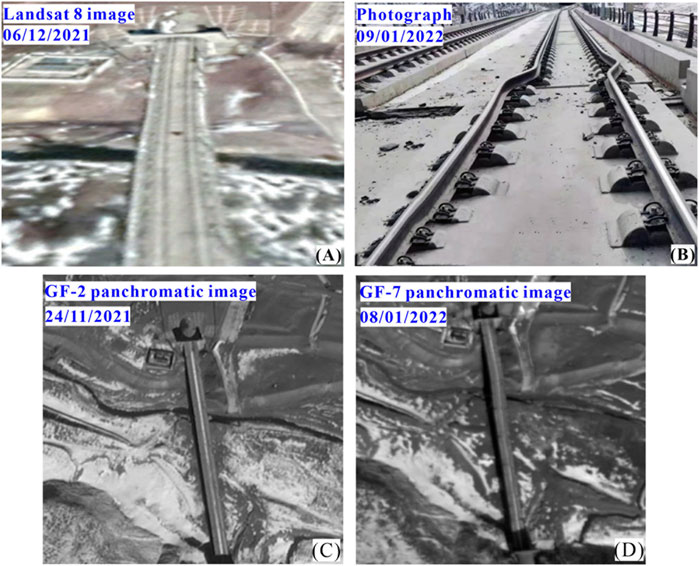
FIGURE 12. Comparison of damage to the Daliang tunnel in the section from Menyuan to Minle. The type of image and the time it was taken are marked in blue.
6 Conclusion
We conducted a study on the co-seismic deformation field, source mechanism and fault movement characteristics of the 2022 Menyuan earthquake with InSAR and teleseismic data. A Bayesian method was employed to understand the specific slip of the left-lateral strike-slip fault. The main contributions are as follows.
(1) InSAR monitoring results acquired from ascending and descending imagery respectively show that the co-seismic impact area of this earthquake is about 30 km × 15 km. Both ground subsidence and uplift are apparent, where the deformation range of the ascending track is about −56 cm–39 cm; the deformation range of the descending data is about −49 cm–56 cm. The footwall and hanging wall of the co-seismic deformation field show opposite deformation patterns, indicating that the ground deformation is mainly horizontal movement, which is consistent with the movement characteristics of the strike-slip fault.
(2) The inversion results of the fault geometry and slip distribution demonstrated that the length and width of the fault are 17.93 km and 4.96 km. The strike, dip, and rake of the fault are 289.78°, 81.88°, and 1.88°, respectively. The movement direction of the subfault indicates that the fault belongs to the high dip strike-slip type earthquake. The slip mainly appears from 3 to 9 km underground, while the maximum slip of about 3.45 m occurs at a depth of approximately 5 km. The earthquake magnitude is Mw6.63.
(3) Combining the inversion results with the geological and tectonic background, we can tentatively determine that the seismogenic fault is at the junction of the LLL and TLS faults, and the central part is in the LLL. We can deduce that the previous twice earthquakes on the NLLL provided an energy release channel for the thrust crustal deformation in this region, while the strike-slip deformation was absorbed by the LLL, which prompted the Menyuan earthquake in 2022 to release energy further.
(4) The ground rupture was interpreted using GF-7 imagery. Moreover, the deformation components in the near east-west and vertical directions were derived from decomposing the InSAR results of the ascending and descending tracks. The earthquake caused severe damage to the ground environment and infrastructures, especially the apparent east-west deformation. As the LHSR passes through the ground rupture, it also poses a huge safety hazard to the operation of the railroad.
Data Availability Statement
The original contributions presented in the study are included in the article/supplementary material, further inquiries can be directed to the corresponding author.
Author Contributions
XB: Conceptualization, Methodology, Visualization. RZ: Conceptualization, Supervision, Writing—review and editing, Funding acquisition. TW: Resources, Investigation. AS: Writing—review and editing, RQZ: Conceptualization. JL: Resources, Writing—review and editing. RW: Resources, Validation. YF: Methodology, Software. GL: Writing—review and editing, Funding acquisition.
Funding
This research was jointly funded by the National Natural Science Foundation of China (Grant 42171355 and 42071410); and the Sichuan Science and Technology Program (No. 2018JY0564, 2019ZDZX0042, 2020JDTD0003 and 2020YJ0322).
Conflict of Interest
The authors declare that the research was conducted in the absence of any commercial or financial relationships that could be construed as a potential conflict of interest.
Publisher’s Note
All claims expressed in this article are solely those of the authors and do not necessarily represent those of their affiliated organizations, or those of the publisher, the editors and the reviewers. Any product that may be evaluated in this article, or claim that may be made by its manufacturer, is not guaranteed or endorsed by the publisher.
References
Bao, X., Zhang, R., Shama, A., Li, S., Xie, L., Lv, J., et al. (2022). Ground Deformation Pattern Analysis and Evolution Prediction of Shanghai Pudong International Airport Based on PSI Long Time Series Observations. Remote Sens. 14 (3), 610. doi:10.3390/rs14030610
Bassin, C. (2000). The Current Limits of Resolution for Surface Wave Tomography in North America. EOS, Trans. Am. Geophys. Un. 81, F897.
Bayes, T. (1763). LII. An Essay towards Solving a Problem in the Doctrine of Chances. By the Late Rev. Mr. Bayes, FRS. Communicated by Mr. Price, in a Letter to John Canton, AMFR. S. Phil. Trans. R. Soc. 53 (53), 370–418. doi:10.1098/rstl.1763.0053
Chen, C. W., and Zebker, H. A. (2002). Phase Unwrapping for Large SAR Interferograms: Statistical Segmentation and Generalized Network Models. IEEE Trans. Geosci. Remote Sens. 40 (8), 1709–1719. doi:10.1109/TGRS.2002.802453
Deng, Q., Chen, S., Song, F., Zhu, S., Wang, Y., Zhang, W., et al. (1986). Variations in the Geometry and Amount of Slip on the Haiyuan (Nanxihaushan) Fault Zone, China, and the Surface Rupture of the 1920 Haiyuan Earthquake. Washington, DC: Geophys. Monogr. Ser..
Deng, Q. D., Zhang, P. Z., Ran, Y. K., Yang, X. P., Min, W., and Chen, L. C. (2003). Active Tectonics and Earthquake Activities in China. Earth Sci. Front. 10 (Suppl. P), 66–73. doi:10.1360/03dz0002
Duputel, Z., Rivera, L., Fukahata, Y., and Kanamori, H. (2012). Uncertainty Estimations for Seismic Source Inversions. Geophys. J. Int. 190 (2), 1243–1256. doi:10.1111/j.1365-246X.2012.05554.x
Dutta, R., Jónsson, S., Wang, T., and Vasyura-Bathke, H. (2018). Bayesian Estimation of Source Parameters and Associated Coulomb Failure Stress Changes for the 2005 Fukuoka (Japan) Earthquake. Geophys. J. Int. 213 (1), 261–277. doi:10.1093/gji/ggx551
Fukuda, J., and Johnson, K. M. (2008). A Fully Bayesian Inversion for Spatial Distribution of Fault Slip with Objective Smoothing. Bull. Seismol. Soc. Am. 98 (3), 1128–1146. doi:10.1785/0120070194
Ganas, A., Elias, P., Briole, P., Cannavo, F., Valkaniotis, S., Tsironi, V., et al. (2020). Ground Deformation and Seismic Fault Model of the M6.4 Durres (Albania) Nov. 26, 2019 Earthquake, Based on GNSS/INSAR Observations. Geosciences 10 (6), 210. doi:10.3390/geosciences10060210
Gaudemer, Y., Tapponnier, P., Meyer, B., Peltzer, G., Shunmin, G., Zhitai, C., et al. (1995). Partitioning of Crustal Slip between Linked, Active Faults in the Eastern Qilian Shan, and Evidence for a Major Seismic Gap, the 'Tianzhu Gap', on the Western Haiyuan Fault, Gansu (China). Geophys. J. Int. 120 (3), 599–645. doi:10.1111/j.1365-246X.1995.tb01842.x
Goldstein, R. M., and Werner, C. L. (1998). Radar Interferogram Filtering for Geophysical Applications. Geophys. Res. Lett. 25 (21), 4035–4038. doi:10.1029/1998GL900033
Guo, P., Han, Z., Mao, Z., Xie, Z., Dong, S., Gao, F., et al. (2019). Paleoearthquakes and Rupture Behavior of the Lenglongling Fault: Implications for Seismic Hazards of the Northeastern Margin of the Tibetan Plateau. J. Geophys. Res. Solid Earth 124 (2), 1520–1543. doi:10.1029/2018JB016586
Han, L. B. (2022). Focal Mechanism of 2022 Menyuan MS6.9 Earthquake in Qinghai Province. Prog. Earthq. Sci. 52 (2), 49–54. doi:10.19987/j.dzkxjz.2022-024
He, P., Wen, Y., Ding, K., and Xu, C. (2020). Normal Faulting in the 2020 Mw 6.2 Yutian Event: Implications for Ongoing E-W Thinning in Northern Tibet. Remote Sens. 12 (18), 3012. doi:10.3390/rs12183012
Hu, C. Z., Yang, P. X., Li, Z. M., Huang, S. T., Zhao, Y., Chen, D., et al. (2016). Seismogenic Mechanism of the 21 January 2016 Menyuan, Qinghai M S 6.4 Earthquake. Chin. J. Geophys. 59 (3), 211–221. doi:10.6038/cjg20160509
Jiang, W. L., Li, Y. S., Tian, Y. F., Han, Z. J., and Zhang, J. F. (2017). Research of Seismogenic Structure of the Menyuan Ms6. 4 Earthquake on January 21, 2016 in Lenglongling Area of NE Tibetan Plateau. Seismol. Egology 39 (3), 536. doi:10.3969/j.issn.0253-4967.2017.03.007
Jin, Z., and Fialko, Y. (2021). Coseismic and Early Postseismic Deformation Due to the 2021 M7.4 Maduo (China) Earthquake. Geophys. Res. Lett. 48 (21), e2021GL095213. doi:10.1029/2021GL095213
Jonsson, S., Zebker, H., Segall, P., and Amelung, F. (2002). Fault Slip Distribution of the 1999 Mw 7.1 Hector Mine, California, Earthquake, Estimated from Satellite Radar and GPS Measurements. Bull. Seismol. Soc. Am. 92 (4), 1377–1389. doi:10.1785/0120000922
Lasserre, C., Gaudemer, Y., Tapponnier, P., Mériaux, A.-S., Van der Woerd, J., Daoyang, Y., et al. (2002). Fast Late Pleistocene Slip Rate on the Leng Long Ling Segment of the Haiyuan Fault, Qinghai, China. J. Geophys. Res. 107 (B11), 4–1. doi:10.1029/2000JB000060
Li, Y., Gan, W., Wang, Y., Chen, W., Liang, S., Zhang, K., et al. (2016a). Seismogenic Structure of the 2016 Ms6.4 Menyuan Earthquake and its Effect on the Tianzhu Seismic Gap. Geodesy Geodyn. 7 (4), 230–236. doi:10.1016/j.geog.2016.07.002
Li, Y., Jiang, W., Zhang, J., and Luo, Y. (2016b). Space Geodetic Observations and Modeling of 2016 Mw 5.9 Menyuan Earthquake: Implications on Seismogenic Tectonic Motion. Remote Sens. 8 (6), 519. doi:10.3390/rs8060519
Li, Z. H., Han, B. Q., Liu, Z. J., Zhang, M. M., Yu, C., Chen, B., et al. (2022). Sourceparameters and Slip Distributions of the 2016 and 2022 Menyuan, Qinghai Earthquakes Constrained by InSAR Observations. Geomatics Inf. Sci. Wuhan Univ., 1–15. doi:10.13203/j.whugis20220037
Li, Z. W., Ding, X. L., Huang, C., Zhu, J. J., and Chen, Y. L. (2008). Improved Filtering Parameter Determination for the Goldstein Radar Interferogram Filter. ISPRS J. Photogrammetry Remote Sens. 63 (6), 621–634. doi:10.1016/j.isprsjprs.2008.03.001
Liang, S. S., Lei, J. S., Xu, Z. G., Zou, L. Y., and Liu, J. G. (2017). Relocation of the Aftershock Sequence and Focal Mechanism Solutions of the 21 January 2016 Menyuan, Qinghai, M S 6.4 Earthquake. Chin. J. Geophys. 60 (6), 2091–2103. doi:10.6038/cjg20170606
Liu, M., Li, H., Peng, Z., Ouyang, L., Ma, Y., Ma, J., et al. (2019). Spatial-temporal Distribution of Early Aftershocks Following the 2016 Ms 6.4 Menyuan, Qinghai, China Earthquake. Tectonophysics 766, 469–479. doi:10.1016/j.tecto.2019.06.022
Liu, Y., Zhang, G., Zhang, Y., and Shan, X. (2018). Source Parameters of the 2016 Menyuan Earthquake in the Northeastern Tibetan Plateau Determined from Regional Seismic Waveforms and InSAR Measurements. J. Asian Earth Sci. 158, 103–111. doi:10.1016/j.jseaes.2018.02.009
Liu-Zeng, J., Klinger, Y., Xu, X., Lasserre, C., Chen, G., Chen, W., et al. (2007). Millennial Recurrence of Large Earthquakes on the Haiyuan Fault Near Songshan, Gansu Province, China. Bull. Seismol. Soc. Am. 97 (1B), 14–34. doi:10.1785/0120050118
Mai, P. M., Sudhaus, J., Jónsson, S., Heimann, S., Isken, M. P., Zielke, O., et al. (2020). The Bayesian Earthquake Analysis Tool. Seismol. Res. Lett. 91 (2A), 1003–1018. doi:10.1785/0220190075
Melgar, D., and Bock, Y. (2015). Kinematic Earthquake Source Inversion and Tsunami Runup Prediction with Regional Geophysical Data. J. Geophys. Res. Solid Earth 120 (5), 3324–3349. doi:10.1002/2014JB011832
Minson, S. E., Simons, M., and Beck, J. L. (2013). Bayesian Inversion for Finite Fault Earthquake Source Models I-Theory and Algorithm. Geophys. J. Int. 194 (3), 1701–1726. doi:10.1093/gji/ggt180
Molnar, P., and Qidong, D. (1984). Faulting Associated with Large Earthquakes and the Average Rate of Deformation in Central and Eastern Asia. J. Geophys. Res. 89 (B7), 6203–6227. doi:10.1029/JB089iB07p06203
Monelli, D., and Mai, P. M. (2008). Bayesian Inference of Kinematic Earthquake Rupture Parameters through Fitting of Strong Motion Data. Geophys. J. Int. 173 (1), 220–232. doi:10.1111/j.1365-246X.2008.03733.x
Peltzer, G., Tapponnier, P., Gaudemer, Y., Meyer, B., Guo, S., Yin, K., et al. (1988). Offsets of Late Quaternary Morphology, Rate of Slip, and Recurrence of Large Earthquakes on the Chang Ma Fault (Gansu, China). J. Geophys. Res. 93 (B7), 7793–7812. doi:10.1029/JB093iB07p07793
Qu, W., Liu, B., Zhang, Q., Gao, Y., Chen, H., Wang, Q., et al. (2021). Sentinel-1 InSAR Observations of Co- and Post-seismic Deformation Mechanisms of the 2016 Mw 5.9 Menyuan Earthquake, Northwestern China. Adv. Space Res. 68 (3), 1301–1317. doi:10.1016/j.asr.2021.03.016
Razafindrakoto, H. N. T., and Mai, P. M. (2014). Uncertainty in Earthquake Source Imaging Due to Variations in Source Time Function and Earth Structure. Bull. Seismol. Soc. Am. 104 (2), 855–874. doi:10.1785/0120130195
Sandwell, D., Mellors, R., Tong, X. P., Wei, M., and Wessel, P. (2011). Gmtsar: An Insar Processing System Based on Generic Mapping Tools. UC San Diego.
Shi, Y.-t., Gao, Y., Shen, X.-z., and Liu, K. H. (2020). Multiscale Spatial Distribution of Crustal Seismic Anisotropy beneath the Northeastern Margin of the Tibetan Plateau and Tectonic Implications of the Haiyuan Fault. Tectonophysics 774, 228274. doi:10.1016/j.tecto.2019.228274
Tapponnier, P., and Molnar, P. (1977). Active Faulting and Tectonics in China. J. Geophys. Res. 82 (20), 2905–2930. doi:10.1029/JB082i020p02905
Tapponnier, P., Zhiqin, X., Roger, F., Meyer, B., Arnaud, N., Wittlinger, G., et al. (2001). Oblique Stepwise Rise and Growth of the Tibet Plateau. science 294 (5547), 1671–1677. doi:10.1126/science.105978
Tarantola, A., and Valette, B. (1982). Inverse Problems= Quest for Information. J. Geophys. 50 (1), 159–170.
Taymaz, T., Ganas, A., Yolsal-Çevikbilen, S., Vera, F., Eken, T., Erman, C., et al. (2021). Source Mechanism and Rupture Process of the 24 January 2020 Mw 6.7 Doğanyol-Sivrice Earthquake Obtained from Seismological Waveform Analysis and Space Geodetic Observations on the East Anatolian Fault Zone (Turkey). Tectonophysics 804, 228745. doi:10.1016/j.tecto.2021.228745
Taymaz, T., Yolsal-Çevikbilen, S., Irmak, T. S., Vera, F., Liu, C., Eken, T., et al. (2022). Kinematics of the 30 October 2020 Mw 7.0 Néon Karlovásion (Samos) Earthquake in the Eastern Aegean Sea: Implications on Source Characteristics and Dynamic Rupture Simulations. Tectonophysics 826, 229223. doi:10.1016/j.tecto.2022.229223
Wang, H., Liu-Zeng, J., Ng, A. H.-M., Ge, L., Javed, F., Long, F., et al. (2017). Sentinel-1 Observations of the 2016 Menyuan Earthquake: A Buried Reverse Event Linked to the Left-Lateral Haiyuan Fault. Int. J. Appl. Earth Observation Geoinformation 61, 14–21. doi:10.1016/j.jag.2017.04.011
Wang, K., Xu, X., and Fialko, Y. (2017). Improving Burst Alignment in TOPS Interferometry with Bivariate Enhanced Spectral Diversity. IEEE Geosci. Remote Sens. Lett. 14 (12), 2423–2427. doi:10.1109/LGRS.2017.2767575
Wang, M., and Shen, Z. K. (2020). Present‐Day Crustal Deformation of Continental China Derived from GPS and its Tectonic Implications. J. Geophys. Res. Solid Earth 125 (2), e2019JB018774. doi:10.1029/2019JB018774
Wang, Q., Xiao, Z., Wu, Y., Li S, Y., and Gao, Y. (2022). Analysis of the Deep Tectonic Background of the MS6.9 Menyuan Earthquake on January 8, 2022 in Qinghai Province. Acta Seismol. Sin. 44 (0), 1–13. doi:10.11939/jass.20220010
Wang, Z. D., Yang, X. P., Yin, X. X., Pu, j., Wang, W. H., and Chen, X. L. (2022). Discussion on the Automatic Processing Results for the Aftershock Sequenceof Menyuan,Qinghai Ms6.9 Earthquake on 8 January,2022. China Earthq. Eng. J., 1–7. doi:10.20000/j.1000-0844.20220125002
Xie, L., Xu, W., Liu, X., and Ding, X. (2021). Surge of Mangla Reservoir Loading Promoted Failure on Active Décollement of Western Himalayas. Int. J. Appl. Earth Observation Geoinformation 102, 102401. doi:10.1016/j.jag.2021.102401
Xu, X., Yeats, R. S., and Yu, G. (2010). Five Short Historical Earthquake Surface Ruptures Near the Silk Road, Gansu Province, China. Bull. Seismol. Soc. Am. 100 (2), 541–561. doi:10.1785/0120080282
Xu, Y. C., Guo, X. Y., and Feng, L. L. (2022). Relocation and Focal Mechanism Solutions of the MS6.9 Menyuan Earthquake Sequence on January 8, 2022 in Qinghai Province. Acta Seismol. Sin. 44 (2), 1–15. doi:10.11939/jass.20220008
Yang, H., Wang, D., Guo, R., Xie, M., Zang, Y., Wang, Y., et al. (2022). Rapid Report of the 8 January 2022 MS 6.9 Menyuan Earthquake, Qinghai, China. Earthq. Res. Adv. 2, 100113. doi:10.1016/j.eqrea.2022.100113
Yin, A., Dang, Y.-Q., Wang, L.-C., Jiang, W.-M., Zhou, S.-P., Chen, X.-H., et al. (2008). Cenozoic Tectonic Evolution of Qaidam Basin and its Surrounding Regions (Part 1): The Southern Qilian Shan-Nan Shan Thrust Belt and Northern Qaidam Basin. Geol. Soc. Am. Bull. 120 (7-8), 813–846. doi:10.1130/B26180.1
Zhang, H., Gao, Y., Shi, Y. T., Liu, X. F., and Wang, Y. X. (2012). Tectonic Stress Analysis Based on the Crustal Seismic Anisotropy in the Northeastern Margin of Tibetan Plateau. Chin. J. Geophys. 55 (1), 95–104. doi:10.6038/j.issn.0001-5733.2012.01.009
Zhang, Y., Shan, X., Zhang, G., Zhong, M., Zhao, Y., Wen, S., et al. (2020). The 2016 Mw 5.9 Menyuan Earthquake in the Qilian Orogen, China: A Potentially Delayed Depth-Segmented Rupture Following from the 1986 Mw 6.0 Menyuan Earthquake. Seismol. Res. Lett. 91 (2A), 758–769. doi:10.1785/0220190168
Keywords: Menyuan earthquake, InSAR, co-seismic deformation field, finite fault model, fault movement characterization
Citation: Bao X, Zhang R, Wang T, Shama A, Zhan R, Lv J, Wu R, Fu Y and Liu G (2022) The Source Mechanism and Fault Movement Characterization of the 2022 Mw6.7 Menyuan Earthquake Revealed by the Joint Inversion With InSAR and Teleseismic Observations. Front. Environ. Sci. 10:917042. doi: 10.3389/fenvs.2022.917042
Received: 10 April 2022; Accepted: 23 May 2022;
Published: 06 June 2022.
Edited by:
Jun Hu, Central South University, ChinaReviewed by:
Tuncay Taymaz, Istanbul Technical University, TurkeyXianjie Zha, University of Science and Technology of China, China
Copyright © 2022 Bao, Zhang, Wang, Shama, Zhan, Lv, Wu, Fu and Liu. This is an open-access article distributed under the terms of the Creative Commons Attribution License (CC BY). The use, distribution or reproduction in other forums is permitted, provided the original author(s) and the copyright owner(s) are credited and that the original publication in this journal is cited, in accordance with accepted academic practice. No use, distribution or reproduction is permitted which does not comply with these terms.
*Correspondence: Rui Zhang, emhhbmdydWlAc3dqdHUuZWR1LmNu
 Xin Bao
 Rui Zhang
 Ting Wang1
 Guoxiang Liu