- 1School of Economics and Management, Institute of Disaster Prevention, Langfang, China
- 2China Agriculture Reinsurance Corporation Beijing, Beijing, China
The purpose of this paper is to estimate county-level aggregate crop insurance and reinsurance losses under systematic risk. The effect of dependence risk on losses assessment and insurance pricing is quantified by establishing joint distribution functions between county-level yields using different forms of multivariate copulas. The research also stresses the importance of selecting the appropriate copula form for estimating losses. This article highlights several significant findings. The estimated aggregate losses for related counties are not significantly different between the model assuming dependence (copula-based) and the model assuming independence (individual) that adheres to the equivalence principle. On the other hand, the copula-based model has a discernible effect on the estimated Value-at-Risk and Expected Shortfall for related counties. Additionally, for the different layers of the Standard Reinsurance Agreement policy, the copula-based model can measure the aggregate losses more accurately than the individual models. Furthermore, when there is obvious tail dependence in the related counties’ yields, the vine copula function form, which provides a more flexible description of the dependence, is more suitable for quantifying tail risk. As a result, insurers and governments should conduct a more comprehensive risk assessment of yield dependence when rate-making and allocating subsidies.
1 Introduction
The federal crop insurance program in the United States, which currently provides yield-based coverage and revenue insurance to help agricultural producers avoid losses due to low crop yields or lower-than-expected crop prices, is one of the most extensive support programs for agricultural producers.
Under the federal crop insurance program, producers can purchase insurance policies at a subsidized rate. These insurance policies compensate producers for current losses caused by either below-average yields (yield-based coverage) or below-average revenue (revenue-based coverage) (revenue insurance). Under a Standard Reinsurance Agreement (SRA), policies are sold through private insurance companies. USDA’s Risk Management Agency (RMA) subsidized the policy premium and a portion of the companies’ administrative and operating expenses and shares in the companies’ underwriting gains and losses. Premium subsidy rates have increased in recent decades for a variety of policy types so that producers typically pay only about 40% of their premiums. It cost the federal government $5 billion in 2016 and nearly $9 billion on an annual average basis over the last 5 years.
Many studies cast doubt on the government’s support for crop insurance schemes, claiming that the substantial subsidies offered to farmers and insurance corporations would result in a variety of inefficiencies in the aggregate economy (Smith and Goodwin, 1996; Goodwin and Vado, 2007; Goodwin and Smith, 2013; Smith, 2011). Otherwise, proponents of such schemes argue that agricultural damage from possible systemic risks such as droughts and floods is too great for commercial insurers and reinsurers to cover adequately (Miranda and Glauber, 1997; Coble et al., 2003).
Crop insurance policies are designed to protect against income losses caused by fluctuations in crop prices and yields. Premium pricing for such contracts is an actuarial issue that involves describing the joint distribution of prices and yields (Coble et al., 2010). A density function of crop yields under proper information circumstances must be determined as part of the actuarial fair pricing procedure. Unlike most other types of insurance, crop insurance lacks the necessary information to accurately estimate the likelihood and magnitude of losses. One of the most significant issues is a lack of relevant data. Today’s standard method regresses historical yield time series data and then uses the predicted and adjusted residuals to estimate a crop yield conditional density function. Numerous studies have been conducted to determine the marginal distribution of yields. For example, Atwood, Shaik, and Watts (2003) argue that calculating trends with short-term panel data biases the analysis in a Type II direction, failing to reject normality when the underlying distribution is nonnormal. This research reveals that yield parameterization can influence crop insurance payouts. Unchecked yield distribution specifications may result in economic inaccuracies in crop insurance rating and expected payouts (Sherrick et al., 2004). Goodwin et al. (2000) compared price risk estimation and insurance rates and used specification tests to analyze distributional assumptions. The reality that the best-fitting distribution in-sample is not necessarily the best choice out-of-sample is critical for determining crop yield distributions. Woodard and Sherrick (2011) present a method for estimating flexible and efficient mixed models using cross-validation that alleviates many of these model selection difficulties. Nelson and Preckel (1989) proposed the conditional beta distribution as a parameterized model for the probability distribution of agricultural output by a two-stage maximum likelihood estimation method.
In addition, inaccurate predictions and inferences of a parametric may result from incorrect distributional choices. Due to these restrictions, nonparametric approaches for estimating yield distributions have been developed (Goodwin and Ker, 1998). Tolhurst and Ker (2015) propose estimating crop yields using mixtures with embedded trend functions to account for potentially different technical development rates. When distinct trend functions are incorporated into mixture components, projected conditional yield densities differ from those derived from detrended data. The focus of these researches has been on estimating the marginal distribution of crop yields and determining whether an optimal marginal distribution can be established. Even though years of research have failed to determine which distribution provides the most accurate yield estimate, the current trend is toward employing more flexible parameter distributions that accommodate for skewness and excess kurtosis (Ramsey and Goodwin, 2019).
For the discussion of utilizing the copula function to measure the dependence of variables in contract design and pricing for government revenue insurance, Ramsey et al. (2019) conclude that the economic impact of copula choice on pricing for individual policies was minor, and changes in marginal distributions significantly influence rates. At the moment, the revenue insurance pricing model makes two assumptions regarding the structure of the dependence. The first assumption is that the Gaussian copula accurately captures the relationship between price and yield, and the second is that the Gaussian copula function is deterministic for each state (Ramsey et al., 2019). The second implication is that crop insurance rate determination ignores the county-level yield dependence, which may result in some mistakes or omissions of systemic risk.
Because yield risk is spatially correlated, a measure of the spatial dependence of yield is required. The empirical investigation has indicated that the systemic risk tends to be much greater when extreme weather circumstances such as drought occur (e.g., Goodwin, 2001). Quantifying the degree of systemic risk is critical for addressing public policy issues regarding the need for large crop insurance subsidies, especially relevant given the reliance on county-level yield hazards. For example, Wang and Zhang (2003) use spatial statistics to investigate the efficiency of risk pooling for crop insurance in the presence of correlation. When modeling the insured losses dependence structure, the size of the buffer load is determined by the value-at-risk (VaR) of aggregate losses between states (Xu et al., 2010, Okhrin et al., 2012). Goodwin and Hungerford (2015) use a variety of copula models to assess the degree to which weather and natural disaster risks in agriculture are systemic and state-dependent. Their findings indicate that the approach taken to quantify multiple, correlated sources of risk may have significant implications for the accurate measurement of portfolio risks. Studies have also argued for improved pricing accuracy based on yield data from surrounding counties and that the dependent yield information can make insurance pricing more accurate when the dependency structure is known (Racine and Ker, 2006; Zhu, Goodwin, and Ghosh, 2014).
The critical challenge of estimating and pricing the loss risk of a portfolio of crop insurance policies has attracted significant attention. The same component that creates dependencies between yields in different locations in crop yield modeling can also lead to systematic risk in a crop insurance portfolio. To model a portfolio of county-level contracts, we must consider the inter-dependencies between the portfolio’s county-level yields. A copula can be used in the yield model to estimate the dependence’s losses, and then the contract can be priced actuarially based on the mean of the loss distribution. The copula function that represents the dependence of random variables and generates the distribution of random variables must be estimated in modeling this yield structure. Goodwin and Hungerford (2015) propose that RMA may use the deterministic Gaussian copula assumption to fit the dependent structure of price and yield when the data sample is small and the effects of different copula function forms on rate-making are negligible.
So far as we know, no objective criterion exists to compare the accuracy of copula-based approaches to those that do not account for yield dependence. Moreover, no research has been undertaken to ascertain the efficacy of the copula-based approach for crop insurance indemnity in the presence of systemic risk. This research aims to determine the extent to which systematic risk directly or indirectly affects indemnification by developing aggregate losses models for county-level yields using various copula forms. We are particularly interested in the tail risk of the losses distribution, as the possibility of experiencing large losses is critical for getting reinsurance funds and subsidies. We also measure the tail risk here by simulating the aggregate losses’ VaR and Expected Shortfall (ES). Stochastic simulation approaches can calculate the aggregate losses, ES, and VaR using the estimated copula functions and marginal distributions of county-level yields. By comparing the simulation results, we could determine whether the pricing model with a dependence assumption is more effective than the individual model with no dependence assumption.
This research conducts an empirical study of the efficacy of risk measurement in two particular areas. We test the effectiveness of the estimation approach for crop insurance indemnity of risk portfolio based on copula-based and individual models. Then, we examine the accuracy of those two models for the aggregate losses assessment at various layers of SRA policy. We conclude that, compared to the individual models, the copula-based models have a negligible effect on estimating aggregate losses under the equivalence principle while beating the individual models in estimating VaR and ES values. Otherwise, the copula-based models have significant consequences for appropriately estimating portfolio risk at various layers of SRA policy at various layers of SRA policy. The Vine copula function approach, which allows for a more flexible definition of dependence risk, is more suitable for loss measurement in crop insurance when the tail dependence can be captured.
The rest of the paper is structured in the following. Section 2 provides an overview of the data sources. Section 3 discusses using copula functions as the Vine copula in modeling county-level dependent risk, the model-building procedure, and the effectiveness assessment. In Section 4, this approach is used to county-level data sets of the United States to conduct empirical analysis, and the findings are reported. The paper is ended by exploring the effectiveness of copula-based models for estimating dependent risk in crop insurance.
2 Data Sources
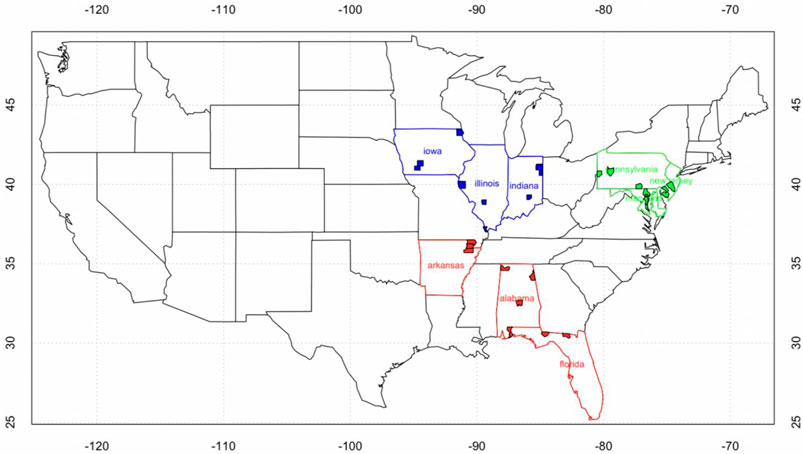
We obtain the average county-level corn yield per acre from the US Department of Agriculture’s National Agricultural Statistics Service (NASS) (USDA). SRA established three state-based reinsurance pools1. Because our objective is to quantify yield dependence under systemic risk for each group, we restrict our analysis to the rainfed region of the United States (east of the 100th meridian) from 1977 to 2007. Our model consists of three states (Illinois (IL), Indiana (IN), and Iowa (IA) in Group 1, Alabama (AL), Arkansas (AR), and Florida (FL) in Group 2, and Pennsylvania (PA), New Jersey (NJ), and Maryland (MD) in Group 3) each with three related counties. As a result, the data sets include the aggregated yields of 27 counties (Figure 1). Notably, we randomly select the counties in each state, which either contain adjoining or nonadjacent counties, to test the effectiveness of the copula-based model for losses estimation in different situations.
Each county’s raw yields were detrended using robust regression procedures similar to those used in RMA. The regression method we use, M-estimation, is a more generalization of MM-estimation (Huber, 1973). Finger (2010) notes that the errors associated with this detrending method are likely to be small or moderate in magnitude.
3 Methodology
3.1 The Methods for Measuring Aggregate Losses
The SRA decides the government’s losses/gain split with Approved Insurance Providers (AIPs, the RMA’s designation for insurance companies), which means that the government will bear all unaffordable underwriting losses. The FCIC provides both proportional and non-proportional reinsurance under the present SRA. Insurance companies are permitted to commercially reinsure any portion of their liability that has not been ceded to the FCIC, as long as they disclose all facts in their operations plan. The SRA’s non-proportional reinsurance provision reduces insurers’ liability exposure on their retained book of business. The FCIC’s share of losses on an insurer’s retained book of business varies with each fund and is contingent on the insurer’s losses ratio. The state losses ratio of an individual AIP determines the AlP’s gain/losses share. Each state fund’s losses ratio is determined separately2. The FCIC employs a graded structure in which insurers are held accountable for diminishing percentages of eventual net losses as their losses ratio improve.
Under the SRA, a company’s retention levels and potential gain/losses are greatest when policies are placed in the Commercial Fund and lowest in the Assigned Risk Fund. FCIC receives 80% of the premium and associated liability in the Assigned Risk Fund, while the company retains 20%. Companies must keep a minimum of 30% (and may retain up to 100%) of the premium and associated liabilities in the commercial fund. FCIC pays increasing shares of indemnities from the liability retained by the company, based on the company’s state-level losses ratio (indemnities divided by total premium) in the fund, with FCIC paying the total losses once the losses ratio surpasses 5.0. The proportions of income and losses that fall to private insurance companies vary significantly by the fund (as shown in Table 1). For Assigned Risk policies, for example, the highest potential underwriting losses is 16.5 percent (0.6*7.5 + 0.6*6.0 + 2.8*3) of company-retained premium. However, the company’s potential for underwriting gains on policies put in the Assigned Risk Fund is likewise relatively small, as11.4 percent of retained premium at most. In comparison, on policies put in the Commercial Fund, Group 1 might earn up to 34.75 percent of the retained premium on Commercial Fund policies. However, the downside risks are also greater, and the maximum permissible underwriting losses is 94 percent of the retained premium.
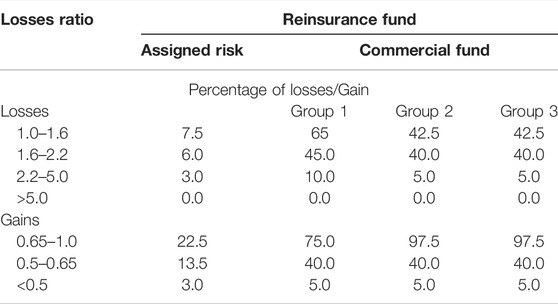
TABLE 1. Shares of underwriting gains and losses to insurance companies under the 2021 Standard Reinsurance Agreement.
The main problem addressed here is evaluating the effectiveness of measuring insurance payment methods based on the dependence risk model. We must determine whether there is any potential for dependence between the portfolio’s county-level yields, and this dependence could be captured in the insurance losses model to reflect the more accurate fair rates. Then, from a reinsurance perspective, losses evaluation exposed to systematic risk is crucial for determining underwriting terms. Risk assessment at various layers enables us to determine the effect of yield dependence on rate-making.
Crop insurance rate-making involves the simultaneous distribution of prices and yields. To keep things simple, we will focus exclusively on the indemnity under systemic risk and ignore the volatility of the corn price. The indemnity for county
Where
The objective of reinsurance is to provide protection for aggregate losses
Therefore, a layer contract covers part of the losses between trigger level
Other than estimating the aggregate losses for the regular contract and SRA layers contract, we also estimate the VaR of the aggregate losses, which can be applied to measure the systemic risk inherent to an insurance portfolio. The VaR of aggregate losses for the risk portfolio in each State is:
Herein
We also consider Expected Shortfall, which measures the average losses over the VaR value. ES takes the average of all the losses greater than the VaR value. Since it is an expectation calculated by integrating over an entire region, it is a much more robust statistic compared to VaR, which is just a single value.
3.2 Simulation of Aggregate Losses Using Copulas
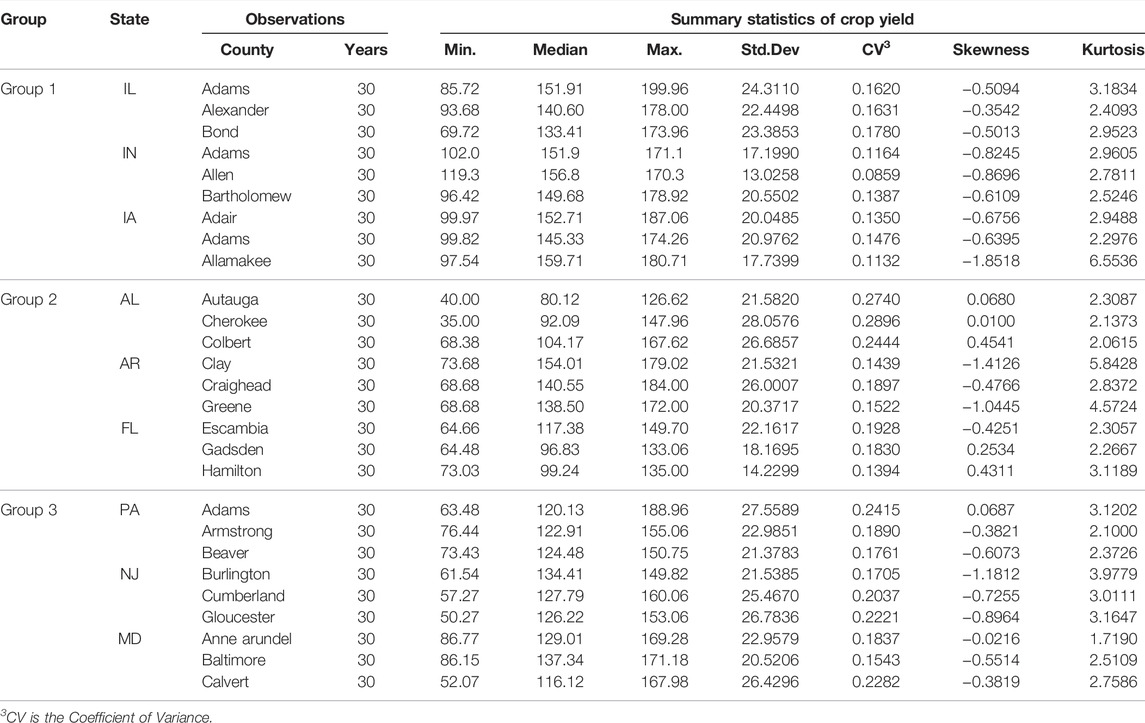
We use the copula-based models to measure the dependence between county-level yields for aggregate losses quantification. Due to the “curse of dimension” associated with an excessive number of variables, a yield portfolio including three counties from each of the nine states is chosen for testing for simplicity and practical reasons. The data sets, which cover the yields of three counties in nine states, are summarized in Table 2. We can find that county Allamakee in Group 1 and county Clay in Group 2 has obvious leptokurtic distribution, and most of the counties have negative skewness. Figure 1 shows the geographical location of the selected counties in each state. The counties in AR, NJ, and MD are adjacent to each other, and the state AL, FL, PA has the most scattered counties portfolio.
Copulas are very flexible with regard to representing the dependent structure of variables. The copula function’s fundamental concept is to link the marginal distribution to the joint distribution (Sklar, 1959), avoiding direct estimation of the multivariate distribution function and fitting the multivariate distribution function using parametric or non-parametric methods to estimate the marginal distributions of the variables independently. Copulas have grown in popularity in recent years and have been used to a variety of financial difficulties (Embrechts et al., 1999; Cherubini et al., 2004). They have also been used extensively in agricultural economics, mostly to model spatial dependence in yields or the dependence of random variables in crop revenue insurance, margin insurance, and whole-farm insurance (Vedenov and Power, 2008; Zhu et al., 2008; Bozic et al., 2014; Bulut and J. Collins, 2014; Ahmed and Serra, 2015; Goodwin and Hungerford, 2015; Feng and Hayes, 2016).
Let
where
where
The copula function’s fundamental properties are symmetry and tail dependency (Li and Genton, 2013). Insurance company and financial experts are often interested in the tail characteristic, since they represent the degree to which a portfolio’s losses occur in the worst-case scenario (Nelsen, 1999). Tail dependency is an asymptotic concept, and an asymmetric copula function distribution might have either lower or upper dependence, depending on the empirical phenomenon being described. The coefficient of upper-tail dependence is defined as follows:
While the lower-tail dependence coefficient is defined as:
Copulas exhibit tail dependence if the respective coefficients in Eqs 6, 7 are nonzero, and when the tail dependence coefficient is close to 1, large values of the variables occur together.
The copula family chosen is inherently a decision of theoretical tail dependence. The parametric estimating procedure in an empirical investigation involves an a priori assumption about the data sets’ relationship. The five most often used parametric copulas (Gaussian, t, Gumbel, Clayton, and Frank) and their various rotations may capture a wide range of bivariate dependent behavior. However, for aggregate losses of coverage yields greater than two counties, the archimedean copula (Gumbel, Clayton, and Frank) cannot accurately simulate multivariate dependence due to its single parameter. In addition to elliptical copulas, the vine and hierarchical copulas can also capture multivariate dependence.
By combining pair-wise copulas, the vine copula enables much more flexibility in multivariate modeling (Bedford and Cooke, 2002; Kurowicka and Cooke, 2006). According to Aas et al. (2009), the factored form of a joint multivariate density function for a set of k random variables is:
This density is unique for a given ordering of variables. The joint density can also be expressed in terms of a copula function, as:
Joe (1996) shown that each term in Eq. 9 may be decomposed into the product of a pair-wise copula and a conditional marginal density:
Aas et al. (2009) described how to represent a multivariate density as a product of pair-wise copulas. The vine copula functions are best described as a set of “trees,” with each variable’s distribution represented by conditional distributions at a higher tree level. Bedford and Cooke (2002) presented a “regular vine” representation that enables considerable flexibility in representing multivariate densities in terms of pair-wise copula combinations. Kurowicka and Cooke (2006) identified two distinct types of vine copulas, dubbed the “C-vine” and the “D-vine.” When variables have a particular ordering, a D-vine is appropriate, whereas a C-vine is good when variables may be arranged according to their effect on other variables (Aas et al., 2009).
Following Goodwin and Hungerford (2015), we establish county-level yield dependence models using elliptical copulas (Gaussian, t) and vine copulas. To begin, we estimated the corresponding Gaussian and t-copula from detrended county-level crop yield data using the empirical marginal distribution approach. Goodwin and Hungerford (2015) point out that this approach results in less variability than estimation methods based on parametric marginal distributions. We need to estimate three separate coefficients for the Gaussian and t-copula dependence models since each state has three random variables representing county-level yield. Additionally, the t-copula must estimate the degree of freedom parameter, which converges gradually to the Gaussian copula as the degree of freedom grows (the typical cut-off degree of freedom is 30).
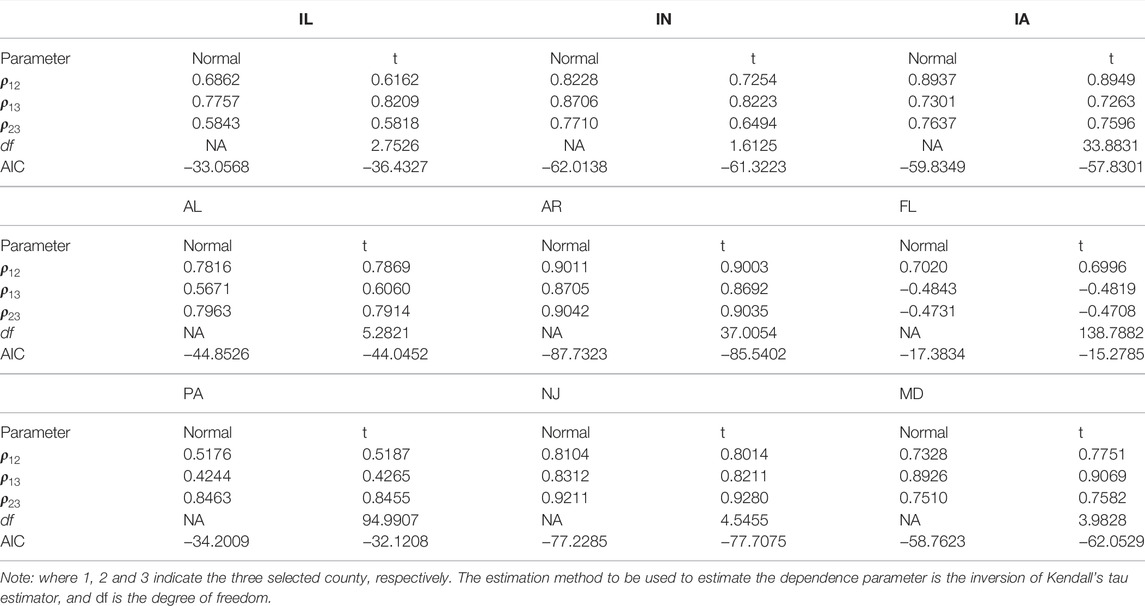
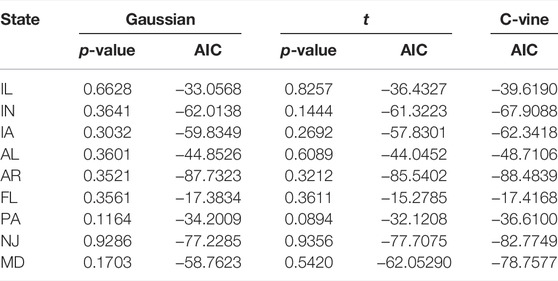
The Gaussian and t-copula maximum likelihood estimation results for the yield data sets are reported in Table 3. The first conclusion is that in nine states, the dependencies between county-level yields are all-powerful, and the data sets from IL, IN in Group 1, AL in Group 2, NJ, MD in Group 3 exhibit rather substantial tail dependence. However, the fitted t-copula has a degree of freedom of more than 30 for several states, such as IA in Group 1, AR and FL in Group 2, PA in Group 3, indicating that the tail dependence of these data sets is minor, with essentially no difference from Gaussian copula. Moreover, the county-level yields negatively depend on each other for FL in Group 3. As a result, we cannot determine which copula between Gaussian and t is superior based on the AIC values of Gaussian and t-copulas since the better-fitting copula varies between data sets.
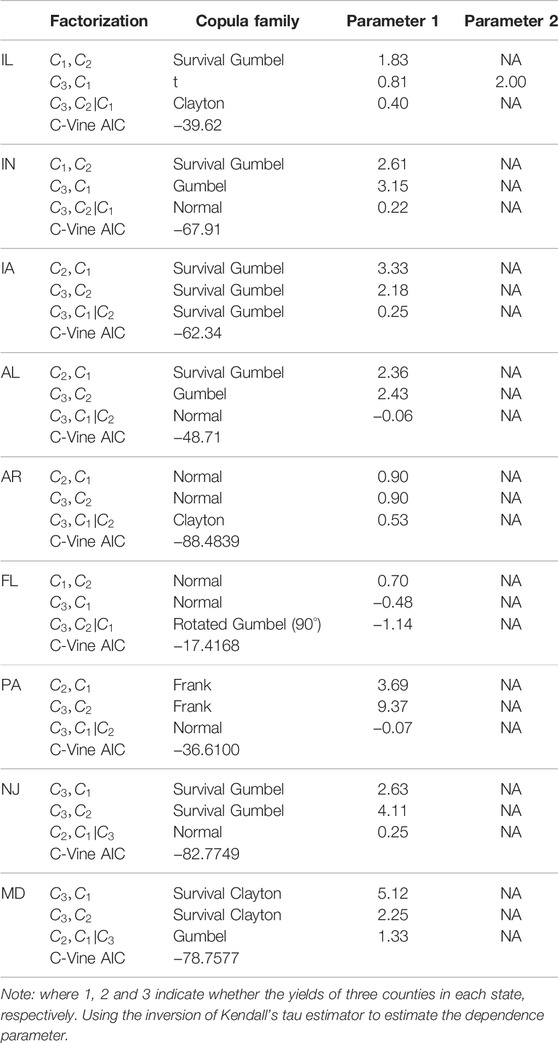
We then estimate the R-vine copulas using a sequential maximum likelihood procedure. Vine copulas are formed of Gaussian, t, Clayton, Gumbel, and Frank copula and their rotating type. Maximum spanning trees are used to pick R-vine trees with respect to certain edge weights. The appropriate pair-wise copula families are selected according to the Akaike Information Criteria (using maximum likelihood estimation) and estimated sequentially (forward selection of trees). The estimation results and AIC value statistics are presented in Table 4, and when compared to other vine copula forms (R-vine and D-vine), this approach selects the C-vine copula as the dependence structure for all data sets.
Additionally, we perform a Goodness-of-fit (GOF) test on the fitted results of each portfolio’s various copula functions, and the results are provided in Table 5. The p-values of the GOF test for the fitted copula function are more than 0.05 for all analyzed risk portfolios, indicating that the Gaussian and t-copula assumptions are not rejected. Table 4 also compares the AIC values of several copula forms, and we see that the C-vine copula’s AIC values are much fewer than those of the Gaussian and t-copula for each portfolio, indicating that the C-vine copula is favored over the Gaussian and t-copula.
Then, we need to fit the yield marginal distribution to simulate crop yield losses based on the determined copula-based model. Compared to using a non-parametric marginal distribution to fit the yield distribution, we choose a parametric marginal distribution since it can give an explicit explanation. We estimate the parametric distribution individually for each county yield and then combine it with the copula-based copula model to generate random variables. Numerous parametric distributions have been used to model yield distributions in crop insurance, and we fit the yield using a two-component mixture normal and a Weibull. The distribution hypothesis test and AIC values for the county yield data sets are provided in Table 6. As predicted, the Weibull and mixture normal distribution hypotheses are both accepted.
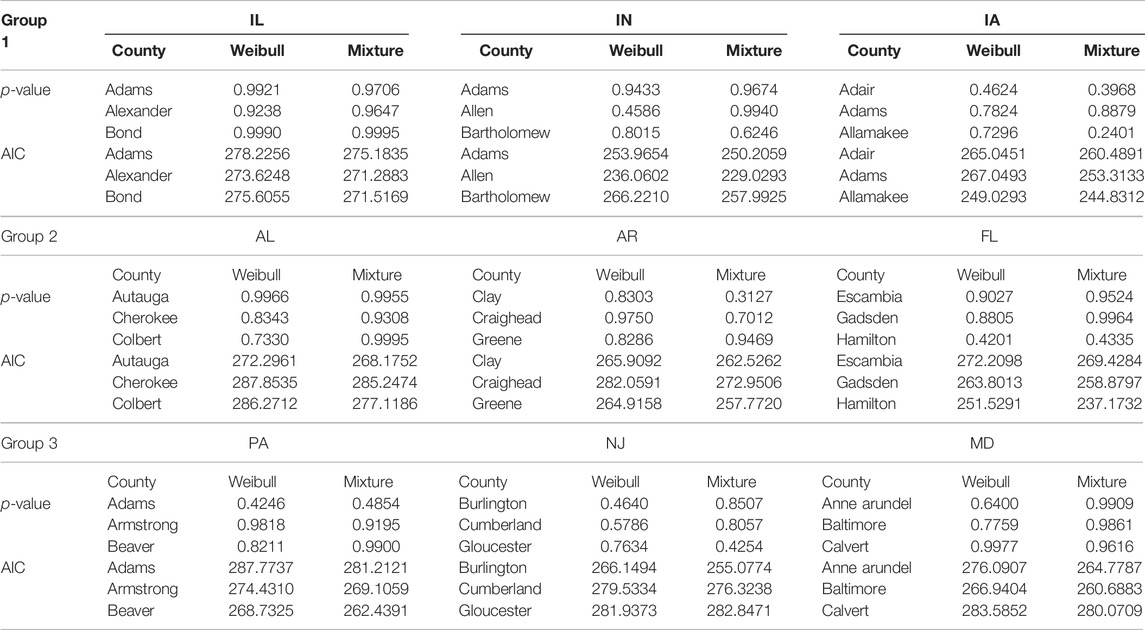
TABLE 6. Results of Kolmogorov-Smirnov test (at 5% significance level) and the AIC value of the goodness-of-fit test.
After all, the aggregate losses are fitted based on the estimated copula function and marginal distribution using the approaches outlined above. We emphasize the likelihood of significant indemnity resulting from systemic risk in county-level risk portfolios. Notably, we do not adjust the portfolio for variations in exposure (i.e., various amounts of acreage) between counties and hence assume that all counties have the same level of corn acreage, then we can adjust the total losses by aggregating the average county-level yield losses per acre for each portfolio. Additional loading factors that account for administrative costs are disregarded.
3.3 The Efficacy Tests of Copula-Based Models
The AIC criteria and p-value can only be used to determine the fitted copula’s goodness-of-fit (Goodwin and Hungerford, 2015). To assess the efficacy of the copula-based model on the accuracy of losses assessment and insurance pricing, we design a simulation experiment using the Mean Squared Error (MSE), which quantifies the difference between the copula-based model’s estimated losses and the “true” losses as defined by Harri et al. (2011). Ker et al. (2016), Yvette Zhang (2017). and Yi et al. (2020) have all employed the MSE measure in the context of agricultural commodity hedging.
We use nonparametric kernel techniques to estimate county-level yield density functions for each portfolio in the 9 states, highlighting that these densities account for county-level yield dependence. Then, assuming that these densities accurately represent the “true” density function, we can generate dependent data samples from these densities. To create data sets based on these “true” densities, an aggregate of 500 samples of sizes n = 30 and n = 50 is drawn from the “true” distributions for each county-level data set. The mean squared error (MSE) in calculating aggregate losses compared to “true” aggregate losses is used to evaluate the effectiveness of pricing. Premiums are derived for each sample using a Monte Carlo approach based on the individual model with the non-dependence assumption and an estimated copula-based model (Gaussian, t, and C-vine copula). The Weibull and mixture normal distributions obtained in Section 3 are used to fit the yield distributions of the individual and copula-based models. The following equation is used to obtain their appropriate MSE:
Where π is the “true” losses, and
4 Empirical Results and Discussion
Using the procedure outlined in Section 3, we collect yield data sets from three counties in each selected states for three groups. We estimate SRA policy losses using the random numbers generated by each fitted model. Then we examine if the tail dependency of yield risks affects the aggregate indemnity of crop insurance, such as joint losses due to severe weather occurrences. The asymmetric lower-tail dependency is described by the Rotated Gumbel (180°) and Clayton copulas, which are used to define pair copulas in vine copula. Additionally, t-copula exhibits symmetric tail dependency, while the Gaussian copula does not4.
The MSE of the aggregate losses between the “true” and the fitted losses (based on the copula and the individual model) is calculated, emphasizing comparing the differences between models with and without dependence. The losses distributions are calculated using 10,000 random samples generated from the estimated losses model. Notably, we use the Weibull and mixture normal as the marginal distributions, and the copula model’s dependence structure varies for each state’s yield data sets. The following are the findings of this experiment:
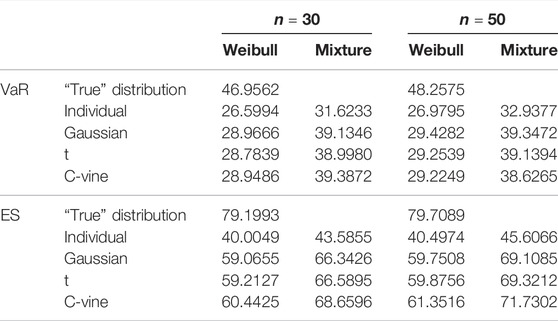
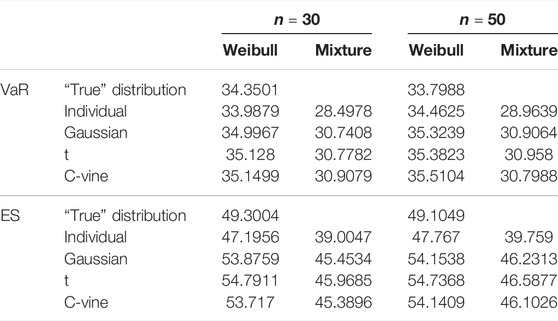
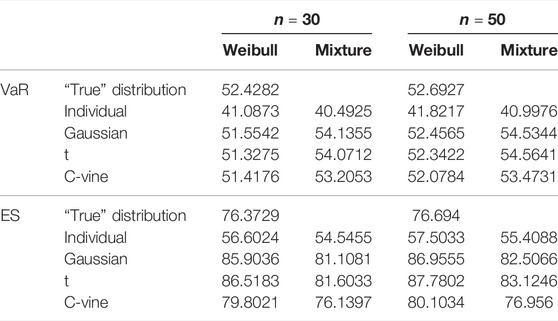
The mean value of aggregate yield losses is not sensitive to the individual or copula-based model in various risk regions and sample sizes, as shown in Tables 7–9. We can determine that the copula-based approach has a negligible effect on the unbiased estimator of aggregate losses accuracy through stochastic simulations. The aggregate losses density distribution plots for the states in Figures 2–4 help to explain this conclusion. As seen in Figures 2–4, the copula-based or individual model may be the most well-fitting model at different losses layers. Due to the fact that the fair premium for crop insurance is determined on the expectation of losses, there is no statistically significant difference between the copula-based and individual models.
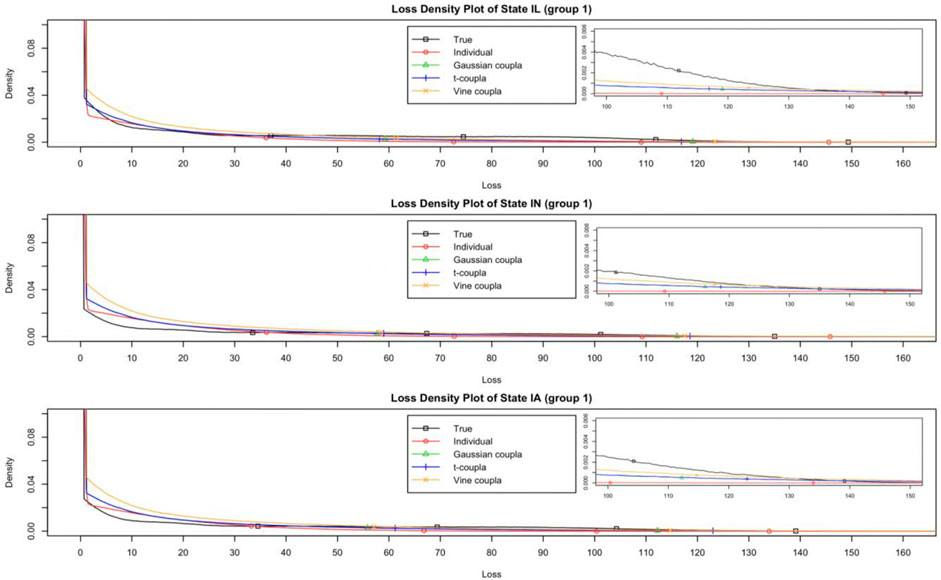
FIGURE 2. The losses density plot for states in Group 1 (Weibull distribution with a duration of 30 years).
Nonetheless, as shown in Tables 10–12, all copula-based models estimated higher VaR and ES values than the individual model. In Groups 1 and 3, the copula-based model’s VaR and ES values are much greater than those of the individual model. VaR is used to measure tail risk by determining the maximum possible losses value for a given probability, and ES takes the average of all the possible losses greater than the VaR value. By comparing the VaR and ES values of “true” distribution, we may infer that the copula-based model is the better-fitting model for VaR and ES values than the individual model in Groups 1 and 3. On the other hand, there is no discernible difference in VaR and ES values between the individual model and the copula-based model in Group 2, which may be due to no obvious tail dependence between the county-level yields in Group 2. It also can be explained in Figure 3 that the individual model is the most well-fitting model around the tail of the losses for Group 2.
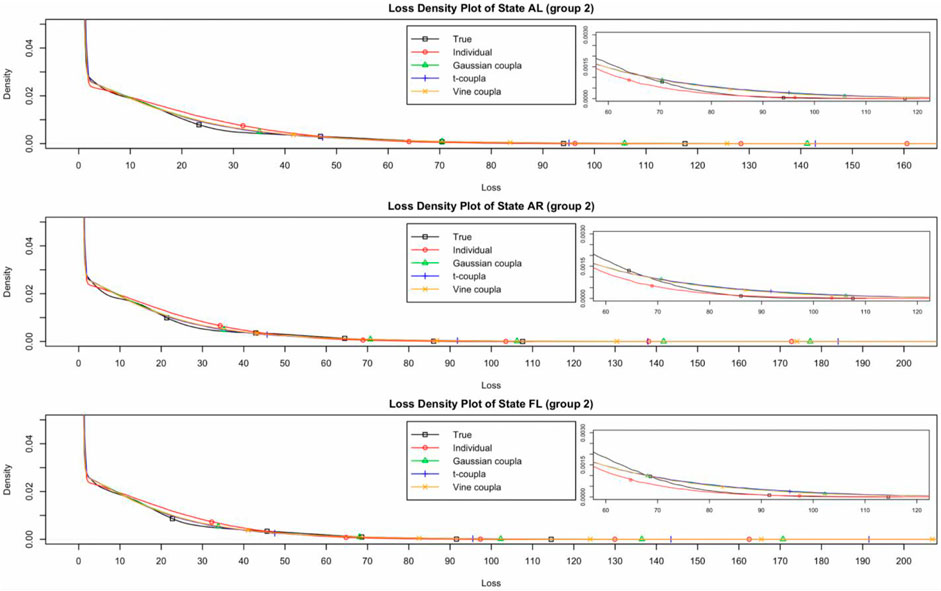
FIGURE 3. The losses density plot for states in Group 2 (Weibull distribution with a duration of 30 years).
Second, consider the payment situations for various layers. The findings in Tables 13–15 demonstrate that the individual model’s losses MSE is greater than the copula-based model at various levels for all three groups, except for the MSE estimated by using Weibull distribution for the layer of the losses ratio 2.20–5.00 in Group 2. The MSE results reveal that in Groups 1 and 3, the copula-based model may significantly reduce the MSE of losses compared to the individual model, indicating that dependence strongly influences this layer’s payment. In Group 2, however, there is no substantial reduction in the MSE of losses between the copula-based model and the individual model since there is no evident tail dependence between the county-level yields (as shown in Table 4). Thus, when considerable yield reliance exists in the risk portfolio, the copula-based model beats the individual model for calculating SRA payments.
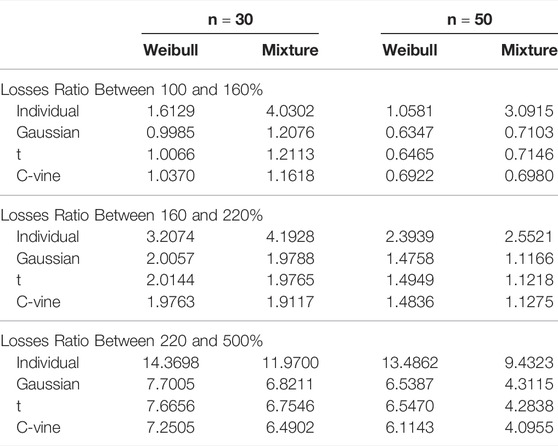
TABLE 13. The average Mean Squared Error of aggregate losses at different layers for states in Group1.
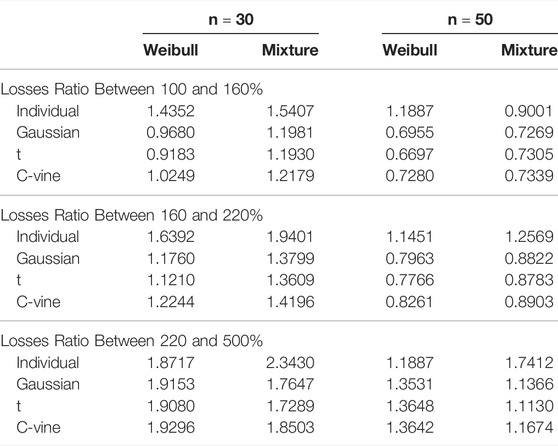
TABLE 14. The average Mean Squared Error of aggregate losses at different layers for states in Group 2.
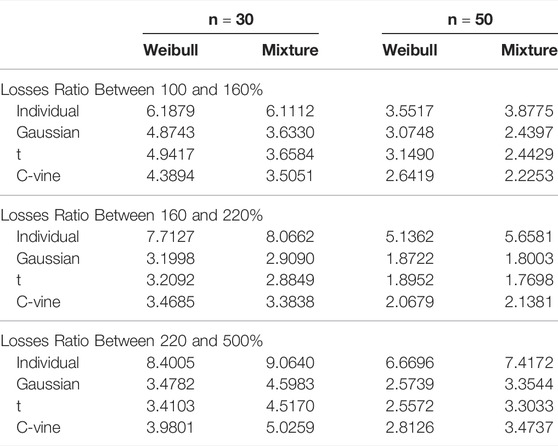
TABLE 15. The average Mean Squared Error of aggregate losses at different layers for states in Group 3.
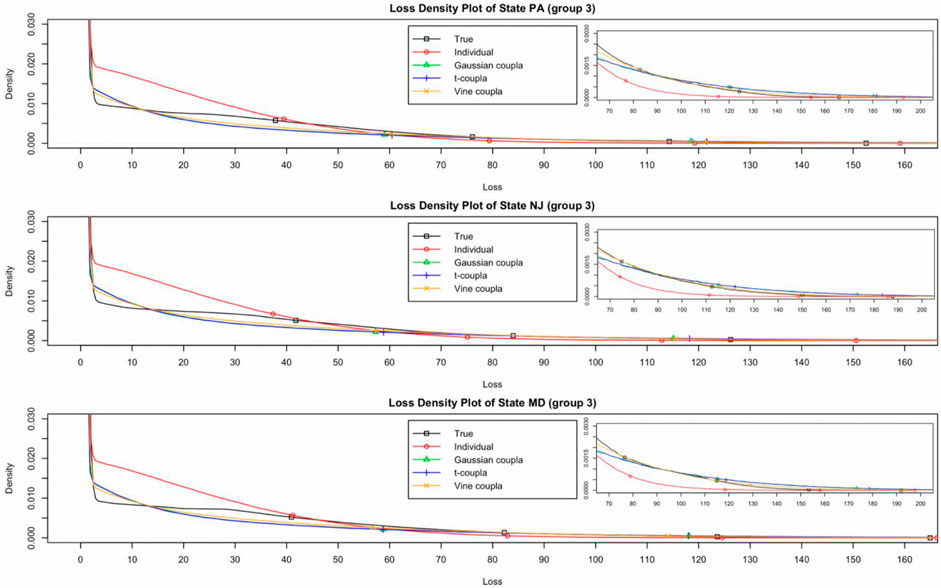
FIGURE 4. The losses density plot for states in Group 3 (Weibull distribution with a duration of 30 years).
Additionally, the losses estimations vary across by using the various copula models. For example, in Table 13, the measured losses MSE of data sets with a duration of 30 years and Weibull distribution based on the Gaussian, t, and C-vine copula models for the layer of the losses ratio 2.20–5.00 are 7.7005, 7.6656, and 7.2505, respectively. The above findings demonstrate that the accuracy of the losses estimation for the layer of the losses ratio 2.20–5.00 changes based on the using of various alternative copula structures, and the C-vine copula surpasses the Gaussian and t-copula in Group 1, and the reason may be that the IL, IN and IA states’ dependence structure has the lower-tail characteristic (survival Gumbel has the upper-tail properties). In comparison, in Table 14, the measured losses MSE with a 30-year duration and Weibull distribution based on Gaussian, t, and C-vine copula models for the layer of 2.20–5.00 is 3.4782, 3.4103, and 3.9801, respectively. While the losses MSE for the layer of 1.00–1.60 is 4.8743, 4.9417, and 4.3894, respectively. Thus, adopting the C-vine copula model would result in a more accurate losses measurement at the layer of the losses ratio between 1.00 and 1.60, and the reason may be that the MD state’s dependence structure has the upper-tail characteristic (survival Clayton has the upper-tail properties). From the empirical results of those two groups, we may conclude that if the portfolio contains a substantial tail risk, the C-vine copula model, which provides a more flexible description of yield dependence, is better suited to measure this layer of losses.
Finally, since systemic risks associated with weather will result in concurrent agricultural production losses throughout a large geographic area, for example, the 1988 and 2012 droughts and the 1993 floods in the central and western areas all resulted in widespread crop yield losses. During times of significant yield losses caused by natural catastrophes, there may be greater interdependence between yields in different locations. A generally concerning scenario is that Gaussian copula has a tail reliance of zero, which cannot reflect the tail dependence of risk portfolios as t and vine copula. Nonetheless, the findings of this paper may lead to an intriguing conclusion. According to the above empirical results for Groups 1, 2, and 3, the C-vine copula model can provide a more accurate measurement of losses for layers with tail risk. In addition, the simulation results based on the Gaussian copula model may not differ significantly from those based on the C-vine copula and t-copula mole for the layers that lack strong tail dependence between counties.
5 Conclusion
The data sets of crop yield in the neighborhood county are affected by systemic risks. Accurate modeling of these systemic risks is essential for determining reliable premium rates of the publicly-subsidized federal crop insurance program. This article detects whether the copula-based models significantly affect losses assessment and insurance pricing. Specifically, we apply the different copula-based models to the losses evaluation of crop insurance. The copulas consider the dependence of yields for adjacent counties—especially the upper and lower tails of the distribution.
To put this into perspective, the unbiased estimation of claims under systemic risk measured by individual and copula-based methods does not significantly differ. Nevertheless, for the different layers of SRA policy, the measuring of dependence significantly impacts aggregate claims. Given the massive scale of the federal crop insurance program, the copula-based model will significantly impact crop reinsurance contracts’ pricing, feasibility, and profitability for the insurers, the government, and taxpayers. The vine copula provides a more flexible property in the aggregate losses estimation process in the regions with obviously estimated tail dependence.
Data Availability Statement
All data used in this study are publicly available. The processed data needed to reproduce this study are available at USDA’s datasets (https://www.usda.gov/).
Author Contributions
YS conceived and designed the study, provided the idea, performed the data analysis, analyzed the results, and wrote the manuscript. KW discussed the idea with YS, and helped design the study and check the results.
Conflict of Interest
KW was employed by the company China Agriculture Reinsurance Corporation.
The remaining author declares that the research was conducted in the absence of any commercial or financial relationships that could be construed as a potential conflict of interest.
Publisher’s Note
All claims expressed in this article are solely those of the authors and do not necessarily represent those of their affiliated organizations, or those of the publisher, the editors and the reviewers. Any product that may be evaluated in this article, or claim that may be made by its manufacturer, is not guaranteed or endorsed by the publisher.
Footnotes
1“State Group 1” means Illinois, Indiana, Iowa, Minnesota, and Nebraska. “State Group 2” means Alabama, Arizona, Arkansas, California, Colorado, Florida, Georgia, Idaho, Kansas, Kentucky, Louisiana, Michigan, Missouri, Mississippi, Montana, North Carolina, North Dakota, New Mexico, Ohio, Oklahoma, Oregon, South Carolina, South Dakota, Tennessee, Texas, Virginia, Washington, and Wisconsin. “State Group 3” means Alaska, Connecticut, Delaware, Hawaii, Maine, Massachusetts, Maryland, Nevada, New Hampshire, New Jersey, New York, Pennsylvania, Rhode Island, Utah, Vermont, West Virginia, and Wyoming.
2The losses ratio that determines the AIP percent share of the underwriting results is based on their entire state book of insurance, i.e. it is the combined losses ratio for all crops and all contracts for the state.
3CV is the Coefficient of Variance.
4In the later application we take the following copula families into consideration (some properties are given in brackets): Gaussian (tail-symmetric, no tail dependence). Student-t (tail-symmetric, tail dependence). Gumbel (tail-asymmetric, upper tail dependence) and survival Gumbel (tail-asymmetric, lower tail dependence). Rotated Gumbel by 90°and 270° (tail-asymmetric, no tail dependence). Frank (tail-symmetric, no tail dependence). Clayton (tail-asymmetric, lower tail dependence).
References
Aas, K., Czado, C., Frigessi, A., and Bakken, H. (2009). Pair-copula Constructions of Multiple Dependence. Insur. Math. Econ. 44 (2), 182–198. doi:10.1016/j.insmatheco.2007.02.001
Ahmed, O., and Serra, T. (2015). Economic Analysis of the Introduction of Agricultural Revenue Insurance Contracts in Spain Using Statistical Copulas. Agric. Econ. 46 (1), 69–79. doi:10.1111/agec.12141
Atwood, J., Shaik, S., and Watts, M. (2003). Are Crop Yields Normally Distributed? A Reexamination. Am. J. Agric. Econ. 85 (4), 888–901. doi:10.1111/1467-8276.00495
Bedford, T. J., and Cooke, R. M. (2002). Vines—A New Graphical Model for Dependent Random Variables. Ann. Statistics 30 (4), 1031–1068. doi:10.1214/aos/1031689016
Bulut, H., and J. Collins, K. (2014). Designing Farm Supplemental Revenue Coverage Options on Top of Crop Insurance Coverage. Agric. Finance Rev. 74 (3), 397–426. doi:10.1108/afr-08-2013-0032
Cherubini, U., Luciano, E., and Vecchiato, W. (2004). Copula Methods in Finance. England: John Wiley & Sons.
Coble, K. H., Hanson, T., Miller, J. C., and Shaik, S. (2003). Agricultural Insurance as an Environmental Policy Tool. J. Agric. Appl. Econ. 35 (02), 391–405. doi:10.1017/s1074070800021350
Coble, K. H., Knight, T. O., Goodwin, B. K., Miller, M. F., and Rejesus, R. M. (2010). A Comprehensive Review of the RMA APH and COMBO Rating Methodology: Final Report. Washington, DC: Report prepared for the USDA Risk Management Agency by Sumaria Systems, Inc., U.S. Department of Agriculture, Risk Management Agency.
Embrechts, P., McNeil, A. J., and Straumann, D. (1999). Correlation: Pitfalls and Alternatives. Risk 12, 69–71. doi:10.1017/CBO9780511615337.008
Feng, X., and Hayes, D. (2016). Diversifying Systemic Risk in Agriculture. Afr 76 (4), 512–531. doi:10.1108/afr-06-2016-0061
Finger, R. (2010). Revisiting the Evaluation of Robust Regression Techniques for Crop Yield Data Detrending. Am. J. Agric. Econ. 92, 205–211. doi:10.1093/ajae/aap021
Goodwin, B. K., and Hungerford, A. (2015). Copula-Based Models of Systemic Risk in U.S. Agriculture: Implications for Crop Insurance and Reinsurance Contracts. Am. J. Agric. Econ. 97 (3), 879–896. doi:10.1093/ajae/aau086
Goodwin, B. K., and Ker, A. P. (1998). Nonparametric Estimation of Crop Yield Distributions: Implications for Rating Group-Risk Crop Insurance Contracts. Am. J. Agric. Econ. 80 (1), 139–153. doi:10.2307/3180276
Goodwin, B. K. (2001). Problems with Market Insurance in Agriculture. Am. J. Agric. Econ. 83 (3), 643–649. doi:10.1111/0002-9092.00184
Goodwin, B. K., Roberts, M. C., and Coble, K. H. (2000). Measurement of Price Risk in Revenue Insurance: Implications of Distributional Assumptions. J. Agric. Resour. Econ. 25 (1), 195–214. doi:10.22004/ag.econ.30830
Goodwin, B. K., and Smith, V. H. (2013). What Harm Is Done by Subsidizing Crop Insurance? Am. J. Agric. Econ. 95 (2), 489–497. doi:10.1093/ajae/aas092
Goodwin, B. K., and Vado, L. (2007). Public Responses to Agricultural Disasters: Rethinking the Role of Government. Can. J. Agric. Econ. 55 (4), 399–417. doi:10.1111/j.1744-7976.2007.00099.x
Harri, A., Coble, K. H., Ker, A. P., and Goodwin, B. J. (2011). Relaxing Heteroscedasticity Assumptions in Area‐Yield Crop Insurance Rating. Am. J. Agric. Econ. 93 (3), 707–717. doi:10.1093/ajae/aar009
Huber, P. J. (1973). Robust Regression: Asymptotics, Conjectures and Monte Carlo. Ann. Statistics 1, 799–821. doi:10.1214/aos/1176342503
Ker, A. P., Tolhurst, T. N., and Liu, Y. (2016). Bayesian Estimation of Possibly Similar Yield Densities: Implications for Rating Crop Insurance Contracts. Am. J. Agric. Econ. 98, 360–382. doi:10.1093/ajae/aav065
Kurowicka, D., and Cooke, R. (2006). Uncertainty Analysis with High Dimensional Dependence Modelling. Chichester: Wiley.
Li, B., and Genton, M. G. (2013). Nonparametric Identification of Copula Structures. J. Am. Stat. Assoc. 108 (502), 666–675. doi:10.1080/01621459.2013.787083
Miranda, M. J., and Glauber, J. W. (1997). Systemic Risk, Reinsurance, and the Failure of Crop Insurance Markets. Am. J. Agric. Econ. 79, 206–215. doi:10.2307/1243954
Nelson, C. H., and Preckel, P. V. (1989). The Conditional Beta Distribution as a Stochastic Production Function. Am. J. Agric. Econ. 71 (2), 370–378. doi:10.2307/1241595
Okhrin, O., Odening, M., and Xu, W. (2012). Systemic Weather Risk and Crop Insurance: The Case of China. J. Risk Insur. 80 (2), 351–372. doi:10.1111/j.1539-6975.2012.01476.x
Ramsey, A. F., and Goodwin, B. K. (2019). Value-at-Risk and Models of Dependence in the U.S. Federal Crop Insurance Program. J. Risk Financial Manag. 12 (2), 1–21. doi:10.3390/jrfm12020065
Ramsey, A. F., Goodwin, B. K., and Ghosh, S. (2019). How High the Hedge: Relationships between Prices and Yields in the Federal Crop Insurance Program. J. Agric. Resour. Econ. 44 (2), 227–245. doi:10.22004/ag.econ.287967
Sherrick, B. J., Zanini, F. C., Schnitkey, G. D., and Irwin, S. H. (2004). Crop Insurance Valuation under Alternative Yield Distributions. Am. J. Agric. Econ. 86 (2), 406–419. doi:10.1111/j.0092-5853.2004.00587.x
Sklar, A. (1959). Fonctions de re ́partition a` n dimensions et leurs marges, 8. Paris: Publications de l’Institut de Statistique de l'Université de Paris, 229–231.
Smith, V. H., and Goodwin, B. K. (1996). Crop Insurance, Moral Hazard, and Agricultural Chemical Use. Am. J. Agric. Econ. 78 (2), 428–438. doi:10.2307/1243714
Smith, V. (2011). “Premium Payments: Why Crop Insurance Costs Too Much,” in American Boondoggle—Fixing the 2012 Farm Bill (Washington, DC: American Enterprise Institute).
Tolhurst, T. N., and Ker, A. P. (2015). On Technological Change in Crop Yields. Am. J. Agric. Econ. 97 (1), 137–158. doi:10.1093/ajae/aau082
Vedenov, D. V., and Power, G. J. (2008). Risk-Reducing Effectiveness of Revenue versus Yield Insurance in the Presence of Government Payments. J. Agric. Appl. Econ. 40 (2), 443–459. doi:10.1017/s1074070800023737
Wang, H., and Zhang, H. (2003). On the Possibility of a Private Crop Insurance Market: A Spatial Statistics Approach. J Risk Insur. 70, 111–124. doi:10.1111/1539-6975.00051
Woodard, J. D., and Sherrick, B. J. (2011). Estimation of Mixture Models Using Cross‐Validation Optimization: Implications for Crop Yield Distribution Modeling. Am. J. Agric. Econ. 93 (4), 968–982. doi:10.1093/ajae/aar034
Xu, W., Filler, G., Odening, M., and Okhrin, O. (2010). On the Systemic Nature of Weather Risk. Agric. Finance Rev. 70 (2), 267–284. doi:10.1108/00021461011065283
Yi, F., Zhou, M., and Zhang, Y. Y. (2020). Value of Incorporating ENSO Forecast in Crop Insurance Programs. Am. J. Agric. Econ. 102, 439–457. doi:10.1002/ajae.12034
Yvette Zhang, Y. (2017). A Density-Ratio Model of Crop Yield Distributions. Am. J. Agric. Econ. 99, 1327–1343. doi:10.1093/ajae/aax021
Keywords: copula function, crop insurance, reinsurance, actuarial fair pricing, effective analysis
Citation: Sun Y and Wang K (2022) The Implication of Copula-Based Models for Crop Insurance and Reinsurance Under Systemic Risk. Front. Environ. Sci. 10:916494. doi: 10.3389/fenvs.2022.916494
Received: 09 April 2022; Accepted: 22 June 2022;
Published: 18 July 2022.
Edited by:
Benjamin Lamptey, University of Leeds, United KingdomReviewed by:
Yahua Xu, Central University of Finance and Economics, ChinaCocou Amegnaglo, National University of Agriculture, Benin
Copyright © 2022 Sun and Wang. This is an open-access article distributed under the terms of the Creative Commons Attribution License (CC BY). The use, distribution or reproduction in other forums is permitted, provided the original author(s) and the copyright owner(s) are credited and that the original publication in this journal is cited, in accordance with accepted academic practice. No use, distribution or reproduction is permitted which does not comply with these terms.
*Correspondence: Yan Sun, a2tmbGxAc2luYS5jb20=
 Yan Sun
 Ke Wang2