 Daniel Puppe
 Martin Leue
 Michael Sommer
 Jörg Schaller
 Danuta Kaczorek
- 1Leibniz Centre for Agricultural Landscape Research (ZALF), Müncheberg, Germany
- 2University of Potsdam, Institute of Environmental Science and Geography, Potsdam, Germany
- 3Warsaw University of Life Sciences (SGGW), Department of Soil Science, Warsaw, Poland
The detection of auto-fluorescence in phytogenic, hydrated amorphous silica depositions (phytoliths) has been found to be a promising approach to verify if phytoliths were burnt or not, especially in archaeological contexts. However, it is unknown so far at what temperature and how auto-fluorescence is induced in phytoliths. We used fluorescence microscopy, scanning electron microscope-energy dispersive X-ray spectroscopy (SEM-EDX), and Fourier transform infrared spectroscopy to analyze auto-fluorescence in modern phytoliths extracted from plant samples or in intact leaves of winter wheat. Leaves and extracted phytoliths were heated at different temperatures up to 600°C. The aims of our experiments were i) to find out what temperature is needed to induce auto-fluorescence in phytoliths, ii) to detect temperature-dependent changes in the molecular structure of phytoliths related to auto-fluorescence, and iii) to derive a mechanistic understanding of auto-fluorescence in phytoliths. We found organic compounds associated with phytoliths to cause auto-fluorescence in phytoliths treated at temperatures below approx. 400°C. In phytoliths treated at higher temperatures, i.e., 450 and 600°C, phytolith auto-fluorescence was mainly caused by molecular changes of phytolith silica. Based on our results we propose that auto-fluorescence in phytoliths is caused by clusterization-triggered emissions, which are caused by overlapping electron clouds forming non-conventional chromophores. In phytoliths heated at temperatures above about 400°C dihydroxylation and the formation of siloxanes result in oxygen clusters that serve as non-conventional chromophores in fluorescence events. Furthermore, SEM-EDX analyses revealed that extractable phytoliths were dominated by lumen phytoliths (62%) compared to cell wall phytoliths (38%). Our findings might be not only relevant in archaeological phytolith-based examinations, but also for studies on the temperature-dependent release of silicon from phytoliths and the potential of long-term carbon sequestration in phytoliths.
Introduction
Although silicon (Si) is considered as not essential for higher plants with the exception of members of the family Equisetaceae, Si uptake by plants has been found to enhance plants’ resistance against various forms of stress (e.g., drought, fungal infections) with benefits for ecosystem functioning and services (recently reviewed by, e.g., Katz et al., 2021; Meunier et al., 2022). Against this background, the International Plant Nutrition Institute (IPNI) categorized Si as a ‘beneficial substance’ for plants (www.ipni.net). The incorporation of Si into plants (biosilicification) is controlled by the Si bio-availability in soils (mainly in the form of monomeric silicic acid, H4SiO4) and the amount of H4SiO4 a specific plant is able to absorb. Si bio-availability in soils is driven by manifold environmental factors like the Si concentration in soil solution, the amount of amorphous silica in the soil, and the Si adsorption capacity or retention capability of the soil (Haynes, 2014; Haynes, 2019; Schaller et al., 2021). The Si uptake of plants seems to be strongly connected to their phylogenetic position (Hodson et al., 2005), whereby Si concentrations in plant materials were used to categorize plants as Si accumulators (Si conc. >1%), intermediate Si accumulators (Si conc. 0.5–1%), or Si excluders (Si conc. <0.5%) (Ma and Takahashi, 2002). Vegetation composition thus is a main driver of Si uptake and storage in different ecosystems. Furthermore, Si uptake and storage by single plants of a plant species have been found to be controlled by plant biomass, which in turn is strongly affected by soil properties (Wehrhan et al., 2021).
Si depositions in plants are called phytoliths, which are mainly made of hydrated amorphous silica (SiO2⋅nH2O), but can also contain organic matter and various elements like aluminum, calcium, iron, manganese, phosphorus, and potassium (Buján, 2013; Kameník et al., 2013; Wu et al., 2014). Phytoliths can be found almost everywhere in plants and are suitable for the taxonomic identification as they often show a specific morphology (Neumann et al., 2019). Some phytoliths are quite stable and can be abundantly found in various soils, where they can persist for decades, centuries, or even millennia making them well-suited for archaeological (paleo)-botanical, and (paleo)-ecological studies (Sangster et al., 2001; Piperno, 2006; Hodson, 2016). However, next to these durable phytoliths, less stable forms of plant silica deposited in intercellular spaces or in an extracellular (cuticular) layer are present in plants. Although these phytogenic silica forms are less well-preserved in soils compared to durable phytoliths, they are also important for Si cycling by plants. In fact, these fragile silica structures might represent the biggest and most reactive pool of phytogenic silica in plants and soils, and thus might be the most important driver of Si bio-availability in terrestrial biogeosystems (Puppe et al., 2017).
Dissolution kinetics of phytoliths, and thus Si release from phytoliths, is not only controlled by their physicochemical properties like surface charge, specific surface area, and molecular structure (Bartoli, 1985; Fraysse et al., 2009), but also by environmental properties like soil pH, temperature, and soil buffering capacity (Schaller et al., 2021). Phytolith properties alter in soils while phytoliths age (Puppe and Leue, 2018), but alterations of physicochemical properties can also be induced by the heating or exposure of phytoliths to strong alkaline solutions. Regarding agriculture the application of biochar (i.e., burnt phytolith-rich plant biomass) has been found a well-suited method to enhance Si bio-availability for crops, especially in desilicated soils (Li and Delvaux, 2019).
Soukup et al. (2014) and Dabney et al. (2016) reported that phytoliths showed auto-fluorescence after the exposure to an alkaline solution (pH of 12) or heating (320°C), respectively. Devos et al. (2021) evaluated the potential of auto-fluorescent phytoliths as a proxy for heat and fire in archaeological contexts. These authors were able to discriminate between heated/burned and unheated/unburned phytoliths in soil thin sections of modern and archaeological contexts using fluorescence microscopy. However, the underlying mechanisms that induce auto-fluorescence in phytoliths remain speculative. In this context, i) changes in the chemical/molecular phytolith structure and/or ii) changes in the organic compounds within or on the surface of phytoliths might responsible for the auto-fluorescence of phytoliths (Devos et al., 2021).
In our study we combined microscopic and spectroscopic analyses, i.e., fluorescence microscopy, Fourier transform infrared (FTIR) spectroscopy, and scanning electron microscope—energy dispersive X-ray spectroscopy (SEM-EDX), to observe auto-fluorescence in modern phytoliths extracted from plant samples or in situ (i.e., in intact leaves of winter wheat). While FTIR spectroscopy represents a well-suited method for the quantification of biogenic amorphous silica as well as the detection of qualitative differences between fresh and aged biogenic amorphous silica (Loucaides et al., 2010; Liu et al., 2013; Puppe and Leue, 2018), SEM-EDX has been used for detailed analyses of phytoliths in soils and plants (Sommer et al., 2013; Kaczorek et al., 2019; Schaller et al., 2022). The aim of our experiments was to derive a mechanistic understanding of auto-fluorescence in phytoliths by answering the following questions: i) What temperature is needed to induce auto-fluorescence in phytoliths? and ii) Which temperature-dependent changes in the molecular structure of phytoliths are related to phytolith auto-fluorescence? The resulting knowledge will not only be crucial for archaeological phytolith-based examinations, but also for studies on the temperature-dependent release of Si from phytoliths.
Materials and Methods
Winter Wheat
Winter wheat (Triticum aestivum, cultivar JB Asano) samples were taken from an ongoing long-term field experiment in NE Germany. A comprehensive site description and details on this long-term field experiment can be found in Puppe et al. (2021). We took leaf samples from harvest-fresh plants at the end of July 2018, which were used for heating experiments (subsection Heating of Winter Wheat Leaves) and phytolith extraction (subsection Phytolith Extraction and Treatment).
Heating of Winter Wheat Leaves
Heating of winter wheat leaves was performed following a protocol modified from Dabney et al. (2016): i) leaf samples were carefully cut (approx. 0.5 × 1.5 cm): with a razor blade, transferred to a microscope slide, and covered with a cover slip, ii) the samples were heated in a muffle furnace, whereby the temperature was increased gradually until the intended temperature (120 , 170, 220, 270, 320, 370, or 420°C) was reached and then kept for 6 h, iii) the samples were allowed to cool slowly down in the muffle furnace (off-state, furnace door closed) over night before microscopic analyses (subsection Microscopic Analyses).
Phytolith Extraction and Treatment
Phytoliths were extracted from wheat leaves as follows: i) 10 g of dry plant material was weighed, ii) organic matter was oxidized using H2O2 (30%) and HNO3 (65%) at 80°C until the reaction subsided, iii) carbonates were dissolved by the use of hot HCl (10%, 30 min, 80°C), and iv) the obtained phytoliths were washed with distilled water and dried at 105°C. Phytoliths were heated in the muffle furnace for 6 h at different temperatures, i.e., 120 , 170, 220, 270, 320, 450, and 600°C.
Additionally, we analyzed potential auto-fluorescence of untreated phytoliths in soil samples randomly selected from retained samples of a previous study (Kaczorek et al., 2019). These soil samples with (relatively) high phytolith contents were screened under the light microscope until recognizable soil phytoliths were detected. Thus, these phytoliths were neither extracted nor heated, but directly observed with light as well as fluorescence microscopy (subsection Microscopic Analyses).
Microscopic Analyses
Light and fluorescence microscopy was performed with an inverted epifluorescence microscope (Nikon ECLIPSE Ts2R-FL) equipped with a fluorescence kit (Nikon C-LEDFL470, excitation at 470 nm). Micrographs were taken at magnifications 100 × and 200 × with a high-resolution digital camera (Nikon DS-Fi3) using the software Nikon Nis-Elements (version 4.60). Micrograph processing (sharpness, contrast) was performed with the software ImageJ (version 1.52, http://imagej.nih.gov/ij).
For elemental analyses (Si and carbon) of phytoliths from selected treatments (control and 450°C) a SEM (ZEISS EVO MA10) equipped with an element detector for EDX (Bruker QUANTAX EDS) was used. All SEM-EDX scans were performed using samples sputter-coated with gold (coating thickness approx. 5 nm) and quantitative results were displayed in percent. SEM-EDX analyses were run for all occurring elongate phytoliths, short cells, and silicified tissue fragments (cf. Kaczorek et al., 2019). We performed SEM-EDX analyses without measuring reference materials for calibration as we intended to use carbon contents of phytoliths solely for a statistical grouping of phytoliths via multivariate cluster analysis (subsection Statistical Analyses).
FTIR Spectroscopy
For transmission FTIR 0.5 mg of extracted phytoliths of selected treatments (control-phytoliths and phytoliths heated at 220, 270, 450, or 600°C) were diluted in 99.5 mg potassium bromide (KBr, Merck). Subsequently, these 100 mg phytolith-KBr mixtures were finely ground in an agate mortar and pressed to pellets (5 repetitions each), which were used for transmission FTIR measurements. Transmission FTIR spectra were recorded as 16 co-added scans between wave numbers (WN) 4,000 and 400 cm−1 at a resolution of 4 cm−1 and related to background spectra of ambient air using a Biorad FTS 135 spectrometer. All spectra were smoothed (boxcar moving average algorithm, factor 11), and corrected for baseline shifts using the software WIN-IR Pro 3.4 (Digilab, United States). Mean spectra were calculated from five repetitions using the Average tool of Win-IR Pro. Interpretations of IR spectra were performed by means of standard literature (e.g., Van der Marel and Beutelspacher, 1976) and publications specifically focusing on BSi analyses (e.g., Sandford, 2003; Fraysse et al., 2006; Loucaides et al., 2010; Cabanes et al., 2011; Yan et al., 2014; Puppe and Leue, 2018).
For statistical analyses specific peaks of eight functional groups were used: i) O-H groups around WN 3430 cm−1, ii) the sum of aliphatic C-H groups between WN 3000 and 2,800 cm−1, iii) the sum of C=O groups at WN 1709, 1,645, 1,632, and 1,609 cm−1, iv) the sum of C-O and N-H groups around 1,390 cm−1, v) Si-O groups at WN 1092 cm−1 (asymmetric Si-O-Si stretching), vi) Si-O groups at WN 957 cm−1 (Si-OH bending), vii) Si-O groups at WN 797 cm−1 (symmetric Si-O-Si stretching), and viii) Si-O groups at WN 469 cm−1 (Si-O-Si bending).
Statistical Analyses
Monotonic relationships were analyzed via Spearman’s rank correlation. For grouping of phytoliths based on carbon contents obtained from SEM-EDX analyses, a multivariate cluster analysis (Ward’s minimum variance method with squared Euclidean distances) was applied. Differences between means were tested with the Kruskal–Wallis analysis of variance (ANOVA) followed by pairwise multiple comparisons (Dunn’s post-hoc test). Statistical analyses were performed using the software package SPSS Statistics (version 22.0.0.0, IBM Corp.).
Results
Microscopy
Fluorescence microscopy revealed strong auto-fluorescence of organic matter in the analyzed leaves, which decreased with increasing temperature and the accompanied gradual combustion of organic matter (Figure 1). At temperatures up to 220°C organic matter auto-fluorescence masked the detection of auto-fluorescence in phytoliths. At higher temperatures (270–420°C) auto-fluorescent phytoliths were clearly visible.
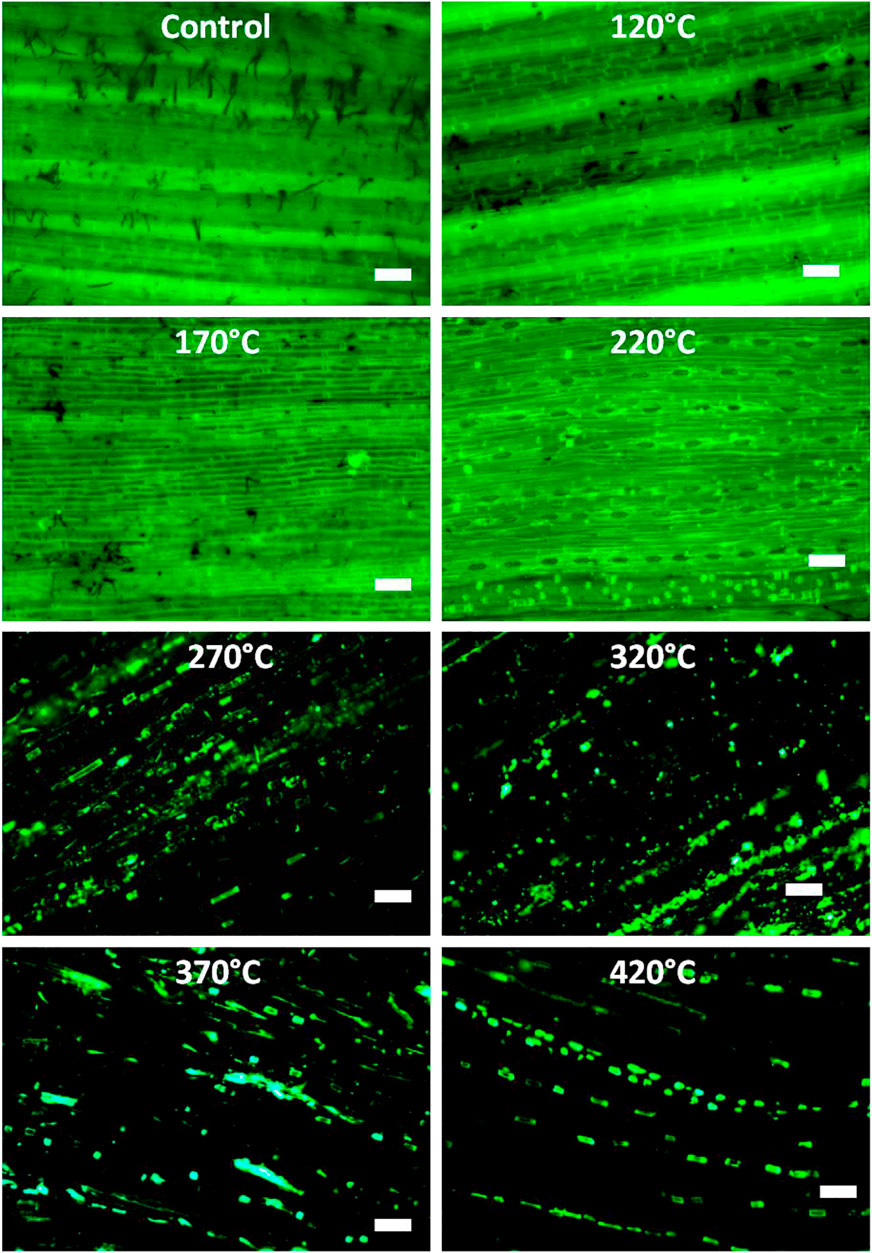
FIGURE 1. Micrographs showing green auto-fluorescence in intact leaves of winter wheat heated at different temperatures. Scale bars: 100 µm.
While auto-fluorescence of organic matter in untreated (no extraction, no heating) soil samples was clearly visible again, phytoliths in these samples showed no auto-fluorescence at all (Figure 2).
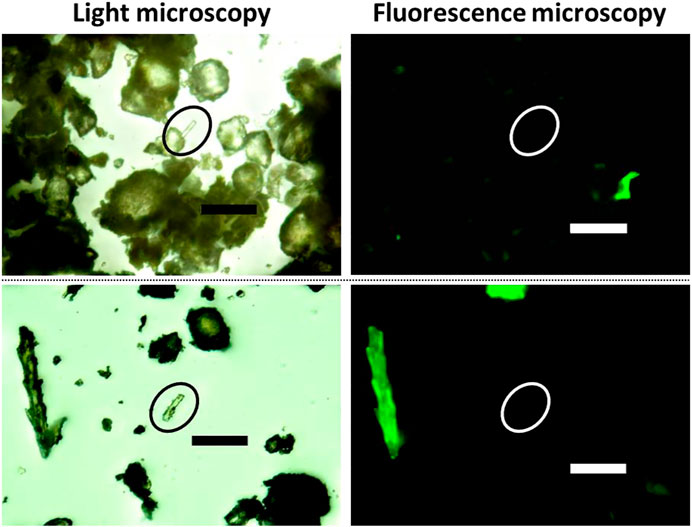
FIGURE 2. Micrographs showing un-extracted phytoliths in different soil samples (upper and lower row) observed with light (left) and fluorescence (right) microscopy. While organic residues in these samples showed auto-fluorescence, the phytoliths did not (white circles). Scale bars: 100 µm.
Analyses of phytoliths extracted from plant samples indicated ambiguous results at temperatures ≤320°C with some phytoliths showing strong auto-fluorescence and others showing only weak or no auto-fluorescence (Figure 3). At higher temperatures, i.e., 450 and 600°C, all phytoliths showed auto-fluorescence.
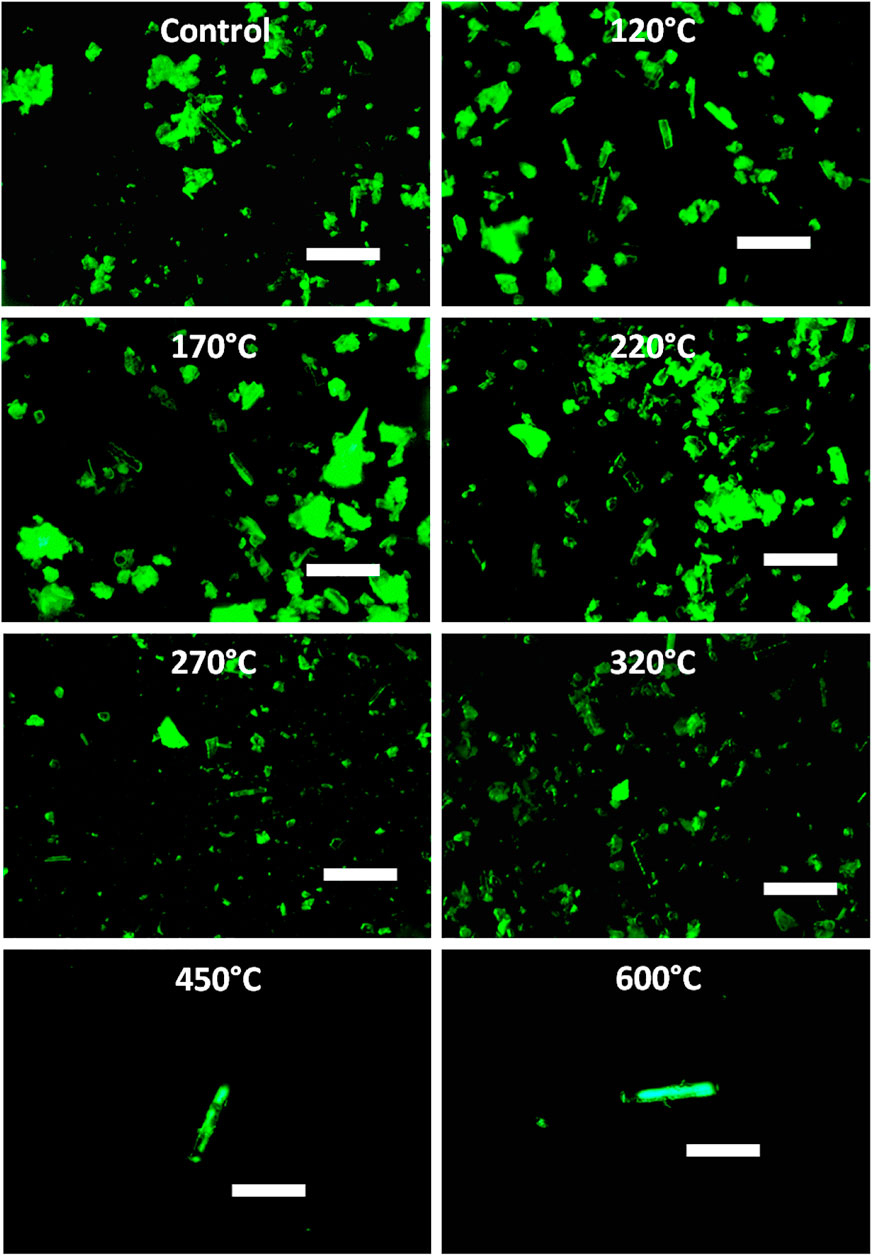
FIGURE 3. Micrographs showing green auto-fluorescence in phytoliths extracted from winter wheat and heated at different temperatures. Scale bars: 100 µm.
SEM-EDX Analyses
Elemental analyses showed that control-phytoliths were characterized by Si and carbon contents ranging between 19.7–39.4% and 14.7–53.2%, respectively (Figure 4). The grouping of control-phytoliths based on carbon contents resulted in four clusters in the first step. Cluster 1 comprised phytoliths with carbon contents between 23.9–29.4%, cluster 2 was characterized by phytoliths with carbon contents between 14.7–20.2%, cluster 3 included phytoliths with carbon contents of 37.7–39.3%, and cluster 4 comprised phytoliths with carbon contents of 42–53.2%. In the second and third steps clusters 3 and 4 and clusters 1 and 2 were joined, respectively. In the fourth (last) step these clusters were finally joined. The grouping of phytoliths heated at 450°C showed less distinct results as heating strongly affected carbon-based functional groups (subsection FTIR Spectroscopy). The grouping of control-phytoliths indicated that most phytoliths were classifiable as lumen phytoliths (62%) with mean carbon contents of about 23%, while cell wall phytoliths represented 38% of the control-phytoliths. Cell wall phytoliths were further divisible into recognizable (in terms of phytolith morphology) cell wall phytoliths (19%, carbon content of about 40%) and silicified tissue fragments (19%, carbon content of about 47%). Carbon contents of lumen and cell wall phytoliths differed statistically significant.
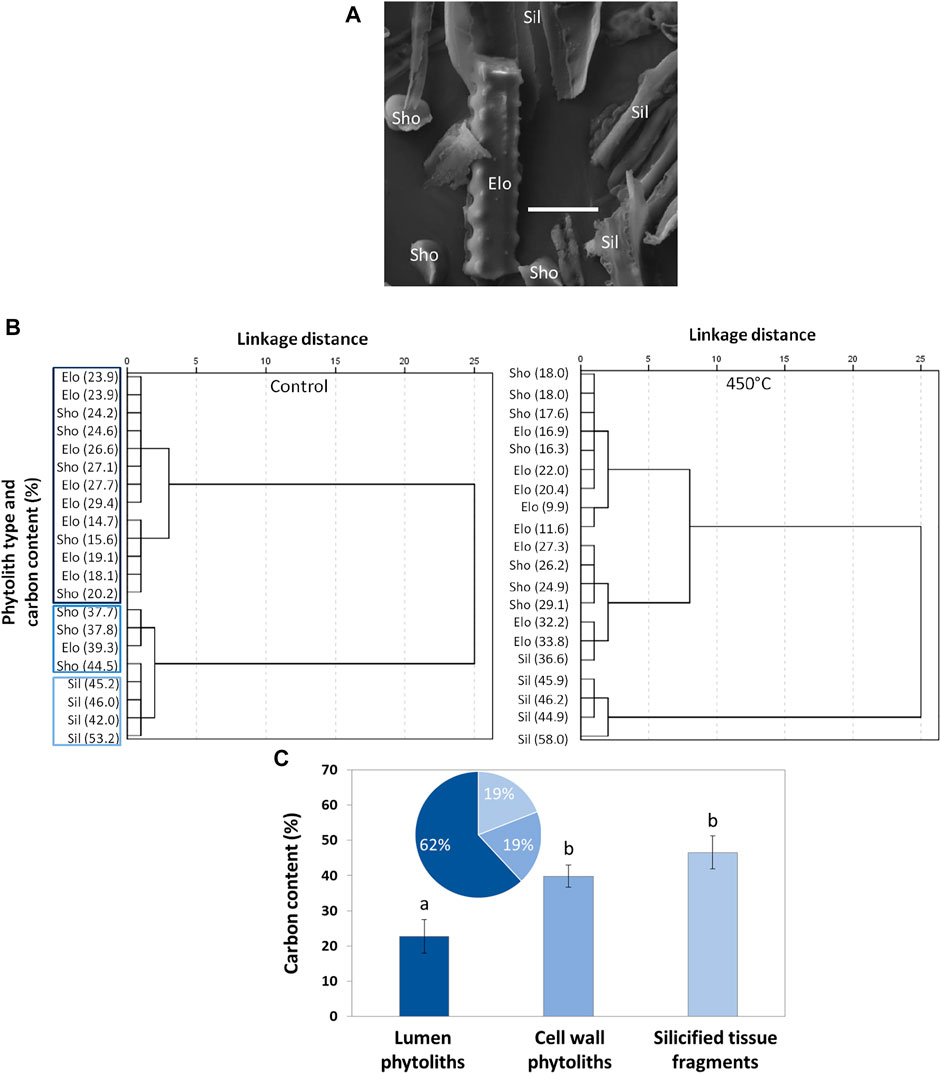
FIGURE 4. Results of SEM-EDX analyses. (A) Exemplary SEM micrograph used for EDX analyses (scale bar: 20 µm), (B) grouping of control-phytoliths (left) and phytoliths heated at 450 °C (right) based on carbon contents measured via EDX (cluster analyses, the different blue tones in the left dendrogram are equivalent to the ones used in (C): dark blue = lumen phytoliths, mid blue = cell wall phytoliths, light blue = silicified tissue fragments), and (C) proportion of lumen phytoliths, cell wall phytoliths, and silicified tissue fragments in the control-phytoliths (pie chart) and corresponding carbon contents (means ± SD, bar chart). Different letters indicate statistically significant differences (Kruskal–Wallis ANOVA). Elo = elongate phytolith, Sho = short cell, Sil = silicified tissue fragment.
FTIR Spectroscopy
Transmission spectra of control-phytoliths differed from those of heated phytoliths (Figure 5). The strongest Si-O band of control-phytoliths occurred at WN 1102 cm−1 (asymmetric Si-O-Si stretching) and was shifted towards WN 1092 cm−1 with higher temperatures. In this context, also the band of silanol groups at WN 957 cm−1 (Si-OH bending) became more prominent in the spectra. The signal intensity at WN 795 cm−1 (symmetric Si-O-Si stretching) remained constant, while the band at WN 465 cm−1 (Si-O-Si bending) slightly increased after thermal treatment. In the spectra of control-phytoliths absorption bands assigned to organic matter were prominent in the regions WN 3000–2,800 cm−1 (aliphatic C-H), WN 1709–1,609 cm−1 (C=O, C-O, N-H, C=C, O-H groups of adsorbed water), and around WN 1395–1,382 cm−1 (C-O and N-H). These bands were quite smaller, but did not completely disappear in the spectra of the samples treated with higher temperatures. Signal intensities of bands assigned to free O-H groups and O-H groups of minerals (around WN 3800–3,400 cm−1) decreased with increasing temperature indicating dehydration during heating. While signal intensities of aliphatic C-H groups strongly decreased at temperatures ≤220°C, the intensities of all other bands decreased more or less gradually with increasing temperatures.
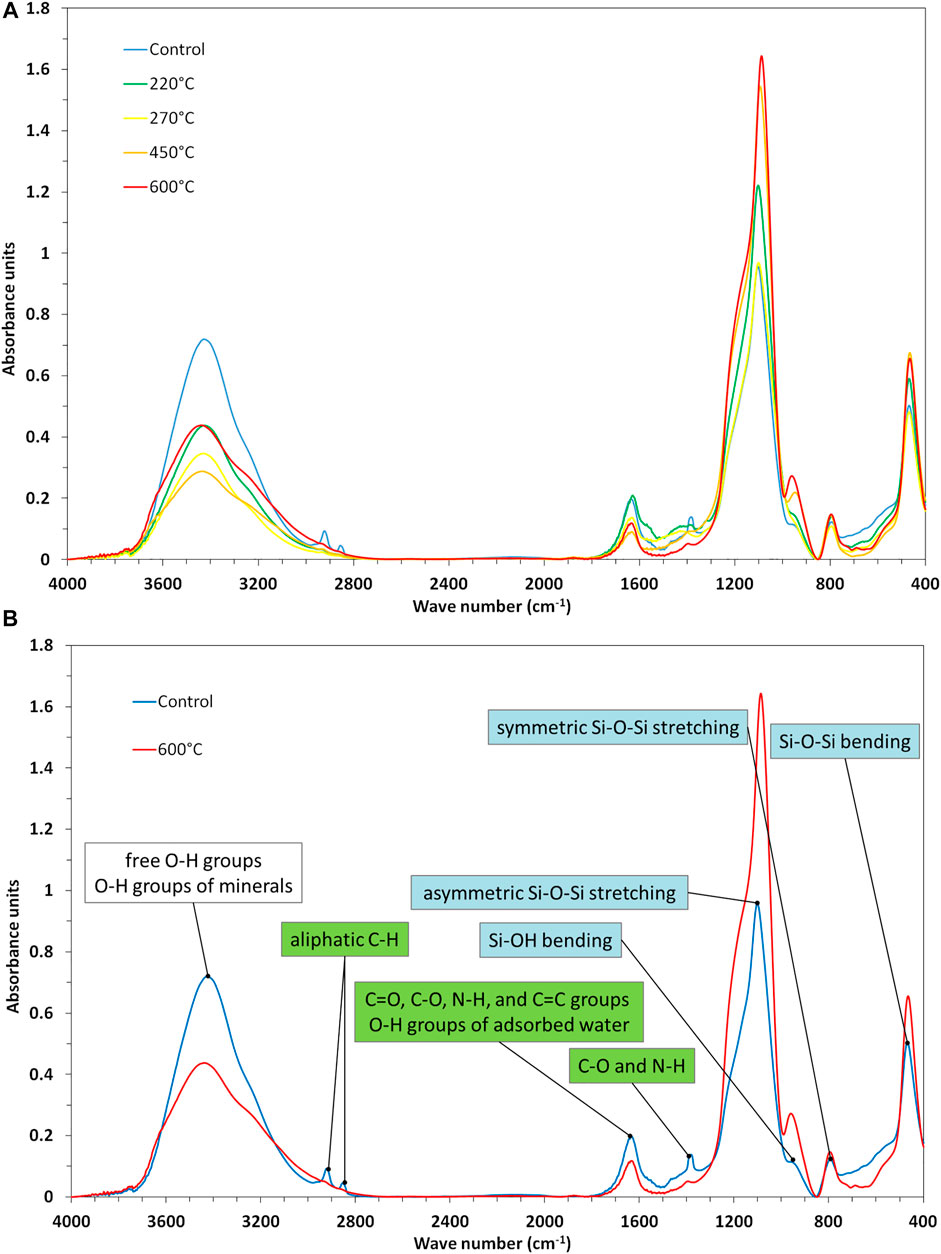
FIGURE 5. (A) FTIR spectra of control-phytoliths and phytoliths heated at different temperatures. (B) Molecular changes in heated phytoliths compared to control-phytoliths. Peaks in the FTIR spectra are labelled with assigned functional groups (green = organic matter, cyan = functional Si groups).
The results described above were also reflected in our statistical analyses (Figure 6). With increasing temperature we found a decrease of the summed peaks of i) the O-H groups (rs = -0.400, p = 0.505), ii) the C-H groups (rs = -0.700, p = 0.188), iii) the C=O groups (rs = -0.800, p = 0.104), and iv) the C-O and N-H groups (rs = -0.900, p = 0.037). Contrary, with increasing temperature we found an increase of (v) the Si-O groups at WN 1092 cm−1 (rs = 0.900, p = 0.037), vi) the Si-O groups at WN 957 cm−1 (rs = 0.900, p = 0.037), vii) the Si-O groups at WN 797 cm−1 (rs = 0.700, p = 0.188), and viii) the Si-O groups at WN 469 cm−1 (rs = 0.600, p = 0.285).
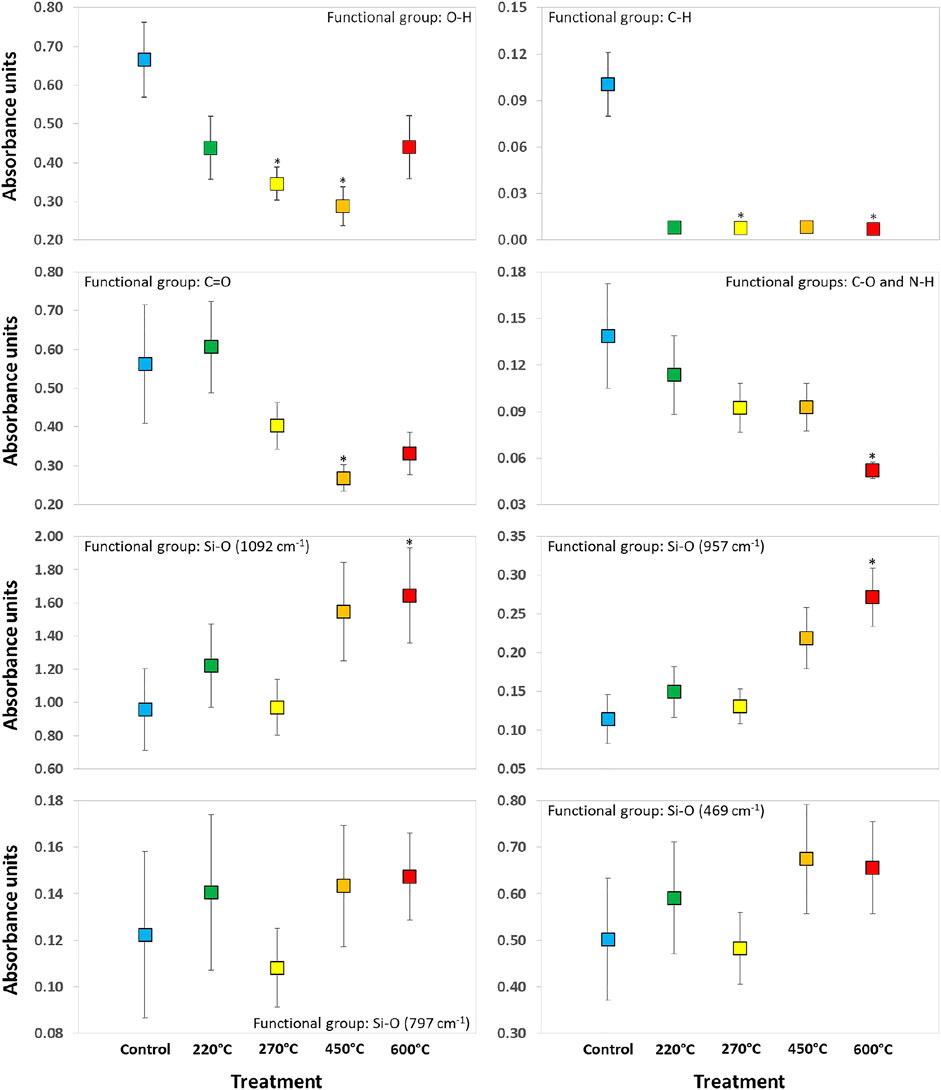
FIGURE 6. Summed peaks of specific functional groups obtained from FTIR analyses of phytoliths extracted from winter wheat. The used colors are equivalent to the ones used in Figure 5. Asterisks denote statistically significant differences to control-phytoliths (Kruskal–Wallis ANOVA).
Discussion
A Potential Mechanism of Auto-Fluorescence in Phytoliths
Our findings indicate that organic compounds associated with phytoliths induce phytolith auto-fluorescence in phytoliths treated at temperatures below approx. 400°C. In phytoliths treated at higher temperatures, i.e., 450 and 600°C, phytolith auto-fluorescence is then mainly caused by molecular changes of phytolith silica, because organic compounds are largely, but not entirely, combusted at these temperatures. In general, our observations are in line with the results of previous studies. Li and Delvaux (2019), for example, examined the Si release from rice straw biochar at different temperatures of pyrolysis. They found an increase of amorphous silica (phytoliths) in biochar with increasing temperatures between 150 and 500°C, but at higher temperatures (500–700°C) the content of amorphous silica decreased. While hydrated amorphous silica (SiO2·nH2O) is relatively stable at temperatures below 150°C, SiO2·nH2O is converted to amorphous silica by dehydration at higher temperatures (150–500°C). At temperatures higher than 500°C amorphous silica starts to convert to mineral polymorphs of silica, i.e., cristobalite and tridymite (see Li and Delvaux, 2019 and references therein). These temperature-dependent molecular changes in the Si-O groups of phytoliths are also reflected in our FTIR results. However, such heating effects are not restricted to biochar, but have also been observed in mineral soils, for example, with consequences for Si cycling (Schaller and Puppe, 2021).
The association of phytoliths with organic compounds has been shown in several previous studies. In fact, organic compounds like proteins or glycoproteins have been found occluded in phytoliths (e.g., Elbaum et al., 2009; Alexandre et al., 2015; Kumar et al., 2020), while other studies have shown that phytolith surfaces are also associated with cell wall components like cellulose, cutin, hemicellulose, or lignin (e.g., Law and Exley, 2011; Soukup et al., 2017; Zancajo et al., 2019). These differences in phytolith composition are directly linked to the origin of phytoliths: While cell wall phytoliths are associated with a carbohydrate matrix, lumen phytoliths seem to contain more proteins and glycoproteins than cell wall phytoliths with consequences for phytolith dissolution kinetics and carbon sequestration (see the authoritative reviews of Hodson, 2016; Hodson, 2019, and references therein).
Nguyen et al. (2021) found the amount of organic carbon associated with phytoliths to decrease with increasing pyrolysis temperature. It is noteworthy that they still detected 3.4 and 1.6% of organic carbon in phytoliths heated at temperatures of 800 and 900°C, respectively. These findings are underlined by our FTIR results regarding functional groups assigned to organic matter. While aliphatic substances (C-H) showed a weak thermal stability, other functional groups representing organic matter (C-O, N-H, C=O, C=C) were relatively stable and detectable even at a temperature of 600 °C. In this context, associations between C-H enriched organic matter and phytogenic silica might be less stable than associations between C=O enriched organic matter and phytoliths. Such binding strength differences have also been found for associations between mineral matter and C-H enriched organic matter showing relatively weak associations and mineral matter and C=O enriched organic matter showing relatively strong associations (Leue et al., 2016). The association with organic matter has been proposed to stabilize phytoliths, whereby heating at specific temperatures might even stabilize this organic matter by aromatization enhancing phytolith resistance against dissolution (Nguyen et al., 2021).
In general, the chemistry of amorphous silica is mainly determined by its surface properties (Zhuravlev, 2000), but what actually causes fluorescence in phytoliths? Traditionally, fluorescence has been attributed to materials with (poly)-aromatic or (poly)-heterocyclic compounds representing conventional chromophores. These conventional chromophores have delocalizable electrons that are needed for photon absorption, energy-induced electron excitation, and electron relaxation leading to fluorescence as illustrated in the Jabłoński diagram (Jabłoński, 1933). However, this viewpoint has been challenged by numerous descriptions of fluorescing materials lacking conventional chromophores. This phenomenon can be well-explained by so-called clusterization-triggered emissions, which are caused by overlapping electron clouds forming non-conventional chromophores responsible for fluorescence (a comprehensive overview of the underlying mechanisms can be found in the review of Liao et al., 2021). Based on our results and the discussion above we propose that auto-fluorescence in phytoliths is caused by clusterization-triggered emissions, which can be induced by i) a strong increase in pH or ii) heating (Figure 7). While increasing pH leads to an increase in deprotonated silanol groups (≡Si−O−), increasing temperatures lead to increased dehydroxylation, i.e., the release of hydroxyl groups (−OH−) by forming water molecules, which results in an increased formation of siloxanes. Deprotonation results in overlapping lone pair electrons, which form electron clouds representing non-conventional chromophores that cause fluorescence events (pH effect). Dehydroxylation and the increasing formation of siloxanes result in the formation of oxygen clusters representing non-conventional chromophores (heating effect). At temperatures <400°C dehydroxylation is readily reversible by the introduction of an excess of water (Zhuravlev, 2000). The extent to which this is influencing phytolith auto-fluorescence in archaeological contexts has to be analyzed in future studies.
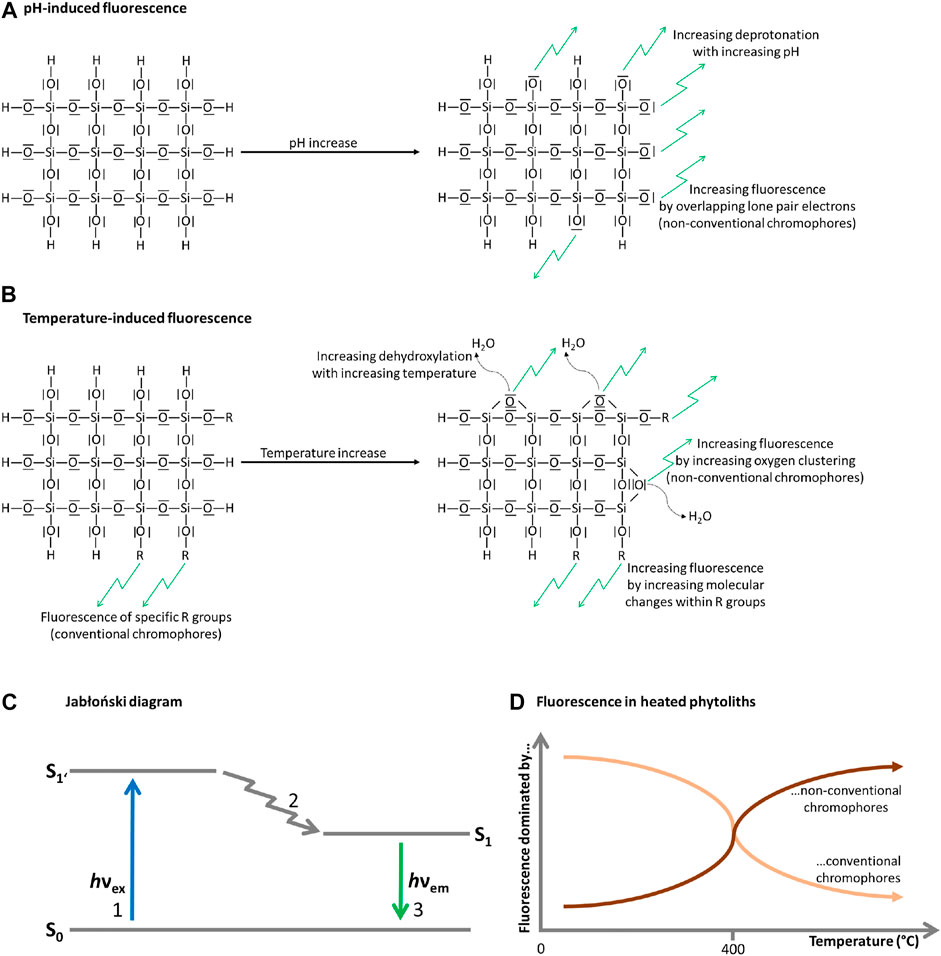
FIGURE 7. Schematic overview of the proposed mechanism of auto-fluorescence in phytoliths. While pH-induced fluorescence is driven by deprotonation (A), temperature-induced fluorescence is driven by dehydroxylation and molecular changes within R groups (R refers to lipids, lignins, and polysaccharides) (B). Both deprotonation and dehydroxylation lead to clusterization-triggered emissions (fluorescence), which are caused by overlapping electron clouds forming non-conventional chromophores. Fluorescence generally can be illustrated with the Jabłoński diagram (adapted from Jabłoński, 1933) (C), which describes photon absorption and excitation of delocalizable electrons from the ground energy state (S0) to an excited singlet energy state (S1’) by absorbing energy in a specific wavelength 1), the release of some of the absorbed energy 2) leading to a relaxed singlet energy state (S1), and the release of the remaining energy causing fluorescence emission 3). While at temperatures <400°C phytolith fluorescence is dominated by conventional chromophores in the R groups (i.e., lipids, lignins, and polysaccharides), phytolith fluorescence is dominated by non-conventional chromophores (i.e., oxygen clusters) at temperatures >400°C (D).
Implications for Biogeochemical Silicon Cycling and Carbon Sequestration
Our SEM-EDX results corroborate the hypothesis of Hodson (2019) that there are two distinct classes of phytoliths, i.e., cell wall and lumen phytoliths, with relatively high and low carbon concentrations, respectively. At this point it should be noted that the carbon contents measured by us are not directly comparable to the ones compiled by Hodson (2019). This is because we did not measure reference materials for SEM-EDX calibration, which would have been necessary for high-precision quantitative carbon analyses needed, e.g., for the determination of carbon sequestration in phytoliths. However, we ensured the compilation of reliable data for multivariate cluster analysis by SEM-EDX measurements under standardized conditions. This implies that the resulting proportions of different phytoliths (i.e., cell wall vs lumen phytoliths) will be directly comparable to corresponding results of future studies. Regarding the auto-fluorescence of phytoliths our results indicate that cell wall phytoliths with strong silica-organic-compounds-associations and corresponding high carbon concentrations might show strong auto-fluorescence without being burnt at all (auto-fluorescence of R groups, see Figure 7). Interestingly, cell wall phytoliths seem to be the ones that can persist in soils and sediments for centuries or even millennia making them ideal candidates for long-term carbon sequestration (cf. Hodson, 2019). In this context, the differences in carbon concentrations of cell wall and lumen phytoliths might explain the different viewpoints regarding the carbon sequestration potential of phytoliths (Song et al., 2016; Santos and Alexandre, 2017; Song et al., 2017). Moreover, this would explain the relatively strong FTIR peaks assigned to organic matter that was previously detected in phytolith samples by two of us (Puppe and Leue, 2018).
In future studies it has to be examined how much time is needed for the decomposition of organic matter associated with phytoliths in soils of different ecosystems. In fact, there are big differences in the Si uptake of different kinds of vegetation and the corresponding storage of phytogenic Si in soils (reviewed by, e.g., Katz et al., 2021 and Schaller et al., 2021). Our SEM-EDX analyses indicated that 62 and 38% of extractable phytoliths were classifiable as lumen and cell wall phytoliths, respectively. Cell wall phytoliths in turn were dividable equally in recognizable (in terms of phytolith morphology) cell wall phytoliths (short cells, 19%) and silicified tissue fragments (19%). Thus it seems that only a minority (19%) of extractable phytoliths is represented by recognizable cell wall phytoliths. This seems to be underlined by our fluorescence analyses of un-extracted soil phytoliths, which showed no auto-fluorescence, and thus might be classified as lumen phytoliths. However, detailed research on this aspect is necessary to corroborate our assumption. Nevertheless, altogether our findings might be a hint that more lumen phytoliths than cell wall phytoliths are formed in winter wheat in general. In fact, lumen phytoliths have been found to be much more common in grasses and cereals compared to other plant groups (Hodson and Guppy, 2022). In this context, it will be of great interest to examine if the proportion of cell wall and lumen phytoliths determined by extraction techniques is comparable to the cell-wall-to-lumen-phytolith-ratio determined by microscopical in situ observations. In fact, fragile phytogenic silica (e.g., thin epidermal silica) in plants are not covered by standard phytolith extraction procedures (Puppe et al., 2017). Considering that only about 16% of the total Si content of grasses is represented by extractable phytoliths (Puppe et al., 2017), the cell-wall-to-lumen-phytolith-ratios determined by extraction techniques and microscopical in situ observations might differ considerably.
What we need now is systematic research on the proportion of cell wall and lumen phytoliths in different plant species determined by a combination of phytolith extraction methods and microscopical analyses. This will allow us to assess the ‘flux’ or translocation of different phytoliths from these species into soils. The corresponding findings will both i) complement the existing information on morphology and taxonomy of phytoliths (Neumann et al., 2019) and ii) allow us to evaluate the potential of species-specific phytoliths for long-term carbon sequestration (e.g., Song et al., 2016). Additionally, the proportion of cell wall and lumen phytoliths in different plant organs like leaves, stems, and roots should be analyzed. This knowledge is crucial to evaluate the potential of plant material recycling for long-term carbon sequestration via phytoliths as well as for the Si supply of crops by the application of biochar (Li and Delvaux, 2019) or crop straw (Puppe et al., 2021). While the relatively stable cell wall phytoliths seem to be well-suited for carbon sequestration in the long term, the less stable lumen phytoliths seem to be important drivers of Si cycling in shorter terms. Our preliminary results on hand indicate that the ratio of cell wall to lumen phytoliths in winter wheat is close to 1:1, i.e., about 1:1.6, suggesting this plant species as both a well-suited candidate for long-term carbon sequestration and Si supply via phytoliths. Indeed, grass species are known for their relatively high Si contents and their potential for carbon sequestration as well as Si recycling has been demonstrated in previous studies (e.g., Puppe et al., 2021; Song et al., 2022).
Conclusion
From our findings we conclude that auto-fluorescence in phytoliths is only reliable as a proxy for heat and fire if heating temperatures were higher than about 400 °C. We propose that fluorescence in phytoliths is then mainly driven by the formation of non-conventional chromophores (i.e., oxygen clusters), that are responsible for fluorescence events by clusterization-triggered emissions. Below this threshold temperature phytolith auto-fluorescence seems to be mainly (but not solely, cf. Figure 7D) determined by conventional chromophores in organic matter associated with the phytoliths. We see our study as a request for further investigations to obtain a deeper understanding of auto-fluorescence in phytoliths by answering the following questions: i) To which extent is auto-fluorescence in phytoliths related to the duration of exposure to heat/fire (or high pH) ii) How do changes in soil properties (e.g., pH, moisture)? influence auto-fluorescence in phytoliths? iii) How strong is auto-fluorescence in phytoliths correlated to the concentration of organic matter associated with the phytoliths (cell wall vs lumen phytoliths)? and iv) Can auto-fluorescence be used for a precise distinction between cell wall and lumen phytoliths, e.g., by detecting the corresponding fluorescence quantum yield (i.e., the strength of the fluorescence signal intensity)? Regarding phytolith-related biogeochemical Si cycling and carbon sequestration especially the following questions have to be resolved: i) How stable are cell wall and lumen phytoliths in sediments and soils of different ecosystems?, ii) Is phytolith stability plant-specific?, iii) How much of the organic matter associated to phytoliths can be found in fossil phytoliths of different age?, iv) Can we use cell-wall-to-lumen-phytolith-ratios for a more precise modeling of carbon sequestration and Si cycling in recent ecosystems? and v) Can we use cell-wall-to-lumen-phytolith-ratios for the reconstruction of carbon sequestration and Si cycling in the past? The answers to these questions will be crucial for phytolith-based studies in archaeological (paleo)-botanical, (paleo)-ecological, and biogeochemical contexts.
Data Availability Statement
The raw data supporting the conclusion of this article will be made available by the authors without undue reservation.
Author Contributions
DP and DK initialized and designed the experiment. DP, ML, and DK conducted the experiment and analyzed samples and data. DP wrote the manuscript with contributions of ML and DK. DP, ML, MS, JS, and DK contributed critically to the drafts and gave final approval for publication.
Funding
DP was funded by the Deutsche Forschungsgemeinschaft (DFG) under grant PU 626/2-1 (Biogenic Silicon in Agricultural Landscapes (BiSiAL) – Quantification, Qualitative Characterization, and Importance for Si Balances of Agricultural Biogeosystems).
Conflict of Interest
The authors declare that the research was conducted in the absence of any commercial or financial relationships that could be construed as a potential conflict of interest.
Publisher’s Note
All claims expressed in this article are solely those of the authors and do not necessarily represent those of their affiliated organizations, or those of the publisher, the editors and the reviewers. Any product that may be evaluated in this article, or claim that may be made by its manufacturer, is not guaranteed or endorsed by the publisher.
Acknowledgments
First of all many thanks to Jacqueline Busse (ZALF) for performing SEM-EDX analyses. We are grateful to the three reviewers, whose insightful comments on our manuscript improved its quality substantially.
References
Alexandre, A., Basile-Doelsch, I., Delhaye, T., Borshneck, D., Mazur, J. C., Reyerson, P., et al. (2015). New Highlights of Phytolith Structure and Occluded Carbon Location: 3-D X-Ray Microscopy and NanoSIMS Results. Biogeosciences 12, 863–873. doi:10.5194/bg-12-863-2015
Bartoli, F. (1985). Crystallochemistry and Surface Properties of Biogenic Opal. J. Soil Sci. 36, 335–350. doi:10.1111/j.1365-2389.1985.tb00340.x
Buján, E. (2013). Elemental Composition of Phytoliths in Modern Plants (Ericaceae). Quat. Int. 287, 114–120. doi:10.1016/j.quaint.2012.02.046
Cabanes, D., Weiner, S., and Shahack-Gross, R. (2011). Stability of Phytoliths in the Archaeological Record: a Dissolution Study of Modern and Fossil Phytoliths. J. Archaeol. Sci. 38, 2480–2490. doi:10.1016/j.jas.2011.05.020
Dabney, C., Ostergaard, J., Watkins, E., and Chen, C. (2016). A Novel Method to Characterize Silica Bodies in Grasses. Plant Methods 12 (1), 3–10. doi:10.1186/s13007-016-0108-8
Devos, Y., Hodson, M. J., and Vrydaghs, L. (2021). Auto-fluorescent Phytoliths: a New Method for Detecting Heating and Fire. Environ. Archaeol. 26 (4), 388–405. doi:10.1080/14614103.2020.1777056
Elbaum, R., Melamed Bessudo, C., Tuross, N., Levy, A. A., and Weiner, S. (2009). New Methods to Isolate Organic Materials from Silicified Phytoliths Reveal Fragmented Glycoproteins but No DNA. Quat. Int. 193, 11–19. doi:10.1016/j.quaint.2007.07.006
Fraysse, F., Pokrovsky, O. S., Schott, J., and Meunier, J.-D. (2009). Surface Chemistry and Reactivity of Plant Phytoliths in Aqueous Solutions. Chem. Geol. 258, 197–206. doi:10.1016/j.chemgeo.2008.10.003
Fraysse, F., Pokrovsky, O. S., Schott, J., and Meunier, J.-D. (2006). Surface Properties, Solubility and Dissolution Kinetics of Bamboo Phytoliths. Geochimica Cosmochimica Acta 70, 1939–1951. doi:10.1016/j.gca.2005.12.025
Haynes, R. J. (2014). A Contemporary Overview of Silicon Availability in Agricultural Soils. J. Plant Nutr. Soil Sci. 177 (6), 831–844. doi:10.1002/jpln.201400202
Haynes, R. J. (2019). What Effect Does Liming Have on Silicon Availability in Agricultural Soils? Geoderma 337, 375–383. doi:10.1016/j.geoderma.2018.09.026
Hodson, M. J., and Guppy, C. N. (2022). Some Thoughts on Silicon and Carbon Trade-Offs in Plants. Plant Soil, 1–7. doi:10.1007/s11104-022-05394-5
Hodson, M. J. (2016). The Development of Phytoliths in Plants and its Influence on Their Chemistry and Isotopic Composition. Implications for Palaeoecology and Archaeology. J. Archaeol. Sci. 68, 62–69. doi:10.1016/j.jas.2015.09.002
Hodson, M. J. (2019). The Relative Importance of Cell Wall and Lumen Phytoliths in Carbon Sequestration in Soil: A Hypothesis. Front. Earth Sci. 7, 167. doi:10.3389/feart.2019.00167
Hodson, M. J., White, P. J., Mead, A., and Broadley, M. R. (2005). Phylogenetic Variation in the Silicon Composition of Plants. Ann. Bot. 96 (6), 1027–1046. doi:10.1093/aob/mci255
Jablonski, A. (1933). Efficiency of Anti-stokes Fluorescence in Dyes. Nature 131, 839–840. doi:10.1038/131839b0
Kaczorek, D., Puppe, D., Busse, J., and Sommer, M. (2019). Effects of Phytolith Distribution and Characteristics on Extractable Silicon Fractions in Soils under Different Vegetation - An Exploratory Study on Loess. Geoderma 356, 113917. doi:10.1016/j.geoderma.2019.113917
Kameník, J., Mizera, J., and Řanda, Z. (2013). Chemical Composition of Plant Silica Phytoliths. Environ. Chem. Lett. 11, 189–195. doi:10.1007/s10311-012-0396-9
Katz, O., Puppe, D., Kaczorek, D., Prakash, N. B., and Schaller, J. (2021). Silicon in the Soil-Plant Continuum: Intricate Feedback Mechanisms within Ecosystems. Plants 10, 652. doi:10.3390/plants10040652
Kumar, S., Adiram-Filiba, N., Blum, S., Sanchez-Lopez, J. A., Tzfadia, O., Omid, A., et al. (2020). Siliplant1 Protein Precipitates Silica in Sorghum Silica Cells. J. Exp. Bot. 71 21, 6830–6843. doi:10.1093/jxb/eraa258
Law, C., and Exley, C. (2011). New Insight into Silica Deposition in Horsetail (Equisetum Arvense). BMC Plant Biol. 11, 112. doi:10.1186/1471-2229-11-112
Leue, M., Eckhardt, K. U., Ellerbrock, R. H., Gerke, H. H., and Leinweber, P. (2016). Analyzing Organic Matter Composition at Intact Biopore and Crack Surfaces by Combining DRIFT Spectroscopy and Pyrolysis‐Field Ionization Mass Spectrometry #. J. Plant Nutr. Soil Sci. 179, 5–17. doi:10.1002/jpln.201400620
Li, Z., and Delvaux, B. (2019). Phytolith‐rich Biochar: A Potential Si Fertilizer in Desilicated Soils. GCB Bioenergy 11 (11), 1264–1282. doi:10.1111/gcbb.12635
Liao, P., Huang, J., Yan, Y., and Tang, B. Z. (2021). Clusterization-triggered Emission (CTE): One for All, All for One. Mat. Chem. Front. 5, 6693–6717. doi:10.1039/d1qm00808k
Liu, X., Colman, S. M., Brown, E. T., Minor, E. C., and Li, H. (2013). Estimation of Carbonate, Total Organic Carbon, and Biogenic Silica Content by FTIR and XRF Techniques in Lacustrine Sediments. J. Paleolimnol. 50, 387–398. doi:10.1007/s10933-013-9733-7
Loucaides, S., Behrends, T., and Van Cappellen, P. (2010). Reactivity of Biogenic Silica: Surface versus Bulk Charge Density. Geochimica Cosmochimica Acta 74, 517–530. doi:10.1016/j.gca.2009.10.038
Ma, J. F., and Takahashi, E. (2002). Soil, Fertilizer, and Plant Silicon Research in Japan. 1st Edn. Amsterdam, Netherlands: Elsevier.
Meunier, J.-D., Cornu, S., Keller, C., and Barboni, D. (2022). The Role of Silicon in the Supply of Terrestrial Ecosystem Services. Environ. Chem. Lett. doi:10.1007/s10311-021-01376-8
Neumann, K., Neumann, K., Strömberg, C. A. E., Ball, T., Albert, R. M., Vrydaghs, L., et al. (2019). International Code for Phytolith Nomenclature (ICPN) 2.0. Ann. Bot. 124 (2), 189–199. doi:10.1093/aob/mcz064
Nguyen, A. T. Q., Nguyen, A. M., Nguyen, L. N., Nguyen, H. X., Tran, T. M., Tran, P. D., et al. (2021). Effects of CO2 and Temperature on Phytolith Dissolution. Sci. Total Environ. 772, 145469. doi:10.1016/j.scitotenv.2021.145469
Piperno, D. R. (2006). Phytoliths: A Comprehensive Guide for Archaeologists and Paleoecologists. New York, NY, USA: Rowman and Littlefield.
Puppe, D., Höhn, A., Kaczorek, D., Wanner, M., Wehrhan, M., and Sommer, M. (2017). How Big Is the Influence of Biogenic Silicon Pools on Short-Term Changes in Water-Soluble Silicon in Soils? Implications from a Study of a 10-Year-Old Soil-Plant System. Biogeosciences. 14 (22), 5239–5252. doi:10.5194/bg-14-5239-2017
Puppe, D., Kaczorek, D., Schaller, J., Barkusky, D., and Sommer, M. (2021). Crop Straw Recycling Prevents Anthropogenic Desilication of Agricultural Soil-Plant Systems in the Temperate Zone - Results from a Long-Term Field Experiment in NE Germany. Geoderma. 403, 115187. doi:10.1016/j.geoderma.2021.115187
Puppe, D., and Leue, M. (2018). Physicochemical Surface Properties of Different Biogenic Silicon Structures: Results from Spectroscopic and Microscopic Analyses of Protistic and Phytogenic Silica. Geoderma. 330, 212–220. doi:10.1016/j.geoderma.2018.06.001
Sandford, F. (2003). Physical and Chemical Analysis of the Siliceous Skeletons in Six Sponges of Two Groups (Demospongiae and Hexactinellida). Microsc. Res. Tech. 62, 336–355. doi:10.1002/jemt.10400
Sangster, A. G., Hodson, M. J., and Tubb, H. J. (2001). “Chapter 5 Silicon Deposition in Higher Plants,” in Studies in Plant Science (Amsterdam, Netherlands: Elsevier), 8, 85–113. doi:10.1016/s0928-3420(01)80009-4
Santos, G. M., and Alexandre, A. (2017). The Phytolith Carbon Sequestration Concept: Fact or Fiction? A Comment On "Occurrence, Turnover and Carbon Sequestration Potential of Phytoliths In Terrestrial Ecosystems By Song et al. (2016). Earth-Science Rev. 164, 251–255. doi:10.1016/j.earscirev.2016.11.005
Schaller, J., Puppe, D., Busse, J., Paasch, S., Katz, O., Brunner, E., et al. (2022). Silicification Patterns in Wheat Leaves Related to Ontogeny and Soil Silicon Availability under Field Conditions. Plant Soil. doi:10.1007/s11104-022-05385-6
Schaller, J., and Puppe, D. (2021). Heat Improves Silicon Availability in Mineral Soils. Geoderma. 386, 114909. doi:10.1016/j.geoderma.2020.114909
Schaller, J., Puppe, D., Kaczorek, D., Ellerbrock, R., and Sommer, M. (2021). Silicon Cycling in Soils Revisited. Plants. 10 (2), 295. doi:10.3390/plants10020295
Sommer, M., Jochheim, H., Höhn, A., Breuer, J., Zagorski, Z., Busse, J., et al. (2013). Si Cycling in a Forest Biogeosystem - the Importance of Transient State Biogenic Si Pools. Biogeosciences. 10, 4991–5007. doi:10.5194/bg-10-4991-2013
Song, Z., Liu, H., Strömberg, C. A. E., Yang, X., and Zhang, X. (2017). Phytolith Carbon Sequestration in Global Terrestrial Biomes. Sci. Total Environ. 603-604, 502–509. doi:10.1016/j.scitotenv.2017.06.107
Song, Z., McGrouther, K., and Wang, H. (2016). Occurrence, Turnover and Carbon Sequestration Potential of Phytoliths in Terrestrial Ecosystems. Earth-Science Rev. 158, 19–30. doi:10.1016/j.earscirev.2016.04.007
Song, Z., Wu, Y., Yang, Y., Zhang, X., Van Zwieten, L., Bolan, N., et al. (2022). High Potential of Stable Carbon Sequestration in Phytoliths of China's Grasslands. Glob. Change Biol. 28, 2736–2750. doi:10.1111/gcb.16092
Soukup, M., Martinka, M., Bosnić, D., Čaplovičová, M., Elbaum, R., and Lux, A. (2017). Formation of Silica Aggregates in Sorghum Root Endodermis Is Predetermined by Cell Wall Architecture and Development. Ann. Bot. 120 (5), 739–753. doi:10.1093/aob/mcx060
Soukup, M., Martinka, M., Cigáň, M., Ravaszová, F., and Lux, A. (2014). New Method for Visualization of Silica Phytoliths in Sorghum Bicolor Roots by Fluorescence Microscopy Revealed Silicate Concentration-dependent Phytolith Formation. Planta. 240 (6), 1365–1372. doi:10.1007/s00425-014-2179-y
Van der Marel, H. W., and Beutelspacher, H. (1976). Atlas of Infrared Spectroscopy of Clay Minerals and Their Admixtures. Amsterdam, Netherlands: Elsevier, 234.
Wehrhan, M., Puppe, D., Kaczorek, D., and Sommer, M. (2021). Spatial Patterns of Aboveground Phytogenic Si Stocks in a Grass-Dominated Catchment - Results from UAS-Based High-Resolution Remote Sensing. Biogeosciences. 18 (18), 5163–5183. doi:10.5194/bg-18-5163-2021
Wu, Y., Yang, Y., Wang, H., and Wang, C. (2014). The Effects of Chemical Composition and Distribution on the Preservation of Phytolith Morphology. Appl. Phys. A 114, 503–507. doi:10.1007/s00339-013-7616-4
Yan, F., Jiang, J., Chen, X., Tian, S., and Li, K. (2014). Synthesis and Characterization of Silica Nanoparticles Preparing by Low-Temperature Vapor-Phase Hydrolysis of SiCl4. Ind. Eng. Chem. Res. 53, 11884–11890. doi:10.1021/ie501759w
Zancajo, V. M. R., Diehn, S., Filiba, N., Goobes, G., Kneipp, J., and Elbaum, R. (2019). Spectroscopic Discrimination of Sorghum Silica Phytoliths. Front. Plant Sci. 10, 1571. doi:10.3389/fpls.2019.01571
Keywords: fluorescence microscopy, FTIR spectroscopy, SEM-EDX, burnt phytoliths, carbon sequestration
Citation: Puppe D, Leue M, Sommer M, Schaller J and Kaczorek D (2022) Auto-Fluorescence in Phytoliths—A Mechanistic Understanding Derived From Microscopic and Spectroscopic Analyses. Front. Environ. Sci. 10:915947. doi: 10.3389/fenvs.2022.915947
Received: 08 April 2022; Accepted: 02 May 2022;
Published: 19 May 2022.
Edited by:
Monika Mortimer, China Jiliang University, ChinaReviewed by:
Martin John Hodson, Oxford Brookes University, United KingdomMinh Nguyen, Vietnam National University, Vietnam
Xinxin Zuo, Fujian Normal University, China
Copyright © 2022 Puppe, Leue, Sommer, Schaller and Kaczorek. This is an open-access article distributed under the terms of the Creative Commons Attribution License (CC BY). The use, distribution or reproduction in other forums is permitted, provided the original author(s) and the copyright owner(s) are credited and that the original publication in this journal is cited, in accordance with accepted academic practice. No use, distribution or reproduction is permitted which does not comply with these terms.
*Correspondence: Daniel Puppe, ZGFuaWVsLnB1cHBlQHphbGYuZGU=, b3JjaWQub3JnLzAwMDAtMDAwMy0zMTQwLTA1Mjg=