 Taegyung Lee
 Sujung Go
 Yun Gon Lee
 Sang Seo Park4
 Ja-Ho Koo
95% of researchers rate our articles as excellent or good
Learn more about the work of our research integrity team to safeguard the quality of each article we publish.
Find out more
ORIGINAL RESEARCH article
Front. Environ. Sci. , 22 July 2022
Sec. Atmosphere and Climate
Volume 10 - 2022 | https://doi.org/10.3389/fenvs.2022.915531
This article is part of the Research Topic Air Pollution and Climate Change: Interactions and Co-mitigation View all 18 articles
This study investigated the various temporal (weekly, monthly, and inter-annual) variability of air pollutants (PM10, SO2, NO2, O3, CO) in seven megacities in South Korea (Seoul, Busan, Incheon, Daegu, Gwangju, Daejeon, and Ulsan). We found that the general decreasing trend of PM10, SO2, NO2, and CO. An exceptional pollutant is O3, showing a clear increasing trend consistently in all seven megacities. Seasonally PM10, SO2, NO2, and CO have the highest level in winter due to the large fossil-fuel combustion for the heating demand, but O3 shows the maximum peak in summer related to the intensified photochemistry. Based on the analysis for percentile values of air pollutants, we recognized that some patterns of air pollutants in Korean megacities are overlooked: O3 increase is not perfectly related to the NO2 pattern, somewhat high SO2 in the coastal cities, ambiguous weekly pattern on Monday (as a weekday) and Sunday (as a weekend). Through this comprehensive analysis of multiple air pollutants using the percentile values, the characteristic for various temporal change of air pollutants in Korean megacities can be better understood, and some useful ideas for the air quality control in the urban region can be also excavated.
Air pollutants have adverse health effects, leading to respiratory and cardiovascular diseases (Xing et al., 2016; Wang et al., 2017). Moreover, they widely influence the ecosystem such as the crop damage (Wang et al., 2017). The air pollution level is also associated with the extent of absorption and scattering of solar radiation, resulted in the change of short-term radiative forcing (Huang et al., 2009; Che et al., 2014). To assess these situations, the analysis of long-term dataset of air pollutants is crucial. In this context, a number of countries basically started to manage the surface networks for the long-term observation of some key air pollutants. For example, Republic of Korea (South Korea) started the measurements of the mass density of particulate matter (PM) with the diameter < 10 μm (PM10), ozone (O3), nitrogen dioxide (NO2), sulfur dioxide (SO2), and carbon monoxide (CO) with some volatile organic compounds (VOCs) from the year 1973 (SS, 2022). These measurements of air pollutants are generally provided through the national data archive, AIRKOREA, for the diagnosis of regional air quality.
Using the multiple datasets in a country range, there have been a number of studies for examining the long-term variation of air pollutants. For South Korea, Yoo et al. (2015) was the representative research showing the spatiotemporal properties of air pollutants in the Korean peninsula. They examined the daily, weekly, and annual concentration distributions of AIRKOREA air pollutants in four land types (residential, commercial, greenbelt, and industrial areas), and found that the levels of PM10 and SO2 were high in industrial areas, NO2 and CO levels were high in commercial areas, and O3 level was high in greenbelt areas. Namely, this study suggested that the local pattern of air pollutants is much affected by the land type. However, the air pollutant pattern is not always identical in a same land type. For example, there were some different patterns of air pollutants among provincial capital cities in China (Xie et al., 2015; Zhao et al., 2016), indicating the necessity of deeper analysis about the air pollutant pattern in the urban area where most of monitoring sites were located. The pattern analysis of urban air pollution will be also helpful idea for the diagnosis of human health, which is vulnerable to the high level of air pollutants (Kim et al., 2011; Lee S. W. et al., 2019).
Thus, here we investigated the various temporal variations of urban air pollutants in the Korean peninsula, using the surface measurement dataset in seven megacities of South Korea where high air pollution is generally found: Seoul, Busan, Incheon, Daegu, Gwangju, Daejeon, and Ulsan. Moreover, the air quality index was calculated based on the level of multiple pollutants for the comprehensive examination of the long-term air quality change. Understanding the local characteristics of air pollution at these megacities will be practically helpful for diagnosing the air pollution damage to the population living in each city, and the analysis of the long-term trend can be used as a reference to identify the degree of air quality improvement in each city. Based on these ideas, effective air pollution mitigation policies can be established for the urban region in South Korea. To get over the limitation of mean pattern analysis, this study also examined the percentile analysis, particularly temporal pattern of 10th and 90th percentile of air pollutant level, implying the characteristic of background and highly polluted conditions.
The Ministry of Environment in South Korea has established the nationwide surface measurement network for monitoring the level of representative air pollutants such as PM, O3, NO2, SO2, and CO, which are measured by ß-ray absorption method, ultraviolet (UV) photometric method, Chemiluminescent method, pulse UV fluorescence method, and non-dispersive infrared method, respectively (ME·NIER, 2021). Raw measured data from this monitoring network have been inspected and validated by the National Ambient air quality Monitoring Information System (NAMIS), then the final quality-confirmed data were prepared and provided through the AIRKOREA data archive (ME·NIER, 2021; KECO, 2022b). This study analyzed the hourly median value of PM10 (units: μg/m3), O3 (unit: ppb), NO2 (unit: ppb), SO2 (unit: ppb), CO (unit: ppb) from 2002 to 2020 in seven megacities of South Korea where population is higher than at least 1 million: Seoul, Busan, Daegu, Incheon, Gwangju, Dajeon, and Ulsan (KOSIS, 2021) (Supplementary Figure S1). As shown in Figure 1, there are total 120 monitoring sites in these seven megacities (27 for Seoul, 22 for Busan, 14 for Daegu, 21 for Incheon, 9 for Gwangju, 10 for Daejeon, and 17 for Ulsan). The median pattern among all sites in each megacity was basically analyzed in this study. While the local difference definitely exists in each megacity (e.g., Vuong et al., 2022), the analysis based on the median value, not affected by outliers different from mean value, can be a significant signal to show the general pattern of each city.
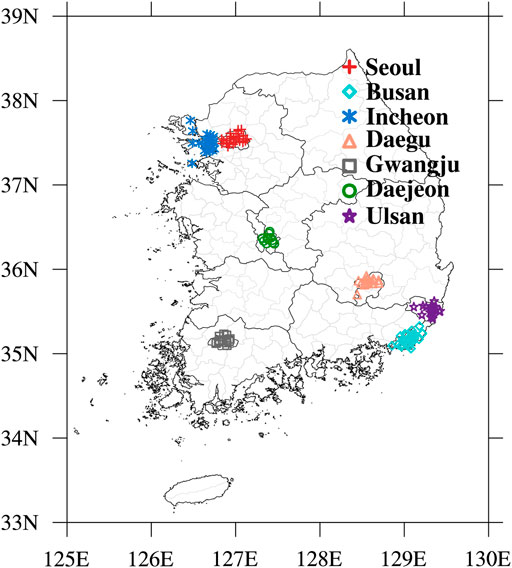
FIGURE 1. Location of AIRKOREA urban air quality monitoring stations in seven megacities: Seoul, Busan, Incheon, Daegu, Gwangju, Daejeon, and Ulsan.
PM2.5 data were not considered in this study because of the short monitoring history (started since 2015). While the AIRKOREA performs the quality control/assurance process regularly and releases the quality-confirmed data as mentioned, sometimes there can be ambiguous cases founded by the manual data quality check. For example, we are not sure if the CO levels in Gwangju from February to March 2003 reflects the real situation based on our own assessment of data quality (Supplementary Figure S2). We did not include these cases for our study.
For the purpose to provide the adverse effects of air pollution on human health to the non-expert public, the comprehensive air-quality index (CAI) was designed and widely used in South Korea (ME, 2006; ME·NIER, 2021). CAI is a unitless proxy showing the degree of local air pollution in general. CAI is calculated through several steps, which are described in the AIRKOREA webpage (KECO, 2022a). Based on this guideline, we calculated the CAI using the level of five pollutants (PM10, O3, NO2, SO2, and CO). In brief, the level of each air pollutant is normalized to an individual index, and finally a CAI is determined by the highest index among five normalized indices from normalized PM10, O3, NO2, SO2, and CO. The range of CAI (0–500) was divided into four categories for depicting the degree of air pollution: Good (0–50), Moderate (51–100), Unhealthy (101–250), and Very unhealthy (251–500). As the CAI becomes closer to the Unhealthy category, even a short-term exposure can have a serious and adverse impact on the public regardless of a kind of air pollutants (e.g., Pope et al., 2006; Choi et al., 2018). Since CAI value can be an easy and intuitive information to the non-expert public people, the long-term variation of CAI in South Korea was also examined in this study.
In the analysis for the temporal variability of the regional air pollutants in South Korea, it is necessary to filter out the influence of Asian dust events, which are the natural events happened occasionally. Namely, the effect of Asian dust can screen other meaningful signals of regional air pollution associated with a number of urban activities. South Korea is frequently impacted by the long-range transported Asian dust (Tsai and Chen, 2006; Lee, 2014; Ghim et al., 2017). Thus, the Asian dust days were generally excluded for the spatiotemporal analysis of PM (Ghim et al., 2015). We also did not use air pollutant data for the days of Asian dust, which was determined according to visual observations and instrumental observations by the Korea Meteorological Administration. The number of Asian dust days in each city is summarized in Supplementary Table S1.
Long-term trend analysis was performed based on the linear regression method. The trend value is estimated using Eq. 1 where x is year, y is the level of each air pollutants, and n means 19 years (from 2002 to 2020). For each trend, the significance test was also conducted based on p value from the Student’s t-test. We obtain the t value from t test (Eq. 2, where b is the slope from the linear regression method, μ is the specified mean, and σ is the standard deviation), then p value can be finally achieved from the t distribution table. All trend values and significant test results (p values and determination of significance) were summarized in Supplementary Tables S2–S8.
At first, we examined the patterns of PM10, O3, NO2, SO2, and CO in seven megacities during whole measurement period (2002–2020) using the median value (Table 1). PM10 is generally higher in Seoul, Busan, Incheon, and Daegu compared to PM10 in Gwangju, Daejeon, and Ulsan. NO2, typically related to the traffic amounts (Park et al., 2021b), shows similar pattern to PM10 pattern. O3 pattern is reverse to the NO2 pattern, supporting the previous findings that the ozone production in Korean peninsula is chemically located in the VOC-limited regime (Kim et al., 2018; Bae et al., 2020). SO2 level is highest in Busan, Incheon, and Ulsan that are harbor regions, showing that the ship-plume still much degrades the air quality in the industrialized megacities near the coast (Chen et al., 2017; Sorte et al., 2020). This simple median pattern analysis let us know the differences among the seven targeted megacities, and necessity to develop the multiple policies matching to each individual situation suitably.
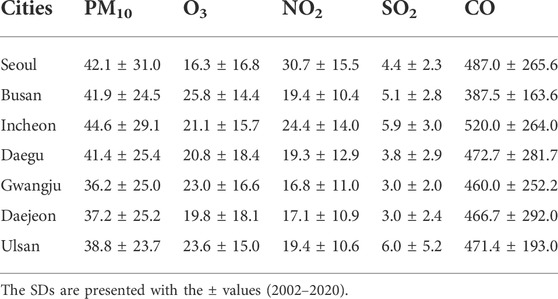
TABLE 1. Median concentrations of PM10 (μg m−3), O3 (ppb), NO2 (ppb), SO2 (ppb), and CO (ppb) in the study areas.
We then investigated the monthly variation of air pollutants using median values. Figure 2 shows the monthly median of PM10, O3, NO2, SO2, and CO in seven megacities. Mainly there is large contrast between the winter (December, January, and February, hereafter DJF) and summer (June, July, and August, hereafter JJA) season; The level of air pollutants is generally high in winter but low in summer, except O3 and SO2 in Busan and Ulsan. These air pollutants (PM10, NO2, O3, and CO) are mainly emitted from the fuel combustion and relevant processes, which is typically high in the cold season (i.e., winter) due to the large heating demand (Masiol et al., 2014; Zhang and Cao, 2015). Lower level in summer is contributed by the wash-out effect in the rainy season (Kim et al., 2014; Luo et al., 2014) and the strong vertical mixing in the deepened boundary layer due to the large surface heating (Su et al., 2018). In spring (March, April, and May, hereafter MAM), the monthly pattern of aerosol is a little different from that of gaseous pollutants. The maximum of aerosol mass density (PM10) occurs in spring (Figure 2A), implying that the long-range transport of mineral dust particle largely enhances the median level of regional aerosol loading although we excluded serious Asian dust event days as mentioned.
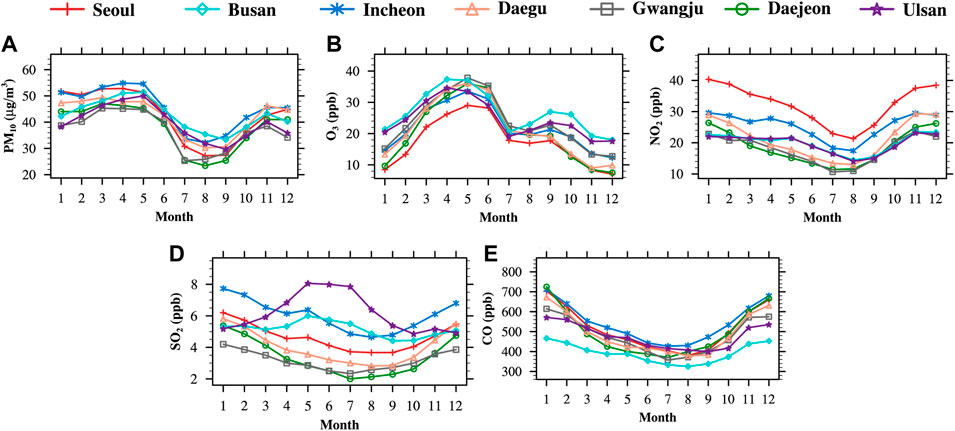
FIGURE 2. Monthly variations of median level (A) PM10 (μg m−3), (B) O3 (ppb), (C) NO2 (ppb), (D) SO2 (ppb), and (E) CO (ppb) in seven megacities, South Korea. Monthly median was estimated in the period from 2002 to 2020.
In contrast to PM10, NO2, O3, and CO, the O3 level shows the reverse seasonal pattern: high in summer but low in winter (Figure 2B). Since the O3 production is strongly affected by the photochemical processes, the amount of O3 increases rapidly in summer when the solar radiation is intensified (Seo et al., 2014; Zhao et al., 2016). One more thing to underline is the exceptional monthly pattern of SO2 in Busan and Ulsan (Figure 2D). It is well known that the ship plume is one of dominant sources of anthropogenic SO2 (Yang et al., 2016), and our analysis revealed same result: higher SO2 in coastal megacities (Ulsan, Busan, and Incheon). Also, these coastal cities have a large industrial area, therefore the high SO2 emission is also expected from the manufacturing and industrial processes (Choi et al., 2020). The unique summer peak of SO2 in Ulsan located in the eastern coast (Figure 1) seems associated with the emission of local industrial area (Vuong et al., 2022) where the southeastern seasonal-wind is prevailing in summer (Clarke et al., 2014), resulted in the inland accumulation of emitted air pollutants. Higher SO2 in summer, Busan (nearby Ulsan) can be explained in a similar way. Incheon does not show a summer SO2 peak by the southeastern wind due to the location (western coast of Korean peninsula).
Additionally, we investigated the mean pattern of each day of the week (Figure 3), which is associated with the weekend effect (e.g., decrease of anthropogenic activity). In general, air pollution analysis based on the day of the week is conducted to see how much the anthropogenic emission from the urban activity degrades the local air quality (Xia et al., 2008; Chen et al., 2015). We found that PM10 and NO2 in Korean megacities show the clear difference between the weekend (Saturday and Sunday) and weekday (other days except the weekend): 10% higher on weekdays than weekends (Figures 3A,C). This characteristic in Korean megacities is similar to the weekly pattern in other urban area (Gong et al., 2007; Stavrakou et al., 2020). As shown in the monthly variation, weekly pattern of O3 is also opposite to that of NO2: higher in the weekend and lower in the weekdays (Figure 3B). Considering that both aerosol and ozone are harmful to the respiratory health, weekend is also not a period of safety for residents having the respiratory symptom, especially asthma patients who are seriously vulnerable to the high O3 (Li et al., 2019). SO2 also shows some weekday-weekend difference but its quantity is quite smaller than PM10 and NO2 (Figure 3D) because most of fuel utilized in South Korea was already much desulfurized (Kim and Lee, 2018). CO does not have a significant weekday-weekend difference (Figure 3E) due to its long lifetime (Yoo et al., 2015). Typically, the weekday-weekend difference of air pollution becomes larger as the urban region has higher pollution (Huryn and Gough, 2014) or lower greenish area (Elansky et al., 2020), which can be confirmed here by the larger weekday-weekend difference in higher populated megacities (i.e., Seoul).
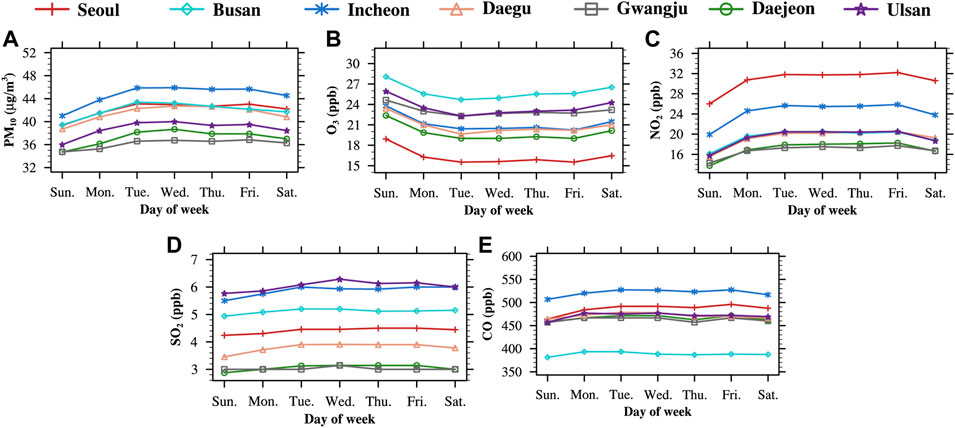
FIGURE 3. Weekly variations of median level (A) PM10 (μg m−3), (B) O3 (ppb), (C) NO2 (ppb), (D) SO2 (ppb), and (E) CO (ppb) in seven megacities, South Korea. Weekly median was estimated in the period from 2002 to 2020.
Another interesting feature is the difference of air pollution level among each day of week. As known, weekday-weekend difference of urban air pollution has been examined in the world (Marr and Harley, 2002; Almeida et al., 2006). We generally define the “weekday” as the period from Monday to Friday, and the “weekend” as the period from Saturday and Sunday. But it seems that Monday in weekday and Saturday in weekend are in the sort of transition regime. For example, PM10 and NO2 on Saturday is not small as shown on Sunday, and those on Monday is not high as shown in other weekdays (Tuesday to Thursday) (Figures 3A,C). In other words, it is hard to categorize Monday as the weekday and Saturday as the weekend, whereas Tuesday to Friday have a consistent pattern of air pollution as the weekday and Sunday clearly shows the property of weekend. This feature probably comes from the life and working style in South Korean megacities. Recently, Monday and Saturday seem the moving day of urban people in South Korea: Travel to their suburban residence area on Saturday and return to the working place on Monday. For the proper application of these situation to the weekly variation of urban air pollutants in South Korea, the social activity pattern will be more investigated for the weekday and weekend separately. So far, it looks better to define the weekday based on the period from Tuesday to Friday and the weekend based on Sunday for the weekday-weekend difference of air pollutants.
After the analysis of general pattern, we investigated the long-term trend of PM10, O3, NO2, SO2, and CO in seven megacities, South Korea. In this work, we basically analyzed the trend of median (50th percentile) value, and also compare the trend of 10th and 90th percentile values, which typically describe the background and high polluted air condition (Yoon et al., 2016). We performed the long-term trend analysis of annual percentiles first then carried on the analysis for the monthly and day of week percentiles.
The trends of annual 10th, 50th (median), and 90th percentile for PM10, O3, NO2, SO2, and CO in seven megacities were compared as shown in Figure 4; Time-series were provided in Supplementary Figures S3–S5. PM10 trend is consistently negative in all seven megacities, and the magnitude is the largest for the 90th percentile trends, implying the decrease of serious haze cases. Trends of annual NO2 percentiles are also consistently decreasing and the magnitude is large for the 90th percentile, similar to trends of PM10. Decreasing trend of both PM10 and NO2 is the strongest in Seoul and becomes weaker as the city population (Supplementary Figure S1) is getting lower. It seems that the effort to reduce air pollutants emission in highly populated megacities works for the steady improvement of Korean urban air quality. There are some exceptions that are increasing trend of 90th percentiles of NO2 in Daejeon and Ulsan, but these do not hurt the finding above because of its small and insignificant magnitude.
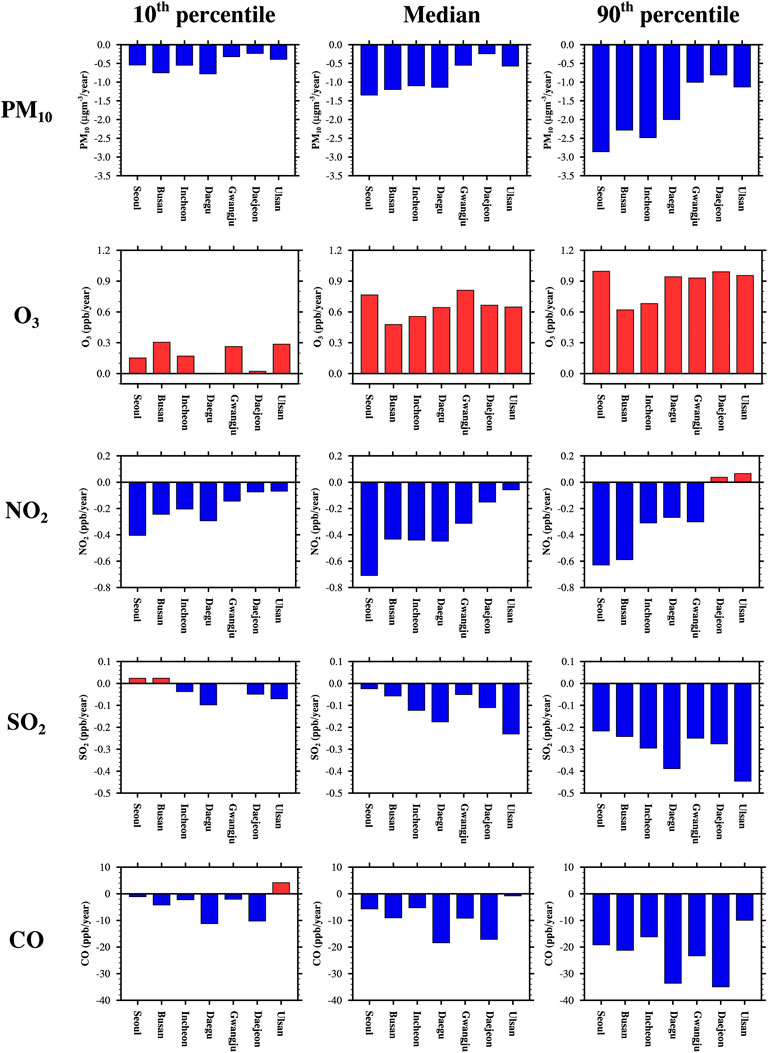
FIGURE 4. Long-term (2002-2020) trends of PM10 (μg m−3/year), O3 (ppb/year), NO2 (ppb/year), SO2 (ppb/year), and CO (ppbl/year) using 10th, 50th (median), and 90th percentile levels in seven megacities, South Korea.
SO2 also shows the decreasing trend but the pattern is a little different: larger decrease in less-populated megacities. Seoul and Busan even have increasing trend of SO2 when 10th percentiles were analyzed, implying that the control of manufacturing activities and industrial processes, the main sources of SO2 emission (Choi et al., 2020), in large megacities of South Korea is still significantly monitored. Despite the small magnitude of this increase, increasing trends of background SO2 cannot be easily neglected in these high populated megacities (Supplementary Figure S1). CO trend is generally all negative, consistent with well-known recent CO decrease in other Asian regions (Liu et al., 2019; Zhang et al., 2020).
In contrast, O3 level becomes worsened. O3 trends are consistently increasing in all megacities, and the magnitude is the largest for the 90th percentile trends. Different from PM10 and NO2 trends, the increasing trend is not proportional to the city population. These features suggest that cases of high O3 pollution have significantly contributed to the deterioration of urban air quality in South Korea, and this situation is not simply related to the level of other air pollutants or the scale of megacities. While the O3 increase in the whole Korean peninsula has been reported (Yoo et al., 2015; Yeo and Kim, 2021), the main influencing factor is still not understood clearly. There were some trials to explain the O3 increase in South Korea based on the meteorological effect (Seo et al., 2014), land use pattern (Yoo et al., 2015), and local emission effect (Shin et al., 2012; Yeo and Kim, 2021). The contribution of transboundary transport was also discussed (Oh et al., 2010; Choi et al., 2014). There is also a possibility that the photochemical production of ozone is getting larger by the increasing pattern of insolation and temperature in the Korean peninsula (Seo et al., 2014). In addition, the existence of stratospheric ozone intrusion may be associated with the O3 increasing trend by considering the consistent O3 increase in all seven megacities and the report of high ozone level above the boundary layer (Crawford et al., 2021).
Next, the long-term trend of air pollutants was investigated for each month. The difference of monthly trends between summer and winter is the first impression of this analysis, except CO (Figure 5). PM10 in seven megacities have a large decreasing trend in summer, but this decrease is not clearly shown in winter (Figure 5A). The decreasing trend of wintertime PM10 can be weakened by the long-term increase of stagnant condition in East Asia (Lee et al., 2020) because the stagnant air condition facilitates the high loading of local airborne aerosols, as recent studies indicated the anti-relationship between PM10 and wind speed (Kim et al., 2017). Considering that the high PM10 in Korean megacities generally happens in winter (Figure 2), the massive effort looks still required to avoid the threat of aerosol pollution to the public health in winter. In summer, aerosol pollution in the Korean peninsula usually relates to the large condensation and coagulation of particles (hygroscopic growth) under the stagnant air condition (Koo et al., 2016; Eck et al., 2020). Thus, the large negative trend in summer is explained by the situation that the stagnant air condition in summer is getting weaker, supported by the previous findings (Lee et al., 2020; Cho et al., 2021). The decrease of PM10 in spring is associated with the weaker Asian dust events recently (Lee et al., 2015; Zong et al., 2021).
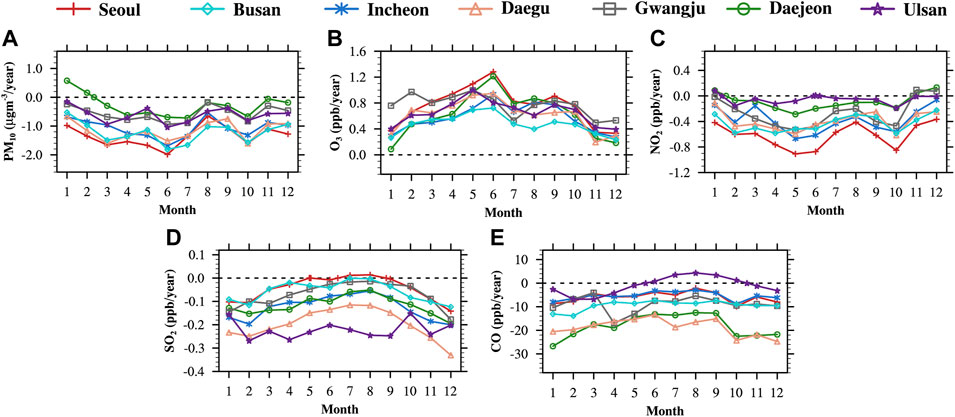
FIGURE 5. Long-term (2002-2020) trends of (A) monthly median PM10 (μg m−3/year), (B) O3 (ppb/year), (C) NO2 (ppb/year), (D) SO2 (ppb/year), and (E) CO (ppb/year) levels in seven megacities, South Korea.
While the signal is less obvious, the monthly pattern of long-tern NO2 trends looks similar to that of PM10 (Figure 5C): larger decreasing in spring and summer, but almost no trend in winter. Reversely, O3 trend is largely positive in summer but small in winter (Figure 5B). Focusing on the O3 trend in Seoul and Busan, we found both large decreasing NO2 and increasing O3, similar to their anti-relationship associated with the NOx titration as shown in Figures 2, 3. In Gwangju, however, NO2 decreasing rate is very small, but O3 increasing rate is still quite large for all months. This is the difficult part to understand the ozone pattern in South Korea; Compared to the trends of other air pollutants, O3 increasing trend is very consistent in all seven megacities regardless of regional difference. The reason is not clear at this present moment, but the influence of larger scale forcing may be resulted in this consistent and significant O3 increase. Future research will be significantly requested for better understanding of O3 trend in Korean megacities.
Although SO2 mean pattern is analogous to the NO2 mean pattern (Figures 2, 3), monthly variation of SO2 trend is a little different: Larger negative trend in winter. Decreasing SO2 in cold winter season means that the environmental policy for SO2 sources has been working well, which is good news to the domestic air quality. In addition, recent large SO2 reduction in China (Sun et al., 2018; Bhardwaj et al., 2019) can be related to the large decrease of wintertime SO2 in South Korea. Summertime SO2 also has the decreasing trend but its magnitude is smaller than wintertime. The irregular pattern in summer is the small SO2 increasing trend in Seoul and Busan, which are two main megacities in South Korea. Considering the increasing trend of 10th percentile SO2 levels in Seoul and Busan (Figure 4), there may exist the increase of background SO2 level in summer for Seoul and Busan, which is not well understood yet. CO trend does not depict the meaningful monthly variation. All seven megacities have clear decreasing trends of CO in all months.
For deeper analyses of median trends in each month, we also compared the trends of 10th and 90th percentile of air pollutants (Supplementary Figures S6, S7). One main finding is that the magnitude of long-term trends become more obvious if 90th percentile values are considered, but less significant with 10th percentile values. In other words, 90th percentile values more significantly illustrate decreasing trends of PM10, NO2, SO2, and CO, and increasing trend of O3 in all months, meaning that the change (i.e., improvement or degradation) of high polluted condition (meaning of 90th percentile values of air pollutants) is a dominant determining factor of long-term trends. This finding supports the previous studies addressing the necessity to control the high polluted condition mainly for better air quality (Park et al., 2021a). If the direction of trends (i.e., increase or decrease) is not identical in accordance with the choice of percentiles, the trend analysis should be performed more carefully. This feature was found in SO2 trend pattern; 10th percentiles of SO2 in Seoul and Busan show the consistent increasing trend, but 90th percentiles show the decreasing trends in all months. In other words, high SO2 cases in Seoul and Busan is getting lesser, but the background SO2 level is slightly increasing. This opposite pattern reveals the complex characteristics of sulfur pollution in the urban region. We do not clearly figure out this difference at this present moment, but anyhow, at least we can recognize the necessity of percentile trend analysis, providing the additional important information in detail.
Finally, we performed the analysis of trends in each day of week. This analysis enables us to check if there is a different trend of urban air pollution between the weekday and weekend period. Although the median trend of air pollutants between weekday and weekend periods is not much different (Figure 6), an interesting feature can be found; decreasing (increasing) trends tend to be stronger (weaker) in the middle of weekdays, but weaker (stronger) in the weekend. Considering that the higher concentration of air pollutants was usually detected in the middle of weekday as reported in some previous studies (e.g., Jin et al., 2005; Gong et al., 2007), urban activities degrading the air quality (e.g., manufacturing and industrial process) looks to be well controlled in South Korea.
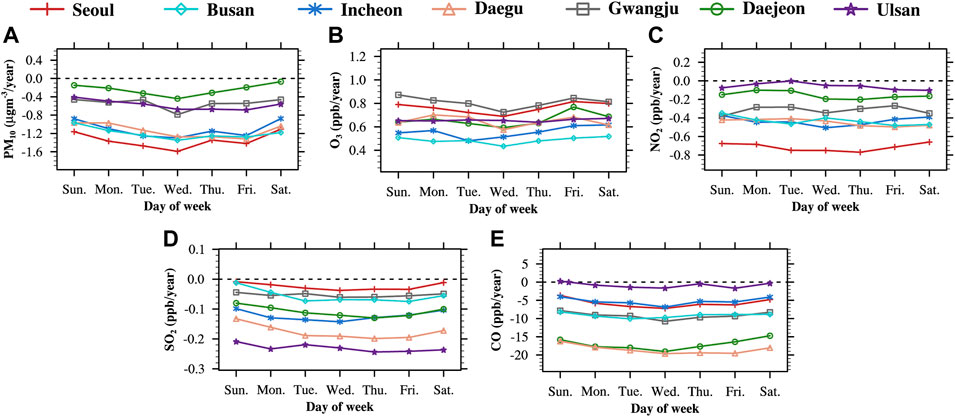
FIGURE 6. For each day of week, long-term (2002–2020) trends of median (A) PM10 (μgm−3/year), (B) O3 (ppb/year), (C) NO2 (ppb/year), (D) SO2 (ppb/year), and (E) CO (ppb/year) levels in seven megacities, South Korea.
Trends of 10th and 90th percentiles are rather different from the median trend patterns; They are opposite between Saturday and Sunday (Supplementary Figures S8, S9). Decrease of 10th and 90th PM10 and NO2 percentiles is rather clear on Saturday but not on Sunday, in general. In contrast, decrease of 10th and 90th SO2 and CO percentiles is strong in Sunday, but weaker in Saturday. Considering that SO2 and CO tend to be more emitted from the fossil fuel combustion rather than the emission of aerosol (PM10) and NO2, we guess that fuel combustion-related industrial activities and manufacturing process may be still active on Saturday, resulted in weak decrease of SO2 and CO. On Sunday, SO2 and CO can be diminished but PM10 and NO2 cannot have a large decrease if industrial activities are really ceased much but private activities are large enough. But this is just conjecture and the reason to induce this Saturday-Sunday difference is not clearly understood yet. Further study will be strongly required for better interpretation.
Lastly, we assessed the mean pattern and long-term variation of air quality in Korean megacities based on CAI values estimated by the combined evaluation of PM10, O3, NO2, SO2, and CO used in this study. As mentioned in chapter 3.1, there are four grades of CAI: Good (CAI from 0 to 50), Moderate (CAI from 51 to 100), Unhealthy (CAI from 101 to 250), and Very unhealthy (CAI > 250). Fortunately, there was no case classified in “Very unhealthy” in our study period. Thus, we examined how many cases were categorized into “Good,” “Moderate,” and “Unhealthy” grades, and how their frequencies have varied (Figure 7).
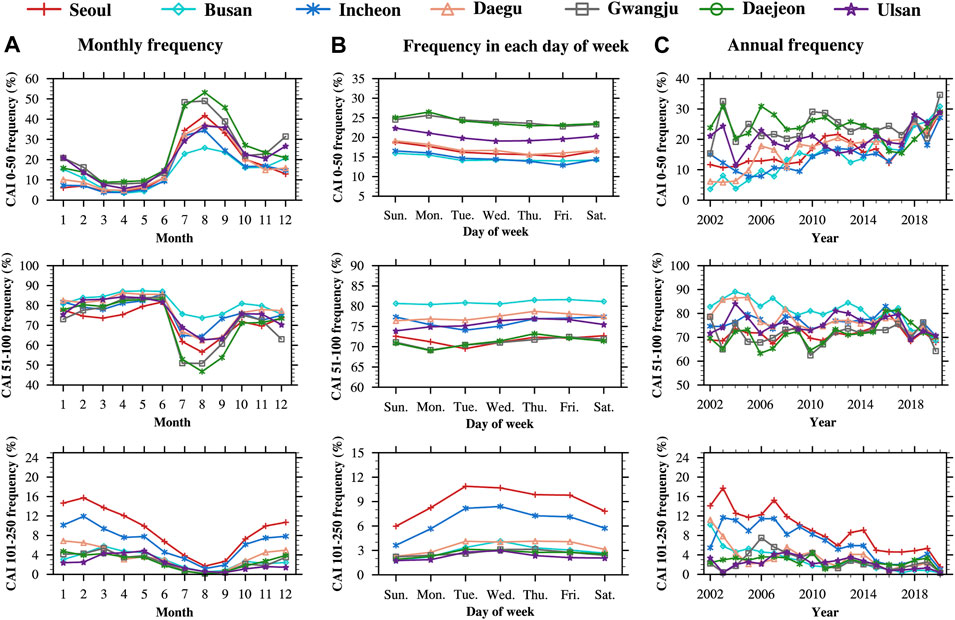
FIGURE 7. During the research period (2002–2020), frequency of CAI grades (CAI “good” for 0-50, CAI “moderate for 51–100, and CAI “unhealthy” for 101–250) in multiple time scale: (A) monthly frequency, (B) frequency in each day of week, and (C) annual frequency in seven megacities, South Korea.
The monthly variation of CAI frequencies (Figure 7A) shows that the frequency of “Unhealthy” is the highest in winter (DJF) when the aerosol and its precursor species is largely emitted and accumulated. Reversely, the frequency of “Good” is generally high in summer (JJA). But there is the large difference among seven megacities; Daejeon and Gwangju show higher, but Busan and Incheon show relatively lower frequency of “Good” grade. In every year of South Korea, the rainy season (called Jangma) occurs from late June to middle of August. Therefore, the air pollutants are much washed out (Kim et al., 2014; Yoo et al., 2014), resulted in high number of “Good” grade. Nevertheless, we can see a weird difference of “Good” grade among seven cities. An interesting feature here is the lower number of “Good” grade in Busan, Incheon, and Ulsan that are located in the coastal region, and these megacities usually have a large number of visitors who enjoy the summer vacation. Probably the anthropogenic emission from these visitors’ activities and accompanying high traffic can disturb the improvement of local air quality. When CAI frequencies were compared among days of week (Figure 7B), there are not many significant features. The only obvious pattern is the weekday-weekend difference of “Unhealthy” frequency, which is about ∼5% at maximum. Here the difference between Saturday and Sunday, and the difference between Monday and other weekdays was also found, as discussed with Figure 3.
In terms of the long-term trends of CAI (Figure 7C), the number of “Moderate” grade is most frequent every year in all seven cities, and its annual variation is consistent from 2002 to 2020, meaning that the normal condition has been well maintained. The number of “Unhealthy” grade is the least in Korean megacities. Different from “Moderate” grade, the number of “Good” and “Unhealthy” shows long-term change: increase of “Good” cases but decrease of “Unhealthy” cases. Specifically, the number of “Good” generally becomes higher, particularly in high-populated megacities (Seoul, Busan, Incheon, and Daegu). In contrast, “Unhealthy” cases tend to decrease, particularly Seoul and Incheon. These results well describe the steady improvement of air quality in Korean megacities during recent ∼20 years. For example, the frequency of “Unhealthy” days in Seoul is higher than “Good” days in 2002, but this pattern becomes totally opposite in 2020. As examined so far, it seems that the decreasing pattern of PM10 and NO2 dominantly leads the advanced air quality in Korean megacities. Nevertheless, Korean megacities still experience ∼5% “Unhealthy” air quality condition in a year. These air quality conditions are determined by the high ozone level that is the only air pollutants showing the increasing trend at this present moment. Korean government will definitely conduct a dense preparation to avoid the health damage from the ozone pollution (Hwang et al., 2016) in the future.
This study investigated several temporal (inter-annual, monthly, and weekly variation) patterns of air pollutants (PM10, O3, NO2, SO2, and CO) in seven megacities in South Korea. Most of air pollutants fortunately show the long-term decrease, but O3 only has the strong increasing trend, meaning that the control of ozone pollution is the urgent issue to mitigate the future urban air pollution in South Korea. From a seasonal point of view, wintertime air pollution is still most serious in Korean cities. Considering the weaker monsoon effect can exacerbate the air pollution over the Korean peninsula and East Asia (Jeong and Park, 2017; Zou et al., 2017), the stronger reduction of local emission is required in the Korean megacities. Also, our analysis of weekly pattern suggested the air quality on Monday and Saturday seems located in the transition between the weekday and weekend. Since the weekly transportation between urban and suburban area becomes invigorative due to the enlargement of megacity area, we may need to examine the air quality in these transition days of week separately from the typical weekday and weekend period. One more point that we would underline in this study is the usefulness of percentile analysis, enabling us to assess the temporal variation of urban air quality in the background and high-polluted condition. We believe that the percentile analysis provides the meaningful idea additionally for the urban air quality diagnosis, not found in the mean-pattern based analysis. Some deeper analyses should be continued with the usage of social information related to the urban activity (e.g., traffic amount, power sources, etc.).
The number and size of megacity is continuously increasing in a global scale, and more people will live in the urban area. Although the governmental policy is prepared for whole country, this is why the environmental policy for the urban region is usually considered more significantly. In spite of recent findings for the large influence of long-range transboundary transport (Lee S. et al., 2019; Lee et al., 2021), synoptic meteorology (Bae et al., 2021; Ku et al., 2021), and climate variability (Jeong et al., 2018; Kim et al., 2021) to the air quality in South Korea, basic tactics to reduce the urban air pollution still lie on the control of local emission and anthropogenic activity. We confirmed this effect based on the COVID-19 period, showing the air quality enhancement by smaller anthropogenic activities (Koo et al., 2020; Park et al., 2021b). The analysis for temporal properties of air pollutants reveals which efforts are urgently requested. Based on this study, we can discover some unwatched features of air quality in Korean megacities; The ozone pollution is consistently serious in all seven megacities for a long time regardless of the local level of NO2, the attention to the SO2 pollution looks still needed for the coastal cities, and air quality on Saturday is not quite clean different from the typical expectation. We hope that these findings will be useful in the policy making processes for the improvement of air quality in Korean megacities.
Publicly available datasets were analyzed in this study. This data can be found here: The surface measurement air pollutants datasets analyzed for this study can be found in the AIRKOREA https://www.airkorea.or.kr/index. The population census datasets analyzed for this study can be found in KOrean Statistical Information Service (KOSIS) https://kosis.kr/index/index.do.
J-HK designed the whole structure of this research, supervised the whole process of this research, and prepared the fund for this research. TL and J-HK performed the analysis mainly with the significant assistance from SG and SP for the establishment of dataset and methodology. YL and JP put the weight on the literature review of this research topic and excavated issues that this research need to examine. All authors participated the repeated discussion based on the results. TL and J-HK wrote the manuscript mainly, and SG, YL, SP, and JP improved the draft manuscript.
This work was supported by the National Research Foundation of Korea (NRF) grant funded by the Korea government (MSIT) (No. NRF-2020R1C1C1011624). This work was also supported from the National Institute of Environmental Research (NIER), funded by the Ministry of Environment (MOE) of the Republic of Korea (NIER 2022-01-01-001).
The authors declare that the research was conducted in the absence of any commercial or financial relationships that could be construed as a potential conflict of interest.
All claims expressed in this article are solely those of the authors and do not necessarily represent those of their affiliated organizations, or those of the publisher, the editors and the reviewers. Any product that may be evaluated in this article, or claim that may be made by its manufacturer, is not guaranteed or endorsed by the publisher.
The Supplementary Material for this article can be found online at: https://www.frontiersin.org/articles/10.3389/fenvs.2022.915531/full#supplementary-material
Almeida, S., Pio, C., Freitas, M., Reis, M., and Trancoso, M. (2006). Source apportionment of atmospheric urban aerosol based on weekdays/weekend variability: Evaluation of road re-suspended dust contribution. Atmos. Environ. 40, 2058–2067. doi:10.1016/j.atmosenv.2005.11.046
Bae, C., Kim, H. C., Kim, B.-U., and Kim, S. (2020). Surface ozone response to satellite-constrained NOx emission adjustments and its implications. Environ. Pollut. 258, 113469. doi:10.1016/j.envpol.2019.113469
Bae, M., Kim, B.-U., Kim, H. C., Kim, J., and Kim, S. (2021). Role of emissions and meteorology in the recent PM2.5 changes in China and South Korea from 2015 to 2018. Environ. Pollut. 270, 116233. doi:10.1016/j.envpol.2020.116233
Bhardwaj, P., Ki, S. J., Kim, Y. H., Woo, J. H., Song, C. K., Park, S. Y., et al. (2019). Recent changes of trans-boundary air pollution over the yellow sea: Implications for future air quality in South Korea. Environ. Pollut. 247, 401–409. doi:10.1016/j.envpol.2019.01.048
Che, H., Xia, X., Zhu, J., Li, Z., Dubovik, O., Holben, B., et al. (2014). Column aerosol optical properties and aerosol radiative forcing during a serious haze-fog month over North China Plain in 2013 based on ground-based sunphotometer measurements. Atmos. Chem. Phys. 14, 2125–2138. doi:10.5194/acp-14-2125-2014
Chen, W., Tang, H., and Zhao, H. (2015). Diurnal, weekly and monthly spatial variations of air pollutants and air quality of Beijing. Atmos. Environ. 119, 21–34. doi:10.1016/j.atmosenv.2015.08.040
Chen, D., Wang, X., Nelson, P., Li, Y., Zhao, N., Zhao, Y., et al. (2017). Ship emission inventory and its impact on the PM2. 5 air pollution in Qingdao Port, North China. Atmos. Environ. 166, 351–361. doi:10.1016/j.atmosenv.2017.07.021
Cho, J., Kim, H., and Chung, Y. (2021). Spatio-temporal changes of PM10 trends in South Korea caused by East Asian atmospheric variability. Air Qual. Atmos. Health 14, 1001–1016. doi:10.1007/s11869-021-00995-y
Choi, K.-C., Lee, J.-J., Bae, C. H., Kim, C.-H., Kim, S., Chang, L.-S., et al. (2014). Assessment of transboundary ozone contribution toward South Korea using multiple source–receptor modeling techniques. Atmos. Environ. 92, 118–129. doi:10.1016/j.atmosenv.2014.03.055
Choi, Y., Kim, H., and Lee, J.-T. (2018). Temporal variability of short term effects of PM10 on mortality in Seoul, Korea. Sci. total Environ. 644, 122–128. doi:10.1016/j.scitotenv.2018.06.275
Choi, S.-W., Kim, T., Lee, H.-K., Kim, H.-C., Han, J., Lee, K.-B., et al. (2020). Analysis of the national air pollutant emission inventory (CAPSS 2016) and the major cause of change in republic of Korea. Asian J. Atmos. Environ 14, 422–445. doi:10.5572/ajae.2020.14.4.422
Clarke, K., Kwon, H.-O., and Choi, S.-D. (2014). Fast and reliable source identification of criteria air pollutants in an industrial city. Atmos. Environ. 95, 239–248. doi:10.1016/j.atmosenv.2014.06.040
Crawford, J. H., Ahn, J.-Y., Al-Saadi, J., Chang, L., Emmons, L. K., Kim, J., et al. (2021). The Korea–United States air quality (KORUS-AQ) field study. Elementa 9, 1–27. doi:10.1525/elementa.2020.00163
Eck, T., Holben, B., Kim, J., Beyersdorf, A., Choi, M., Lee, S., et al. (2020). Influence of cloud, fog, and high relative humidity during pollution transport events in South Korea: Aerosol properties and PM2.5 variability. Atmos. Environ. 232, 117530. doi:10.1016/j.atmosenv.2020.117530
Elansky, N., Shilkin, A., Ponomarev, N., Semutnikova, E., and Zakharova, P. (2020). Weekly patterns and weekend effects of air pollution in the Moscow megacity. Atmos. Environ. 224, 117303. doi:10.1016/j.atmosenv.2020.117303
Ghim, Y. S., Chang, Y.-S., and Jung, K. (2015). Temporal and spatial variations in fine and coarse particles in Seoul, Korea. Aerosol Air Qual. Res. 15, 842–852. doi:10.4209/aaqr.2013.12.0362
Ghim, Y. S., Kim, J. Y., and Chang, Y.-S. (2017). Concentration variations in particulate matter in Seoul associated with Asian dust and smog episodes. Aerosol Air Qual. Res. 17, 3128–3140. doi:10.4209/aaqr.2016.09.0414
Gong, D. Y., Ho, C. H., Chen, D., Qian, Y., Choi, Y. S., Kim, J., et al. (2007). Weekly cycle of aerosol‐meteorology interaction over China. J. Geophys. Res. 112, D22202. doi:10.1029/2007jd008888
Huang, W., Tan, J., Kan, H., Zhao, N., Song, W., Song, G., et al. (2009). Visibility, air quality and daily mortality in Shanghai, China. Sci. Total Environ. 407, 3295–3300. doi:10.1016/j.scitotenv.2009.02.019
Huryn, S. M., and Gough, W. A. (2014). Impact of urbanization on the ozone weekday/weekend effect in Southern Ontario, Canada. Urban Clim. 8, 11–20. doi:10.1016/j.uclim.2014.03.005
Hwang, S. H., Choi, Y.-H., Paik, H. J., Wee, W. R., Kim, M. K., Kim, D. H., et al. (2016). Potential importance of ozone in the association between outdoor air pollution and dry eye disease in South Korea. JAMA Ophthalmol. 134, 503. doi:10.1001/jamaophthalmol.2016.0139
Jeong, J. I., and Park, R. J. (2017). Winter monsoon variability and its impact on aerosol concentrations in East Asia. Environ. Pollut. 221, 285–292. doi:10.1016/j.envpol.2016.11.075
Jeong, J. I., Park, R. J., and Yeh, S.-W. (2018). Dissimilar effects of two el niño types on PM2.5 concentrations in East Asia. Environ. Pollut. 242, 1395–1403. doi:10.1016/j.envpol.2018.08.031
Jin, M., Shepherd, J. M., and King, M. D. (2005). Urban aerosols and their variations with clouds and rainfall: A case study for New York and houston. J. Geophys. Res. 110, D10S20. doi:10.1029/2004jd005081
KECO (2022a). Introduction to comprehensive air-quality index (CAI). Incheon, Republic of Korea Korea Environmental Corporation. [Online]. Available at: https://www.airkorea.or.kr/eng/khaiInfo?pMENU_NO=166 (Accessed March 13, 2022).
KECO (2022b). NIER (National Institute of Environmental Research) dataset from air quality monitoring sites. Incheon, Republic of Korea Korea Environmental Corporation. [Online]. Available at: https://www.airkorea.or.kr/web/last_amb_hour_data?pMENU_NO=123 (Accessed March 13, 2022).
Kim, B.-J., Kwon, J.-W., Seo, J.-H., Kim, H.-B., Lee, S.-Y., Park, K.-S., et al. (2011). Association of ozone exposure with asthma, allergic rhinitis, and allergic sensitization. Ann. Allergy, Asthma & Immunol. 107, 214–219.e1. doi:10.1016/j.anai.2011.05.025
Kim, S., Hong, K.-H., Jun, H., Park, Y.-J., Park, M., Sunwoo, Y., et al. (2014). Effect of precipitation on air pollutant concentration in Seoul, Korea. Asian J. Atmos. Environ. 8, 202–211. doi:10.5572/ajae.2014.8.4.202
Kim, H. C., Kim, S., Kim, B.-U., Jin, C.-S., Hong, S., Park, R., et al. (2017). Recent increase of surface particulate matter concentrations in the Seoul Metropolitan Area, Korea. Sci. Rep. 7, 4710. doi:10.1038/s41598-017-05092-8
Kim, S., Jeong, D., Sanchez, D., Wang, M., Seco, R., Blake, D., et al. (2018). The controlling factors of photochemical ozone production in Seoul, South Korea. Aerosol Air Qual. Res. 18, 2253–2261. doi:10.4209/aaqr.2017.11.0452
Kim, J.-H., Kim, S.-J., Youn, D., Kim, M.-K., Kim, J.-H., Kim, J., et al. (2021). Impact of north atlantic-East Asian teleconnections on extremely high january PM10 cases in Korea. Environ. Pollut. 290, 118051. doi:10.1016/j.envpol.2021.118051
Kim, Y. P., and Lee, G. (2018). Trend of air quality in Seoul: Policy and science. Aerosol Air Qual. Res. 18, 2141–2156. doi:10.4209/aaqr.2018.03.0081
Koo, J.-H., Kim, J., Lee, J., Eck, T. F., Lee, Y. G., Park, S. S., et al. (2016). Wavelength dependence of Ångström exponent and single scattering albedo observed by skyradiometer in Seoul, Korea. Atmos. Res. 181, 12–19. doi:10.1016/j.atmosres.2016.06.006
Koo, J.-H., Kim, J., Lee, Y. G., Park, S. S., Lee, S., Chong, H., et al. (2020). The implication of the air quality pattern in South Korea after the COVID-19 outbreak. Sci. Rep. 10, 22462. doi:10.1038/s41598-020-80429-4
KOSIS. 2021. Population census [online]. Daejeon, Republic of Korea Korean Statistical Information Service. Available at: https://kosis.kr/statHtml/statHtml.do?orgId=101&tblId=DT_1IN1502&vw_cd=MT_ZTITLE&list_id=A11_2015_1_10_10&scrId=&seqNo=&lang_mode=ko&obj_var_id=&itm_id=&conn_path=MT_ZTITLE&path=%252FstatisticsList%252FstatisticsListIndex.do [Accessed 13 March 2022].
Ku, H.-Y., Noh, N., Jeong, J.-H., Koo, J.-H., Choi, W., Kim, B.-M., et al. (2021). Classification of large-scale circulation patterns and their spatio-temporal variability during High-PM10 events over the Korean Peninsula. Atmos. Environ. 262, 118632. doi:10.1016/j.atmosenv.2021.118632
Lee, M. (2014). An analysis on the concentration characteristics of PM2. 5 in Seoul, Korea from 2005 to 2012. Asia. Pac. J. Atmos. Sci. 50, 585–594. doi:10.1007/s13143-014-0048-z
Lee, Y. G., Ho, C.-H., Kim, J.-H., and Kim, J. (2015). Quiescence of Asian dust events in South Korea and Japan during 2012 spring: Dust outbreaks and transports. Atmos. Environ. 114, 92–101. doi:10.1016/j.atmosenv.2015.05.035
Lee, S., Kim, J., Choi, M., Hong, J., Lim, H., Eck, T. F., et al. (2019a). Analysis of long-range transboundary transport (LRTT) effect on Korean aerosol pollution during the KORUS-AQ campaign. Atmos. Environ. 204, 53–67. doi:10.1016/j.atmosenv.2019.02.020
Lee, S. W., Yon, D. K., James, C. C., Lee, S., Koh, H. Y., Sheen, Y. H., et al. (2019b). Short-term effects of multiple outdoor environmental factors on risk of asthma exacerbations: Age-stratified time-series analysis. J. Allergy Clin. Immunol. 144, 1542–1550.e1. e1. doi:10.1016/j.jaci.2019.08.037
Lee, D., Wang, S.-Y. S., Zhao, L., Kim, H. C., Kim, K., Yoon, J.-H., et al. (2020). Long-term increase in atmospheric stagnant conditions over northeast Asia and the role of greenhouse gases-driven warming. Atmos. Environ. 241, 117772. doi:10.1016/j.atmosenv.2020.117772
Lee, S., Kim, M., Kim, S.-Y., Lee, D.-W., Lee, H., Kim, J., et al. (2021). Assessment of long-range transboundary aerosols in Seoul, South Korea from geostationary ocean color imager (GOCI) and ground-based observations. Environ. Pollut. 269, 115924. doi:10.1016/j.envpol.2020.115924
Li, X., Chen, Q., Zheng, X., Li, Y., Han, M., Liu, T., et al. (2019). Effects of ambient ozone concentrations with different averaging times on asthma exacerbations: A meta-analysis. Sci. Total Environ. 691, 549–561. doi:10.1016/j.scitotenv.2019.06.382
Liu, S., Fang, S., Liang, M., Sun, W., and Feng, Z. (2019). Temporal patterns and source regions of atmospheric carbon monoxide at two background stations in China. Atmos. Res. 220, 169–180. doi:10.1016/j.atmosres.2019.01.017
Luo, Y., Zheng, X., Zhao, T., and Chen, J. (2014). A climatology of aerosol optical depth over China from recent 10 years of MODIS remote sensing data. Int. J. Climatol. 34, 863–870. doi:10.1002/joc.3728
Marr, L. C., and Harley, R. A. (2002). Modeling the effect of weekday− weekend differences in motor vehicle emissions on photochemical air pollution in central California. Environ. Sci. Technol. 36, 4099–4106. doi:10.1021/es020629x
Masiol, M., Agostinelli, C., Formenton, G., Tarabotti, E., and Pavoni, B. (2014). Thirteen years of air pollution hourly monitoring in a large city: Potential sources, trends, cycles and effects of car-free days. Sci. Total Environ. 494, 84–96. doi:10.1016/j.scitotenv.2014.06.122
ME (2006). Comprehensive Air-Quality index (CAI) development·dissemination for air quality evaluation. Sejong, Republic of Korea: Ministry of Envrionment. [Online]. Available at: http://www.me.go.kr/home/web/board/read.do;jsessionid=AMjygdihuvFIT8wbEhB7SOdeVHrMwgmZ6cxfrxLtzSaAcD2mgGXhzHak2FOnDAwS.meweb2vhost_servlet_engine1?pagerOffset=7650&maxPageItems=10&maxIndexPages=10&searchKey=&searchValue=&menuId=&orgCd=&boardMasterId=1&boardCategoryId=&boardId=149437&decorator= (Accessed March 13, 2022).
ME·NIER (2021). Instruction of installation and management for ir quality monitoring network [Online]. Ministry of Environment·National Institute of Environmental Research. Available: https://www.airkorea.or.kr/web/board/3/267/?pMENU_NO=145 (Accessed March 13, 2022).
Oh, I.-B., Kim, Y.-K., Hwang, M.-K., Kim, C.-H., Kim, S., Song, S.-K., et al. (2010). Elevated ozone layers over the Seoul Metropolitan Region in Korea: Evidence for long-range ozone transport from eastern China and its contribution to surface concentrations. J. Appl. Meteorology Climatol. 49, 203–220. doi:10.1175/2009jamc2213.1
Park, D.-H., Kim, S.-W., Kim, M.-H., Yeo, H., Park, S. S., Nishizawa, T., et al. 2021a. Impacts of local versus long-range transported aerosols on PM10 concentrations in Seoul, Korea: an estimate based on 11-year PM10 and lidar observations. Science of the Total Environment 750, 141739. doi:10.1016/j.scitotenv.2020.141739
Park, H., Jeong, S., Koo, J.-H., Sim, S., Bae, Y., Kim, Y., et al. (2021b). Lessons from COVID-19 and Seoul: Effects of reduced human activity from social distancing on urban CO2 concentration and air quality. Aerosol Air Qual. Res. 21, 200376. doi:10.4209/aaqr.2020.07.0376
Pope, C. A., Muhlestein, J. B., May, H. T., Renlund, D. G., Anderson, J. L., Horne, B. D., et al. (2006). Ischemic heart disease events triggered by short-term exposure to fine particulate air pollution. Circulation 114, 2443–2448. doi:10.1161/circulationaha.106.636977
Seo, J., Youn, D., Kim, J., and Lee, H. (2014). Extensive spatiotemporal analyses of surface ozone and related meteorological variables in South Korea for the period 1999–2010. Atmos. Chem. Phys. 14, 6395–6415. doi:10.5194/acp-14-6395-2014
Shin, H., Cho, K., Han, J., Kim, J., and Kim, Y. (2012). The effects of precursor emission and background concentration changes on the surface ozone concentration over Korea. Aerosol Air Qual. Res. 12, 93–103. doi:10.4209/aaqr.2011.09.0141
Sorte, S., Rodrigues, V., Borrego, C., and Monteiro, A. (2020). Impact of harbour activities on local air quality: A review. Environ. Pollut. 257, 113542. doi:10.1016/j.envpol.2019.113542
SS (2022). Key policy: Air pollution monitoring network [online]. Seoul, Republic of Korea: Seoul solution. Available at: https://seoulsolution.kr/en/node/6540 (Accessed March 22, 2022).
Stavrakou, T., MþLLER, J.-F., Bauwens, M., Boersma, K., and Van Geffen, J. (2020). Satellite evidence for changes in the NO2 weekly cycle over large cities. Sci. Rep. 10, 10066. doi:10.1038/s41598-020-66891-0
Su, T., Li, Z., and Kahn, R. (2018). Relationships between the planetary boundary layer height and surface pollutants derived from lidar observations over China: Regional pattern and influencing factors. Atmos. Chem. Phys. 18, 15921–15935. doi:10.5194/acp-18-15921-2018
Sun, W., Shao, M., Granier, C., Liu, Y., Ye, C., Zheng, J., et al. (2018). Long‐term trends of Anthropogenic SO2, NOx, CO, and NMVOCs emissions in China. Earth's. Future 6, 1112–1133. doi:10.1029/2018ef000822
Tsai, Y. I., and Chen, C.-L. (2006). Characterization of Asian dust storm and non-Asian dust storm PM2.5 aerosol in southern Taiwan. Atmos. Environ. 40, 4734–4750. doi:10.1016/j.atmosnv.2006.04.038
Vuong, Q. T., Park, M.-K., Van Do, T., Thang, P. Q., and Choi, S.-D. (2022). Driving factors to air pollutant reductions during the implementation of intensive controlling policies in 2020 in Ulsan, South Korea. Environ. Pollut. 292. doi:10.1016/j.envpol.2021.118380
Wang, T., Xue, L., Brimblecombe, P., Lam, Y. F., Li, L., Zhang, L., et al. (2017). Ozone pollution in China: A review of concentrations, meteorological influences, chemical precursors, and effects. Sci. Total Environ. 575, 1582–1596. doi:10.1016/j.scitotenv.2016.10.081
Xia, X., Eck, T. F., Holben, B. N., Phillippe, G., and Chen, H. (2008). Analysis of the weekly cycle of aerosol optical depth using AERONET and MODIS data. J. Geophys. Res. 113, D14217. doi:10.1029/2007jd009604
Xie, Y., Zhao, B., Zhang, L., and Luo, R. (2015). Spatiotemporal variations of PM2. 5 and PM10 concentrations between 31 Chinese cities and their relationships with SO2, NO2, CO and O3. Particuology 20, 141–149. doi:10.1016/j.partic.2015.01.003
Xing, Y.-F., Xu, Y.-H., Shi, M.-H., and Lian, Y.-X. (2016). The impact of PM2.5 on the human respiratory system. J. Thorac. Dis. 8, E69–E74. doi:10.3978/j.issn.2072-1439.2016.01.19
Yang, M., Bell, T. G., Hopkins, F. E., and Smyth, T. J. (2016). Attribution of atmospheric sulfur dioxide over the English Channel to dimethyl sulfide and changing ship emissions. Atmos. Chem. Phys. 16, 4771–4783. doi:10.5194/acp-16-4771-2016
Yeo, M. J., and Kim, Y. P. (2021). Long-term trends of surface ozone in Korea. J. Clean. Prod. 294, 125352. doi:10.1016/j.jclepro.2020.125352
Yoo, J.-M., Lee, Y.-R., Kim, D., Jeong, M.-J., Stockwell, W. R., Kundu, P. K., et al. (2014). New indices for wet scavenging of air pollutants (O3, CO, NO2, SO2, and PM10) by summertime rain. Atmos. Environ. 82, 226–237. doi:10.1016/j.atmosenv.2013.10.022
Yoo, J.-M., Jeong, M.-J., Kim, D., Stockwell, W. R., Yang, J.-H., Shin, H.-W., et al. (2015). Spatiotemporal variations of air pollutants (O3, NO2, SO2, CO, PM10, and VOCs) with land-use types. Atmos. Chem. Phys. 15, 10857–10885. doi:10.5194/acp-15-10857-2015
Yoon, J., Pozzer, A., Chang, D. Y., Lelieveld, J., Kim, J., Kim, M., et al. (2016). Trend estimates of AERONET-observed and model-simulated AOTs between 1993 and 2013. Atmos. Environ. 125, 33–47. doi:10.1016/j.atmosenv.2015.10.058
Zhang, X., Liu, J., Han, H., Zhang, Y., Jiang, Z., Wang, H., et al. (2020). Satellite-observed variations and trends in carbon monoxide over Asia and their sensitivities to biomass burning. Remote Sens. 12, 830. doi:10.3390/rs12050830
Zhang, Y.-L., and Cao, F. (2015). Fine particulate matter (PM2.5) in China at a city level. Sci. Rep. 5, 14884. doi:10.1038/srep14884
Zhao, S., Yu, Y., Yin, D., He, J., Liu, N., Qu, J., et al. (2016). Annual and diurnal variations of gaseous and particulate pollutants in 31 provincial capital cities based on in situ air quality monitoring data from China National Environmental Monitoring Center. Environ. Int. 86, 92–106. doi:10.1016/j.envint.2015.11.003
Zong, Q., Mao, R., Gong, D.-Y., Wu, C., Pu, B., Feng, X., et al. (2021). Changes in dust activity in spring over East Asia under a global warming scenario. Asia. Pac. J. Atmos. Sci. 57, 839–850. doi:10.1007/s13143-021-00224-7
Keywords: South Korea, megacity, PM10, NO2, ozone, SO2, carbon monoxide
Citation: Lee T, Go S, Lee YG, Park SS, Park J and Koo J-H (2022) Temporal variability of surface air pollutants in megacities of South Korea. Front. Environ. Sci. 10:915531. doi: 10.3389/fenvs.2022.915531
Received: 08 April 2022; Accepted: 28 June 2022;
Published: 22 July 2022.
Edited by:
Yuzhong Zhang, Westlake University, ChinaCopyright © 2022 Lee, Go, Lee, Park, Park and Koo. This is an open-access article distributed under the terms of the Creative Commons Attribution License (CC BY). The use, distribution or reproduction in other forums is permitted, provided the original author(s) and the copyright owner(s) are credited and that the original publication in this journal is cited, in accordance with accepted academic practice. No use, distribution or reproduction is permitted which does not comply with these terms.
*Correspondence: Ja-Ho Koo, emFjaDQ1QHlvbnNlaS5hYy5rcg==
Disclaimer: All claims expressed in this article are solely those of the authors and do not necessarily represent those of their affiliated organizations, or those of the publisher, the editors and the reviewers. Any product that may be evaluated in this article or claim that may be made by its manufacturer is not guaranteed or endorsed by the publisher.
Research integrity at Frontiers
Learn more about the work of our research integrity team to safeguard the quality of each article we publish.