 Samuel Franco-Luesma1,2*
 Victoria Lafuente1
 María Alonso-Ayuso1Ana Bielsa1Iraj Kouchami-Sardoo3José Luis Arrúe1
 Jorge Álvaro-Fuentes1
- 1Soil and Water Department, Estación Experimental de Aula Dei (EEAD), Spanish National Research Council (CSIC), Zaragoza, Spain
- 2Institute for Meteorology and Climate Research, Atmospheric Environmental Research (IMK-IFU), Karlsruhe Institute of Technology (KIT), Karlsruhe, Germany
- 3Department of Soil Science, College of Agriculture, Vali-e-Asr University of Rafsanjan, Rafsanjan, Iran
Maize is a major irrigated crop in Mediterranean areas and its typical intensive management may impact soil nitrous oxide (N2O) emissions. In these irrigated continuous maize systems, the legumes incorporation as well as adjusted nitrogen (N) fertilization might be interesting strategies to reduce soil N2O emissions. The objective of this study was to assess the impact of cropping diversification and different N rates on soil N2O emissions in flooded irrigated maize under Mediterranean conditions. To achieve this, two cropping systems (maize monoculture system, MC; and pea -maize rotation, MP) and 3N rates (unfertilized, 0N; medium rate, MN; and high rate, HN) were evaluated in a field experiment established in NE Spain during 2 years (2019; 2020). During the studied period, the N rate had a significant effect on soil N2O emissions, with a non-linear positive response of cumulative soil N2O emissions to N rates. In both systems, quick and high increases of soil N2O fluxes were observed immediately after the N application reaching 55 and 100 mg N2O-N m−2 day−1 in MC and MP, respectively. Both years, the pea phase of the MP rotation showed greater cumulative N2O emissions than the fallow of MC. However, N2O losses in the maize phase were similar (2019) or even higher (2020) in MC than in MP. Moreover, in both seasons, the MN treatments showed lower yield-scaled N2O emissions and N emission factor than the HN treatments, being this last lower than 1% in all cases. The results obtained showed that in irrigated Mediterranean conditions the replacement of a fallow by a legume, together with an adjusted N fertilization are favourable strategies to mitigate soil N2O emissions in high-yielding maize systems.
Introduction
Semiarid Mediterranean areas are characterized by high solar radiation conditions and long frost-free periods that, combined with irrigated systems, lead to high crop productivity (Cavero et al., 2003). Although these conditions would allow to increase crop diversification, one of the most common systems in these areas is the maize monoculture, which is normally produced under high-intensive conditions (Berenguer et al., 2008; Cavero et al., 2018). The large amount of fertilizer applied in these intensive agricultural systems is behind great N losses and, indeed, these irrigated agricultural areas are particularly susceptible to groundwater pollution (Quemada et al., 2013). Moreover, N fertilization is the main source of soil N2O emissions in agriculture, a potent greenhouse gas (GHG) (Syakila and Kroeze, 2011; IPCC, 2014). Besides, the changes in the soil water content and soil structure resulting from these intensive practices may influence the bacterial processes of nitrification and denitrification that control N2O production in the soil (Butterbach-Bahl et al., 2013).
Over the last decade, crop diversification, including legumes, is becoming a common practice to reduce the external N supplies and the environmental impacts associated with the highly intensive agriculture systems (Lin, 2011; Sanz-Cobena et al., 2014). The inclusion of legume crops in the rotation is an interesting strategy to provide environmental benefits and increase the sustainability of farming (Preissel et al., 2015; Lötjönen and Ollikainen, 2017). Due to the legume crops’ ability to fix N and their low C/N ratio, they are an adequate management practice to increase soil fertility, making crop rotations less dependent on N inputs (Drinkwater et al., 1998; Sant'Anna et al., 2018; De Antoni Migliorati et al., 2021).
Under Mediterranean irrigated conditions, Cela et al. (2011) and Salmerón et al. (2010, 2014) carried out different studies to assess the impact of legume crop rotations on the N availability for the subsequent crop, and observed that legumes allowed a reduction in the N fertilizer rate of the following maize crop by maintaining the grain yields. Regarding the impact on soil N2O emissions, different authors observed higher N2O emissions in crop rotations including legumes (Drury et al., 2008). Adviento-Borbé et al. (2010) observed a higher N2O emission in a maize-alfalfa rotation compared to a maize monoculture under temperate field conditions. In agreement with the previous studies, Davis et al. (2019) found an increase in soil N2O emissions for the legume cover crops compared to bare soil. Likewise, (Saha et al., 2021) reported greater emissions during the maize phase when the precedent crop was a legume. Besides, higher soil N2O fluxes during the growing period of a legume cover crop compared to a fallow were also reported in Mediterranean conditions (Sanz-Cobena et al., 2014; Guardia et al., 2016). In contrast to the previous studies, (Olivera et al., 2021) did not observe differences or, even, lower N2O losses in cereal phases after legumes compared to cereal monocultures under Mediterranean conditions. However, if the N supplied by the legume is considered when adjusting the N fertilizer rate of the following crop in the rotation, this negative-side effect can be partially offset and no differences would be observed in the cumulative N2O emission of the whole cropping period (Lemke et al., 2007; Guardia et al., 2016; Hansen et al., 2019).
In Mediterranean agroecosystems, the optimization of N fertilization has a GHG mitigation potential ranging from 30% to 50% compared to a non-adjusted practice (Sanz-Cobena et al., 2017). Different studies have shown that high N fertilizer rates lead to greater soil N2O emissions in maize monocultures. For example, (Pareja-Sánchez et al., 2019, Pareja-Sánchez et al., 2020) observed an increase in soil N2O emissions by increasing the amount of N applied in a maize monoculture. Likewise, (Cayuela et al., 2017), in a meta-analysis study for different crops including maize in the Mediterranean region, reported an increment in the emission factor (EF) by increasing the N application. Nevertheless, these studies did not include crop rotation systems with legumes.
Therefore, the combination of the inclusion of legume crops in the rotations and different N fertilizer rates can increase sustainability in irrigated maize systems under semiarid Mediterranean conditions while maintaining their high crop productivity. More studies combining both practices would allow to quantify their impact on N2O emissions and contribute to design more sustainable agricultural practices in these areas. Accordingly, the general objective of this study was to assess the impact of different N fertilization rates on the soil N2O emissions in different cropping systems (maize monoculture and pea-maize rotation) under irrigated Mediterranean conditions during 2 years.
Material and methods
Site description
A 2-years field study (November 2018 to November 2020) was carried out at the research farm of the Aula Dei Experimental Station (EEAD-CSIC) in the province of Zaragoza, Spain (41º42′N, 0º49′W, 225 m altitude), covering two complete growing seasons of a maize monoculture system and a pea-maize rotation. The soil is a Typic Xerofluvent (Survey Staff, 2015) with a silty loam texture, characterized by a basic pH and low contents of carbon (C) and nitrogen (N) and with a carbonate (CaCO3) content higher than 30% (Table 1). The area is characterized by a Mediterranean semiarid climate with a mean annual air temperature of 14.1°C, mean annual precipitation of 298 mm and mean annual reference evapotranspiration (ETo) of 1,243 mm. Daily mean air temperature, daily precipitation, daily ETo and MP and MC irrigation for the given experimental period are presented in Figure 1.
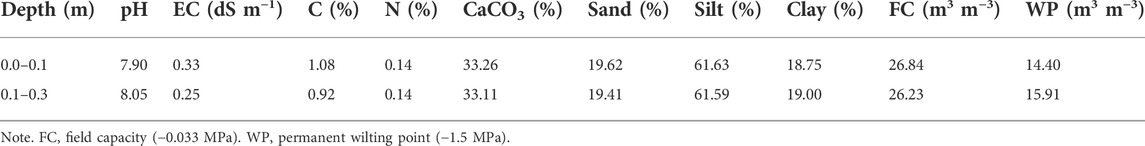
TABLE 1. Soil characteristics at the field site.
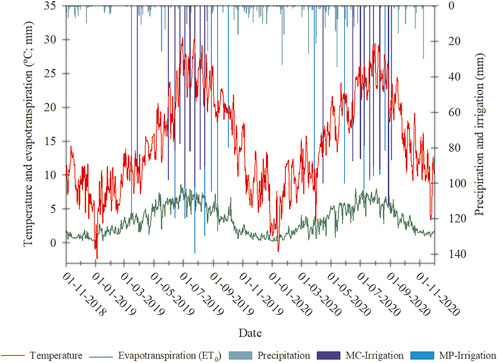
FIGURE 1. Daily mean air temperature (red continuous line), reference evapotranspiration (ETo) (green continuous line), precipitation (green vertical bars), maize monoculture (MC) system irrigation (purple vertical bars) and pea-maize (MP) cropping system irrigation (blue vertical bars) and throughout the entire experimental period.
Experimental design and management practices
The experimental layout consisted of a split-block design with three replications and a plot size of 6 × 25 m. The historical management of the field consisted of alternating different cereal crops, mainly winter wheat (Triticum aestivum L.) and maize under conventional tillage and flood irrigation. In August 2018, a field of 0.6 ha was divided into two parts. In one part, a maize monoculture (MC) was established while in the other part a pea-maize rotation (MP) was set up. Besides, in both cropping systems, three different N rates were tested (i.e., control or unfertilized, 0N; medium rate, MN; and high rate, HN).
Nitrogen application rates were selected based on the typical amounts of N applied for irrigated maize cropping systems in the region, which are between 300 and 350 kg N ha−1 (Sisquella et al., 2004). Likewise, based on previous studies carried out in the same region, a reduction of 50 kg N ha−1 was established for the maize crop after the pea (Salmerón et al., 2011).
Under the MC cropping system, the N application rates selected were 0, 200 and 400 kg N ha−1 for 0N, MN, and HN, respectively. The total amount of N in each treatment was split into two applications, a quarter of the total N at pre-sowing application and the rest at one top-dressing application at the V8-V10 maize growth stage, when maize plant present 8 to 10 developed leaves. In 2019, the pre-sowing application under the MC cropping system consisted of an NPK 8-15-15 fertilizer compound at 0, 625 and 1,250 kg ha−1 application rates for 0N, MN, and HN treatments, respectively. In 2020, the pre-sowing application consisted of 0, 185, and 370 kg ha−1 of calcium ammonium nitrate (CAN 27%) for 0N, MN, and HN treatments, respectively, together with 1,000 kg ha−1 of an 8–10 PK fertilizer compound in all treatments. In both growing seasons, the top-dressing consisted of CAN 27% application up to the N rate established (Supplementary Table S1).
Fertilization for the MP cropping system was different between cropping phases. For the pea phase, one application of a 10–12 PK fertilizer compound at 400 kg ha−1 was done before pea sowing in the 2019 growing season. Pea did not receive any N fertilization. During the maize phase, N applications were 0, 150, and 350 kg N ha−1 for 0N, MN, and HN, respectively. The total amount of N fertilizer was split into two applications, a third of the total N before maize sowing and the rest at one top-dressing application at the V8-V10 maize growth stage in the form of CAN 27%.
Field management practices and their timing varied between cropping systems (Supplementary Table 1S). In the MC, cropping system tillage operations consisted of one pass of a disk harrow and one pass of a subsoiler to 0.30 m depth, followed by one pass of a rotary tiller for preparing the maize seeding bed. In the MP cropping system, tillage operations for both pea seasons consisted of one pass of a disk harrow followed by one pass of a rotary tiller before sowing. In the 2019 growing season, maize after pea was sown under no-tillage conditions, while in 2020 one pass of a disk harrow and one pass of a rotary tiller were performed to ameliorate soil compaction after the second pea season. In both growing seasons, maize cv. Pioneer P1921 (FAO 700) was sown in rows 75 cm apart at a planting density of 89,500 plants ha−1 under the MC cropping system. Under the MP cropping system, pea cv. Cartouche and cv. Furious were sown at 350 and 325 kg of seed ha−1 in the 2019 and 2020 growing seasons, respectively, and maize cv. DKC5032YG (FAO 400) was sown in rows 75 cm apart at a planting density of 89,500 plants ha−1. Maize harvest was done with a commercial combine and then the maize stover was chopped. From harvest to the subsequent maize sowing (fallow period), the soil was left unvegetated and only covered by the stover under the MC cropping system. In both growing seasons, pea residues were chopped after harvest. Differences in the maize growing cycle between MP and MC modified the timing of the different management practices in each cropping system (Supplementary Table 1S).
Both cropping systems were irrigated under flood conditions. Maize crop irrigation requirement (CIR) was determined weekly by subtracting the effective precipitation, 75% of the total weekly precipitation (Dastane, 1978), to the weekly crop evapotrantspiration (ETc), considering an irrigation efficiency of 75%. Maize daily ETc was obtained by multiplying the reference evapotranspiration (ETo), estimated using the FAO Penman–Monteith method (Allen et al., 1998), and the maize crop coefficient (Kc). Maize crop coefficient was determined using a thermal time function developed on the same experimental farm (Kiniry, 1991; Martínez-Cob et al., 2008). Pea irrigation was based on crop development coupled with the soil water content. The total amount of irrigation water applied in the MP cropping system was 1,027 and 861 mm in 2019 and 2020, respectively, distributed in nine different irrigation events. Under the MC cropping system, 826 and 743 mm of irrigation water were applied in different irrigation events for the 2019 and the 2020 growing seasons, respectively (Figure 1). Weed control was carried out by applying a pre-emergence and post-emergence herbicide for the maize, while only a pre-emergence application was done for the pea. No pesticides were applied to the maize or the pea crops.
Soil, plant and gas sampling and analyses
Soil temperature at 5 cm depth and soil moisture at 0–5 cm depth were measured on every gas sampling date using a Crison TM 65 probe (Carpi, Italy) and GS3 soil moisture probes (Decagon Devices, Pullman, WA, United States), respectively. Soil water-filled pore space (WFPS) was calculated using bulk density and assuming a soil particle density of 2.65 Mg m−3 (Danielson and Sutherland, 1986). Soil mineral N content (ammonium plus nitrate) from the 0–5 cm soil depth was determined by extracting 20 g of fresh soil with 100 ml of 2 M KCl. The extracts were frozen and later analysed by spectrophotometry.
Soil N2O emissions were measured with the closed chamber technique (Hutchinson and Mosier, 1981) using polyvinyl chloride (PVC) chambers (20 cm height and 31.5 cm internal diameter) yielding an internal volume of 15.5 L and coated with white thermal paint (Imperlux Termic Outdoor; Arelux, Zaragoza, Spain) to diminish internal increases in temperature. In November 2018, a ring was inserted 5 cm into the soil in each plot, in the inter-row space, removing it only for tillage, sowing and harvesting operations.
During the pea phase of the MP rotation and the fallow phase of the MC system, gas sampling frequency consisted of one sampling every 21 days. However, during the maize phase of both cropping systems, the gas sampling frequency was increased. Thus, weekly measurements were performed from sowing to maize tasselling growth stage (VT) and every 2 weeks from VT stage until harvest. Moreover, gas sampling frequency was increased during fertilization events, taking gas samples 24 h before and 24, 48, 72, 96, 144, and 192 h after fertilization. Likewise, gas sampling frequency was increased after each irrigation event. In each gas sampling 20 ml of sample were taken in each chamber and transfer to a 12 ml Exetainer ® borosilicate glass vial (model 038W, Labco, High Wycombe, United kingdom). Gas sampling was performed between 06:00 to 07:00 GMT and between 07:00 and 08:00 GMT during summer and wintertime, respectively.
Gas samples were analysed by gas chromatography using an Agilent 7890B (Agilent, Santa Clara, CA, United States) equipped with an autosampler (PAL3 autosampler, Zwingen, Switzerland). N2O concentration was determined with an electron capture detector (ECD). The system was calibrated using ultra-high purity N2O standards (Carburos Metálicos, Barcelona, Spain). Emission rates were calculated from the linear increase in the gas concentration within the chamber during the sampling time (0, 20, and 40 min after chamber enclosure) and correcting for the air temperature inside the chamber. The goodness of the N2O concentration data for fluxes estimation was checked per chamber and sampling date by assuming an R2 > 0.90. When R2 values were lower than this threshold, data were inspected to discard the possible existence of outliers based on the CO2 concentration to discard chamber leakages during the enclosure time. Cumulative soil N2O emissions were quantified on a mass basis (i.e., kg N ha−1) using the trapezoid rule (Levy et al., 2017).
Manual harvest was done for pea and both maize crops to determine yield components before the whole field harvest. Pea grain and biomass yield were determined by harvesting two subsamples of 0.25 m2 per plot, while maize grain and biomass yield were determined by harvesting two three-metre maize rows per plot. After that, grain was separated from the aboveground biomass and dried separately at 60°C for 48 h to determine grain and biomass yield. Grain and biomass subsamples were ground and analysed to determine the N content by dry combustion (TruSpec CN, LECO, St Joseph, MI).
For 2018, 2019 and 2019, 2020 growing seasons, which include the bare fallow phase and maize phase, and pea phase and maize phase for MC and MP cropping systems, respectively, the EF was calculated from the next expression:
where Ei are the cumulative soil N2O emissions from the i treatment (kg N2O-N ha−1), E0 are the cumulative soil N2O emissions (kg N2O-N ha−1) from the control treatment, unfertilized, and Nratei is the amount of N fertilizer applied in the i treatment including the N surplus derived from the legume stover (kg N ha−1).
Data analysis
Normality assumptions of all the data obtained were checked in the residuals by a Shapiro-Wilk test. Moreover, when it was necessary, data were transformed to comply with normality assumptions. Squared root and logarithm transformations were performed for grain yield and daily soil N2O fluxes, respectively. Different repeated measures analysis of variance (ANOVA) were performed independently for MC and MP cropping systems and each measurement period with N rate, date of sampling and their interaction as fixed effects and block and their interactions as random effects. In addition, ANOVA analyses were performed for cumulative N2O emissions, grain yield, N2O yield-scaled emissions and N2O emission factor, with the cropping system, N rate and their interactions as fixed effects and block and their interactions as random effects. Simple regression analysis was used to determine the relationships between cumulative soil N2O emissions and N rate. The significance of the model between cumulative soil N2O emissions and N rate was tested by cumulative soil N2O emissions logarithm transformation to comply normality assumption. All statistical analyses were performed with the JMP 10 statistical package (Institute Inc., 2012).
Results
Soil temperature, soil water-filled pore space and soil available nitrogen content
In both cropping systems, the sampling date affected soil temperature. Besides, in the MC system, soil temperature also showed a significant interaction between sampling date and N rate (Table 2). Both cropping systems showed a similar temporal pattern with an increase in soil temperatures during the spring months (March-June), reaching the maximum values during the summer period, and a decrease during autumn and winter months (Figure 2).
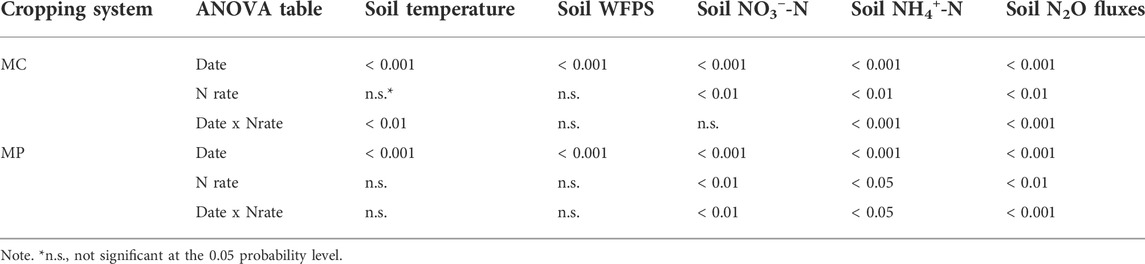
TABLE 2. Analysis of variance (p-values) of daily soil temperature, soil water-filled pore space (WFPS), soil nitrate (NO3−-N), soil ammonium (NH4+-N) and soil N2O fluxes for maize monoculture (MC) and pea-maize cropping system (MP) as affected by sampling date (Date), N fertilization rate (N rate) and their interaction.
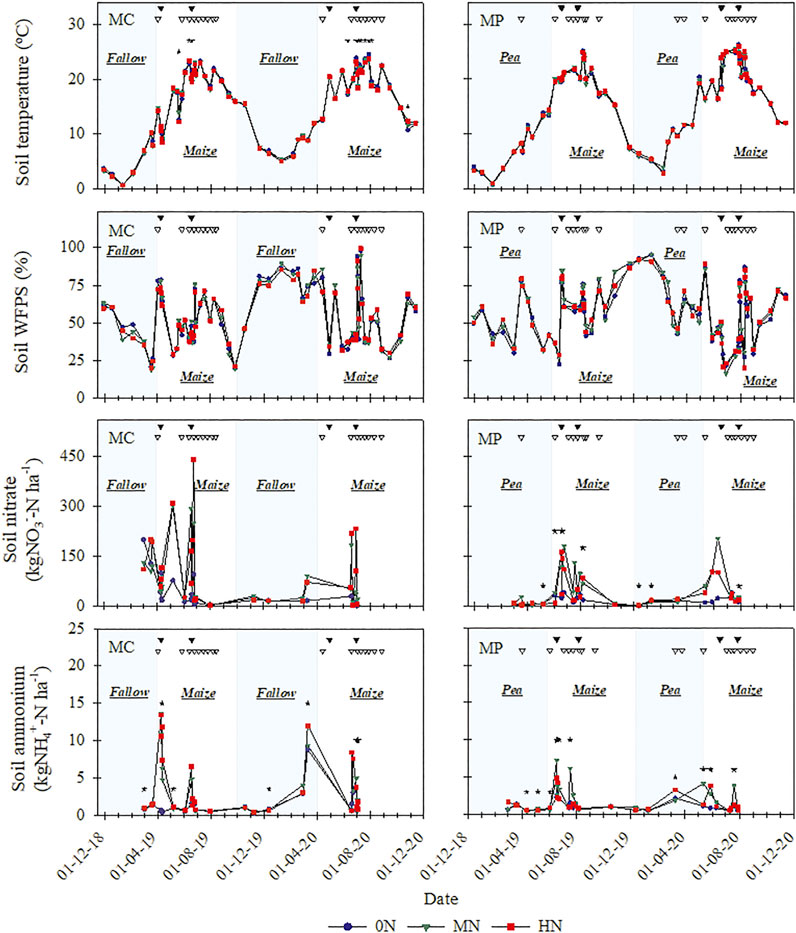
FIGURE 2. Soil temperature at 5 cm depth, soil water-filled pore space (WFPS) and soil mineral N content for the 0–5 cm soil depth in the maize monoculture (MC) system and the pea-maize (MP) rotation as affected by soil N rate: 0N (unfertilized), MN (medium N rate) and HN (high N rate). *Indicates significant differences between treatments within a date at p < 0.05. Black triangles indicate fertilizer applications. White triangles indicate flood irrigation events.
In both cropping systems, the soil WFPS was only affected by the sampling date (Table 2). During the first 24 h after each flood irrigation event, a rapid increase in soil WFPS was observed in both cropping systems reaching up to 100% WFPS (Figure 2). Thereafter, WFPS tended to decrease rapidly and within the first 5 days after irrigation soil WFPS reached 30% (Figure 2).
Soil nitrate and ammonium content under the MC cropping system were affected by the sampling date and the N rate in both cropping systems. Besides, the interaction between them was significant except for the soil nitrate content under the MC cropping system (Table 2; Figure 2). In both cropping systems, following each N fertilizer application, a significant increase in the soil mineral N content was observed. On the other hand, soil nitrate and ammonium content presented the lowest values during the pea/fallow season with average values that did not exceed 25 and 2 kg N ha−1 of nitrate and ammonium, respectively. Only soil nitrate content showed values greater than 100 kg N ha−1 in the first fallow period for the MC cropping system (Figure 2).
Soil N2O fluxes and cumulative emission
In both cropping systems, soil N2O fluxes were significantly affected by the sampling date, the N fertilization rate and the interaction between both (Table 2). Soil N2O fluxes presented a temporal emission pattern characterized by low flux values during most of the experimental period followed by a sharply and quick increase of the soil N2O flux immediately after the application of N fertilizer. This behaviour resulted in several N2O emission peaks over the 2 years coinciding with the fertilization events, being these peaks higher during the N top-dressing applications than during the pre-sowing N applications.
Differences in soil N2O emissions among N rates were mainly observed during the maize growing seasons and, in particular, following the N top-dressing application, observing the greatest N2O peaks under HN treatment in both cropping systems. However, the magnitude of peaks differed between cropping systems and maize seasons. Under the MC cropping system, the greatest daily flux values were 55 mg N2O-N m−2 day−1, whereas under the MP cropping system the maximum fluxes values were 100 and 50 mg N2O-N m−2 day−1 during the 2019 and 2020 maize season, respectively (Figure 3). Conversely, over both pea/fallow periods and both cropping systems, soil N2O emissions presented the lowest fluxes values, alternating positive and negative fluxes that ranged between −0.5 and 0.5 mg N2O-N m−2 day−1 (Figure 3).
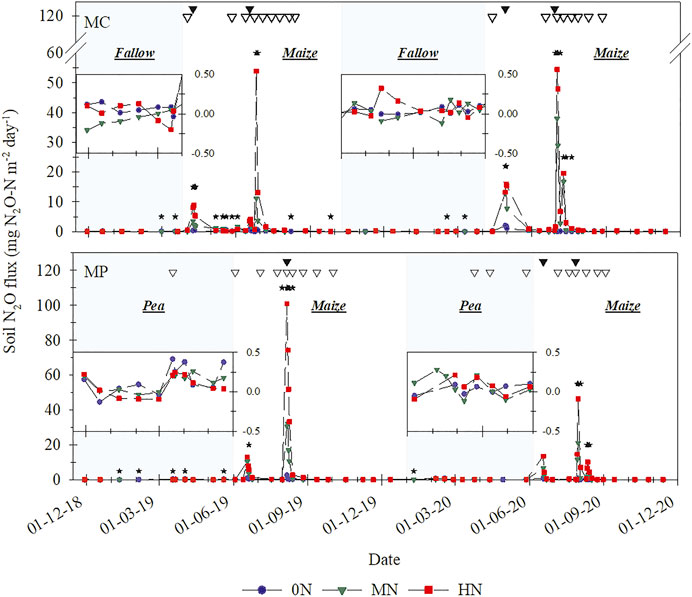
FIGURE 3. Soil N2O fluxes in the maize monoculture (MC) system and the pea-maize (MP) rotation as affected by soil N rate: 0N (unfertilized), MN (medium N rate) and HN (high N rate). * Indicates significant differences between treatments within a date at p < 0.05. Black triangles indicate fertilizer applications. White triangles indicate flood irrigation events.
The interaction between the cropping system and N application rate was significant only for the 2019 maize growing season, observing the greatest emissions in the MP-HN treatment followed by the MC-HN, while the lowest cumulative emissions were observed in the two 0N treatments (MC-0N and MP-0N) (Table 3; Figure 4A). In both pea/fallow seasons, the MP cropping system showed the highest cumulative soil N2O emissions. Oppositely, in the 2020 maize season, greater cumulative N2O emissions were observed in the MC system than in the MP cropping system (Table 3). On the other hand, the N application rate presented a significant impact on the cumulative soil N2O emissions for all considered periods except during the first pea/fallow period. In all cases, cumulative soil N2O emissions increased with the N application rate. Thus, the greatest and the lowest cumulative N2O emissions were observed in the 0N and HN levels, respectively (Table 3). Besides, in both fertilized treatments, the MP cropping system showed a reduction in the cumulative soil N2O emissions of 60% and 55% between seasons for the pea and maize cropping seasons, respectively (Table 3). Additionally, over both maize growing seasons, the cumulative soil N2O emissions showed a significant positive exponential response to the increase of N fertilization rate with large N2O emissions when N rate exceeded 200 kg N ha−1 (Figure 5).
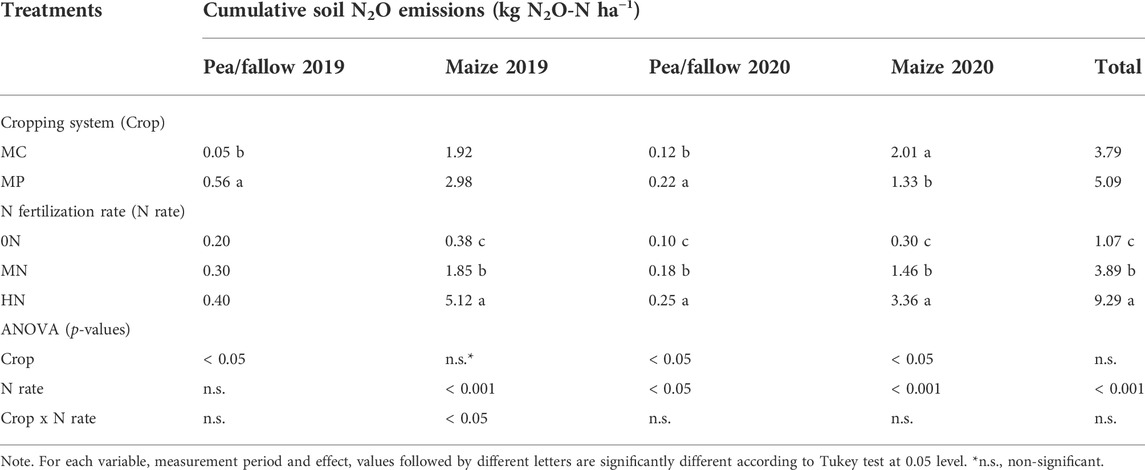
TABLE 3. Analysis of variance of cumulative soil N2O emissions for pea or fallow phases (Pea/fallow) and maize season (Maize) during 2019 and 2020 and the entire study duration (Total) as affected by cropping system (maize monoculture, MC; pea-maize rotation, MP), N fertilization rate (control, 0N; medium rate, MN, and high rate, HN) and their interaction.
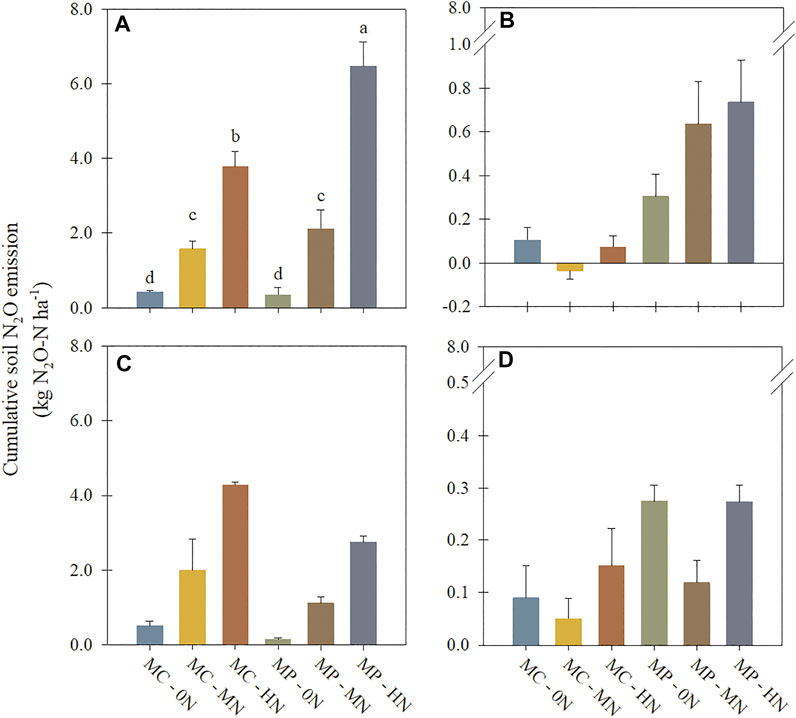
FIGURE 4. Cumulative soil N2O emissions for (A) 2019 maize growing season, (B) 2019 pea/fallow season, (C) 2020 maize growing season, (D) 2020 pea/fallow season as affected by maize monoculture (MC) and pea-maize rotation (MP) and by soil N application rate: 0N (unfertilized), MN (medium N application rate), HN (High N application rate). Different letters are significantly different according to Tukey test at p = 0.05. Error bars represent standard error.

FIGURE 5. Regression analysis between cumulative soil N2O emissions and N application rate for both cropping systems (maize monoculture system, MC; pea-maize cropping system, MP) and both maize growing seasons (maize growing season 2019, Maize 2019; maize growing season 2020, Maize 2020. Black solid lines represent the 95% confidence interval.
Grain yield, N2O yield-scaled emissions and nitrogen emission factor, EF
Grain yield was significantly affected by the N application rate but neither the cropping system nor the interaction between both had an impact on the grain yields. In both growing seasons and for the whole experimental time, the unfertilized treatment (0N) always showed the lowest grain yield. Regarding fertilized treatments, there were no significant differences between the HN and the MN treatments in both growing seasons or the whole experimental period (Table 4).
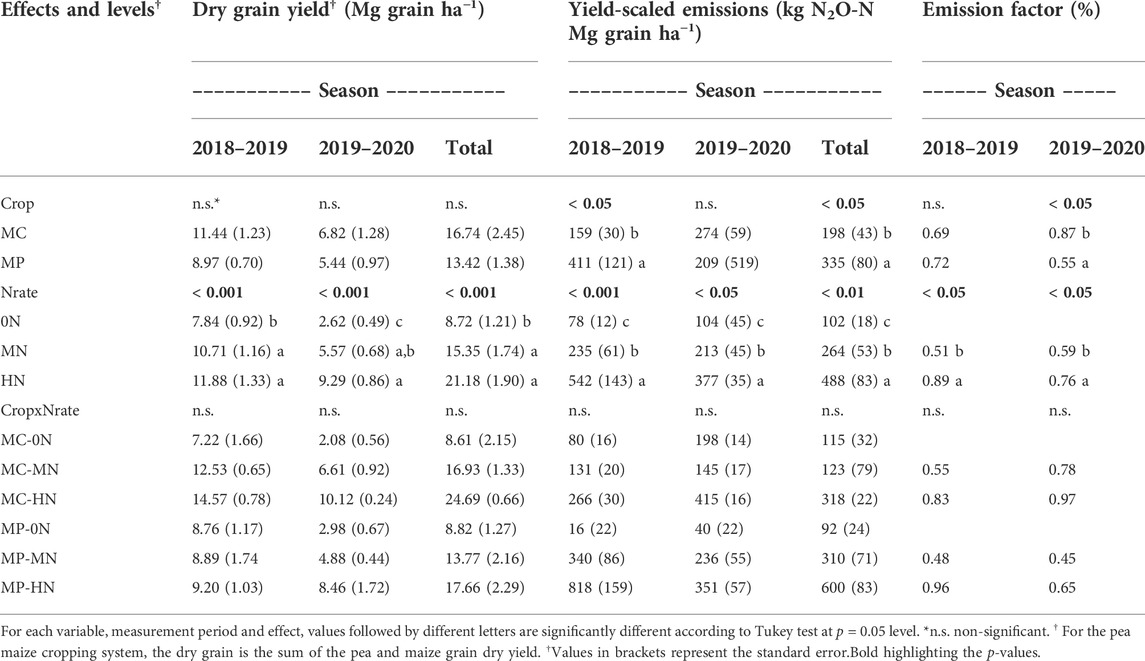
TABLE 4. Dry grain yield, yield-scaled emissions and nitrogen emission factor for the growing season periods of 2018, 2019 and 2019, 2020 and the total experimental period as affected by cropping system (Crop) (maize monoculture, MC; pea maize cropping system, MP), nitrogen application rate (Nrate) (Control, 0N; Medium rate, MN, and High rate, HN) and their interactions.
In both growing seasons and considering also the entire experimental period, the grain yield-scaled emissions were significantly affected by the Nrate. In all cases, the greatest grain yield-scaled emissions were observed under the HN treatment, while the lowest values were observed under the 0N treatment. On the other hand, the cropping system only showed significant differences for the 2018–2019 season, reporting greater yield-scaled emission in the MP system than in the MC system (Table 4).
The nitrogen emission factor only showed significant differences between cropping systems during 2019–2020 growing season, presenting MP lower values compared to MC cropping system. Conversely, the Nrate affected the EF in both growing season, reporting the HN rate the greatest EF values in both seasons. Moreover, in both seasons and for all treatments, the EF always showed values below 1% (Table 4).
Discussion
In this study, in irrigated Mediterranean systems, the change from maize monoculture to a more diversified system with a double annual rotation with pea and maize and the adjustment in N fertilization rates had a significant impact on soil N2O emissions. In general, the N rate positively affected daily soil N2O fluxes, but significant differences among N rates were observed after fertilizer applications. In both years and cropping systems, significant N2O emission peaks were measured right after the application of N fertilizer as observed in other maize experiments in irrigated Mediterranean conditions (Franco-Luesma et al., 2019; Pareja-Sánchez et al., 2020). The soil N2O flux peaks observed during top-dressing applications were higher than the peaks measured in the pre-sowing applications. Maize top-dressing applications are performed during the warmest months of the year and, in turn, when irrigated events are concentrated over the year. Therefore, the increase in available soil mineral N after fertilization together with high soil moisture levels (70%–80% WFPS) and high soil temperatures boosted high soil N2O peaks (Franco-Luesma et al., 2020). The combined effect of these three factors (high moisture, temperature, and soil mineral N) resulted in favourable conditions for the production of soil N2O by denitrification (Sánchez-Martín et al., 2010; Butterbach-Bahl et al., 2013).
Soil N2O emissions during the legume growth season tended to be lower than during fertilized crops (Jeuffroy et al., 2013; Lemke et al., 2018). However, in our case, cumulative soil N2O emissions in the pea phase of the MP rotation were greater than in the fallow phase of the MC system, similar to the results reported by Davis et al. (2019) in a study that compared different cropping systems such as bare fallow-maize, cereal-maize and hairy vetch-maize. Likewise, other authors (Rochette et al., 2004; Jensen et al., 2012; Schwenke et al., 2015; Hansen et al., 2019) have also observed an increase in soil N2O emissions associated with the growth of legumes, concluding that possible increases in N2O during the growth of legumes may be the consequence of higher soil labile N availability by the mineralization of legume roots and fallen leaves. In our experiment, the difference in cumulative soil N2O emissions between the pea and fallow phases varied between years, a fact that would be explained by the differences between the systems, legume crop against a bare soil fallow, as well as the different pea crop performance between seasons rather than the biological N2 fixation process associated to the legume crops (Zhong et al., 2009). During the first year (2019), cumulative soil N2O emissions in the pea phase were about tenfold higher than in the fallow phase but in the second year (2020) this difference was only twofold. One possible explanation for this difference would be the different pea growth observed between the two growing seasons. In 2019, the pea crop showed an exceptional growth reaching grain yield values up to 3,400 ± 502 kg ha−1 (data not shown). However, in the following year, pea yield values did not exceed 820 ± 147 kg ha−1 (data not shown). Then, the higher pea biomass production in 2019 led to higher N release from mineralized aboveground biomass and roots, resulting in an N supply at the end of the season of 257 and 57 kg N ha−1 for 2019 and 2020 pea seasons, respectively. This fact explained the greatest soil N2O emissions found in the pea phase compared to the soil bare fallow due to mineralization of the pea dead biomass during the pea growing season and also the highest soil N2O emissions measured during the 2019 pea/fallow season compared to the 2020 pea/fallow season. Likewise, this difference in N release from the legume biomass between both pea seasons would explain the greater soil N2O emissions found in the maize phase during the 2019 growing season under the MP system compared to the MC cropping system, as well as the greater soil N2O emissions observed under the MP cropping system in the 2019 growing season compared to 2020 growing season.
During the second year (2020), the maize phase of the MC system presented greater emissions than the maize phase of the MP rotation. However, in 2019, no significant differences were observed between MC and MP. As commented previously, there was a great difference in the pea production obtained in both years. During the 2020 maize growing season, the lower N inputs from pea residues together with the reduction of N fertilizer in the fertilized treatments (50 kg N ha−1 less N fertilizer than that in the MC plots) resulted in lower soil N2O emissions in the MP rotation compared with the MC system. However, oppositely, in 2019, when greater pea production was obtained, the maize after pea with the highest N rate (MP-HN) achieved the greatest cumulative soil N2O emissions, being greater than the maize monoculture at high N rates (MC-HN). This finding is in agreement with the results finding by other authors (Drury et al., 2008; Adviento-Borbé et al., 2010; Saha et al., 2021) who reported greater soil N2O emissions during the maize phase of the maize-legume cropping system compared to systems that did not include legume.
In the MP rotation, the build-up of soil N levels, as a result of the noteworthy amount of pea stover left after the 2019 pea season (average N supply from aboveground pea biomass of 257 kg N ha−1, data not shown) together with the significant amount of N applied in the HN rate (350 kg N ha−1) boosted soil N2O emissions. Interestingly, this behaviour, however, was not observed when the maize was fertilized with adjusted N rates (MN) considering that in MN rates, independently of the precedent phase (pea or fallow), soil N2O emissions during maize were similar.
In Mediterranean systems, intensive irrigated crops involve large N additions (Cela et al., 2011). In our experiment, soil N2O losses positively responded to the amount of N applied, particularly, during the maize phase (Bouwman et al., 2002; Cayuela et al., 2017). Cumulative soil N2O emissions showed a non-linear response to the N application rates as has been observed in several studies (McSwiney and Robertson, 2005; Hoben et al., 2011; Kim et al., 2013; Shcherbak et al., 2014). This non-linear response of the soil N2O emissions to the soil N content was emphasised when the N application rate exceeded the 200 kg N ha−1, N dose that coincided with the upper range of the optimal N rate, 160 and 200 kg N ha−1, for irrigated maize conditions in NE Spain (Berenguer et al., 2008; Pareja-Sánchez et al., 2020) and reached the maximum emission at 400 kg N ha−1. This behaviour of the soil N2O emissions was explained by the N surplus which remained available in the soil for the production of N2O by soil microorganisms. Therefore, the high N rates considered in our experiment consisting of 400 and 350 kg N ha−1 rates (MC and MP, respectively) would have greatly surpassed the N needs by the maize crop and thus favour soil N2O emission.
The increase in the N application rate did not have a significant impact on the grain yield. In none of the growing seasons nor the entire experimental period. This finding is in concordance with other studies (Binder et al., 2000); Pareja-Sánchez et al. (2020) that reported similar maize grain yields when they applied medium and high nitrogen application rates, showing the existence of an optimal N application rate between 150–200 kg N ha−1 (Berenguer et al., 2008). Conversely to the grain yield, the grain yield-scaled emissions always showed significant differences between fertilized treatments, with the lowest yield-scaled emissions in the Medium treatment. The non-linear response of the cumulative soil N2O emissions to the N application rate, which resulted in the highest cumulative soil N2O emissions under the HN treatment could not be compensated by the differences in grain yield between the High and the Medium N rates.
Emission factor values reported in this study presented an EF value lower than the 1% established by the Intergovernmental Panel on Climate Change (IPCC, 2014). The mean EF obtained (0.71%) is in agreement with the EF reported by Cayuela et al. (2017) for irrigated-maize cropping with N application rates between 100 and 400 kg N ha−1 in a meta-analysis study for the Mediterranean region. Besides, and in agreement with Kim et al. (2013), Shcherbak et al. (2014) and Cayuela et al. (2017), the application of a nitrogen dose higher than the optimal N rate leads to an increase in the EF values, observing always the greatest EF values under the highest N application rates.
Conclusion
The results presented in this work showed that cropping diversification and N fertilization affected soil N2O emissions. The impact of introducing a pea crop in maize monocultures depends on the quantity of residues produced by the pea, particularly when maize is fertilized at high N rates. However, at optimal N rates, soil N2O emissions during the maize crop are similar independently of the precedent phase (pea or fallow). Likewise, the application of N at optimal rates led to a reduction of yield-scaled emissions and N emission factor which showed values lower than the 1% nitrogen emission factor proposed by the IPCC. Our study only comprised 2 years of results, therefore conclusions should be taken with caution since further research is needed to address the mid-/long-term impact of legume incorporation and N fertilizer rates on maize soil N2O emissions. Nonetheless, the results obtained in this work pointed out the importance of considering the N release from legumes and the adjustment of N rates to crop requirements to reduce soil N2O emissions in irrigated maize systems of Mediterranean areas.
Data availability statement
The raw data supporting the conclusion of this article will be made available by the authors, without undue reservation.
Author contributions
SF-L: Conceptualization, data acquisition, writing—original draft, data curation, methodology, formal analysis, investigation. VL: Data acquisition, formal analysis. MA-A: Writing—review; editing. AB: Data acquisition, formal analysis. IK-S: Data acquisition, formal analysis. JA: Writing—review; editing. JÃ-F: Conceptualization, methodology, investigation, writing—review; editing, supervision, project administration, resources, funding acquisition.
Funding
This research was funded by EU Horizon 2020 Programme for Research and Innovation project “Crop diversification and low-input farming across Europe: from practitioners’ engagement and ecosystems services to increased revenues and value chain organisation (DIVERFARMING)” (grant agreement no. 728003).
Acknowledgments
The authors would like to thank Valero Pérez Laguardia, Estela Luna, Eva Medina and Florin Ion for laboratory and field assistance.
Conflict of interest
The authors declare that the research was conducted in the absence of any commercial or financial relationships that could be construed as a potential conflict of interest.
Publisher’s note
All claims expressed in this article are solely those of the authors and do not necessarily represent those of their affiliated organizations, or those of the publisher, the editors and the reviewers. Any product that may be evaluated in this article, or claim that may be made by its manufacturer, is not guaranteed or endorsed by the publisher.
Supplementary material
The Supplementary Material for this article can be found online at: https://www.frontiersin.org/articles/10.3389/fenvs.2022.914851/full#supplementary-material
Abbreviations
N2O, nitrous oxide; CIR, crop irrigation requirement; ETo, Reference evapotranspiration; ETc, Crop evapotranspiration; WFPS, Water-filled pore space.
References
Adviento-Borbe, M. A. A., Kaye, J. P., Bruns, M. A., McDaniel, M. D., McCoy, M., Harkcom, S., et al. (2010). Soil greenhouse gas and ammonia emissions in long-term maize-based cropping systems. Soil Sci. Soc. Am. J. 74, 1623–1634. doi:10.2136/sssaj2009.0446
Allen, R. G., Pereira, L. S., Raes, D., and Smith, M. (1998). Crop evapotranspiration-Guidelines for computing crop water requirements-FAO Irrigation and drainage paper 56, 300. Rome: FAO, D05109.
Berenguer, P., Santiveri, F., Boixadera, J., and Lloveras, J. (2008). Fertilisation of irrigated maize with pig slurry combined with mineral nitrogen. Eur. J. Agron. 28, 635–645. doi:10.1016/j.eja.2008.01.010
Binder, D. L., Sander, D. H., and Walters, D. T. (2000). Maize response to time of nitrogen application as affected by level of nitrogen deficiency. Agron. J. 92, 1228–1236.
Bouwman, A. F., Boumans, L. J. M., and Batjes, N. H. (2002). Emissions of N2O and NO from fertilized fields: Summary of available measurement data. Glob. Biogeochem. Cycles 16, 1–6. doi:10.1029/2001gb001811
Butterbach-Bahl, K., Baggs, E. M., Dannenmann, M., Kiese, R., and Zechmeister-Boltenstern, S. (2013). Nitrous oxide emissions from soils: How well do we understand the processes and their controls? Phil. Trans. R. Soc. B 368, 20130122. doi:10.1098/rstb.2013.0122
Cavero, J., Beltrán, A., and Aragüés, R. (2003). Nitrate exported in drainage waters of two sprinkler‐irrigated watersheds. J. Environ. Qual. 32, 916–926. doi:10.2134/jeq2003.9160
Cavero, J., Medina, E. T., and Montoya, F. (2018). Sprinkler irrigation frequency affects maize yield depending on irrigation time. Agron. J. 110, 1862–1873. doi:10.2134/agronj2018.05.0315
Cayuela, M. L., Aguilera, E., Sanz-Cobena, A., Adams, D. C., Abalos, D., Barton, L., et al. (2017). Direct nitrous oxide emissions in Mediterranean climate cropping systems: Emission factors based on a meta-analysis of available measurement data. Agric. Ecosyst. Environ. 238, 25–35. doi:10.1016/j.agee.2016.10.006
Cela, S., Salmerón, M., Isla, R., Cavero, J., Santiveri, F., Lloveras, S., et al. (2011). Reduced nitrogen fertilization to corn following alfalfa in an irrigated semiarid environment. Agron. J. 103, 520–528. doi:10.2134/agronj2010.0402
Danielson, R. E., and Sutherland, P. L. (1986). Porosity, 443-461. In Methods of soil analysis, Part 1 physical and mineralogical methods. Madison, WI, USA: American Society of Agronomy, Inc. Soil Science Society of America, Inc, 443–461.
Dastane, N. G. (1978). Effective rainfall in irrigated agriculture irrigation and drainage paper 25. Rome: FAO.
Davis, B. W., Mirsky, S. B., Needelman, B. A., Cavigelli, M. A., Yarwood, S. A. J. A., and Ecosystems, E. (2019). Nitrous oxide emissions increase exponentially with organic N rate from cover crops and applied poultry litter. Agric. Ecosyst. Environ. 272, 165–174. doi:10.1016/j.agee.2018.10.023
De Antoni Migliorati, M., Parton, W. J., Bell, M. J., Wang, W., and Grace, P. R. (2021). Soybean fallow and nitrification inhibitors: Strategies to reduce N2O emission intensities and N losses in Australian sugarcane cropping systems. Agric. Ecosyst. Environ. 306, 107150. doi:10.1016/j.agee.2020.107150
Drinkwater, L. E., Wagoner, P., and Sarrantonio, M. (1998). Legume-based cropping systems have reduced carbon and nitrogen losses. Nature 396, 262–265. doi:10.1038/24376
Drury, C. F., Yang, X. M., Reynolds, W. D., and McLaughlin, N. B. (2008). Nitrous oxide and carbon dioxide emissions from monoculture and rotational cropping of corn, soybean and winter wheat. Can. J. Soil Sci. 88, 163–174. doi:10.4141/cjss06015
Franco-Luesma, S., Álvaro-Fuentes, J., Plaza-Bonilla, D., Arrúe, J. L., Cantero-Martínez, C., Cavero, J., et al. (2019). Influence of irrigation time and frequency on greenhouse gas emissions in a solid-set sprinkler-irrigated maize under Mediterranean conditions. Agric. Water Manag. 221, 303–311. doi:10.1016/j.agwat.2019.03.042
Franco-Luesma, S., Cavero, J., Plaza-Bonilla, D., Cantero-Martínez, C., Tortosa, G., Bedmar, E. J., et al. (2020). Irrigation and tillage effects on soil nitrous oxide emissions in maize monoculture. Agron. J. 112, 56–71. doi:10.1002/agj2.20057
Guardia, G., Abalos, D., García-Marco, S., Quemada, M., Alonso-Ayuso, M., Cárdenas, L. M., et al. (2016). Effect of cover crops on greenhouse gas emissions in an irrigated field under integrated soil fertility management. Biogeosciences 13, 5245–5257. doi:10.5194/bg-13-5245-2016
Hansen, S., Berland Frøseth, R., Stenberg, M., Stalenga, J., Olesen, J. E., Krauss, M., et al. (2019). Reviews and syntheses: Review of causes and sources of N2O emissions and NO3– leaching from organic arable crop rotations. Biogeosciences 16, 2795–2819. doi:10.5194/bg-16-2795-2019
Hoben, J. P., Gehl, R. J., Millar, N., Grace, P. R., and Robertson, G. P. (2011). Nonlinear nitrous oxide (N2O) response to nitrogen fertilizer in on-farm corn crops of the US Midwest. Glob. Chang. Biol. 17, 1140–1152. doi:10.1111/j.1365-2486.2010.02349.x
Hutchinson, G. L., and Mosier, A. R. (1981). Improved soil cover method for field measurement of nitrous-oxide fluxes. Soil Sci. Soc. Am. J. 45, 311–316. doi:10.2136/sssaj1981.03615995004500020017x
IPCC (2014). “Climate change 2014: Synthesis report,” in Contribution of working groups I, II and III to the fifth assessment report of the intergovernmental Panel on climate change [core writing team. Editors R. K. Pachauri, and L. A. Meyer (Geneva, Switzerland: IPCC), 151.
Jensen, E. S., Peoples, M. B., Boddey, R. M., Gresshoff, P. M., Henrik, H. N., Alves, B. J. R., et al. (2012). Legumes for mitigation of climate change and the provision of feedstock for biofuels and biorefineries. A review. Agron. Sustain. Dev. 32, 329–364. doi:10.1007/s13593-011-0056-7
Jeuffroy, M. H., Baranger, E., Carrouee, B., de Chezelles, E., Gosme, M., Henault, C., et al. (2013). Nitrous oxide emissions from crop rotations including wheat, oilseed rape and dry peas. Biogeosciences 10, 1787–1797. doi:10.5194/bg-10-1787-2013
Kim, D. G., Hernandez-Ramirez, G., and Giltrap, D. (2013). Linear and nonlinear dependency of direct nitrous oxide emissions on fertilizer nitrogen input: A meta-analysis. Agric. Ecosyst. Environ. 168, 53–65. doi:10.1016/j.agee.2012.02.021
Kiniry, J. R. (1991). “Maize phasic development,” in Modeling plant and soil systems. Agronomy Monographs 31. Editors J. Hanks, and J. T. Ritchie (Madison, WI: ASA, CSA, and SSSA), 55–70.
Lemke, R. L., Zhong, Z., Campbell, C. A., and Zentner, R. (2007). Can pulse crops play a role in mitigating greenhouse gases from North American agriculture? Agron. J. 99, 1719–1725. doi:10.2134/agronj2006.0327s
Lemke, R. L., Liu, L., Baron, V. S., Malhi, S. S., and Farrell, R. E. (2018). Effect of crop and residue type on nitrous oxide emissions from rotations in the semi-arid Canadian prairies. Can. J. Soil Sci. 98, 508–518. doi:10.1139/cjss-2018-0001
Levy, P. E., Cowan, N., van Oijen, M., Famulari, D., Drewer, J., Skiba, U., et al. (2017). Estimation of cumulative fluxes of nitrous oxide: Uncertainty in temporal upscaling and emission factors. Eur. J. Soil Sci. 68, 400–411. doi:10.1111/ejss.12432
Lin, B. B. (2011). Resilience in agriculture through crop diversification: Adaptive management for environmental change. BioScience 61, 183–193. doi:10.1525/bio.2011.61.3.4
Lötjönen, S., and Ollikainen, M. (2017). Does crop rotation with legumes provide an efficient means to reduce nutrient loads and GHG emissions? Rev. Agric. Food Environ. Stud. 98, 283–312. doi:10.1007/s41130-018-0063-z
Martínez-Cob, A., Playán, E., Zapata, N., Cavero, J., Medina, E. T., Puig, M., et al. (2008). Contribution of evapotranspiration reduction during sprinkler irrigation to application efficiency. J. Irrig. Drain. Eng. 134, 745–756. doi:10.1061/(asce)0733-9437(2008)134:6(745)
McSwiney, C. P., and Robertson, G. P. (2005). Nonlinear response of N2O flux to incremental fertilizer addition in a continuous maize (Zea mays L.) cropping system. Glob. Chang. Biol. 11, 1712–1719. doi:10.1111/j.1365-2486.2005.01040.x
Oliveira, M., Castro, C., Coutinho, J., and Trindade, H. (2021). Grain legume-based cropping systems can mitigate greenhouse gas emissions from cereal under Mediterranean conditions. Agric. Ecosyst. Environ. 313, 107406. doi:10.1016/j.agee.2021.107406
Pareja-Sánchez, E., Cantero-Martínez, C., Álvaro-Fuentes, J., and Plaza-Bonilla, D. (2020). Impact of tillage and N fertilization rate on soil N2O emissions in irrigated maize in a Mediterranean agroecosystem. Agric. Ecosyst. Environ. 287, 106687. doi:10.1016/j.agee.2019.106687
Pareja-Sánchez, E., Plaza-Bonilla, D., Álvaro-Fuentes, J., and Cantero-Martínez, C. (2019). Is it feasible to reduce tillage and N use while improving maize yield in irrigated Mediterranean agroecosystems? Eur. J. Agron. 109, 125919. doi:10.1016/j.eja.2019.125919
Preissel, S., Reckling, M., Schläfke, N., and Zander, P. (2015). Magnitude and farm-economic value of grain legume pre-crop benefits in Europe: A review. Field Crops Res. 175, 64–79. doi:10.1016/j.fcr.2015.01.012
Quemada, M., Baranski, M., Nobel-de Lange, M. N. J., Vallejo, A., and Cooper, J. M. (2013). Meta-analysis of strategies to control nitrate leaching in irrigated agricultural systems and their effects on crop yield. Agric. Ecosyst. Environ. 174, 1–10. doi:10.1016/j.agee.2013.04.018
Rochette, P., Angers, D. A., Bélanger, G., Chantigny, M. H., Prévost, D., Lévesque, G., et al. (2004). Emissions of N2O from alfalfa and soybean crops in eastern Canada. Soil Sci. Soc. Am. J. 68, 493–506. doi:10.2136/sssaj2004.4930
Saha, D., Kaye, J. P., Bhowmik, A., Bruns, M. A., Wallace, J. M., Kemanian, A. R. J. E. A., et al. (2021). Organic fertility inputs synergistically increase denitrification‐derived nitrous oxide emissions in agroecosystems. Ecol. Appl. 31, e02403. doi:10.1002/eap.2403
Salmerón, M., Cavero, J., Isla, R., Porter, C. H., Jones, J. W., Boote, K. J., et al. (2014). DSSAT nitrogen cycle simulation of cover crop-maize rotations under irrigated mediterranean conditions. Agron. J. 106, 1283–1296. doi:10.2134/agronj13.0560
Salmerón, M., Cavero, J., Quílez, D., and Isla, R. (2010). Winter cover crops affect monoculture maize yield and nitrogen leaching under irrigated Mediterranean conditions. Agron. J. 102, 1700–1709. doi:10.2134/agronj2010.0180
Salmerón, M., Isla, R., and Cavero, J. (2011). Effect of winter cover crop species and planting methods on maize yield and N availability under irrigated Mediterranean conditions. Field Crops Res. 123, 89–99. doi:10.1016/j.fcr.2011.05.006
Sánchez-Martín, L., Sanz-Cobena, A., Meijide, A., Quemada, M., and Vallejo, A. (2010). The importance of the fallow period for N2O and CH4 fluxes and nitrate leaching in a Mediterranean irrigated agroecosystem. Eur. J. Soil Sci. 61, 710–720. doi:10.1111/j.1365-2389.2010.01278.x
Sant'Anna, S., Martins, M., Goulart, J., Araújo, S., Araújo, E., Zaman, M., et al. (2018). Biological nitrogen fixation and soil N2O emissions from legume residues in an Acrisol in SE Brazil. Geoderma Reg. 15, e00196. doi:10.1016/j.geodrs.2018.e00196
Sanz-Cobena, A., Garcìa-Marco, S., Quemada, M., Gabriel, J. L., Almendros, P., Vallejo, A., et al. (2014). Do cover crops enhance N2O, CO2 or CH4 emissions from soil in Mediterranean arable systems? Sci. Total Environ. 466, 164–174. doi:10.1016/j.scitotenv.2013.07.023
Sanz-Cobena, A., Lassaletta, L., Aguilera, E., del Prado, A., Garnier, J., Billen, G., et al. (2017). Strategies for greenhouse gas emissions mitigation in mediterranean agriculture: A review. Agric. Ecosyst. Environ. 238, 5–24. doi:10.1016/j.agee.2016.09.038
Schwenke, G. D., Herridge, D. F., Scheer, C., Rowlings, D. W., Haigh, B. M., McMullen, K. G. J. A., et al. (2015). Soil N2O emissions under N2-fixing legumes and N-fertilised canola: A reappraisal of emissions factor calculations. Agric. Ecosyst. Environ. 202, 232–242. doi:10.1016/j.agee.2015.01.017
Shcherbak, I., Millar, N., and Robertson, G. P. (2014). Global metaanalysis of the nonlinear response of soil nitrous oxide (N2O) emissions to fertilizer nitrogen. Proc. Natl. Acad. Sci. U. S. A. 111, 9199–9204. doi:10.1073/pnas.1322434111
Sisquella, M., Lloveras, J., Álvaro, J., Santiveri, F., and Cantero, C. (2004). Técnicas de cultivo para la producción de maíz, trigo y alfalfa en los regadíos del valle del Ebro (Management of maize, wheat and alfalfa in the irrigated areas of the Ebro Valley). Lleida, Spain: Proyecto Trama-Life, 47. (in Spanish).
Survey Staff, Soil (2015). Illustrated guide to soil taxonomy. Lincoln, Nebraska: U.S. Department of Agriculture, Natural Resources Conservation Service, National Soil Survey Center.
Syakila, A., and Kroeze, C. (2011). The global nitrous oxide budget revisited. Greenh. Gas Meas. Manag. 1, 17–26. doi:10.3763/ghgmm.2010.0007
Keywords: soil N2O emissions, cropping diversification, nitrogen fertilization, irrigated systems, maize monoculture
Citation: Franco-Luesma S, Lafuente V, Alonso-Ayuso M, Bielsa A, Kouchami-Sardoo I, Arrúe JL and Álvaro-Fuentes J (2022) Maize diversification and nitrogen fertilization effects on soil nitrous oxide emissions in irrigated mediterranean conditions. Front. Environ. Sci. 10:914851. doi: 10.3389/fenvs.2022.914851
Received: 07 April 2022; Accepted: 06 July 2022;
Published: 19 August 2022.
Edited by:
María Almagro, Center for Edaphology and Applied Biology of Segura (CSIC), SpainReviewed by:
Maite Martinez-Eixarch, Institute of Agrifood Research and Technology (IRTA), SpainGuillermo Siri-Prieto, Universidad de la República, Uruguay
Debasish Saha, The University of Tennessee, United States
Copyright © 2022 Franco-Luesma, Lafuente, Alonso-Ayuso, Bielsa, Kouchami-Sardoo, Arrúe and Álvaro-Fuentes. This is an open-access article distributed under the terms of the Creative Commons Attribution License (CC BY). The use, distribution or reproduction in other forums is permitted, provided the original author(s) and the copyright owner(s) are credited and that the original publication in this journal is cited, in accordance with accepted academic practice. No use, distribution or reproduction is permitted which does not comply with these terms.
*Correspondence: Samuel Franco-Luesma, c2ZyYW5jb2x1ZXNtYUBnbWFpbC5jb20=