 Huiqing Zhao
 Jian Hu
 Feng Hao1*
 Hongyuan Zhang
- 1Tianjin University of Commerce, Tianjin, China
- 2Tianjin University of Finance and Economics, Tianjin, China
In order to examine the key determinants of carbon dioxide emissions and judge whether China’s carbon dioxide emissions can reach their peak value before 2030, this study first uses the extended STIRPAT model to analyze the determinants of China’s carbon dioxide emissions from 1995 to 2019 and then uses the model regression result to forecast the carbon dioxide emissions from 2020 to 2040 under six scenarios to investigate their prospect. It is found that population size, GDP per capita, energy intensity, the share of coal consumption, urbanization level, the share of secondary industry, and investment have significant positive effects on carbon dioxide emissions. Among them, the influence of population size is the biggest and energy intensity is the weakest. China’s carbon dioxide emissions can reach their peak in 2029 under the baseline scenario. Increasing the rate of population growth, energy intensity, and share of coal consumption will push back the peak year. A lower rate of economic growth and share of the secondary industry will bring the peak year forward. Therefore, it is necessary to optimize the industrial structure and energy consumption structure, reduce the energy intensity, and control the population size in order to achieve the goal of peaking carbon dioxide emissions as soon as possible.
Introduction
With the rapid development of the world economy, the expansion of the population, the modernization of transportation, the massive consumption of fossil energy, and a significant increase in greenhouse gases in the atmosphere have led to a rise in the temperature and sea level, as well as more frequent extreme weather events, climate change has become a common challenge for all mankind. The increase in greenhouse gases is mainly due to carbon dioxide, the main contributor to global warming. Therefore, taking positive action at the global level to reduce carbon dioxide emissions is considered to be a top priority.
Since the reform and opening-up, China’s economy has experienced sustained rapid growth and made remarkable achievements. But for a long time, the extensive growth mode brought tremendous pressure on resources and the environment. Since 2007, China has become the largest emitter of carbon dioxide in the world, accounting for about 30% of the global total emissions in 2018 (Ren and Long, 2021), and as of 2019, the carbon dioxide emissions are still not peaking or showing a slowing trend (IEA, 2021). Facing the grim situation of carbon dioxide emissions reduction, as a responsible major country in the world, China plays an important role in reducing carbon dioxide emissions. At the general debate of the seventy-five session of the UN General Assembly, the Chinese government declared that China will increase its national autonomous contribution and adopt more effective policies and measures for peaking carbon dioxide emissions before 2030, toward carbon neutrality by 2060. The goal of peaking carbon dioxide emissions and carbon neutrality is one of the most important tasks for China to carry out the concept of ecological civilization. Carbon neutrality was listed as one of China’s eight key economic tasks in 2021, which is enough to reflect the importance of carbon neutrality (Wen et al., 2022). As a result, the Chinese government has set the targets of differentiated peak emissions by region and industry (Fan and Lu, 2022). However, China still faces many difficulties in achieving the carbon dioxide emissions reduction target due to the large gap in regional economic development. In this context, whether China can realize the promise of peaking carbon dioxide emissions by 2030 is a hot issue that people are concerned about and discussing (Fang et al., 2022; Tang et al., 2022).
The carbon dioxide emissions are affected by many factors, and the changes in these factors will directly affect the carbon dioxide emissions and the formulation of China’s emissions, reduction policies, and strategies. Therefore, it is necessary to analyze the major determinants of carbon dioxide emissions, explore the form and intensity of their effects on carbon dioxide emissions, and forecast China’s carbon dioxide emissions in the next 20 years based on the changes in these determinants. The analysis results are of great significance for China to choose the solution path to reduce carbon dioxide emissions so as to achieve the peaking carbon dioxide emissions as soon as possible.
Literature Review
With the increasing severity of climate change, in recent years, the determinants of carbon dioxide emissions have gradually attracted the wide attention of scholars in different countries and regions around the world, and the key determinants are analyzed from different perspectives. For instance, Xu and Lin (2015a) research the relationship between economic growth, energy intensity, and carbon dioxide emissions in China. Shi (2003), Fan et al. (2006), Zoundi (2017), Lin and Raza (2019) explored the impact of the population change on carbon dioxide emissions. Martínez-Zarzoso and Maruotti (2011), Xu and Lin (2015b) analyzed the impact of urbanization on carbon dioxide emissions. Bento and Moutinho (2016) and Bélaïd and Youssef (2017) explored the relationship between non-renewable, renewable electricity production, and carbon dioxide emissions. Du et al. (2012) show that economic development, technological progress, and industrial structure are the most important factors influencing carbon dioxide emissions in China. Shuai et al. (2018) show that the ratio of tertiary to secondary industries and fixed asset investments are the key factors for carbon dioxide emissions in China. Alola (2019) finds that trade policy; monetary policy, and immigration index have a positive and significant impact on carbon dioxide emissions. Wu et al. (2020) investigate the effect of energy consumption on carbon dioxide emissions under different environmental regulations. Wu et al. (2021) study the impact of internet development on energy saving and emission reduction. Yang et al. (2021) find that fiscal decentralization and urban sprawl have a significant impact on air pollution. Hao et al. (2022) explore the relationship between environmental emergencies, environmental decentralization, and regional corruption. Işık et al. (2019) test the EKC hypothesis through the independent variables of real GDP, population, and renewable energy, and fossil energy consumption.
In addition to the abovementioned factors, other factors are investigated in some research. We need to use mathematical models to quantitatively analyze how these factors influence carbon dioxide emissions. The common models include the IPAT model, STIRPAT model, and LEAP model. Shuai et al. (2017) thinks that the three models are based on the actual statistical data and the results of their analysis are more convincing. Because the STIRPAT model is a multivariable nonlinear model and can be expanded to incorporate additional factors, it became a well-known model that is widely adopted to uncover the impact factors of pollutant emissions (Wang et al., 2017). For example, Shahbaz et al. (2016), Lin et al. (2017), Dong et al. (2019), Wu et al. (2019), Tang and Hu (2021), Liu et al. (2022) analyzed the determinants of carbon dioxide emissions by applying the STIRPAT model. Of course, other methods are used in other studies. For example, Işık et al. (2017) use the Zivot-Andrews unit root tests and the autoregressive-distributed Lag (ARDL) models to investigate the dynamic causalities between influencing factors and carbon dioxide emissions. Dogan and Seker (2016) analyze the impact of renewable and non-renewable energy sources on carbon dioxide emissions by using dynamic ordinary least squares estimation. Zhang Y. J. et al. (2017) constructs a system generalized method of moments (SGMM) model to assess the impact of environmental innovation on carbon dioxide emissions. Yao et al. (2018) use the threshold regression model and the mediating effect model to analyze the influencing factors of carbon dioxide emissions. Gong et al. (2022) use the factor decomposition model to analyze the influencing factors and effects on carbon dioxide emissions. Shum et al. (2021) uses the LASSO model to rank the relative importance among the set of factors affecting carbon emissions.
Regarding China’s peaking carbon dioxide emissions, experts and scholars use different models to forecast the peak year and peak value. A scenario analysis is the most widely used method, and it is also often combined with the STIRPAT model to forecast carbon dioxide emissions in different scenarios (Cui et al., 2021; Fan and Lu, 2022). On the national level, some scholars argued that China will peak in 2030 by improving the energy efficiency (Xu et al., 2021) but others argued that it will be hard to realize China’s commitment to the international community (Chen et al., 2020). In addition, there are some forecasting studies on different industries and regions, such as Fan and Lu (2022), which analyzes the possibility of the peaking carbon dioxide emissions from Chinese ports, and Ren and Long (2021), which explores whether Guangdong Province can achieve the peaking carbon dioxide emissions by 2030.
Above all, regarding whether China can achieve peaking carbon dioxide emissions commitment on time, the academia has not yet reached an agreement (Wu et al., 2022). The policies and recommendations for emissions reduction vary from study to study. It is found that the existing literature mostly forecast China’s carbon dioxide emissions in 2030, and to see if it reaches their peak, but there is no concern about the later rebound of carbon dioxide emissions. About the analysis of the determining factors of carbon dioxide emissions, most of the literature only considered a few factors, not comprehensive.
Based on this, this study attempts to improve the existing literature. The contributions of this study are as follows: First, it forecasts China’s carbon dioxide emissions according to the development trend of the determinants in the future. Different from the existing literature that only forecast 2030; this study extends the forecast period to 2040 to observe whether the carbon dioxide emissions will continue to decrease after 2030. Such a long-term forecast could help the Chinese government develop more targeted policy measures to achieve carbon neutrality by 2060. Second, as many factors as possible are selected as variables, not only including economic, population, and other recognized factors, but also the introduction of investment, urbanization, and other factors to a certain extent will dominate China’s economic structure, and can more fully reflect the external interference factors of carbon dioxide emissions. The extended STIRPAT model is used for estimation, at the same time, by combining ridge regression to overcome multicollinearity, the estimated effect of the STIRPAT model is improved and the result is more reasonable. Third, six scenarios are designed to investigate the influence of different variables on peaking carbon dioxide emissions and to reveal how different policies would affect carbon dioxide emissions. The research in this study is helpful to identify the carbon dioxide emissions in various scenarios in China in the future. Based on the results of the scenario simulation, the government can set up a reverse forcing mechanism in time, formulate corresponding measures and policies, and find an effective way to reduce emissions.
Methodology and Variable Description
STIRPAT Model and Forecast
The STIRPAT model is derived from the IPAT equation. The IPAT equation, which is proposed by Ehrlich and Holdren (1971), holds that the environment (I) is the result of the combined effect of the population (P), level of economic development (A), the progress of science and technology (T), and the formula is
where
where
To reduce possible heteroscedasticity, log both sides of the model to get:
Assuming that the relationship between the above factors and carbon dioxide emissions in the STIRPAT model persists over the long-term, then we can use this relationship to forecast China’s carbon dioxide emissions in 2020–2040 and to see if can reach their peak by 2030. In this study, the scenario analysis method is used for the forecast. By first setting the 2020–2040 values for each of the determinants and then bringing them into the STIRPAT regression result, carbon dioxide emissions can be calculated.
The setting of the forecast value of each variable in the scenario analysis method should refer to the relevant policy planning, the law of development of developed countries, and be compared with the change rate of different stages in the past, ensure that the data are set in line with the actual situation of economic and social development. First, a set of baseline scenarios is set, and then we adjusted the setting of a key variable to investigate the effect of this variable change on the peaking carbon dioxide emissions.
Variable Description
Carbon Dioxide Emissions
The specific formula for calculating carbon dioxide emissions is as follows:
where
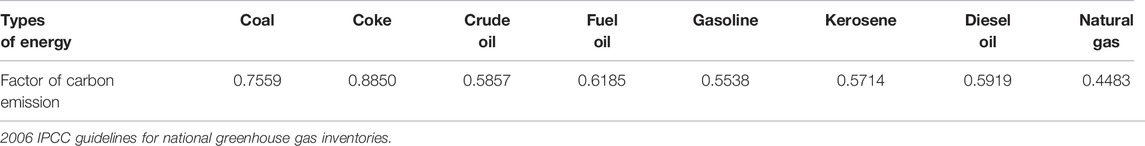
TABLE 1. Factor of carbon emission.
Formula (5) is used to calculate China’s carbon dioxide emissions from 1995 to 2019, as shown in Figure 1. It can be seen that during the study period, overall, China’s carbon dioxide emissions are on the rise, but the rate of increase in each stage is different. From 1995 to 2002, China’s energy-intensive enterprises were shut down as a result of the adjustment of energy and environmental policies, and the impact of the Asian financial crisis and other factors slowed the growth of carbon dioxide emissions. From 2003 to 2011, under the influence of China’s macroeconomic policies, such as expanding domestic demand, the economy continued to grow at a relatively fast pace, especially the rapid expansion of energy-intensive industries such as cement, which has led to a marked acceleration in the growth of carbon dioxide emissions in this period. After 2011, the government departments at all levels have gradually increased their attention to resources and the environment, new energy-saving and emission-reduction policies have been introduced, and energy-saving and emission-reduction targets have been set, so the growth rate of China’s carbon dioxide emissions has been gradually slowing down.
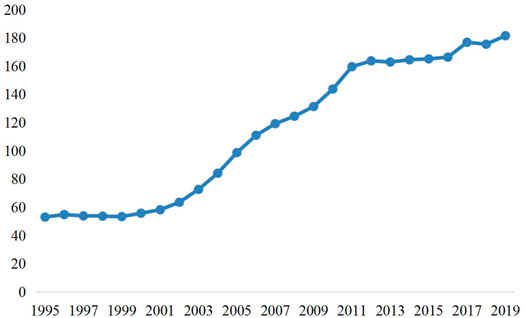
FIGURE 1. China’s carbon dioxide emissions in 1995–2019 (100 million tons).
Other Variables
In this study, the variables of interest are P, A, and T. The population size is used to measure P (Zoundi, 2017; Lin and Raza, 2019), and GDP per capita is used to measure A (Dong et al., 2019; Shuai et al., 2018). Reference Poumanyvong and Kaneko (2010), Zhou and Liu (2016), energy intensity (EI) is used as the progress of science and technology (T). According to the determinations selected in the related literature, the control variables (Xk) selected in this study include the share of coal (ES) and the share of renewable energy (RE) in total energy consumption (Bento and Moutinho, 2016; Bélaïd and Youssef, 2017), urbanization level (UR, Martínez-Zarzoso and Maruotti, 2011; Xu and Lin, 2015b), the share of secondary (SS) industry and the share of tertiary (TS) industry in GDP (Wu et al., 2019), degree of dependence on foreign trade (FT, Alola, 2019), and investment (INV, Shuai et al., 2018).
The statistical description of the variables is shown in Table 2. The GDP is expressed in 2000 prices. Here, the selected related data is from 1995–2019 in China.
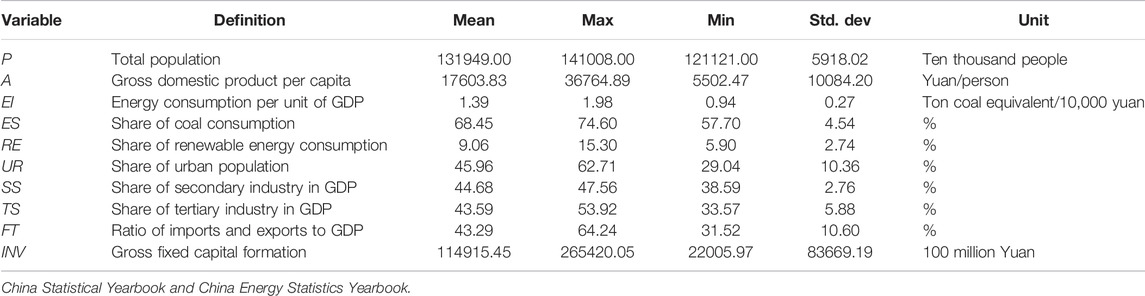
TABLE 2. Statistical description of variables.
Empirical Results and Scenario Analysis
Empirical Results
Results of the STIRPAT Model
Using the formula (4) to analyze the determinants of carbon dioxide emissions in China, the least square estimation (OLS) is used first. The result shows that apart from GDP per capita and energy intensity, the estimated coefficients of other variables are not significant and the result of RStudio running suggested that the condition number is too large and there may be serious problems such as multicollinearity. To further determine whether the data is multicollinearity, this study first calculates the correlation coefficients between any two variables. The test result shows that the absolute values of correlation coefficients between any two independent variables are more than 0.6 except lnFT, and the tests of significance of correlation coefficients show that there are linear relationships between variables except lnFT; this indicates the existence of multicollinearity.
In order to solve the multicollinearity problem and guarantee the validity and accuracy of the regression model, the ridge regression method is adopted in this study. Ridge regression is a kind of biased estimation regression method specially used for multicollinearity data analysis. In essence, it is an improved least square estimation method. By abandoning the unbiased nature of least squares, the regression coefficient obtained at the cost of losing part of the information and reducing the precision is more practical and reliable, and the tolerance to the ill-conditioned data is much stronger than that of the least-squares.
First, we need to determine the ridge parameter (k, the final value of k usually lies in the range of (0, 1)). Since the ridge regression is biased, the k value should not be too large in order to retain information as much as possible and should take the k value when the ridge trace is basically stable (Xiong et al., 2020). The formula (4) is regressed and the results show that when k = 0.059, the regression coefficients tend to be stable. The regression coefficients of lnRE, lnTS, and lnFT are not significant, so we get rid of these factors. The final regression results are shown in Table 3.
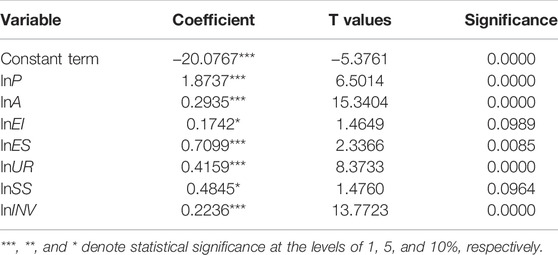
TABLE 3. Results of ridge regression.
In order to get more robust estimates and ensure the reliability of the conclusions, this study tests the robustness by removing the control variables, changing the sample interval, and adjusting the ridge parameters. The test results show that the regression coefficients’ sign of the three variables of interest is not changed, and the influence degree on carbon dioxide emissions is relatively stable, which ensures the robustness of the estimation results.
Discussion
The coefficients of all variables are positive and in line with their economic significance, indicating that the larger the population size, GDP per capita, energy intensity, share of coal consumption, urbanization level, the share of secondary industry, and investment, the higher the carbon dioxide emissions will be. However, there are significant differences in the degree of influence of each factor on carbon dioxide emissions.
Among the variables of interest, the population size has the strongest influence with a coefficient of 1.8737. This is perhaps unsurprising, China has a huge population size, and its growth will directly lead to a shortage of living space and a demand for large-scale construction and infrastructure, resulting in huge energy consumption, and an increase in carbon dioxide emissions. Such a result is consistent with most existing studies (Cui et al., 2017; Wu et al., 2019; et al.). Although China’s natural population growth rate has been declining over the past two decades, rapid urbanization has led to a significant increase in per capita energy consumption and carbon dioxide emissions, and thus the population size is an important determinant of China’s carbon dioxide emissions.
Although the coefficient (0.2935) is much smaller than the population size, GDP per capita has a positive effect on carbon dioxide emissions; this result is consistent with our expectation. Because China is a developing country, as the economy grows, carbon dioxide emissions continue to increase, the turning point of the Environmental Kuznets Curve (EKC) has not yet arrived (Du et al., 2012), especially in the period 1995–2019 of this study, which means China can not achieve a win-win combination of emission reduction and economic growth. However, as China’s economy has changed from a high-speed growth stage to a high-quality development stage, the intensity of the effect of GDP per capita on carbon dioxide emissions is expected to decline, but the positive relationship will maintain for a longer period.
Although the coefficient is minimal (0.1742), the effect of energy intensity on carbon dioxide emissions is positive. Because China’s energy consumption is dominated by fossil fuels, especially coal, it produces more carbon dioxide emissions at the same energy intensity. The energy intensity represents the level of technology, as technology improves, energy consumption per unit of GDP or energy intensity decreases, further reducing carbon dioxide emissions. This has been confirmed by many studies, such as Du et al. (2012), Dong et al. (2019). In contrast, reducing energy intensity is an important and practical way to reduce carbon dioxide emissions.
Among the control variables, the share of coal consumption has the strongest impact on carbon dioxide emissions. In China, the share of coal consumption is more than 50%, and coal consumption produces more carbon dioxide emissions than other energy, so the high share contributes to the high emissions. But the high share of coal is determined by China’s energy endowment (it has more coal, less oil, and gas), which is hard to reverse in the short term. This is one of the main difficulties China faces in reducing its carbon dioxide emissions.
The influence of the share of secondary industry is weaker than that of coal but stronger than other variables. The secondary industry is energy and carbon-intensive industry, thus the rise of its share contributes significantly to the increase of carbon dioxide emissions, this is consistent with Wei et al. (2017) and Wu et al. (2019). Given that China is the world’s factory and its manufacturing sector is deeply involved in the global division of production. In order to meet the demand of the international market, it is difficult for the share of secondary industry to decline significantly, which is an important constraint on reducing carbon dioxide emissions.
The coefficient of urbanization level is positive. China is in the process of urbanization, and the accelerated development of housing, transportation, and other infrastructure will increase carbon dioxide emissions (Parshall et al., 2010; Hao et al., 2016). Compared with the average urbanization rate of more than 80% in developed countries, China’s current urbanization rate is only about 60%. The process of urbanization still has a long way to go and the pressure of carbon dioxide emissions caused by urbanization will exist for a long time.
Investment has a positive effect on carbon dioxide emissions (Zhao et al., 2016). The investment contributes to carbon dioxide emissions through economic growth. Because China’s economy is an investment-led model, investment has long been an important driver of China’s economic growth and has often driven the development of infrastructure-related industries such as steel and cement. These are very energy-intensive industries, and their growth has led to an increase in carbon dioxide emissions.
Scenario Analysis
Scenario Setting
In the process of China’s economic development, the government plays an active guiding role, and the medium-and long-term development plans formulated by the government are usually well implemented. Therefore, it is reasonable to take the target set by government planning as the reference standard for scenario simulation. For those variables that the government has not set planning objectives, the value of the variables should be set according to the law of recent changes. In addition, China has already entered the middle-income countries, and in the process of transferring to the high-income countries, the speed of economic development and the rate of investment have both decreased correspondingly; therefore, we can set the change of China’s economic index in the next 20 years according to the change rate of the economic index in other developed countries at a similar stage of development. On this basis, the variables in the baseline scenario (scenario 1) are set to forecast China’s carbon dioxide emissions in 2020–2040. Reference to Fan and Lu (2022), the baseline scenario is neutral and the most likely scenario. However, it is also important to consider the impact of various future favorable or unfavorable factors, so possible optimistic or pessimistic scenarios for peaking carbon dioxide emissions need to be discussed by raising or lowering the values of the variables. Then, based on the baseline scenario, the rate of change of a variable was adjusted to set scenarios 2–6 to test the effect of the change of that variable on the peaking carbon dioxide emissions.
Scenario 1, is the baseline scenario. Since the official data for 2020 for each independent variable have been released, based on this, we can forecast the carbon dioxide emissions in 2020. According to the report on the work of the government in 2022, China’s GDP will grow by 8.1% in 2021 and is expected to grow by 5.5% in 2022. Therefore, this scenario set the GDP growth rate is 8.1% in 2021, 5.5% in 2022–2025, 5.4% in 2026–2030, 5.3% in 2031–2035, and 5.2% in 2036–2040. According to the National Population Development Plan (2016–2030), the total population of China will reach about 1.45 billion by 2030. Using this as the forecast value of 2030, the average annual growth rate of the population in 2020–2030 can be calculated, the growth rate is used to forecast the population size in each year from 2021 to 2040, and further calculate the GDP per capita in each year. According to the report of China’s medium-and long-term energy development strategy (2030,2050), the energy intensity in 2030 will be 68% lower than that in 2005, the energy intensity for 2030 can be calculated, and then the average annual growth rate in 2020–2030 is calculated to forecast the energy intensity from 2021 to 2040. Based on the law of decline in the share of coal consumption in recent years in China, the share of coal consumption is set to decline by 1 percentage point per year between 2021 and 2040. The China National Human Development Report 2013 of the United Nations Development Programme forecasts that China’s urbanization rate will reach 70 percent by 2030, based on this, the average annual growth rate in 2020–2030 can be calculated to forecast the urbanization rate from 2021 to 2040. According to the law of decline in the share of secondary industry in recent years in China, the share of secondary industry is set to decline by 0.5 percentage points per year from 2021 to 2040. Referring to the investment rate of the moderately developed countries, the investment rate is set at 30% in 2040, and then the average annual growth rate in 2020–2040 is calculated to forecast the investment rate from 2021 to 2040. The investment rate times GDP to get the gross fixed capital formation in 2021–2040.
Scenario 2, to examine the effect of population size on carbon dioxide emissions in 2021–2040, the population size is adjusted in this scenario. Considering the full implementation of the “two-child policy” in 2015, the population is likely to maintain rapid growth for a longer period of time, so the population size is assumed to grow at an average annual growth rate from 2015 to 2020, the population size from 2021 to 2040 can be forecast. The size of the population calculated in this way is larger than scenario 1 and this is a pessimistic scenario for peaking carbon dioxide emissions.
Scenario 3, to explore the effect of economic growth on carbon dioxide emissions in 2021–2040, we assumed an 8.1% GDP growth rate in 2021 and 5.5% in 2022, since then it is declined by 0.1 percentage points per year. This is because the economic downward pressure is likely to continue to increase due to the impact of the coronavirus disease 2019 (COVID-19), the global demand for Chinese products continues to decline, and China’s growth rate is likely to continue to decline moderately. This low economic growth is optimistic for peaking carbon dioxide emissions.
Scenario 4, this scenario adjusts the energy intensity. Although the government has set a reduction target, the rate of decline in energy intensity over the past 5 years has been relatively slow. Refererring to Su et al. (2021), the energy intensity is assumed to grow at a fixed average annual growth rate in 2015–2020, the energy intensity from 2021 to 2040 can be forecast. This relatively slow rate of decline in energy intensity is a pessimistic scenario.
Scenario 5, this scenario adjusts the energy consumption structure. In the past 10 years, the share of coal consumption has dropped significantly, but the dominant position of coal is still just needed, the rapid decline in the future may be hindered. So the share of coal consumption is set to decline by 0.9 percentage points per year from 2021 to 2040, the rate of decline is slower than scenario 1, that is, the share of coal consumption per year is higher than scenario 1. This is a pessimistic scenario for peaking carbon dioxide emissions
Scenario 6, this scenario adjusts the industrial structure. Referring to the changes in industrial structure in moderately developed countries, and reference to Ren and Long (2021), the share of secondary industry is set at 25 percent in 2040, and the average annual growth rate in 2021–2040 is calculated to forecast the share of secondary industry from 2021 to 2039. In this case, the share of secondary industry is lower than scenario 1, this is an optimistic scenario for carbon dioxide emissions.
Scenario Results Analysis
According to the set values of the variables in the above six scenarios, the carbon dioxide emissions of China from 2021 to 2040 in each scenario are forecast, as shown in Figure 2 and Table 4. It can be seen that in scenarios 1, 3, and 6, China’s carbon dioxide emissions will peak by 2030 or before, and China will be able to achieve its peaking carbon dioxide emissions target. Under scenario 1, a peak of 18.5189 billion tons will be achieved in 2029, an increase of 359 million tons over 2019. Scenarios 2, 4, and 5 will peak between 2030 and 2040, with peaks in 2033, 2034, and 2033, respectively. It is worth noting that the main purpose of scenario analysis is not to accurately estimate carbon dioxide emissions under specific economic conditions but to reveal how different policies would affect carbon dioxide emissions and then find an effective mitigation pathway (Zhang X. et al., 2017). Therefore, we need to find the pathway to reducing carbon dioxide emissions by comparing different scenarios.

FIGURE 2. Projected carbon dioxide emissions in six scenarios (100 million tons).
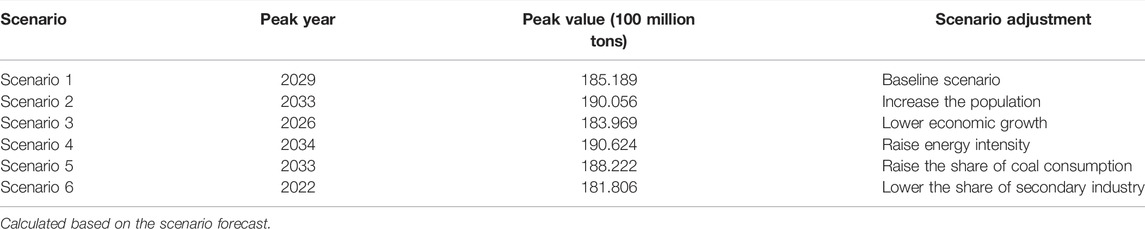
TABLE 4. Scenarios and forecast.
Data Source: Calculated based on the scenario forecast.
In scenario 2, as compared to scenario 1, what changed is population size. It is larger than scenario 1. This has two effects on carbon dioxide emissions, one is that the increase in population size increases carbon dioxide emissions according to the regression results of the STIRPAT model, and the other is that, with GDP unchanged, the population growth reduces GDP per capita, which in turn reduces carbon dioxide emissions. Although the two drivers are opposite, the regression coefficient of the population size variable is higher than GDP per capita, which ultimately leads to higher emissions than scenario 1, with the peak year delayed to 2033 and a peak of 19.0056 billion tons. This is mainly because population size is assumed to grow at an average annual growth rate in 2015–2020 in scenario 2, and China liberalized its one-child policy in 2015, which accelerated population growth and led to an increase in carbon dioxide emissions and a later peak year. Therefore, appropriate control of population size is still necessary to achieve the peaking carbon dioxide emissions as soon as possible.
Compared to the rate of economic growth in scenario 1, the GDP growth rate is lower in scenario 3. which reduces GDP per capita and carbon dioxide emissions when the population remains the same. Scenario 3 will peak at 18.3969 billion tons in 2026 which is similar to scenario 1. It can be seen that the lower economic growth rate will lead to a peak year forward. In other words, the higher economic growth will push back the turning point of the carbon dioxide emissions curve, because if China’s economy is allowed to grow as rapidly as it has over the past few decades, it is bound to continue its extensive growth model of high input and high output, leading to a continued increase in carbon dioxide emissions. This is the main reason why the Chinese government has proposed to promote high-quality development in recent years, not a high rate of development.
Compare scenario 4 with scenario 1 show that, all other things being equal, the 2030 peaking carbon dioxide emissions can not be achieved if energy intensity is projected to decline at the rate of the last 5 years. In this scenario, the carbon dioxide emissions peaked at 19.0624 billion tons in 2034. The reason is that China’s energy intensity has declined slowly in the last 5 years and energy efficiency has not improved significantly. The high energy intensity leads to high emissions, which is not conducive to achieving the peaking carbon dioxide emissions as soon as possible. Therefore, it is reasonable to set the future targets of energy intensity reduction like scenario 1, and the cost of reducing energy intensity is also relatively low. If continuous energy intensity reduction is held back due to the increasing cost and technical difficulties, carbon trading schemes will be one of the most effective measures for encouraging business organizations to improve energy utilization efficiency (Zhou et al., 2014).
Compared with scenario 1, scenario 5 increases the share of coal consumption, resulting in carbon dioxide emissions higher than scenario 1. In this scenario, the carbon dioxide emissions peaked at 18.8222 billion tons in 2033. This means that energy structural adjustment has great potential to reduce carbon dioxide emissions and reducing the share of coal consumption is one of the main measures that can be taken to achieve the goal of peaking carbon dioxide emissions by 2030. Accelerating energy pricing reform is a necessary pathway to energy structural adjustment (Lund, 2007). The government should continue to raise the price of coal consumption, but due to the current high cost and price of clean energy development, to increase their consumption, it can be subsidized.
Compared with scenario 1, scenario 6 reduces the share of secondary industry in GDP, resulting in a faster decline in carbon dioxide emissions, with the peak year moving forward to 2022 and the lowest peak value of 18.1806 billion tons. So the optimization of industrial structure is expected to exert greater emissions reduction potential. In the past 30 years, the industrial sector has been playing the dominant role in China’s carbon dioxide emissions. In contrast, the development of tertiary industry has helped to reduce carbon dioxide emissions. Therefore, optimization of industrial structure is also an urgent task for China to achieve the goal of carbon dioxide emissions.
Each curve in Figure 2 has an inverted U shape, which proves the existence of the EKC curve, but the rate of change and turning point of each curve is different. Scenarios 2, 4, and 5 have a similar trend; the forecast values are higher than scenario 1. This is because scenarios 2, 4, and 5 raise the value of the determination of carbon dioxide emissions, resulting in a later peak year, and a slower rate of decline after the peak. But the curves of scenarios 3 and 6 are lower than scenario 1 and decrease rapidly after reaching their turning points, this shows that optimizing the industrial structure and reducing the economic growth rate is a very effective measure.
Conclusions, Recommendations, and Limitations
Conclusions
Based on the extended STIRPAT model, a fitting model of carbon dioxide emissions and population size, GDP per capita, energy intensity and other factors is constructed, and ridge regression is used to analyze the effects of driving factors on carbon dioxide emissions. Then six scenarios are set up to forecast the peaking carbon dioxide emissions of China from 2020 to 2040. The findings:
(1) Population size, GDP per capita, energy intensity, the share of coal consumption, urbanization level, and the share of secondary industry, and investment all have significant positive effects on carbon dioxide emissions. It shows that the increase in these driving factors will lead to an increase in carbon dioxide emissions. Among them, the influence of population size is the largest, followed by the share of coal consumption, the share of secondary industry, and urbanization level, and energy intensity is the weakest.
(2) The scenario forecast finds that under the baseline scenario China’s carbon dioxide emissions will peak in 2029 and is able to achieve the goal of peaking carbon dioxide emissions. Increasing the rate of population growth, energy intensity, and the share of coal consumption will increase carbon dioxide emissions and push back the peak year. A lower rate of economic growth and a lower share of secondary industry would lead to lower emissions and an earlier peak year.
(3) To ensure the smooth realization of China’s goal of peaking carbon dioxide emissions, it is necessary to control the population size reasonably, reduce energy intensity, optimize the industrial structure and energy consumption structure, reduce the share of coal consumption, and share of secondary industry. At the same time, China should take the ecological civilization construction as the development idea, guaranteeing the economy high-quality development, but not the high-speed.
Recommendations
Achieving the goal of peak carbon dioxide emissions in 2030 will require multiple efforts:
First, China should continue to reduce energy intensity. Although China’s energy intensity has declined in recent years, it is still higher than the world average. Because technological developments and improvements influence the structures and functions of societies (Işık, 2013), the government should actively guide and encourage enterprises to participate in international cooperation and introduce advanced technologies in the field of energy. At the same time, China should continue to improve the independent research and development capability of core energy technologies, provide financial support, and assistance to enterprises in their technological innovation work, increase investment in green technology research and development, and reduce the loss of resources in the process of production, exchange, and consumption to improve energy efficiency. Due to the generally high energy intensity in the western region, it is very important to reduce the energy intensity in the western region, especially in Shanxi and Ningxia provinces. The government should encourage the developed eastern regions to provide green technology and financial support to the West in order to balance regional development.
Second, speed up the adjustment of industrial structure. This is not only an important way to achieve peaking carbon dioxide emissions as soon as possible but also a condition for carbon neutrality by 2060. Although China’s share of the secondary industry dropped below 40% in 2019, it is still relatively high compared with developed countries. Therefore, China should speed up the reduction of the share of secondary industry. A scientific and reasonable plan for reducing the production capacity of high-energy consuming industries should be made as soon as possible at the national level in China, clear the objectives and tasks of all regions and high-energy-consuming enterprises to reduce their production capacity. Governments at all levels should accelerate the green transformation of steel, petrochemical, chemical, non-ferrous metals, building materials, textiles, leather, and other industries, and encourage the use of energy-saving and environmental-friendly materials in the construction industry. At the same time, China should develop vigorously the modern service industry, develop new-generation information technology, biotechnology, high-end equipment, new energy, new materials, other strategic emerging industries, and promote the convergence of emerging technologies and industries such as the internet, artificial intelligence, big data, and 5G. Green finance should also be taken seriously, developing green credit and green direct financing, and strengthen the assessment of green financial performance of financial institutions.
Third, continue to optimize the energy consumption structure. Due to the imperfect security mechanism of non-fossil energy development and the high cost of new energy, China still consumes most of its energy from fossil energy, especially the share of coal consumption is still higher than 50%. Therefore, China should accelerate the development of clean energy, research and develop low-carbon cutting-edge technologies, accelerate the development of key core technologies, and improve the absorption level of renewable energy such as wind, solar, and hydroelectricity. The government should continue to raise the price of coal consumption and limit the speed of coal mining. At the same time, China should improve the mechanism to ensure the development of non-fossil energy, accelerate technology research and development to reduce the production cost of renewable energy, give tax preference or financial subsidy to new energy products, and reduce the consumer prices of it to encourage people to buy new energy products such as new energy vehicles, and continue to increase the proportion of new energy consumption.
In addition, since the COVID-19 spread around the world, the global economic outlook is more uncertain than ever before (Işık et al., 2020). The pandemics may profoundly impact human beings (Ahmad et al., 2021). The impact has led to a reduction in social activities and industrial production and a significant reduction in energy demand and carbon dioxide emissions. But this uncertainty may be temporary and carbon dioxide emissions are likely to rebound in the next few years. So to ensure that the peaking carbon dioxide emissions is reached on schedule, China must incorporate strong climate governance actions into future planning, underpinned by structural economic change and choose a recovery path that is conducive to green stimulus and less investment in fossil fuels.
Limitations
However, it should be noted that our study may have several limitations. For one thing, limited by the availability of energy data, the sample size of data is relatively small and the result of the STIRPAT model may only reflect the situation from 1995 to 2019. Although the coefficients of variables are as expected, their size may be different from that of a large sample, so the sample size should be expanded in future research. For another, the selection of control variables may not be comprehensive, there may be some missing information and future research should increase the number of determinants to obtain more perfect information. Moreover, in this study, only six scenarios are set for forecast analysis, which may not fully reflect the impact of each determinant on carbon emissions. In the follow-up study, more scenarios should be set to find more pathways.
Data Availability Statement
The original contributions presented in the study are included in the article/Supplementary Material; further inquiries can be directed to the corresponding authors.
Author Contributions
HuZ: conceptualizing, writing, and drafting-original draft; JH: data collection; FH: empirical estimations, drafting-original draft; HoZ: data collection and empirical estimations.
Funding
This work was supported by Tianjin Social Science Project (TJTJ20-001).
Conflict of Interest
The authors declare that the research was conducted in the absence of any commercial or financial relationships that could be construed as a potential conflict of interest.
Publisher’s Note
All claims expressed in this article are solely those of the authors and do not necessarily represent those of their affiliated organizations, or those of the publisher, the editors, and the reviewers. Any product that may be evaluated in this article, or claim that may be made by its manufacturer, is not guaranteed or endorsed by the publisher.
References
Ahmad, M., Akhtar, N., Jabeen, G., Irfan, M., Khalid Anser, M., Wu, H., et al. (2021). Intention-based Critical Factors Affecting Willingness to Adopt Novel Coronavirus Prevention in Pakistan: Implications for Future Pandemics. Int. J. Environ. Res. Public Health 18 (11), 6167. doi:10.3390/ijerph18116167
Alola, A. A. (2019). The Trilemma of Trade, Monetary and Immigration Policies in the United States: Accounting for Environmental Sustainability. Sci. Total Environ. 658, 260–267. doi:10.1016/j.scitotenv.2018.12.212
Bélaïd, F., and Youssef, M. (2017). Environmental Degradation, Renewable and Non-renewable Electricity Consumption, and Economic Growth: Assessing the Evidence from Algeria. Energy Policy 102, 277–287. doi:10.1016/j.enpol.2016.12.012
Bento, J. P. C., and Moutinho, V. (2016). CO2 Emissions, Non-renewable and Renewable Electricity Production, Economic Growth, and International Trade in Italy. Renew. Sustain. Energy Rev. 55, 142–155. doi:10.1016/j.rser.2015.10.151
Chen, X., Shuai, C., Wu, Y., and Zhang, Y. (2020). Analysis on the Carbon Emission Peaks of China's Industrial, Building, Transport, and Agricultural Sectors. Sci. Total Environ. 709, 135768. doi:10.1016/j.scitotenv.2019.135768
Cui, E., Ren, L., and Sun, H. (2017). Analysis on the Regional Difference and Impact Factors of CO2emissions in China. Environ. Prog. Sustain. Energy 36 (5), 1282–1289. doi:10.1002/ep.12590
Cui, X., Zhao, K., Zhou, Z., and Huang, P. (2021). Examining the Uncertainty of Carbon Emission Changes: A Systematic Approach Based on Peak Simulation and Resilience Assessment. Environ. Impact Assess. Rev. 91, 1–11. doi:10.1016/j.eiar.2021.106667
Dietz, T., and Rosa, E. A. (1994). Rethinking the Environmental Impacts of Population, Affluence, and Technology. Hum. Ecol. Review 1, 277–300.
Dogan, E., and Seker, F. (2016). Determinants of CO2 Emissions in the European Union: The Role of Renewable and Non-renewable Energy. Renew. Energy 94, 429–439. doi:10.1016/j.renene.2016.03.078
Dong, K., Dong, X., and Dong, C. (2019). Determinants of the Global and Regional CO2 Emissions: What Causes what and where? Appl. Econ. 51 (46), 5031–5044. doi:10.1080/00036846.2019.1606410
Du, L., Wei, C., and Cai, S. (2012). Economic Development and Carbon Dioxide Emissions in China: Provincial Panel Data Analysis. China Econ. Rev. 23 (2), 371–384. doi:10.1016/j.chieco.2012.02.004
Ehrlich, P. R., and Holdren, J. P. (1971). Impact of Population Growth. Science 171, 1212–1217. doi:10.1126/science.171.3977.1212
Fan, S., and Lu, Z. (2022). Research on the Peak Carbon Dioxide Emission Strategy of Chinese Port Based on Carbon Emission Estimation. Front. Environ. Sci. 9, 1–6. doi:10.3389/fenvs.2021.789970
Fan, Y., Liu, L.-C., Wu, G., and Wei, Y.-M. (2006). Analyzing Impact Factors of CO2 Emissions Using the STIRPAT Model. Environ. Impact Assess. Rev. 26 (4), 377–395. doi:10.1016/j.eiar.2005.11.007
Fang, K., Li, C., Tang, Y., He, J., and Song, J. (2022). China’s Pathways to Peak Carbon Emissions: New Insights from Various Industrial Sectors. Appl. Energy 306, 1–10. doi:10.1016/j.apenergy.2021.118039
Gong, W., Wang, C., Fan, Z., and Xu, Y. (2022). Drivers of the Peaking and Decoupling between CO2 Emissions and Economic Growth Around 2030 in China. Environ. Sci. Pollut. Res. 29, 3864–3878. doi:10.1007/s11356-021-15518-6
Hao, Y., Zhang, Z.-Y., Liao, H., Wei, Y.-M., and Wang, S. (2016). Is CO2 Emission a Side Effect of Financial Development? An Empirical Analysis for China. Environ. Sci. Pollut. Res. 23 (20), 21041–21057. doi:10.1007/s11356-016-7315-8
Hao, Y., Xu, L., Guo, Y., and Wu, H. (2022). The Inducing Factors of Environmental Emergencies: Do Environmental Decentralization and Regional Corruption Matter? J. Environ. Manag. 302, 1–14. doi:10.1016/j.jenvman.2021.114098
IEA (2021). TWorld Energy Outlook 2021. Available at: www.iea.org/weo
Işik, C., Kasımatı, E., and Ongan, S. (2017). Analyzing the Causalities between Economic Growth, Financial Development, International Trade, Tourism Expenditure And/on the CO2 Emissions in Greece. Energy Sources Part B Econ. Plan. Policy 12 (7), 665–673. doi:10.1080/15567249.2016.1263251
Işık, C., Ongan, S., and Özdemir, D. (2019). Testing the EKC Hypothesis for Ten US States: an Application of Heterogeneous Panel Estimation Method. Environ. Sci. Pollut. Res. Int. 26 (11), 10846–10853. doi:10.1007/s11356-019-04514-6
Işık, C., Sirakaya-Turk, E., and Ongan, S. (2020). Testing the Efficacy of the Economic Policy Uncertainty Index on Tourism Demand in USMCA: Theory and Evidence. Tour. Econ. 26 (8), 1344–1357. doi:10.1177/1354816619888346
Işık, C. (2013). The Importance of Creating a Competitive Advantage and Investing in Information Technology for Modern Economies: An ARDL Test Approach from Turkey. J. Knowl. Econ. 4 (4), 387–405. doi:10.1007/s13132-011-0075-2
Kaya, Y. (1990). Impact of Carbon Dioxide Emission Control on GNP Growth: Interpretation of Proposed Scenarios. Paris: Paper presented to the IPCC Energy and Industry Subgroup, Response Strategies Working Group.
Lin, B., and Raza, M. Y. (2019). Analysis of Energy Related CO2 Emissions in Pakistan. J. Clean. Prod. 219, 981–993. doi:10.1016/j.jclepro.2019.02.112
Lin, S., Wang, S., Marinova, D., Zhao, D., and Hong, J. (2017). Impacts of Urbanization and Real Economic Development on CO2 Emissions in Non-high Income Countries: Empirical Research Based on the Extended STIRPAT Model. J. Clean. Prod. 166, 952–966. doi:10.1016/j.jclepro.2017.08.107
Liu, W., Luo, Z., and Xiao, D. (2022). Age Structure and Carbon Emission with Climate-Extended STIRPAT Model-A Cross-Country Analysis. Front. Environ. Sci. 9, 1–25. doi:10.3389/fenvs.2021.719168
Lund, H. (2007). Renewable Energy Strategies for Sustainable Development. Energy 32 (6), 912–919. doi:10.1016/j.energy.2006.10.017
Martínez-Zarzoso, I., and Maruotti, A. (2011). The Impact of Urbanization on CO2 Emissions: Evidence from Developing Countries. Ecol. Econ. 70, 1344–1353. doi:10.1016/j.ecolecon.2011.02.009
Parshall, L., Gurney, K., Hammer, S. A., Mendoza, D., Zhou, Y., and Geethakumar, S. (2010). Modeling Energy Consumption and CO2 Emissions at the Urban Scale: Methodological Challenges and Insights from the United States. Energy Policy 38, 4765–4782. doi:10.1016/j.enpol.2009.07.006
Poumanyvong, P., and Kaneko, S. (2010). Does Urbanization Lead to Less Energy Use and Lower CO2 Emissions? A Cross-Country Analysis. Ecol. Econ. 70 (2), 434–444. doi:10.1016/j.ecolecon.2010.09.029
Ren, F., and Long, D. (2021). Carbon Emission Forecasting and Scenario Analysis in Guangdong Province Based on Optimized Fast Learning Network. J. Clean. Prod. 317, 1–16. doi:10.1016/j.jclepro.2021.128408
Shahbaz, M., Loganathan, N., Muzaffar, A. T., Ahmed, K., and Ali Jabran, M. (2016). How Urbanization Affects CO2 Emissions in Malaysia? The Application of STIRPAT Model. Renew. Sustain. Energy Rev. 57, 83–93. doi:10.1016/j.rser.2015.12.096
Shi, A. (2003). The Impact of Population Pressure on Global Carbon Dioxide Emissions, 1975-1996: Evidence from Pooled Cross-Country Data. Ecol. Econ. 44 (1), 29–42. doi:10.1016/s0921-8009(02)00223-9
Shuai, C., Shen, L., Jiao, L., Wu, Y., and Tan, Y. (2017). Identifying Key Impact Factors on Carbon Emission: Evidences from Panel and Time-Series Data of 125 Countries from 1990 to 2011. Appl. Energy 187, 310–325. doi:10.1016/j.apenergy.2016.11.029
Shuai, C., Chen, X., Wu, Y., Tan, Y., Zhang, Y., and Shen, L. (2018). Identifying the Key Impact Factors of Carbon Emission in China: Results from a Largely Expanded Pool of Potential Impact Factors. J. Clean. Prod. 175, 612–623. doi:10.1016/j.jclepro.2017.12.097
Shum, W. Y., Ma, N., Lin, X., and Han, T. (2021). The Major Driving Factors of Carbon Emissions in China and Their Relative Importance: An Application of the LASSO Model. Front. Energy Res. 9, 1–7. doi:10.3389/fenrg.2021.726127
Su, Y., Liu, X., Ji, J., and Ma, X. (2021). Role of Economic Structural Change in the Peaking of China's CO2 Emissions: An Input–Output Optimization Model. Sci. Total Environ. 761, 1–10. doi:10.1016/j.scitotenv.2020.143306
Tang, M., and Hu, F. (2021). How Does Land Urbanization Promote CO2 Emissions Reduction? Evidence from Chinese Prefectural-Level Cities. Front. Environ. Sci. 9, 1–16. doi:10.3389/fenvs.2021.766839
Tang, R., Zhao, J., Liu, Y., Huang, X., Zhang, Y., Zhou, D., et al. (2022). Air Quality and Health Co-benefits of China's Carbon Dioxide Emissions Peaking before 2030. Nat. Commun. 13, 1008–1009. doi:10.1038/s41467-022-28672-3
Wang, C., Wang, F., Zhang, X., Yang, Y., Su, Y., Ye, Y., et al. (2017). Examining the Driving Factors of Energy Related Carbon Emissions Using the Extended STIRPAT Model Based on IPAT Identity in Xinjiang. Renew. Sustain. Energy Rev. 67, 51–61. doi:10.1016/j.rser.2016.09.006
Wei, J., Huang, K., Yang, S., Li, Y., Hu, T., and Zhang, Y. (2017). Driving Forces Analysis of Energy-Related Carbon Dioxide (CO2) Emissions in Beijing: an Input-Output Structural Decomposition Analysis. J. Clean. Prod. 163, 58–68. doi:10.1016/j.jclepro.2016.05.086
Wen, L., Zhang, J., and Song, Q. (2022). A Scenario Analysis of Chinese Carbon Neutral Based on STIRPAT and System Dynamics Model. Environ. Sci. Pollut. Res. 3, 1–26. doi:10.1007/s11356-022-19595-z
Wu, Y., Shen, L., Zhang, Y., Shuai, C., Yan, H., Lou, Y., et al. (2019). A New Panel for Analyzing the Impact Factors on Carbon Emission: A Regional Perspective in China. Ecol. Indic. 97, 260–268. doi:10.1016/j.ecolind.2018.10.006
Wu, H., Xu, L., Ren, S., Hao, Y., and Yan, G. (2020). How Do Energy Consumption and Environmental Regulation Affect Carbon Emissions in China? New Evidence from a Dynamic Threshold Panel Model. Resour. Policy 67, 101678. doi:10.1016/j.resourpol.2020.101678
Wu, H., Xue, Y., Hao, Y., and Ren, S. (2021). How Does Internet Development Affect Energy-Saving and Emission Reduction? Evidence from China. Energy Econ. 103, 1–21. doi:10.1016/j.eneco.2021.105577
Wu, Y., Zhou, Y., Liu, Y., and Liu, J. (2022). A Race between Economic Growth and Carbon Emissions: How Will the CO2 Emission Reach the Peak in Transportation Industry? Front. Energy Res. 9, 1–11. doi:10.3389/fenrg.2021.778757
Xiong, C., Chen, S., and Xu, L. (2020). Driving Factors Analysis of Agricultural Carbon Emissions Based on Extended STIRPAT Model of Jiangsu Province, China. Growth Change 51 (3), 1401–1416. doi:10.1111/grow.12384
Xu, B., and Lin, B. (2015a). Factors Affecting Carbon Dioxide (CO2) Emissions in China's Transport Sector: A Dynamic Nonparametric Additive Regression Model. J. Clean. Prod. 101, 311–322. doi:10.1016/j.jclepro.2015.03.088
Xu, B., and Lin, B. (2015b). How Industrialization and Urbanization Process Impacts on CO2 Emissions in China: Evidence from Nonparametric Additive Regression Models. Energy Econ. 48, 188–202. doi:10.1016/j.eneco.2015.01.005
Xu, H., Pan, X., Guo, S., and Lu, Y. (2021). Forecasting Chinese CO2 Emission Using a Non-linear Multi-Agent Intertemporal Optimization Model and Scenario Analysis. Energy 228, 120514. doi:10.1016/j.energy.2021.120514
Yang, X., Wang, J., Cao, J., Ren, S., Ran, Q., and Wu, H. (2021). The Spatial Spillover Effect of Urban Sprawl and Fiscal Decentralization on Air Pollution: Evidence from 269 Cities in China. Empir. Econ. 11, 1–29. doi:10.1007/s00181-021-02151-y
Yao, X., Kou, D., Shao, S., Li, X., Wang, W., and Zhang, C. (2018). Can Urbanization Process and Carbon Emission Abatement Be Harmonious? New Evidence from China. Environ. Impact Assess. Rev. 71, 70–83. doi:10.1016/j.eiar.2018.04.005
Zhang, X., Zhao, X., Jiang, Z., and Shao, S. (2017). How to Achieve the 2030 CO2 Emission-Reduction Targets for China's Industrial Sector: Retrospective Decomposition and Prospective Trajectories. Glob. Environ. Change 44, 83–97. doi:10.1016/j.gloenvcha.2017.03.003
Zhang, Y. J., Peng, Y.-L., Ma, C.-Q., and Shen, B. (2017). Can Environmental Innovation Facilitate Carbon Emissions Reduction? Evidence from China. Energy Policy 100, 18–28. doi:10.1016/j.enpol.2016.10.005
Zhao, X., Zhang, X., and Shao, S. (2016). Decoupling CO2 Emissions and Industrial Growth in China over 1993-2013: The Role of Investment. Energy Econ. 60, 275–292. doi:10.1016/j.eneco.2016.10.008
Zhou, Y., and Liu, Y. (2016). Does Population Have a Larger Impact on Carbon Dioxide Emissions Than Income? Evidence from a Cross-Regional Panel Analysis in China. Appl. Energy 180, 800–809. doi:10.1016/j.apenergy.2016.08.035
Zhou, P., Sun, Z. R., and Zhou, D. Q. (2014). Optimal Path for Controlling CO2 Emissions in China: A Perspective of Efficiency Analysis. Energy Econ. 45, 99–110. doi:10.1016/j.eneco.2014.06.019
Keywords: carbon dioxide emissions, STIRPAT model, scenario analysis, peaking carbon dioxide emissions, China
Citation: Zhao H, Hu J, Hao F and Zhang H (2022) Determinants of Carbon Dioxide Emissions and Their Peaking Prospect: Evidence From China. Front. Environ. Sci. 10:913835. doi: 10.3389/fenvs.2022.913835
Received: 06 April 2022; Accepted: 05 May 2022;
Published: 14 June 2022.
Edited by:
Cem Işık, Anadolu University, TurkeyReviewed by:
Haitao Wu, Beijing Institute of Technology, ChinaShijin Wang, Jiangsu Normal University, China
Copyright © 2022 Zhao, Hu, Hao and Zhang. This is an open-access article distributed under the terms of the Creative Commons Attribution License (CC BY). The use, distribution or reproduction in other forums is permitted, provided the original author(s) and the copyright owner(s) are credited and that the original publication in this journal is cited, in accordance with accepted academic practice. No use, distribution or reproduction is permitted which does not comply with these terms.
*Correspondence: Huiqing Zhao, emhxODgyODIyMDlAdGpjdS5lZHUuY24=; Feng Hao, aGJoamhmQDEyNi5jb20=