 Yongjiu Liu
 Wei Wang1
- 1School of Public Finance and Taxation, Dongbei University of Finance and Economics, Dalian, China
- 2School of Economics, Dongbei University of Finance and Economics, Dalian, China
China has implemented a series of tax system reforms to improve the business environment, reduce the burden on enterprises and promote supply-side structural reform. In this article, we focus on the value-added tax (VAT) rate reduction that occurred in 2018 and 2019. We analyse the mechanism of the impact of the value-added tax rate reduction on enterprises’ costs and conduct an empirical test using the DID model and data from Chinese listed companies. The main conclusions are as follows. First, the reduction of VAT rate can significantly reduce the total cost of enterprises. This means that the reduction of VAT rate plays a positive role in reducing enterprise burden, stimulating enterprise vitality and improving enterprise performance. Second, the “cost reduction” effect is more obvious in non-state-owned enterprises than state-owned enterprises. Third, Further heterogeneity analysis shows that the cost reduction effect is more obvious in enterprises that are high-cost, large scale, and those located in eastern China. Small and medium-sized enterprises and those found in the central and western regions failed to significantly reduce operating costs, indicating that they did not benefit fully from a reduced VAT rate, which partly shows that the benefits of VAT tax reduction are not evenly distributed among enterprises. This study can provide a reference for the government to further improve the tax system, optimize the living environment of enterprises, and promote the sustainable development of economy.
1 Introduction
After decades of rapid growth, China’s economy has entered a new normal, which is characterized by structural deceleration of economic growth, optimization and upgrading of economic structure, and transformation of driving forces of economic development. Under the new normal, China’s economy faces new problems and challenges, such as rising production and operation costs, increasing debt risks, mismatch between supply and demand, insufficient innovation capacity and so on. In order to adapt to the new normal, lead the new normal and promote high-quality economic growth, the Chinese central government has begun to implement supply-side structural reform, which includes five key tasks: cost reduction, deleveraging, inventory reduction, overcapacity reduction and shoring up weak spots.
High production and operation costs restrain the vitality of micro economic entities, reduce their endogenous power to expand reproduction, limit the R&D and innovation capabilities of enterprises, lead to a large number of enterprises with high debts, bankruptcy or zombie, and worsen the economic development environment. So, reducing the real economy operation costs is the core of the supply-side reform. “Cost reduction” affects whether supply-side reform tasks such as “deleveraging”, “shoring up weak links” and “cutting overcapacity” can be accomplished. At the same time, the real economy is weak, the rate of return on industrial investment declines, and a large number of enterprises are financialized and put capital into the virtual economy. The real economy is faced with the risk of “hollowing out”, negatively affecting the healthy and stable development of China’s economy. It can be said that “cost reduction” is a key link in promoting supply-side structural reform and improving the business environment, an important starting point to promote the high-quality and sustainable development of China’s economy, and also a long-term task in the construction of China’s modern economic system.
Institutional quality has an important impact on energy efficiency (Sun et al., 2021), economic efficiency, production efficiency (Sobel, 2018) and innovation efficiency of a country or region. As tax system reform is key measure to improve institutional quality, optimize the living environment of enterprises, reduce the burden of enterprises, guide the behavior of enterprises, stimulate the vitality of market entities, promote the sustainable development of enterprises and high-quality economic development, China has introduced a number of reform measures since 2015, involving corporate income tax, business tax and VAT.
The tax burden accounts for a significant portion of production and operation costs. Many literatures have focused on the impact of tax policies on enterprise costs and performance. However, existing studies mainly focus on corporate income tax (Auerbach, 1989; Devereux et al., 2014; Moll, 2014) and “converting business tax to value-added tax” (Huang et al., 2019; Li and Wang 2020). As for the research on value-added tax, the existing literature pays more attention to its impact on investment, innovation and economic growth, but pays less attention to the cost and performance of enterprises.
VAT has an important impact on economic development (Asllani and Statovci, 2018; Ayoub and Mukherjee, 2019; Huang et al., 2019; Wang et al., 2019). Hoseini and Briand (2020) found that the replacement of sales tax with VAT in India improved production efficiency. Adhikari (2020) studied the influence of the introduction of VAT on the economic efficiency of developing countries by using the synthetic control method and believed that it significantly improved the economic efficiency. Ayoub and Mukherjee (2019) conducted an empirical study on the relationship between VAT and China’s economic growth, arguing that GDP is positively correlated with VAT in both the short and long run. Waseem (2022) confirmed that Pakistan’s VAT expansion significantly improved the sales performance of corresponding companies. Of course, VAT is not always beneficial. Alavuotunki et al. (2019) found that the introduction of VAT aggravated income inequality based on multi-country data. Adoho and Gansey (2019) found that the introduction of VAT caused the welfare loss of residents in the Democratic Republic of Congo.
In terms of VAT reform, the VAT transformation from production-based to consumption-based in China has attracted the attention of many scholars. Some scholars have proved that this reform can ease financing constraints of enterprises (Wang et al., 2021), optimize capital structure (Zou et al., 2019), increase fixed asset investment (Zhang et al., 2018), and promote enterprise innovation (Liu and Zhao, 2019). Moreover, it can also promote the upgrading of industrial structure (Shi et al., 2022) and improve the export trade of Chinese enterprises (Liu and Lu, 2015).
Tax rate adjustment is one of the important VAT reform measures, but there are relatively few related researches. Asllani and Statovci (2018) studied the impact of VAT rate changes on kosovo’s fiscal budget and economic development, and the results showed that the tax rate reduction had a positive impact on Kosovo’s budget revenue and GDP growth. Montag et al. (2020) studied the impact of the temporary VAT rate reduction on fuel by the German government and found that the tax rate increased the retail profit of fuel products. Kosonen (2015), Benzarti and Carloni (2019) respectively studied the effect of VAT rate reduction on the barber industry in Finland and the catering industry in France, and also found that the tax rate reduction increased corporate profits, but benefited consumers less. Bernal (2018) studied the impact of the reduction of VAT rate for groceries in Poland on consumers’ purchase price and found that the reduction of VAT rate did not reduce consumers’ purchase price. Mgammal (2021) finds that the increase of VAT rate will reduce the profitability of enterprises.
Few scholars have analyzed the influence mechanism of large-scale VAT rate reduction on enterprise operating costs and empirically tested its “cost reduction” effect. China lowered VAT rates twice, in 2018 and 2019, providing an opportunity to study the effect on cost reduction due to VAT rate cuts in developing countries.
Based on data from China’s A-share listed companies from 2016 to 2019, this paper studies the cost reduction effect of China’s VAT rate cut on enterprises in 2018 and 2019 by using propensity score matching and the difference-in-difference model (DID) and carries out parallel trend testing and placebo testing to ensure the robustness of results. In addition, we also conducted heterogeneity analysis from the perspective of enterprise size, region, etc.
This study has the following contributions. First, it expands the research on the effect of VAT rate reduction. We found that although VAT is an extrinsic tax and turnover tax, the change of tax rate will affect the production and operation cost of enterprises. Specifically, the reduction of VAT rate will not only affect the tax burden and transaction costs of enterprises, but also affect the production cost, financing scale and cost, sales expenses and administrative expenses of enterprises.
Second, the “cost reduction” effect of VAT rate reduction presents heterogeneity. The effect of “cost reduction” is related to the scale, region and ownership type of the enterprise. The reason for heterogeneity is that the benefits of VAT tax reduction cannot be evenly distributed among enterprises. The attribution of VAT burden is the result of the game between the seller and the buyer, and depends on the market position, price elasticity and bargaining power of the both sides. The same is true of the distribution of the benefits of the VAT rate cut.
Third, this research can provide a reference for the Chinese government to further optimize the VAT system and introduce targeted measures to reduce the burden for enterprises of different regions and sizes. In addition, the research results can also provide a reference for other developing countries on how to use tax policies to reduce enterprise costs and stimulate enterprise vitality while managing the effect of COVID-19 and economic recession.
2 Policy Background, Theoretical Analysis and Research Hypothesis
2.1 Policy Background: The 2018–2019 China VAT Rate cut
China cut its VAT rate twice, in 2018 and 2019, with both times affecting the same industries, including manufacturing, transportation and construction. In April 2018, the Ministry of Finance and the State Administration of Taxation of China issued a notice on the adjustment of VAT rate, stipulating that starting from 1 May 2018, the VAT rate of taxpayers engaged in taxable sales or imported goods, will be adjusted from 17 to 11%–16 and 10% respectively. In March 2019, the Ministry of Finance, the State Administration of Taxation, and the General Administration of Customs of China issued another notice, stipulating that from 1 April 2019, the VAT rate for general VAT taxpayers engaged in VAT taxable sales or imported goods will be adjusted from 16 to 13% and the tax rate of 10% will be reduced to 9%.
2.2 Theoretical Analysis
VAT is usually referred to as turnover tax or extraneous tax and has the characteristic of tax neutrality. According to China’s VAT accounting system, when an enterprise purchases goods or services, in addition to the purchase price, it also needs to pay VAT as an input tax. When it sells products or services, in addition to collecting the sale price, it will also collect VAT from the buyer, as an output tax; the portion of the output tax that exceeds the input tax is handed over to the state, and the VAT tax burden is passed down to consumers (Baum, 1991). Input tax, output tax and tax payable are not included in the profit accounting systems. Besides the urban construction tax and educational surcharge calculated by VAT payable, VAT has no other influence on cost and profit, so it does not play an effective role in reducing costs. However, this is not the case.
Although the nominal VAT burden is passed downstream due to the price mechanism, it is ultimately borne by consumers (Gentry and Ladd, 1994; Kenkel, 2005; Adhikari, 2020), but not all enterprises can achieve a perfect tax burden transfer in their market transactions (Bernal, 2018). When VAT is levied on certain goods, the seller usually hopes that the VAT burden should be borne by the buyer, expecting that they can still get the expected selling price (No tax price) and profit. However, the buyer also hopes that the VAT burden is borne by the seller, in order to reduce his purchase defray and capital occupation. The final distribution of the actual VAT burden depends on the game results of both sides.
When the tax burden cannot be completely transferred, or the capital cost of advanced input VAT is considered, or the product demand changes caused by the change of tax rate, the VAT is no longer completely neutral, and it is more likely to affect the operating cost and performance of enterprises.
First, the reduction of VAT rate may affect the tax cost borne by enterprises. Although VAT is an extraneous tax, when the buyer has a greater market position, bargaining power, and price flexibility, the VAT burden may not be transferred downward (Atkinson and Stiglitz, 1972), and thus be borne by the seller. In this case, the policy of VAT rate reduction will reduce the actual tax burden borne by the seller. In addition, according to China’s tax system, enterprises need to calculate and pay Urban Maintenance and Construction Tax and Additional Education Fees according to the nominal VAT payable. In fact, no matter how the actual VAT tax burden is distributed between the supply and demand, the decline of VAT rate will inevitably bring about the decline of nominal VAT tax payable, and thus will inevitably bring about the reduction of Urban Maintenance and Construction Tax and Additional Education Expenses (Liu and Ye, 2018).
Secondly, VAT rate reduction may affect the production cost of enterprises. When the VAT rate is reduced, the price of products including tax may be reduced, especially for enterprises with sales difficulties. Enterprises with sales difficulties prefer to give the tax benefits to buyers, that is, to reduce the price of products including tax to stimulate product demand (Miki, 2011; Gong, 2020). The increase of product demand will make enterprises increase output, further, may reduce the unit fixed cost of enterprises, and ultimately affect the production cost of products (Simmons, 2006). In addition, the increase of product demand is conducive to increasing the turnover speed of inventory and reducing operating costs.
Thirdly, The VAT rate cut may affect the cost of capital of enterprises. For enterprises, from the purchase of raw materials to product sales need a certain cycle, so VAT is often in the state of advance. After the VAT rate is lowered, enterprises may have less capital to advance in the purchase process (Liu and Ye, 2018), so their financing scale and financing cost can be reduced. At the same time, the increase of product demand and the acceleration of flow speed can also shorten the cash cycle of enterprises, thus shortening the financing term and financing cost.
Finally, the VAT rate cut may also affect selling and administrative expenses when “no deduction” and “regarded as sales” behaviour appears. “No deduction” means that when enterprises purchase goods and services for “simple tax calculation items”, “VAT exemption items”, “collective welfare” and “personal consumption”, the corresponding input tax shall not be deducted. In this case, the input tax of VAT shall be included in administrative or sales expenses according to its purpose, which the enterprise shall bear. The reduction of VAT rate reduces the input tax on such goods and services, thus reducing the management and sales expenses of enterprises. “Regarded as sales” means that when an enterprise uses its self-produced or entrusted products for “collective welfare”, “personal consumption”, or presents them to other companies or individuals for promotion, it still must pay VAT to the government, although it cannot collect the corresponding output tax. In this case, the enterprise also bears the VAT burden, which is included in the management expense or sales expense according to the specific behavior. The reduction of VAT rate reduces the output tax of such goods and services as sales, thus reducing the management and sales expenses of enterprises.
Based on the analysis, we propose the following research hypotheses:
Hypothesis 1. The VAT rate reduction can significantly promote the “cost reduction” of enterprises.There are enterprises with different ownership structures in China, and different types of enterprises have different market positions, resources and behaviors (Shi et al., 2020). The impact of VAT reform on different types of enterprises may also be different. The investor of state-owned enterprises is the government agency which has strong governance, political power (Sun et al., 2019) and financial strength. State-owned enterprises usually have high technology level, market status and special industry background, and their products are highly competitive or necessary for people’s life and social production, which makes state-owned enterprises have high bargaining power in market transactions and can transfer more tax burden to buyers. Therefore, the actual VAT tax burden of state-owned enterprises is usually less (Liu and Liu, 2013), and the change of product demand caused by the reduction of tax rate is also less. Furthermore, compared with non-state-owned enterprises, VAT tax reduction policy has less impact on production cost, tax cost and inventory turnover speed of state-owned enterprises. In addition, from the perspective of financing, due to the implicit guarantee provided by the government, state-owned enterprises are more favored in the financial market, and usually face lower financing constraints and financing costs (Li and Liu, 2009), and are less sensitive to capital costs. On the contrary, non-state-owned enterprises under the same conditions are more likely to face difficulties or high costs when financing (Liu and Ye, 2018; Zou et al., 2019). Therefore, the reduction of VAT rate has a relatively small impact on the scale and cost of debt financing of state-owned enterprises, and a greater impact on non-state-owned enterprises.Based on the analysis, we propose the following research hypotheses:
Hypothesis 2. The effect of VAT rate reduction on the cost of enterprises with different ownership is different. The “cost reduction” effect of non-state-owned enterprises is stronger, while the “cost reduction” effect of state-owned enterprises is weaker.
3 Materials and Methods
3.1 Data
We use the financial data of Chinese A-share listed companies from 2016 to 2019 as samples, and conduct screening according to the following criteria: (1) excluding listed companies in the financial and insurance industry; (2) Remove ST, *ST, and PT companies; (3) Deleting companies with missing or abnormal key financial data; (4) Excluding companies listed in 2016 and later; (5) Eliminating companies classified as comprehensive by industry to reduce the impact of the compound tax rate on industry grouping. Following this screening, 9,908 study sample observations were obtained from 2,477 companies during the 4-years study period. The financial data of the sample companies come from the China Wind and CSMAR databases.
3.2 Variables
Variables and their calculation methods in this paper are listed in Table 1. Since we are concerned about the impact of VAT rate reduction on enterprise production and operation cost, we take the total cost level of enterprise (
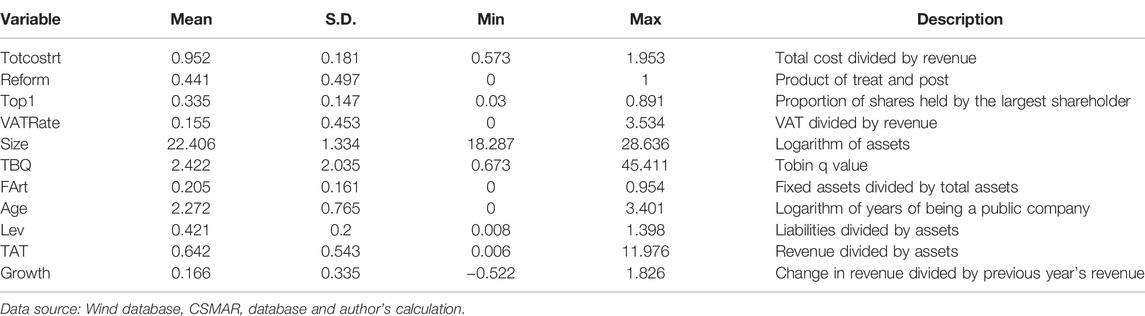
TABLE 1. Summary statistics and description of the variables.
Referring to the research of Gu and Wang (2020), in this paper, enterprise Size (Size), listing time (Age), asset-liability ratio (Lev), growth rate (Growth), VAT tax burden (VATRate), equity concentration (Top1), total asset turnover (TAT), and Tobin'S Q value (TBQ) were selected as control variables. Among them, VATRate is measured by the ratio of value-added tax paid by enterprises to business income, whereas the value-added tax paid by enterprises is calculated by urban construction tax, additional education fee and corresponding tax rate (additional rate) based on the practice of Cao and Li (2016).
3.3 Model Setting
We intend to use the difference in difference model (DID) to empirically test the “cost reduction” effect of VAT rate reduction. The treatment group consists of manufacturing and transportation industries that had a tax rate reduction in 2018 and 2019 and the control group is composed of industries without a tax rate reduction. Referring to the practice of Gruber and Poterba (1994), Zou et al. (2019), the DID model is established as follows:
Where
The application of the DID model requires that the treatment group and the control group should meet the common trend assumption, that is, if there is no VAT rate reduction, the cost indicators of both groups have no systematic difference over time. Because the treatment group sample is selected according to the industry to which it belongs, rather than randomly, the common trend assumption may not be satisfied. Propensity score matching (PSM) can solve this problem well (Heckman et al., 1997).
The result variable of this paper is cost (Totcostrt). What we need to test is the effect of VAT rate reduction on enterprise cost of the treatment group (
After propensity score matching (PSM) was performed on the sample, individuals in the treatment group were matched with similar individuals in the control group, thus the control group and the treatment group had a common trend. Thus, we can obtain the following equation.
Combined with Eqs 2, 3, the effect of VAT rate reduction on the treatment group can be expressed as:
The second line in formula (4) is the cost difference of the treatment group before and after the VAT rate reduction, and the third line is the cost difference of the control group before and after the VAT rate reduction. The difference between the second line and the third line is difference-in-difference, so the influence of other factors other than VAT rate reduction on enterprise cost can be excluded, and
Referring to existing literature and the R2 maximization principle, this paper selects similar control group enterprises for treatment group enterprises by using 1:2 nearest neighbor matching, with enterprise size, asset-liability ratio, growth, total assets turnover, etc as covariables and based on balance test and whether there are significant differences in the mean of covariables. Taking the enterprises processed by PSM as samples, the DID model is used for regression analysis.
4 Results
4.1 Descriptive Statistics
Table 1 lists the descriptive statistical results for the main variables. The mean value of Totcostrt is 0.952, that is, the ratio of total operating cost to total operating revenue is 95.2% on average, with a maximum value of 1.953 and a minimum value of 0.573. The cost burden of different enterprises varies greatly.
4.2 PSM Results
Table 2 lists the results of 1:2 nearest neighbor matching for the sample. It can be seen that the standard deviation of each covariable in the treatment group and the control group decreases significantly after matching. The absolute standard deviations of VAT Rate, Lev, Top1, TBQ, FArt, Age, Growth, Size and TAT decreased by 64.5, 95.4, 91.8, 90.7, 97.5, 98.8, 98.7, 82.7 and 87.7% respectively. According to the study of Rosenbaum and Rubin (1983), if the absolute standard deviation of the matched covariable is less than 20%, a good matching effect is achieved. In this paper, the absolute standard deviation of all covariables after matching is far less than 20%, and the maximum is only 7.1%, which indicates that sample characteristics of the treatment group and the control group become closer after propensity score matching, and the matching effect is good.
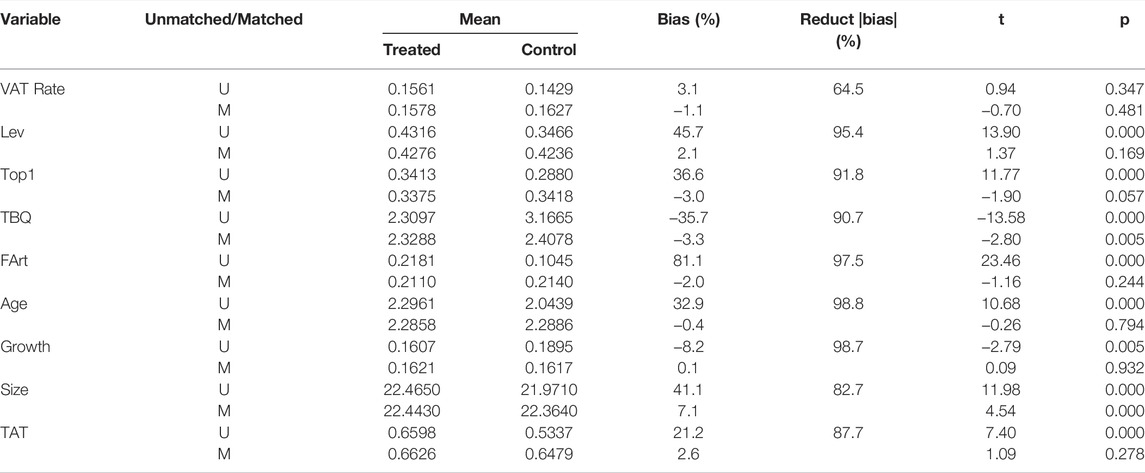
TABLE 2. Propensity score matching results.
4.3 Empirical Results
Table 3 lists the DID estimation results using model (1) and controlling firm fixed effect and year fixed effect to test the impact of VAT rate reduction on firm cost (Totcostrt). In column (1), we conducted regression analysis on all samples without distinguishing between state-owned enterprises and non-state-owned enterprises. The coefficient of the core explanatory variable Reform is negative and statistically significant (t = −2.63) at the 1% level, indicating that the reduction in VAT rate significantly reduces the total cost of the treatment group. Hypothesis 1 is verified.
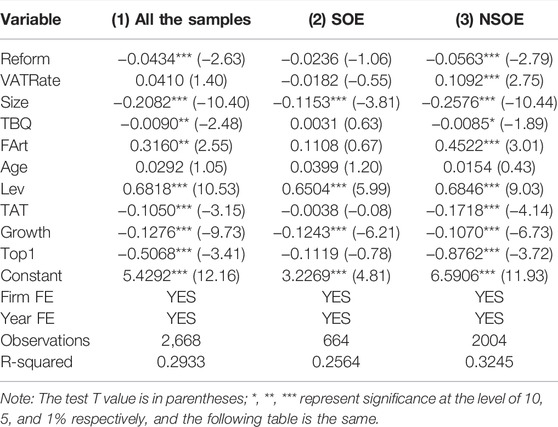
TABLE 3. Baseline results.
In order to compare the impact of VAT rate reduction policy on state-owned enterprises and non-state-owned enterprises, this paper divides the whole sample into two groups of state-owned enterprises and non-state-owned enterprises according to the ownership of enterprises. Model (1) is still used to conduct regression test for the two groups of samples respectively, and the results are shown in columns (2) and (3) of Table 3. It can be seen that the regression coefficient of the key variable Reform is -0.0236 in Column (2), but not significant (t = −1.06), while it is −0.0563 in Column (3), and is significantly negative (t = −2.79) at the 1% level, indicating that the “cost reduction” effect of VAT tax reduction policy in non-state-owned enterprises is greater than that of state-owned enterprises. This result verifies Hypothesis 2.
5 Robustness Tests
5.1 Common Trend Test
To ensure the robustness of results, based on the research of Shi et al. (2022), Wang (2013) and Amore et al. (2013), this paper introduces a series of intersection terms of time dummy variable “Dyear” and treatment group dummy variable “treat” into the main regression equation, and constructs a model (5) to test the common trend.
As 2016 is the base year, it is not included in the intersection term in model (5). If there is no significant difference between the coefficient
Column (1) of Table 4 reports the results of the common trend test for the total sample. Before the implementation of the policy,
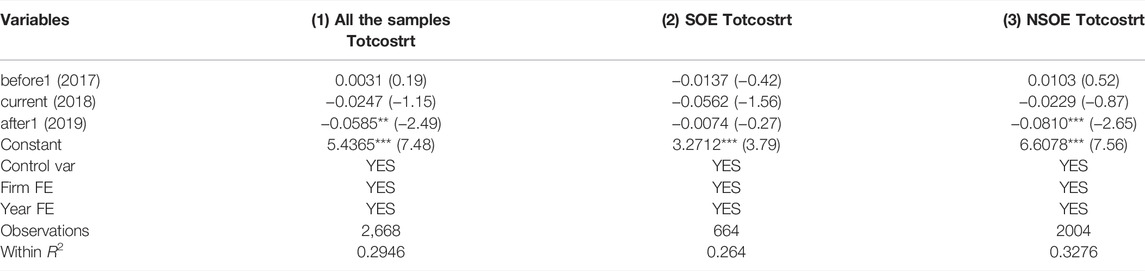
TABLE 4. Common trend test results.
5.2 Placebo Test
To further test that the cost change of the treatment group is indeed influenced by the VAT tax reduction policy rather than other confounding factors, two placebo tests were conducted for the fictitious policy implementation time and the fictitious treatment group.
5.2.1 Placebo Test 1: Assume That the Policy is implemented in 2017
Referring to Topalova (2010), it is assumed that the policy was implemented in 2017, at which time the estimated coefficient of interaction term should not be significant. If it is significant, it indicates that the decrease in component cost may be affected by other confounding factors, not just VAT tax reduction policy factors. Table 5 shows that the coefficients of interaction terms are insignificant.
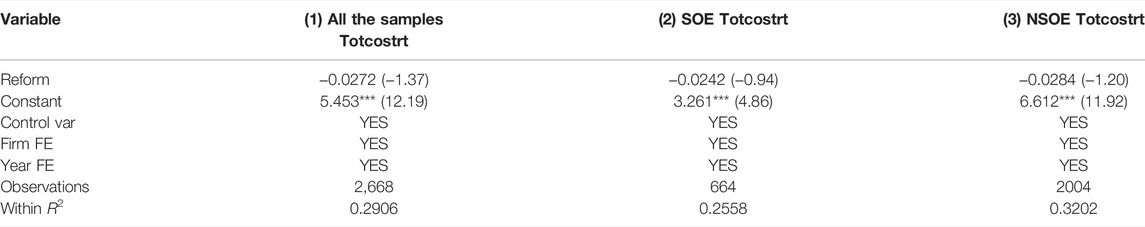
TABLE 5. Placebo test results (fictitious implementation time).
5.2.2 Placebo Test 2: Randomized Generation of Treatment Groups
Referring to the research of Cai et al. (2016), the treatment group is formed by a random selection of enterprises, and model (1) continued to be adopted for regression. Since the treatment groups in this test are randomly generated, the regression results of the coefficients of the interaction terms should be close to 0. Figure 1 reports test results after 500 repetitions. The mean value of regression coefficients is near 0, and most are insignificant, which is consistent with our expectations.
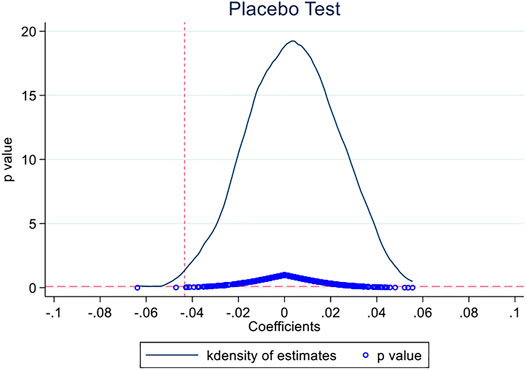
FIGURE 1. Placebo test of randomly assigning treatment groups. Test the performance of the business.
Through two kinds of placebo tests, the influence of other confounding factors on the enterprise “cost reduction” can be excluded.
According to the accounting equation “Income - Expense = Profit”1, a decrease in total cost (expense) will inevitably lead to an increase in profit, and the increase of profit can also prove the reduction of cost. Based on this, this paper uses model (1) to further investigate the influence of VAT rate cut policy on operating performance indicators, such as net profit margin on sales (ROS) and ratio of profits to cost (PCR). The results in columns (1) and (4) of Table 6 show that the VAT tax reduction policy significantly improves the business performance of enterprises in the treatment group. Similarly, the results in columns (3) and (6) of Table 6 show that the VAT tax reduction policy significantly improves the business performance of non-state-owned enterprises. The results in columns (2) and (5) of Table 6 show that the effect of VAT rate reduction policy on the performance of state-owned enterprises is still not significant, which is consistent with the results of master regression.
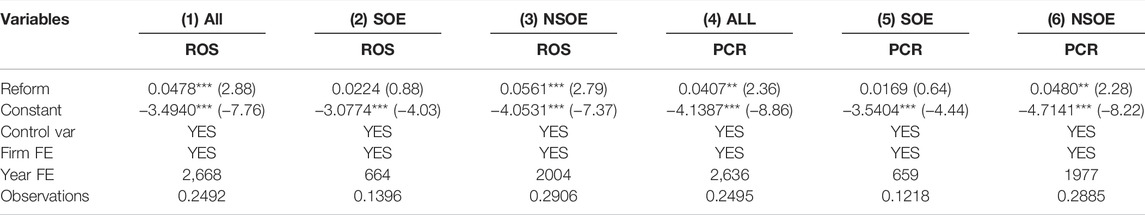
TABLE 6. Results of enterprise performance test.
5.3 Change the Matching Method
We changed the propensity score matching method to ensure the robustness of our empirical results. Specifically, we adopted four additional matching methods. Method (1): The ratio of 1:1 was used for nearest neighbor matching. Method (2): The ratio of 1:1 was used for nearest neighbor matching within caliper. Method (3): The ratio of 1:2 was used for nearest neighbor matching within caliper. Method (4): Kernel matching. For the samples matched by the above methods, we take enterprise cost (Totcostrt) as the explained variable and use model (1) for regression again, and the results are still robust which can be found in Table 7.
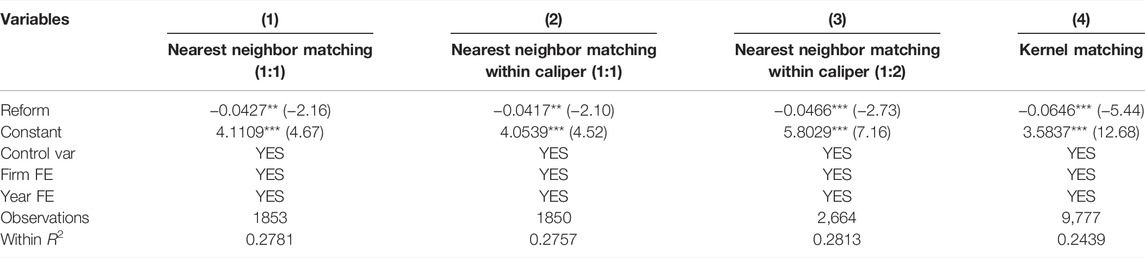
TABLE 7. Regression results after changing matching method.
5.4 Further Testing of the “Cost Reduction” Path
The theoretical analysis part of this paper proposes that the reduction of VAT rate will not only affect the tax burden that cannot be transferred, but also affect the total cost and performance of enterprises by affecting the production cost of products, financing scale and cost, sales expenses and administrative expenses. We tested these paths again using PSM and DID model. According to China’s accounting standards, after the product is sold, the product cost will be included in the operating cost, so we take the operating cost ratio (Procost) as the proxy variable of the product production cost. The reduction of VAT rate will also reduce the capital occupation of enterprises and reduce the financing cost, duration and scale. Therefore, we take enterprise debt level (Lev) as the proxy variable. The VAT rate reduction may reduce the VAT borne by enterprises due to “regarded as sales” and “no deduction”, thus leading to the total cost and performance of enterprises, but we cannot directly obtain the data of this part of the VAT. According to China’s accounting standards, the VAT borne by enterprises due to “regarded as sales” and “no deduction” will be included in the sales expenses or administrative expenses, so we examine the enterprise’s sales expenses (Salexp) and administrative expenses (Adexp). Column (1) of Table 8 lists the impact of VAT rate reduction on the production cost of enterprise products. It can be seen that the production cost of enterprise products decreases significantly after the VAT rate reduction (estimated coefficient is −0.0104, t-value is −1.66). Column (2) reports the impact of VAT rate reduction on corporate debt financing amount. It can be seen that the debt level of enterprises in the treatment group decreased significantly after the implementation of the policy (coefficient estimated value is −0.0166, t value is −2.35), which indicates that the tax rate reduction has a positive effect on reducing the debt financing amount and financing cost of enterprises. Columns (3) and (4) show the changes of enterprise sales expenses and administrative expenses. It can be seen that after the reduction of VAT rate, the level of sales expenses and administrative expenses of enterprises in the treatment group decreased significantly. Through the path test, we verified the mechanism of the impact of tax rate reduction on enterprise costs, which also provided stronger support for the conclusion of this study.
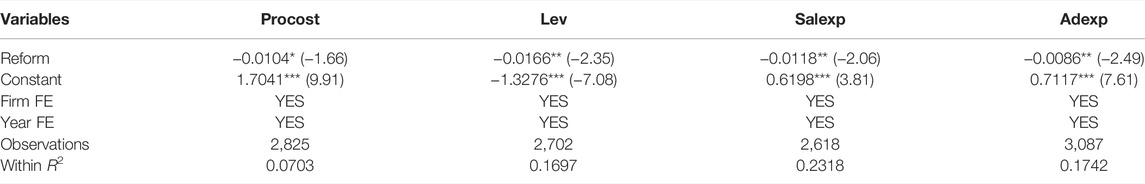
TABLE 8. Results of the path test.
6 Heterogeneity Analysis
Under the policy of VAT rate reduction, the cost reduction effect of different enterprises may be different. Therefore, this paper adopts model (1) to further investigate the heterogeneity of cost reduction outcomes from the perspective of size, region and cost level and presents the results in Table 9. Columns (1) and (2) show the cost reduction effect of enterprises with different cost levels. The higher the cost level, the more obvious the cost reduction effect of VAT rate reduction is. Large enterprises (LSE) have greater market position and bargaining power, so they are better able to enjoy the benefits of tax reduction, which is verified by the empirical results in Columns (3), (4) and (5). In addition, eastern China has a higher level of development, and enterprises there have higher management levels and can make better use of tax policies, so the cost reduction effect is more obvious, which is supported by the empirical results in Columns (6), (7) and (8).
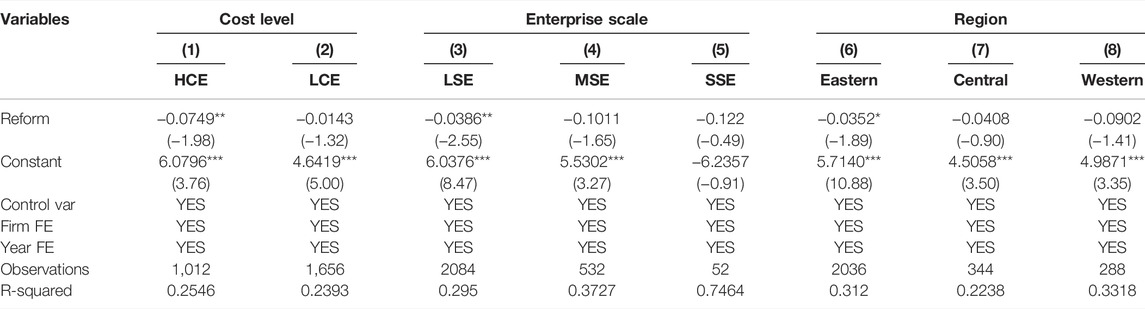
TABLE 9. Results of heterogeneity analysis.
7 Conclusion
Taking the 2018 and 2019 VAT rate cuts as a quasi-natural experiment and a-share listed companies from 2016 to 2019 as research samples, this paper uses propensity score matching and difference in difference method to test the “cost reduction” effect of VAT rate reduction. It is found that the reduction of VAT rate significantly reduces the production and operation costs of enterprises in the treatment group, and the “cost reduction” effect is more significant in non-state-owned enterprises. Further research shows that compared with low-cost enterprises, the “cost reduction” effect of VAT rate reduction is more significant in high cost enterprises. Compared with medium and small enterprises, the “cost reduction” effect of VAT rate reduction is more significant in large enterprises; Compared with enterprises in central and western regions, the “cost reduction” effect of VAT rate reduction is more significant in enterprises in eastern regions. The research conclusion of this paper confirms that VAT rate reduction plays a positive role in reducing enterprise operating costs, stimulating enterprise vitality and improving enterprise performance, and also expands related research on VAT tax reduction effect.
This study has some implications. (1) Although VAT is an extrinsic tax and turnover tax, the change of tax rate will affect the operating cost and performance of enterprises. The reduction of VAT rate will not only affect the tax burden and transaction costs of enterprises, but also affect the production cost, financing scale and cost, sales expenses and administrative expenses of enterprises. (2) Due to the low market position, management level and bargaining power, the “cost reduction” effect of SMEs and enterprises in central and western regions is not obvious, and they cannot fully enjoy the benefits of VAT rate reduction, and this situation may be more prominent in small and micro enterprises and enterprises in western regions. Therefore, more diversified preferential policies should be given to micro, medium and western enterprises. (3) Relevant departments should supervise the pricing of products and services throughout the industrial chain to avoid undue erosion of the interests of weak enterprises. In addition, the research results of this paper can also provide reference for China to further optimize the VAT system and other countries to optimize tax policies during the COVID-19 pandemic and the global economic recession.
8 Deficiencies in Research and Future Directions
This research studies the “cost reduction” effect of VAT rate reduction in China and makes heterogeneity analysis. Due to the impact of COVID-19, the panel data used in this study covers a relatively short period, just 4 years from 2016 to 2019. In addition, this paper does not examine the distribution of VAT tax reduction benefits between upstream and downstream enterprises. Future research should focus on the distribution of tax reduction benefits among upstream enterprises, downstream enterprises and consumers, as well as the impact of tax rate reduction on other supply-side reform tasks such as “deleveraging”, “inventory reduction”, “overcapacity reduction” and “shoring up weak spots".
Data Availability Statement
Publicly available datasets were analyzed in this study. This data can be found here: Information on VAT rate adjustments can be obtained from China’s State Administration of Taxation (http://www.chinatax.gov.cn/n810341/n810755/c3377945/content); The financial data of listed companies can be obtained from CSMAR database (html https://cn.gtadata.com/) and Wind database (https://www.wind.com.cn/).
Author Contributions
YL designed the research framework, wrote, and edited the manuscript. WW analyzed the data. CL revised the paper for important intellectual content and made the final revision of the paper. All authors contributed to the paper and approved the submitted version.
Funding
This work was supported by the National Natural Science Foundation of China (72073020).
Conflict of Interest
The authors declare that the research was conducted in the absence of any commercial or financial relationships that could be construed as a potential conflict of interest.
Publisher’s Note
All claims expressed in this article are solely those of the authors and do not necessarily represent those of their affiliated organizations, or those of the publisher, the editors and the reviewers. Any product that may be evaluated in this article, or claim that may be made by its manufacturer, is not guaranteed or endorsed by the publisher.
Footnotes
1The expense in the accounting equation refers to the total cost including operating costs, period expenses, taxes and surcharges, which has the same connotation as the total cost described in this paper.
References
Adhikari, B. (2020). Does a Value-Added Tax Increase Economic Efficiency? Econ. Inq. 58, 496–517. doi:10.1111/ecin.12847
Adoho, F., and Gansey, R. J. (2019). Welfare Impact of Value-Added Tax Reform: The Case of the Democratic Republic of Congo, World Bank Policy Research Working Paper No. 8923. Available at: https://ssrn.com/abstract=3430535
Alavuotunki, K., Haapanen, M., and Pirttilä, J. (2019). The Effects of the Value-Added Tax on Revenue and Inequality. J. Dev. Stud. 55, 490–508. doi:10.1080/00220388.2017.1400015
Amore, M. D., Schneider, C., and Žaldokas, A. (2013). Credit Supply and Corporate Innovation. J. Financial Econ. 109, 835–855. doi:10.1016/j.jfineco.2013.04.006
Asllani, G., and Statovci, B. (2018). Effect of the Change in Value Added Tax on the Fiscal Stability of Kosovo. Ekon. Pregl. (Online) 69, 423–438. doi:10.32910/ep.69.4.4
Atkinson, A. B., and Stiglitz, J. E. (1972). The Structure of Indirect Taxation and Economic Efficiency. J. Public Econ. 1, 97–119. doi:10.1016/0047-2727(72)90021-7
Auerbach, A. J. (1989). Tax Reform and Adjustment Costs: The Impact on Investment and Market Value. Int. Econ. Rev. 30, 939. doi:10.2307/2526760
Ayoub, Z., and Mukherjee, S. (2019). Value Added Tax and Economic Growth: An Empirical Study of China Perspective. Signifikan J. Ilmu Ekon. 8, 235–242. doi:10.15408/sjie.v8i2.10155
Baum, D. N. (1991). Economic Effects of Including Services in the Sales Tax Base: An Applied General Equilibrium Analysis. Public Finance Q. 19, 166–192. doi:10.1177/109114219101900203
Benzarti, Y., and Carloni, D. (2019). Who Really Benefits from Consumption Tax Cuts? Evidence from a Large VAT Reform in France. Am. Econ. J. Econ. Policy 11, 38–63. doi:10.1257/pol.20170504
Bernal, A. (2018). Do Small Value-Added Tax Rate Decreases on Groceries Imply Lower Prices for Consumers? East. Eur. Econ. 56, 81–98. doi:10.1080/00128775.2017.1412265
Cai, X., Lu, Y., Wu, M., and Yu, L. (2016). Does Environmental Regulation Drive Away Inbound Foreign Direct Investment? Evidence from a Quasi-Natural Experiment in China. J. Dev. Econ. 123, 73–85. doi:10.1016/j.jdeveco.2016.08.003
Cao, Y., and Li, J. (2016). Whether Replacing Business Tax with VAT Reduces Turnover Tax Burden: Evidence from Chinese Listed Companies. Financ. Trade Econ. 11, 62–76. doi:10.19795/j.cnki.cn11-1166/f.2016.11.006
Devereux, M. P., Liu, L., and Loretz, S. (2014). The Elasticity of Corporate Taxable Income: New Evidence from UK Tax Records. Am. Econ. J. Econ. Policy 6, 19–53. doi:10.1257/pol.6.2.19
Gentry, W. M., and Ladd, H. F. (1994). State Tax Structure and Multiple Policy Objectives. Natl. Tax J. 47, 747–772. doi:10.1086/ntj41789106
Gong, H. (2020). Logical Thinking about VAT Rates Reduce Manufacturing. J. Tax. Res. 02, 5–10. doi:10.19376/j.cnki.cn11-1011/f.2020.02.002
Gruber, J., and Poterba, J. (1994). Tax Incentives and the Decision to Purchase Health Insurance: Evidence from the Self-Employed. Q. J. Econ. 109, 701–733. doi:10.2307/2118419
Gu, C., and Wang, W. (2020). VAT Reduction, Enterprise Bargaining Power and Innovation Input. Financ. Trade Econ. 09, 5–49. doi:10.19795/j.cnki.cn11-1166/f.20210915.010
Heckman, J. J., Ichimura, H., and Todd, P. E. (1997). Matching as an Econometric Evaluation Estimator: Evidence from Evaluating a Job Training Programme. Rev. Econ. Stud. 64, 605–654. doi:10.2307/2971733
Hoseini, M., and Briand, O. (2020). Production Efficiency and Self-Enforcement in Value-Added Tax: Evidence from State-Level Reform in India. J. Dev. Econ. 144, 102462. doi:10.1016/j.jdeveco.2020.102462
Huang, H., Wang, T., and Zhan, Z. (2019). From Business Tax to Value‐added Tax: The Effects of Reform on Chinese Transport Industry Firms. Aust. Account. Rev. 29, 158–176. doi:10.1111/auar.12248
Kenkel, D. S. (2005). Are Alcohol Tax Hikes Fully Passed through to Prices? Evidence from Alaska. Am. Econ. Rev. 95, 273–277. doi:10.1257/000282805774670284
Kosonen, T. (2015). More and Cheaper Haircuts after VAT Cut? on the Efficiency and Incidence of Service Sector Consumption Taxes. J. Public Econ. 131, 87–100. doi:10.1016/j.jpubeco.2015.09.006
Li, G., and Liu, L. (2009). Debt Financing Cost and Credit Discrimination on Private Listed Firms. J. Financ. Res. 12, 137–150.
Li, J., and Wang, X. (2020). Does VAT Have Higher Tax Compliance Than a Turnover Tax? Evidence from China. Int. Tax. Public Finance 27, 280–311. doi:10.1007/s10797-019-09567-4
Liu, J., and Liu, F. (2013). Fiscal Centralization, Government Control and Corporate Tax Burden: Evidence from China. China J. Account. Stud. 1, 168–189. doi:10.1080/21697221.2013.870367
Liu, Q., and Lu, Y. (2015). Firm Investment and Exporting: Evidence from China’s Value-Added Tax Reform. J. Int. Econ. 97, 392–403. doi:10.1016/j.jinteco.2015.07.003
Liu, H., and Ye, K. (2018). VAT Impact on Enterprise Value: Evidence from the Stock Market Reaction. Manage. World. 11, 12–24+35+195. doi:10.19744/j.cnki.11-1235/f.2018.0002
Liu, H., and Zhao, J. (2019). Tax Incentives and Enterprise Innovation: a Quasi-Natural Experiment Based on Value-Added Tax Reform. Acc. Res. 09, 43–49.
Mgammal, M. H. (2021). Does a Value-Added Tax Rate Increase Influence Company Profitability?: An Empirical Study in the Saudi Stock Market. J. Australas. Tax. Teach. Assoc. 16, 92–128. doi:10.3316/informit.331027699809499
Miki, B. (2011). The Effect of the VAT Rate Change on Aggregate Consumption and Economic Growth, Working Paper Series No. 297. doi:10.7916/D8862QBH
Moll, B. (2014). Productivity Losses from Financial Frictions: Can Self-Financing Undo Capital Misallocation? Am. Econ. Rev. 104, 3186–3221. doi:10.1257/aer.104.10.3186
Montag, F., Sagimuldina, A., and Schnitzer, M. (2020). Are Temporary Value-Added Tax Reductions Passed on to Consumers? Evidence from Germany’s Stimulus, CEPR Discussion Paper No. DP15189. Available at: https://ssrn.com/abstract=3688138
Rosenbaum, P. R., and Rubin, D. B. (1983). The Central Role of the Propensity Score in Observational Studies for Causal Effects. Biometrika 70, 41–55. doi:10.1093/biomet/70.1.41
Shi, J., Sadowski, B., Li, S., and Nomaler, Ö. (2020). Joint Effects of Ownership and Competition on the Relationship between Innovation and Productivity: Application of the CDM Model to the Chinese Manufacturing Sector. Manag. Organ. Rev. 16, 769–789. doi:10.1017/mor.2020.13
Shi, J., Yuan, X., Sadowski, B. M., Kou, K., Hu, X., Li, S., et al. (2022). VAT Reform, Regional Ownership Structure, and Industrial Upgrading: Evidence from Firms in Northeast China. SAGE Open 12, 215824402210950. doi:10.1177/21582440221095013
Simmons, R. S. (2006). Does Recent Empirical Evidence Support the Existence of International Corporate Tax Competition? J. Int. Account. Auditing Tax. 15, 16–31. doi:10.1016/j.intaccaudtax.2006.01.002
Sobel, R. S. (2008). Testing Baumol: Institutional Quality and the Productivity of Entrepreneurship. J. Bus. Ventur. 23, 641–655. doi:10.1016/j.jbusvent.2008.01.004
Sun, H., Edziah, B. K., Sun, C., and Kporsu, A. K. (2019). Institutional Quality, Green Innovation and Energy Efficiency. Energy Policy 135, 111002. doi:10.1016/j.enpol.2019.111002
Sun, H., Edziah, B. K., Sun, C., and Kporsu, A. K. (2021). Institutional Quality and its Spatial Spillover Effects on Energy Efficiency. Socio-Econ. Plan. Sci., 101023. doi:10.1016/j.seps.2021.101023
Topalova, P. (2010). Factor Immobility and Regional Impacts of Trade Liberalization: Evidence on Poverty from India. Am. Econ. J. Appl. Econ. 10, 1–41. doi:10.5089/9781455208838.001
Wang, Z., Singh-Ladhar, J., and Davey, H. (2019). Business Tax to Value-Added Tax Reform in China. Par 31, 602–625. doi:10.1108/PAR-12-2018-0117
Wang, J., Shen, G., and Tang, D. (2021). Does Tax Deduction Relax Financing Constraints? Evidence from China’s Value-Added Tax Reform. China Econ. Rev. 67, 101619. doi:10.1016/j.chieco.2021.101619
Wang, J. (2013). The Economic Impact of Special Economic Zones: Evidence from Chinese Municipalities. J. Dev. Econ. 101, 133–147. doi:10.1016/j.jdeveco.2012.10.009
Waseem, M. (2022). The Role of Withholding in the Self-Enforcement of a Value-Added Tax: Evidence from Pakistan. Rev. Econ. Stat. 104, 336–354. doi:10.1162/rest_a_00959
Zhang, L., Chen, Y., and He, Z. (2018). The Effect of Investment Tax Incentives: Evidence from China’s Value-Added Tax Reform. Int. Tax. Public Finance 25, 913–945. doi:10.1007/s10797-017-9475-y
Keywords: value-added tax, rate cut or reduction, cost reduction, business performance, difference in difference model
Citation: Liu Y, Wang W and Liu C (2022) The Effect of a VAT Rate Reduction on Enterprise Costs: Empirical Research Based on China’s VAT Reform Practice. Front. Environ. Sci. 10:912574. doi: 10.3389/fenvs.2022.912574
Received: 14 April 2022; Accepted: 06 June 2022;
Published: 24 June 2022.
Edited by:
Huaping Sun, Jiangsu University, ChinaReviewed by:
Junguo Shi, Jiangsu University, ChinaChang Xia, The University of Hong Kong, Hong Kong SAR, China
Copyright © 2022 Liu, Wang and Liu. This is an open-access article distributed under the terms of the Creative Commons Attribution License (CC BY). The use, distribution or reproduction in other forums is permitted, provided the original author(s) and the copyright owner(s) are credited and that the original publication in this journal is cited, in accordance with accepted academic practice. No use, distribution or reproduction is permitted which does not comply with these terms.
*Correspondence: Yongjiu Liu, bHlqZ2xAMTI2LmNvbQ==; Chao Liu, bGl1Y2hhbzIwMTkwOTA5QDEyNi5jb20=