 A. Asutosh
 S. Fadnavis
 Prashant Chavan
 T. P. Sabin
 Rolf Müller
- 1Indian Institute of Technology Bhubaneswar, Bhubaneswar, OD, India
- 2Indian Institutes of Tropical Meteorology, Ministry of Earth Sciences, Pune, India
- 3Forschungszentrum Jülich GmbH, IEK-7, Jülich, Germany
The high level of aerosol pollution in South Asia has a measurable impact on clouds, radiation, and precipitation. Here, exploring multiple observational data sets and simulations of the state-of-the-art ECHAM6-HAMMOZ chemistry-climate model, we report that the reduction in anthropogenic emissions during the COVID-19 lockdown period has enhanced precipitation by 5–25% over India. This precipitation enhancement is the result of the combined effect of an enhancement in cloud cover, a reduction in aerosol induced cloud invigoration and dynamical changes. We observed that the increase in cloud cover was associated with a reduction in cloud base height and an increase in the effective radius of cloud particles which led to an increase in cloud water content. In response to sudden emission reduction, an anomalous northward moisture transport was observed adding convection and precipitation over the Indian region. Importantly, we show that there is an advantage of anthropogenic pollution reduction for water availability in addition to benefits of air quality, human health, and crop yield.
1 Introduction
Environmental deterioration in the South Asian region as a result of rising levels of air pollution has harmed people’s health (Chowdhury et al., 2018; Balakrishnan et al., 2019; Manisalidis et al., 2020), reduced crop yield, and hence has damaged the economy (Gu et al., 2018). Ground-level pollutants are known to cause serious impacts on people’s health (Ghude et al., 2016). Additionally, the elevated level of aerosol pollution is prone to impact the hydrological cycle (Ramanathan et al., 2005; Lau et al., 2006; Fadnavis et al., 2019, Fadnavis et al.,2013). However, the lockdown restrictions imposed to control the transmission of the Corona-Virus Disease 2019 (COVID-19) caused a drastic reduction in emissions of pollutants globally (Isaifan, 2020; Navinya et al., 2020; Sanap, 2021).
On 11 January 2020, the World Health Organization (WHO) declared a worldwide health emergency due to the COVID-19. The disease was initially discovered in late December 2019 in China (Muhammad et al., 2020; Pandey et al., 2020). To prevent widespread transmission and an increase in the death toll, countries around the world imposed a complete or partial shutdown of human activities, starting primarily in March 2020. From March 23 until 31 May 2020, South Asia (including India) and south-east Asian countries implemented the first lockdown phase. As a result, anthropogenic emissions from transportation, urban areas, and industries were reduced significantly during this period (Zhang et al., 2021). According to past studies, the lockdown induced less human activity, which indirectly helped in improving air quality around the planet (Zhang et al., 2021; Menut et al., 2020; Lou et al., 2022). Over a large part of the globe, concentrations of major pollutants were found to be lower compared to their long-term mean (past 10 years), in particular NO2 (nitrogen dioxide) (by −30% to −50%), SO2 (sulphur dioxide) (by −20% to −35%), CO (carbon monoxide) (−15% to −20%), and particulate matter PM2.5 and PM10 (by up to 49%). Several studies have documented a decrease in aerosol and other gaseous concentrations over China (Bao and Zhang, 2020; Bauwens et al., 2020) as well as over India (Gautam, 2020; Mahato et al., 2020; Navinya et al., 2020)
Anthropogenic emissions from various sources, including transportation, industry, and other commercial sectors, as well as agriculture, contribute to South Asia’s long-standing air pollution problem. Restrictions imposed during the COVID-19 lockdown period resulted in reducing high levels of pollution in Asia, particularly over hotspot regions such as East Asia, the Indo Gangetic Plains (IGP), the Indonesian region, and eastern China, according to in-situ and satellite observations (Liu et al., 2021, Venter et al., 2020). A recent population density estimate shows the high population density over IGP (Supplementary Figure S1). Even if only for a short time during the lockdown period (April–May 2020), reduced pollution levels may pause (or even temporally reverse) increasing trend in anthropogenic aerosol emissions over South Asia.
Atmospheric aerosols interact with the earth’s radiation directly and through clouds via the indirect effect. The aerosol over South Asia attenuates solar radiation by 10–25 W m−2 (Li et al., 2016). Changes in anthropogenic aerosol emissions contribute to changes in surface air temperature, low-level humidity, atmospheric circulation, Upper Troposphere and Lower Stratosphere (UTLS) processes, and even rainfall patterns (Ramanathan et al., 2005; Bollasina et al., 2014; Vinoj et al., 2014; Li et al., 2016; Fadnavis et al., 2018). Aerosol particles act as cloud condensation and ice nuclei, therefore, modulating the nature of the cloud by changing cloud brightness, thickness, and lifetime (Twomey, 1977; Albrecht, 1989; Zhao et al., 2018). These cloud properties further interact with cloud radiation features and indirectly with circulation and precipitation. However, our scientific understanding of aerosol-climate interactions is still incomplete (Stocker et al., 2013; Li et al., 2016). Due to the complex nature of aerosol-cloud interactions, there is large uncertainty in estimating the cloud susceptibility for aerosol emission changes and quantifying radiative impacts of aerosols in varying emission and meteorological scenarios (Stocker et al., 2013; Li et al., 2016). It is crucial to resolve such uncertainty to understand the future global and regional climate responses to the combination of emissions of greenhouse gases and aerosols (Samset et al., 2016; Myhre et al., 2017).
The first phase of the COVID-19 lockdown provides us with a unique opportunity to study the possible regional climate response to short-term reductions of atmospheric gases and pollutants. Here, we investigate the effects of the reductions in regional atmospheric concentrations of several gases and anthropogenic aerosol on rainfall, clouds, water vapour, and consequently on rainfall over South Asia during the lockdown period April–May 2020. For this purpose, we use the state-of-art ECHAM6.3-HAM2.3-MOZ1.0 aerosol-chemistry climate model (Schultz et al., 2018; Tegen et al., 2019). The goal of our study is to isolate the effect of the Asian anthropogenic pollution on clouds and precipitation during April-May caused by the COVID-19 restrictions. There is a large volume of COVID-19 related studies, but most of them are mainly focused on air quality improvements (Navinya et al., 2020; Dumka et al., 2021; Manchanda et al., 2021). A recent study by Yang et al. (2022) showed that the COVID-19 induced substantial reduction in anthgropogenic aerosols and greenhouse gases (GHGs) strengthened the summer atmospheric convection over eastern China and further intensified rainfall. The study also highlighted that the impact of aerosol are stonger over GHGs on change in precipitation. Hence, we suggest detailed modelling studies, which may shed further light on the link between aerosol reduction and associated regional climatic effects (Khatri et al., 2021).
While a few studies investigated the associations between rainfall during monsoon season and COVID-19 lockdown (Fadnavis et al., 2021; Kripalani et al., 2022), those are mostly linked to the change in atmospheric dynamics and not to the roles of clouds for the observed changes in rainfall. Additionally, accurate aerosol-climate impact assessments are essential in implementing future national and international air pollution mitigation strategies.
This paper is organised as follows. Section 2 explains the details of the model experiments and datasets used in this study. Major findings from the analysis are presented in Section 3, a mechanism for rainfall enhancement is proposed in Section 4, followed by a summary and conclusion in Section 5.
2 Material and methods
2.1 The model description and the experimental set-up
We adopt the reductions in anthropogenic emission due to the COVID-19 restrictions based on the activity decline in mobility data from Google and Apple following Forster et al. (2020) (Supplementary Table S1 and see Fadnavis et al., 2021 for details). The model comprises of three sub-modules 1) the ECHAM6 (Stevens et al., 2013) atmospheric general circulation module, 2) the MOZ tropospheric chemistry module (Schultz et al., 2018; Tegen et al., 2019), and 3) the Hamburg Aerosol Model (HAM). The HAM submodule predicts nucleation, growth, evolution, and sinks of sulphate (SO42−), black carbon (BC), particulate organic matter (POM), sea salt (SS), and mineral dust (DU) aerosols (Stier et al., 2005; Zhang et al., 2012). The MOZ submodule describes the trace gas chemistry from the troposphere to the lower thermosphere, including 108 species, 71 photolytic processes, 218 gas-phase reactions, and 18 heterogeneous reactions with aerosol (Schultz et al., 2018). We performed the model simulations at the T63 spectral resolution i.e., 1.875°× 1.875° in the horizontal and 47 levels in the vertical from the surface to 0.01 hPa (corresponding to approximately 80 km), with a time step of 20 min. Details of emissions (anthropogenic, biomass burning, biogenic, fossil fuel, etc.) are reported by Fadnavis et al. (2021). The ECHAM6-HAMMOZ model experimental set-up and simulations details are as described by Fadnavis et al. (2021). While Fadnavis et al. (2021) report the impact of COVID lockdown emission reduction on the Indian summer monsoon precipitation, here, we show the effect of emission reductions on clouds during spring 2020 (April-May).
The simulation consists of two sets of ten-member ensemble simulations 1) the control experiment, referred to as CTRL hereafter, and 2) the sensitivity experiment for the reductions in anthropogenic emission due to the COVID-19, referred to as C19, hereafter. Other sets were created from initial conditions with the start time shifted by 1 day from March 1–10 and then simulated for a year to obtain stabilized fields. The initial and boundary conditions for both sets of simulations were set to the year 2016. The year 2016 was chosen because the El Nino-Southern Oscillation (ENSO) and the Indian Ocean Dipole (IOD) were both in a neutral phase, making it perfect for isolating COVID-19 emission influences. This way we avoid interference of impacts COVID emission changes with of ENSO or the Indian Ocean dipole. Both tests use the same dust emission parameterization based on Tegen et al. (2002).
2.2 Observational datasets
To evaluate the model aerosol optical depth (AOD), we have used the Level 3 AOD from the Moderate Resolution Imaging Spectroradiometer (MODIS). MODIS is onboard the Terra/Aqua satellites and provides daily aerosol products (Levy et al., 2010; Namdari et al., 2018). MODIS has a view scan of ±55° and an orbit of 700 km above the ground. MODIS AOD is extensively used in aerosol related studies. More information is available at http://modis.gsfc.nasa.gov/. Additionally, to add confidence to the modelled AOD, we have compared MODIS with Modern-Era Retrospective Analysis Research and Applications, Version 2 (MERRA-2) aerosol data assimilated from Goddard Earth Observing System-5 (GEOS-5) atmospheric general circulation Model (Gelaro et al., 2017). The GEOS-5 coupled with Goddard Chemistry Aerosol Radiation and Transport (GOCART) model and aerosol observations from space for better representation of aerosols in the model (Buchard et al., 2014).
The NOAA Interpolated Outgoing Longwave Radiation (OLR) data are used as a proxy of cloud cover/water vapour during the study period (April–May 2020). OLR values are often used as a proxy for convection/cloud in tropical and subtropical regions. In addition, the ERA-5 reanalysis datasets (Hersbach et al., 2020) are used for cloud cover, cloud base height, and precipitation information. The horizontal resolution of ERA5 is ∼31 km, and there are 137 model levels (from the ground up to 0.01 hPa). ERA5 uses the IFS Cy41r2 4D-Var assimilation system. The India Meteorological Department (IMD) gridded rainfall datasets (Dash et al., 2006; Srinivas et al., 2013) have also been used to compare the observed IMD precipitation with the model derived precipitation. It should be noted that the analysis is performed for the national lockdown period across India in 2020, i.e., for April and May (lockdown period hereafter). For variables using observational data, the anomalies and percentage changes are determined by comparing mean of April-May 2020 to the mean of April-May for five-years 2016–2019. On the other hand, we employ the C19 and CTRL simulations for similar computations from the model (averaged over 10 ensemble members).
3 Results and discussions
3.1 AOD changes due to anthropogenic aerosol reduction over South Asia
The simulated aerosol optical depth (AOD) anomaly is evaluated against the MODIS satellite observation and MERRA-2 during the lockdown period (Figure 1). When AOD is compared to its five-year mean, both MERRA and MODIS reveal a significant reduction in AOD over India (between 10% and 40%). Polluted areas, such as the IGP, show a significant decline in AOD (MODIS: 30–40%, Model: 5%–25%, MERRA: 10%–30%). The drop in AOD across the Bay of Bengal (MODIS: 10%–40%, MERRA: 10%–25% MODEL: 10%–30%), on the other hand, could be related to a weaker aerosol outflow from the IGP. Every spring, aerosol pollution is transported from the IGP to the Bay of Bengal (Thomas et al., 2021). The reduction in anthropogenic pollution over the IGP during the lockdown period resulted in the transport of less aerosol to the Bay of Bengal than in prior years (five-year mean). The slight enhancement in AOD anomalies over central and southern India (both in MODIS and MERRA-2) could be attributed to particle growth in response to changes in relative humidity, atmospheric background conditions, or agricultural fires (Pandey and Vinoj, 2021; Sanap, 2021). It is worth noting that the simulated ensemble mean AOD may qualitatively approximate the spatial pattern of AOD from MERRA-2 and MODIS. Anomalies of simulated AOD show fair agreement with Aerosol Robotic Network (AERONET) ground based observations at Kanpur Lon: 80.23°E, Lat: 26.51°N), Lahore (Lon:74.26°E, Lat:31.48°N) and Gandhi Collage (Lon: 84.12°E, Lat: 25.87°N) in the Indo-Gangetic Plain during the lockdown period (mean of April-May 2020- mean April-May during 2016–2019) (Fig. S2a). As a result, the model may be used to analyze the response of emission reductions that may have occurred as a result of the COVID-19 lockdownMany previous studies (Fadnavis et al., 2021, 2018) reported satisfactory model performance versus multiple observations for AOD, absorbing aerosol index, precipitation, mixing ratio black carbon aerosol, cloud ice, etc.
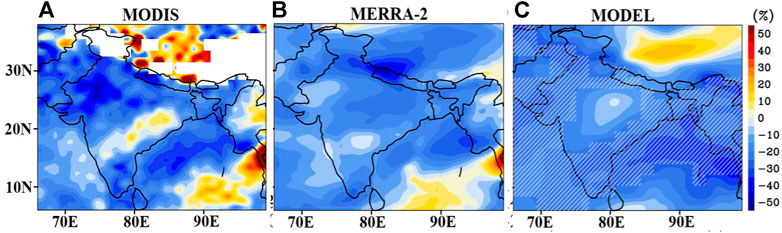
FIGURE 1. (A) Percentage change in aerosol optical depth (AOD) averaged for the lockdown period (mean of April-May 2020 - mean of April-May 2016–2019) calculated from (A) MODIS satellite observation, (B) MERRA-2 reanalysis, (C) ECHAM6-HAMMOZ simulated AOD anomalies (C19—CTRL) averaged over 10 members. Hatching shows the area where mean differences between C19 and CTRL are statistically significant at a 95% confidence level.
3.2 Cloud response to the reduction in anthropogenic aerosol emissions
Changes in aerosol field emission caused by the lockdown could have had an impact on radiation and cloud characteristics (Timmermann et al., 2020; Khatri and Hayasaka, 2021). Here, we show changes in cloud parameters in response to aerosol changes during the lockdown period. The ERA5 reanalysis revealed an unusual increase in the low cloud (>5%) and a drop in cloud base height (CBH) (>500 m) during the lockdown period in 2020 (Figure 2A,B). These characteristics are particularly noticeable over the IGP and adjacent regions, where the most significant reduction in aerosols was observed (Figure 1).
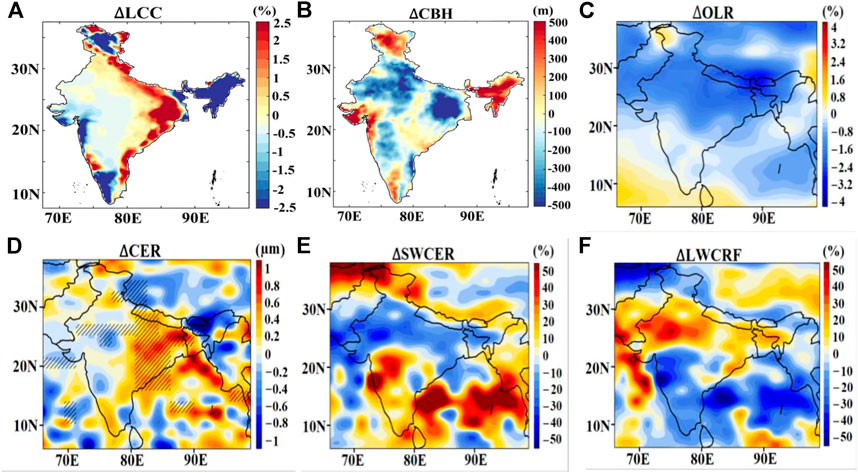
FIGURE 2. Spatial distribution of anomalies (2020—mean of 2016–2019) averaged for the lockdown period for (A) Low Cloud Cover (ΔLCC) and (B) Cloud Base Height from ERA5 (ΔCBH). The rest of the figures are for simulated anomalies (C19—CTRL) averaged over 10 members and for the lockdown period, (C) outgoing longwave radiation (ΔOLR, %), (D) Cloud Effective Radius (Δ CER, µm), (E) Short Wave Cloud Radiative Forcing (ΔSWCRF, %), (F) Longwave Cloud Radiative Forcing (Δ LWCRF, %). Hatching shows the area where mean differences between C19 and CTRL are statistically significant at a 90% confidence level.
The anthropogenic changes during the lockdown period may be reflected in the shift in cloud microphysical features and accompanying atmospheric conditions. The model simulations show the response of cloud properties to the anthropogenic aerosol reduction (Figure 2). There is an unusual drop in outgoing longwave radiation in model simulations and an increase in cloud effective radius (Figures 2C,D). NOAA’s outgoing longwave radiation anomalies have also shown a similar reduction (1.6%–4%) as observational evidence (Supplementary Figure S2b).
The locations of maximum decrease in outgoing longwave radiation are co-located with the location of maximum increase in low clouds (Figure 2C) and maximum reduction of aerosol optical depths (Figure 1). Additionally, a decrease in aerosol loading over the IGP has resulted in a decrease in shortwave (−10% to −40%) and an increase in longwave (10%–50%) cloud radiative forcing anomalies (Figure 2 e-f). These results also support the increase in cloud cover. The strong negative short wave cloud radiative forcing over the IGP is partly compensated by the longwave induced warming (Figures 2E,F). It is known that both droplet size and cloud cover are reduced in the presence of absorbing aerosols (Hansen et al., 1997). There is a reduction in simulated absorbing AOD (BC) by 10–30% over the Indian region. As a result of reduced AOD resulting in an enhancement in cloud cover (Figures 2A,B) and a higher cloud effective radius (Figure 2D), such cloud burning (reducing) efficiency (also known as aerosol semi-direct effect) could have been reduced over the Indian region (strong decrease over the IGP) in 2020, as seen in C19 simulation as a response to reduced AOD, resulting in large cloud cover.
From our model simulations, the changes in cloud parameters in 2020 (C19—CTL) indicate the response of clouds to anthropogenic emission reduction (Figure 2). It is well known that in the presence of an anomalous increase in aerosol loading, cloud invigoration may take place, i.e., in response to increased aerosol number concentration; there can be a decrease in cloud-droplet size (Rosenfeld et al., 2014; Zhao et al., 2018; Khatri et al., 2021). This may further lead to vertical cloud growth and conversion of a water cloud into an ice cloud. Since, large amounts of aerosol in the atmosphere help in enhancing cloud vertical movement that leads to an increase in the conversion of water clouds to ice clouds due to the combination of rain inhibition and vertical growth (Rosenfeld et al., 2014; Khatri et al., 2021).
The model simulations (an increase of effective radius as a proxy for cloud droplet size, Figure 2D) and ERA5 indicate that this aerosol invigoration impact may have been suppressed because of the aerosol reduction in 2020 (COVID condition) (reduction in cloud base height). An increase in cloud effective radius further results in larger cloud droplets, which leads to less droplet evaporation and further modulation of precipitation (discussed in Section 4).
We also present the averaged vertical distribution of aerosol extinction and cloud parameters over the IGP region (78–90°E, 18–27°N, where the greatest aerosol reduction occurred (Figure 3). Figure 3A shows negative anomalies in aerosol extinction with a maximum decrease near the surface. Interestingly, there is an increase in cloud droplet effective radius between 1,000–400 hPa (Figure 3B, max up to 0.6 ± 0.2 microns at 800 hPa). Consistent with our results, Khatri et al., 2021, also observed an increase (in the range of 10 – 20%) in cloud effective radius values over the IGP in 2020 compared to previous years. Furthermore, anomalous lower-level circulation/meteorological feedbacks may be responsible for a large increase in low level (below 500 hPa) relative and specific humidity profiles (Figures 3C,F) (discussed in Section 3.3). In the reduction aerosol emission/pristine scenario (Like the C19 case), features are conducive to the enhancement in cloud effective radius/droplet size (Jayaraman, 2001). The reduction in cloud droplet evaporation further helps in increasing cloud cover (Figure 3D) and precipitation. A recent study of the conditions over China (Yang et al., 2022) shows an enhancement in cloud cover at all the levels of the atmosphere in response to COVID-19 aerosol emission reduction, in support of our findings.
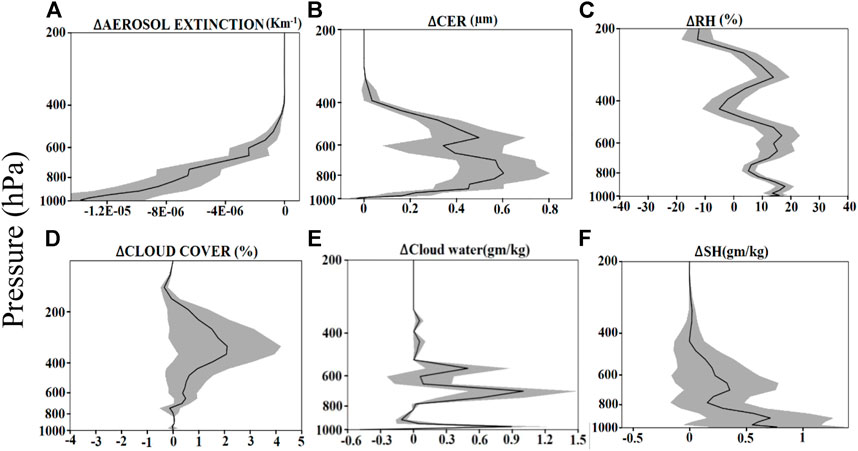
FIGURE 3. Area averaged (78:90°E, 18–27°N) ECHAM6-HAMMOZ simulated anomalies (C19—CTRL) averaged over 10 members and for the lockdown period for (A) Aerosol extinction coefficient (km−1), (B) cloud effective radius (∆CER, µm), (C) relative humidity (∆RH, %), and (D) cloud cover (%), (E) cloud water (gm kg−1), (F) specific humidity (gm kg−1). The shading represents the standard error of the difference of the means.
3.3 Possible response of atmospheric conditions to emission changes
This section covers the possible effects of reduced anthropogenic emissions on atmospheric conditions. The response of near-surface air temperature is shown in Figure 4A. The eastern part of the IGP and the southeast Indian regions have experienced significant warming. This increased temperature could be explained in part by the reduction of aerosol pollution in the atmosphere, which increases incoming solar radiation and thus short-wave warming (Fadnavis et al., 2021). The east-west dipolar temperature response (Figure 4A) (warming over North East India and cooling over the North-West India and Pakistan region), however, does not precisely follow the regions of pollution reductions (Figure 1). The cooling over the North-West India and Pakistan region is due to subsidence in return to the ascent over North India - Tibetan Plateau region (80–90°E, 20–30°N) (Supplementary Figure S3). These circulation changes are the response to changes in convection, cloud, and associated cloud radiative forcing (Figure 2). Additionally, the heating rates (averaged over 70–90°E, Figure 4B) show warming (>0.015 K d−1) in the lower troposphere over northern India and at the foothills of the Himalayas. The high elevated Tibetan Plateau region (TP) also shows moderate heating (∼0.005 K d−1) that has further extended vertically to the 200 hPa level (Figure 4B). The heating over these regions is conducive to the early onset of the monsoon (during May–June) and enhanced rainfall over north India, as suggested by previous studies (Lau et al., 2008, 2006; Lau, 2016). The mechanism proposed by Lau et al. (2006) mainly points to the presence of absorbing aerosols (dust and BC) as the reason behind elevated heating and rainfall enhancement (known as an elevated heat pump or EHP). A recent study showed that there is anomalous dust transport towards Tibetan Plateau regions from Taklamakan (North-Western Asian desert regions) as a response to COVID-19 induced circulation changes during April-May 2020 (Fadnavis et al., 2021). Another recent modelling study by Yang et al. (2022) also discussed COVID-19 emission induced enhancement in atmospheric heating rates. Supplementary Figure S3b depicts dust migration from the Taklamakan desert to the Tibetan Plateau. Dust AOD is anomalously enhanced by 20%–40% in the Tibetan Plateau region. The total warming in the North India-TP regions occurs because of the combined effect of anthropogenic emission reduction as well as elevated natural aerosol (dust) induced warming (EHP).
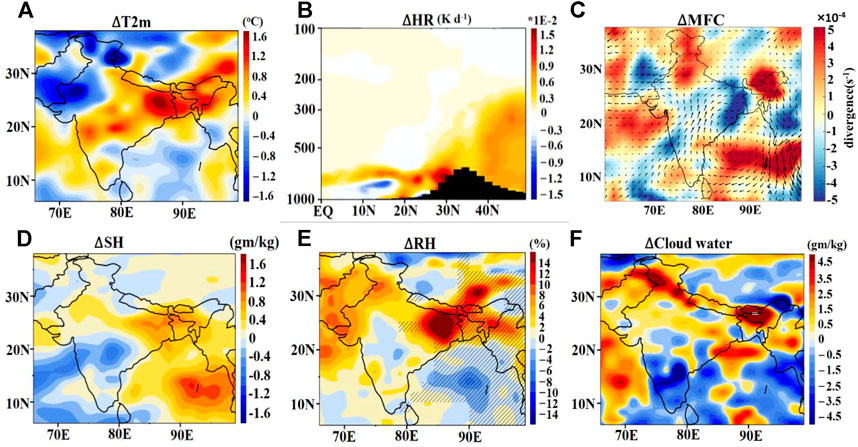
FIGURE 4. Spatial distribution of ECHAM6-HAMMOZ simulated anomalies (C19—CTRL) averaged over 10 members and for lockdown period for (A) 2 m air temperature (∆T2m, oC) (B) heating rate (averaged over 70–90°E, ∆HR, K d−1) (C) column integrated moisture flux divergence (1,000–300 hPa), arrows indicate column integrated moisture flux (kg m−1 s−1), (D) specific humidity (averaged for 1,000–500 hPa, gm kg−1),(E) relative humidity (averaged for 1,000–500 hPa, %) and (F) cloud water (averaged over the surface to 500 hPa, gm/kg).
Moisture flux convergence (MFC) is a popular matrix to study precipitation by linking it to both moisture and precipitation (Fasullo & Webster 2003). The detailed theory and mathematical calculation of MFC are provided in Appendix A. A negative divergence (convergence) correlates well with the area of maximum precipitation (Chansaengkrachang et al., 2018). A response to anthropogenic pollution reduction is an overall moisture flux convergence observed over a large part of the north and central Indian region (Figure 4C), (moisture sink). Both Bay of Bengal and the Northern Arabian Sea act as a moisture sources with strong positive MFC (divergence).
In response to sudden emissions reductions, the aerosol effects were mainly mediated through fast climate responses including changes in large scale atmospheric circulation (Wang et al., 2017; Lin et al., 2018; Wing et al., 2017; Lin et al., 2018). A change in surface circulation pattern is also observed in response to anthropogenic pollution reduction (Supplementary Figure S3c). The dynamic changes induced by the reduction in anthropogenic emissions have produced an anomalous cyclonic circulation over the Bay of Bengal region. In a different context, Vinoj and Swain (2020), observed enhancement of the atmospheric circulation related to a cyclone during the COVID-19 lockdown’s low emission phase. Our model simulations show that significant surface heating as a response to emission reduction resulted in an anomalous low-pressure zone over the Indian region with two high-pressure zones to India’s east and west sides (Supplementary Figure S3c). Such blocking high patterns control the surface level moisture transport (Fadnavis et al., 2021). Moderately strong wind flow from the oceanic regions (the Bay of Bengal and Northern Arabian Sea regions) towards the Indian mainland (Figure 4D; Supplementary Figure S3C) enhances moisture/specific humidity and clouds over the IGP and North West regions of India (Figures 4E,F) eventually conducive for rainfall enhancement.
3.4 Observed and simulated changes in rainfall
According to the India Meteorological Department (IMD), India had 158.5 mm of rainfall during the pre-monsoon 2020 season, which was 20% more than the long-term average (1961–2010). In observed datasets e.g., Global Precipitation Climatology Project (GPCP) (Figure 5A) and IMD, positive rainfall anomalies can be noted (Figure 5B). Both the GPCP and IMD datasets agree rather well with the simulated rainfall anomaly (C19 minus CTRL).
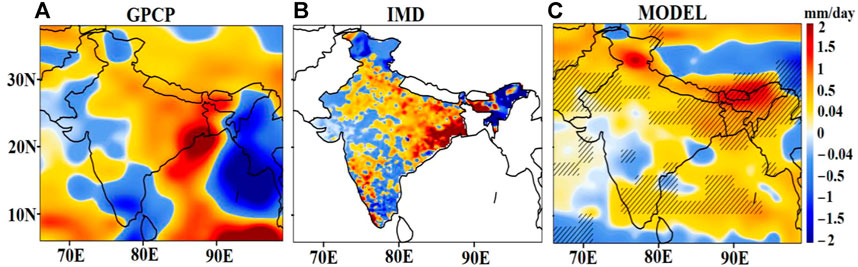
FIGURE 5. (A) Spatial distribution of anomalies in rainfall (2020—mean of 2016–2019) averaged for the lockdown period from (A) Global Precipitation Climatology Project (GPCP), (B) India Meteorological Department (IMD), and (C) ECHAM6-HAMMOZ simulations averaged over 10 members (C19 - CTRL). The hatching shows the area where mean differences between C19 and CTRL are statistically significant at a 90% confidence level.
Both observation and simulated rainfall, anomalies show a north-east enhancement and south-west reduction, forming a dipolar rainfall pattern. It is also worth noting that the rise in rainfall in all datasets corresponds to places with significant decreases in anthropogenic pollution (Timmermann et al., 2020; Lee et al., 2021; Kripalani et al., 2022; Yang et al., 2022). The ERA5 reanalysis results also show a comparable spatial increase in rainfall (Figure S4), justifying the model results. All data sets and model simulations show an increase in rainfall by 0.04–2 mm/day (5%–25%) over the eastern IGP and nearby regions.
4 Possible mechanism behind enhanced rainfall
Precipitation can be influenced by both scattering and absorbing aerosols through microphysical and dynamical processes A simple schematic is shown in Figure 6 to highlight the links between the emission reduction due to the COVID-19 lockdown and the observed increase in cloud and precipitation. Over a wide region within South Asia, there was a more than 40% drop in atmospheric aerosol loading (AOD) during the lockdown period, April-May 2020 (Figure 1), compared to its long-term mean (2016–2019). A recent modelling study for the conditions in China shows that the reduction in aerosols had a stronger impact on precipitation than the decrease of greenhouse gases during the COVID-19 lockdown (Yang et al., 2022).
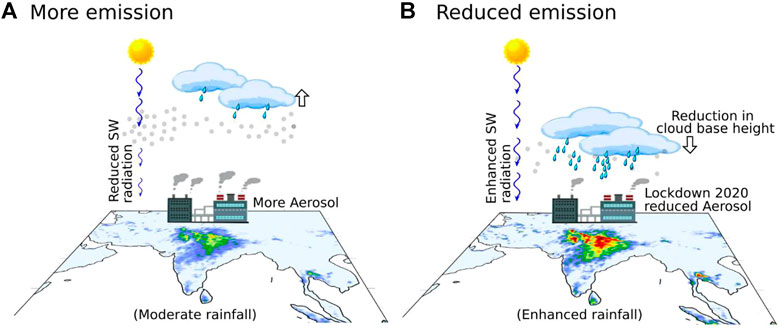
FIGURE 6. Schematic of the possible mechanism behind the COVID-19 pollution reduction and observed changes in cloud and precipitation over South Asia. (A) shows a normal emission condition and (B) explains the reduced emission (COVID-19) condition.
The cloud base height dropped by more than 500 m over the IGP and neighbouring regions, and low cloud cover increased significantly (C19—CTRL) (Figures 2A,B). Over the regions of cloud cover enhancement, there was warming effect caused by longwave cloud radiative forcing. However, there is cooling effect due to short wave radiative forcing which is due to cloud enhancement (Figures 2E,F). Furthermore, positive moisture feedback from the Bay of Bengal, Northern Arabian Sea to the Indian peninsula, combined with a reduction in cloud invigoration, favours low clouds with larger cloud droplets (Figure 4). Such situations are conducive to the enhancement of rainfall activity (Figure 5). The enhanced pre-monsoon rainfall during lockdown may further increase the latent heat release (not shown) and help in trapping more moisture in the lower atmosphere, allowing for more low clouds to develop (Timmermann et al., 2020; Yang et al., 2022), and resulting in increased precipitation. Thus, observed rainfall enhancement over India during the lockdown period may be due to the combined effect of the following:
(1) Anthropogenic forcing (emission reduction during the COVID-19) imposed changes in cloud parameters, atmospheric dynamics, and thermodynamical feedback.
(2) As a response to the emission reductions, favourable conditions for cloud augmentation (Khatri et al., 2021) and a decrease in the aerosol invigoration effect have emerged.
(3) The reduction in COVID-19 emissions altered atmospheric circulation, enhancing the low-pressure band over the Bay of Bengal and blocking high patterns on India’s west and east sides. It played a crucial role in amplifying the northward transport of moisture.
(4) All these lead to enhanced convective activity that increased rainfall over India by 0.04–2 mm day−1 (5%–25%) during the lockdown period.
5 Summary and conclusion
COVID-19 lockdown has been shown to improve air quality over the planet and alter the climate system in various ways that are still uncertain. The lockdown also provides a good opportunity to revisit a less polluted atmosphere to determine how human activity influences the environment and climate. It is interesting to note that due to the sudden emergence of the COVID-19 pandemic in early 2020, emissions were reduced notably causing an immediate and abrupt change in various components of the climate and earth system. Such sudden changes in emission could be significantly different from gradual policy-driven emission changes (Yang et al., 2022). It is important to mention that aerosol induced changes to the climate system are significantly different from GHG induced changes as the former possesses strong non-uniformity and non-linearity (Deng et al., 2020). This points to the fact that even small aerosol reductions (40%) during the pandemic could potentially impact and create a dramatic change in the earth system.
Quantifying the regional climate response in terms of cloud and precipitation changes in connection with emission/aerosol changes has always been challenging (Xie et al., 2020). Also, these are important processes to consider in weather and climate predictions. In this study, using the ECHAM6-HAMMOZ state-of-the-art aerosol-chemistry-climate model, we have investigated the possible reasons behind the observed enhancement in rainfall witnessed during the lockdown period over the Indian regions. The mean rainfall enhancement was found to be 5%–25% (0.04–2 mm/day) and is consistent in both observations and the C19 model simulation. We propose two supporting paths for the observed rainfall changes during the pre-monsoon of 2020. During the lockdown period, an increase in surface warming of 1°C was seen over broad swaths of the Indian landmass due to roughly 40% reductions in aerosol over the South Asian regions. Dust enhancement and reduction of anthropogenic aerosols resulted in increased heat across North India, the Himalayan foothills, and the TP areas. This might have led to the EHP amplification that is conducive to enhanced precipitation. Furthermore, the COVID-19 emission reduction induced a cyclonic circulation over the Bay of Bengal, resulting in increased moisture convergence to the Indian mainland, contributing to the observed rainfall enhancement. Besides this, lockdown-induced changes can be seen in cloud parameters and are discernible in the model simulations and ERA5 reanalysis. The cloud invigoration caused by aerosols may have been hampered due to the reduction in aerosols. As a result, we saw an increase in cloud cover (Yang et al., 2022), cloud effective radius and a cloud base height reduction, which could have translated to an increase in cloud water content and droplet size (Chakraborty and Maitra, 2013; Timmermann et al., 2020). Such circumstances may aid in increasing the likelihood of precipitation (Timmermann et al., 2020; Lee et al., 2021; Yang et al., 2022).
Aside from natural and anthropogenic aerosols, natural oscillations (El Nino, PDO, IOD, etc.) and remote drivers (e.g., Arctic Sea ice melting, Chatterjee et al., 2021) may potentially play an important and complex role in modulating cloud and rainfall over India. It’s worth noting that the link between air pollution/emission forcing anomalies and cloud responses isn’t limited to the forcing regions. A generalization of our results is limited due to the use of a single model and our results are specific to the regional emission perturbations. As society evolves and adopts policy measures gradually, regional and temporary emission reduction may continue to occur in the future. In this context, our study lends opportunities to enhance scientific understanding of how extreme weather and climate may respond to short-term emission perturbations like those that took place during the COVID-19 pandemic. Nonetheless, we can re-confirm the importance of anthropogenic pollution reduction for enhanced water availability across the Indian subcontinent and comprehend the robustness of its climatic implications. This will aid in understanding the necessity of improved emission management policies for a brighter future.
Data availability statement
The raw data supporting the conclusions of this article will be made available by the authors, without undue reservation.
Author contributions
This manuscript is the combined effort of all the co-authors. AA, SF, and RM formulated the manuscript. SF performed the model simulations. PC and TS analyzed the data. All co-authors contributed to writing the manuscript.
Acknowledgments
AA is thankful to the Department of Science and Technology Government of India for providing INSPIRE fellowship for doctoral research. The authors thank the staff of the High-Power Computing Centre (HPC) in IITM, Pune, India, for providing computer resources and the team members of MODIS, MERRA, and ERA5 for providing data.
Conflict of interest
The authors declare that the research was conducted in the absence of any commercial or financial relationships that could be construed as a potential conflict of interest.
Publisher’s note
All claims expressed in this article are solely those of the authors and do not necessarily represent those of their affiliated organizations, or those of the publisher, the editors and the reviewers. Any product that may be evaluated in this article, or claim that may be made by its manufacturer, is not guaranteed or endorsed by the publisher.
Supplementary material
The Supplementary Material for this article can be found online at: https://www.frontiersin.org/articles/10.3389/fenvs.2022.911363/full#supplementary-material
References
Albrecht, B. A. (1989). Aerosols, cloud microphysics, and fractional cloudiness. Science 245 (4923), 1227–1230.
Balakrishnan, K., Dey, S., Gupta, T., Dhaliwal, R. S., Brauer, M., Cohen, A. J., et al. (2019). The impact of air pollution on deaths, disease burden, and life expectancy across the states of India: The global burden of disease study 2017. Lancet Planet. heal. 3. e26–e39. doi:10.1016/S2542-5196(18)30261-4/ATTACHMENT/EFB4D915-C39A-480A-A176-C311C2B3F1F3/MMC1
Bao, R., and Zhang, A. (2020). Does lockdown reduce air pollution? Evidence from 44 cities in northern China. Sci. Total Environ. 731. 139052, ttps://doi.org/doi:10.1016/J.SCITOTENV.2020.139052
Bauwens, M., Compernolle, S., Stavrakou, T., Müller, J. F., van Gent, J., Eskes, H., et al. (2020). Impact of coronavirus outbreak on NO2 pollution assessed using TROPOMI and OMI observations. Geophys. Res. Lett. 47, e2020GL087978. doi:10.1029/2020GL087978
Bollasina, M. A., Ming, Y., Ramaswamy, V., Schwarzkopf, M. D., and Naik, V. (2014). Contribution of local and remote anthropogenic aerosols to the twentieth century weakening of the South Asian Monsoon. Geophys. Res. Lett. 41, 680–687. doi:10.1002/2013GL058183
Buchard, V., Da Silva, A. M., Colarco, P., Krotkov, N., Dickerson, R. R., Stehr, J. W., et al. (2014). Evaluation of GEOS-5 sulfur dioxide simulations during the Frostburg, MD 2010 field campaign. Atmos. Chem. Phys. 14, 1929–1941. doi:10.5194/acp-14-1929-2014
Chakraborty, S., and Maitra, A. (2013). Interrelation between microphysical and optical properties of cloud and rainfall in the Indian region. IJRSP 42 (42), 105–112.
Chansaengkrachang, K., Luadsong, A., and Aschariyaphotha, N. (2018). Vertically integrated moisture flux convergence over southeast Asia and its relation to rainfall over Thailand. Pertanika J. Sci. Technol. 26, 235–246.
Chatterjee, S., Ravichandran, M., Murukesh, N., Raj, R. P., and Johannessen, O. M. (2021). A possible relation between Arctic sea ice and late season Indian Summer Monsoon Rainfall extremes. npj Clim. Atmos. Sci. 4, 36–6. doi:10.1038/s41612-021-00191-w
Chowdhury, S., Dey, S., and Smith, K. R. (2018). Ambient PM2.5 exposure and expected premature mortality to 2100 in India under climate change scenarios. Nat. Commun. 9, 318. doi:10.1038/s41467-017-02755-y
Dash, S. K., Shekhar, M. S., and Singh, G. P. (2006). Simulation of Indian summer monsoon circulation and rainfall using RegCM3. Theor. Appl. Climatol. 86, 161–172. doi:10.1007/s00704-006-0204-1
Deng, J., Dai, A., and Xu, H. (2020). Nonlinear climate responses to increasing CO2 and anthropogenic aerosols simulated by CESM1. J. Clim. 33, 281–301. doi:10.1175/JCLI-D-19-0195.1
Dumka, U. C., Kaskaoutis, D. G., Verma, S., Ningombam, S. S., Kumar, S., and Ghosh, S. (2021). Silver linings in the dark clouds of COVID-19: Improvement of air quality over India and Delhi metropolitan area from measurements and WRF-CHIMERE model simulations. Atmos. Pollut. Res. 12, 225–242. doi:10.1016/J.APR.2020.11.005
Fadnavis, S., Müller, R., Kalita, G., Rowlinson, M., Rap, A., Li, J.-L. F., et al. (2019). The impact of recent changes in Asian anthropogenic emissions of SO<sub>2</sub> on sulfate loading in the upper troposphere and lower stratosphere and the associated radiative changes. Atmos. Chem. Phys. 19, 9989–10008. doi:10.5194/acp-19-9989-2019
Fadnavis, S., Roy, C., Chattopadhyay, R., Sioris, C. E., Rap, A., Müller, R., et al. (2018). Transport of trace gases via eddy shedding from the Asian summer monsoon anticyclone and associated impacts on ozone heating rates. Atmos. Chem. Phys. 18, 11493–11506. doi:10.5194/ACP-18-11493-2018
Fadnavis, S., Sabin, T. P., Rap, A., Müller, R., Kubin, A., and Heinold, B. (2021). The impact of COVID-19 lockdown measures on the Indian summer monsoon. Environ. Res. Lett. 16, 074054. doi:10.1088/1748-9326/AC109C
Fadnavis, S., Semeniuk, K., Pozzoli, L., Schultz, M. G., Ghude, S. D., Das, S., et al. (2013). Transport of aerosols into the UTLS and their impact on the Asian monsoon region as seen in a global model simulation. Atmos. Chem. Phys. 13, 8771–8786. doi:10.5194/acp-13-8771-2013
Fasullo, J., and Webster, P. J. (2003)., A hydrological definition of Indian Monsoon onset and withdrawal. J. Clim. 16. 3200–3211. doi:10.1175/1520-0442(2003)016<3200a:AHDOIM>2.0
Forster, P. M., Forster, H. I., Evans, M. J., Gidden, M. J., Jones, C. D., Keller, C. A., et al. (2020). Current and future global climate impacts resulting from COVID-19. Nat. Clim. Chang. 10, 913–919. doi:10.1038/s41558-020-0883-0
Gautam, S. (2020). The influence of COVID-19 on air quality in India: A boon or inutile. Bull. Environ. Contam. Toxicol. 104, 724–726. doi:10.1007/S00128-020-02877-Y
Gelaro, R., McCarty, W., Suárez, M. J., Todling, R., Molod, A., Takacs, L., et al. (2017). The modern-era retrospective analysis for research and applications, version 2 (MERRA-2). J. Clim. 30, 5419–5454. doi:10.1175/JCLI-D-16-0758.1
Ghude, S. D., Chate, D. M., Jena, C., Beig, G., Kumar, R., Barth, M. C., et al. (2016). Premature mortality in India due to PM2.5 and ozone exposure. Geophys. Res. Lett. 43, 4650–4658. doi:10.1002/2016GL068949
Gu, Y., Wong, T. W., Law, C. K., Dong, G. H., Ho, K. F., Yang, Y., et al. (2018). Impacts of sectoral emissions in China and the implications: Air quality, public health, crop production, and economic costs. Environ. Res. Lett. 13, 084008. doi:10.1088/1748-9326/AAD138
Hansen, J., Sato, M., and Ruedy, R. (1997). Radiative forcing and climate response. J. Geophys. Res. 102, 6831–6864. doi:10.1029/96JD03436
Hersbach, H., Bell, B., Berrisford, P., Hirahara, S., Horányi, A., Muñoz-Sabater, J., et al. (2020). The ERA5 global reanalysis. Q. J. R. Meteorol. Soc. 146, 1999–2049. doi:10.1002/QJ.3803
Isaifan, R. J. (2020). The dramatic impact of coronavirus outbreak on air quality: Has it saved as much as it has killed so far? Glob. J. Environ. Sci. Manag. 6, 275–288. doi:10.22034/GJESM.2020.03.01
Jayaraman, A. (2001). Aerosol radiation cloud interactions over the tropical Indian Ocean prior to the onset of the summer monsoon. Curr. Sci. 81, 1437–1445. https://www.jstor.org/stable/24106568.
Khatri, P., Hayasaka, T., Holben, B., Tripathi, S. N., Misra, P., Patra, P. K., et al. (2021). Aerosol loading and radiation budget perturbations in densely populated and highly polluted Indo-Gangetic Plain by COVID-19: Influences on cloud properties and air temperature. Geophys. Res. Lett. 48, e2021GL093796–9. doi:10.1029/2021GL093796
Khatri, P., and Hayasaka, T. (2021). Impacts of Covid-19 on air quality over China: Links with meteorological factors and energy consumption. Aerosol Air Qual. Res. 21, 200668. doi:10.4209/AAQR.200668
Kripalani, R., Ha, K. J., Ho, C. H., Oh, J. H., Preethi, B., Mujumdar, M., et al. (2022). Erratic asian summer monsoon 2020: COVID-19 lockdown initiatives possible cause for these episodes? Clim. Dyn., 1–14. doi:10.1007/s00382-021-06042-x
Lau, K. M., Kim, M. K., and Kim, K. M. (2006). Asian summer monsoon anomalies induced by aerosol direct forcing: The role of the Tibetan Plateau. Clim. Dyn. 26, 855–864. doi:10.1007/s00382-006-0114-z
Lau, K. M., Ramanathan, V., Wu, G. X., Li, Z., Tsay, S. C., Hsu, C., et al. (2008). The joint aerosol–monsoon experiment: A new challenge for monsoon climate research. Bull. Am. Meteorol. Soc. 89, 369–384. doi:10.1175/BAMS-89-3-369
Lau, W. K. M. (2016). The aerosol-monsoon climate system of Asia: A new paradigm. J. Meteorol. Res. 30, 1–11. doi:10.1007/s13351-015-5999-1
Le Quéré, C., Jackson, R. B., Jones, M. W., Smith, A. J. P., Abernethy, S., Andrew, R. M., et al. (2020). Temporary reduction in daily global CO2 emissions during the COVID-19 forced confinement. Nat. Clim. Chang. 107 (10), 647–653. doi:10.1038/s41558-020-0797-x
Lee, S. S., Chu, J. E., Timmermann, A., Chung, E. S., Lee, J. Y., et al. (2021). East Asian climate response to COVID-19 lockdown measures in China. Sci. Rep. 11, 16852. doi:10.1038/s41598-021-96007-1
Levy, R. C., Remer, L. A., Kleidman, R. G., Mattoo, S., Ichoku, C., Kahn, R., et al. (2010). Global evaluation of the Collection 5 MODIS dark-target aerosol products over land. Atmos. Chem. Phys. 10, 10399–10420. doi:10.5194/acp-10-10399-2010
Li, Z., Lau, W. K.-M., Ramanathan, V., Wu, G., Ding, Y., Manoj, M. G., et al. (2016). Aerosol and monsoon climate interactions over Asia. Rev. Geophys. 54, 866–929. doi:10.1002/2015RG000500
Lin, L., Xu, Y., Wang, Z., Diao, C., Dong, W., and Xie, S. P. (2018). Changes in extreme rainfall over India and China attributed to regional aerosol-cloud interaction during the late 20th century rapid industrialization. Geophys. Res. Lett. 45, 7857–7865. doi:10.1029/2018GL078308
Liu, F., Wang, M., and Zheng, M. (2021). Effects of COVID-19 lockdown on global air quality and health. Sci. Total Environ. 755, 142533. doi:10.1016/j.scitotenv.2020.142533
Lou, B., Barbieri, D. M., Passavanti, M., Hui, C., Gupta, A., Hoff, I., et al. (2022). Air pollution perception in ten countries during the COVID-19 pandemic. Ambio 51, 531–545. doi:10.1007/s13280-021-01574-2
Mahato, S., Pal, S., and Ghosh, K. G. (2020). Effect of lockdown amid COVID-19 pandemic on air quality of the megacity Delhi, India. Sci. Total Environ. 730, 139086. doi:10.1016/j.scitotenv.2020.139086
Manchanda, C., Kumar, M., Singh, V., Faisal, M., Hazarika, N., Shukla, A., et al. (2021). Variation in chemical composition and sources of PM2.5 during the COVID-19 lockdown in Delhi. Environ. Int. 153, 106541. doi:10.1016/j.envint.2021.106541
Manisalidis, I., Stavropoulou, E., Stavropoulos, A., and Bezirtzoglou, E. (2020). Environmental and health impacts of air pollution: A review. Front. Public Health 8, 14–13. doi:10.3389/fpubh.2020.00014
Menut, L., Bessagnet, B., Siour, G., Mailler, S., Pennel, R., and Cholakian, A. (2020). Impact of lockdown measures to combat Covid-19 on air quality over Western Europe. Sci. Total Environ. 741, 140426. doi:10.1016/j.scitotenv.2020.140426
Muhammad, S., Long, X., and Salman, M. (2020). COVID-19 pandemic and environmental pollution: A blessing in disguise? Sci. Total Environ. 728, 138820. doi:10.1016/j.scitotenv.2020.138820
Myhre, G., Forster, P. M., Samset, B. H., Hodnebrog, Ø., Sillmann, J., Aalbergsj, S. G., et al. (2017). Pdrmip: A precipitation driver and response model intercomparison project-protocol and preliminary results. Bull. Am. Meteorol. Soc. 98, 1185–1198. doi:10.1175/BAMS-D-16-0019.1
Namdari, S., Karimi, N., Sorooshian, A., Mohammadi, G. H., and Sehatkashani, S. (2018). Impacts of climate and synoptic fluctuations on dust storm activity over the Middle East. Atmos. Environ. X. 173, 265–276. doi:10.1016/j.atmosenv.2017.11.016
Navinya, C., Patidar, G., and Phuleria, H. C. (2020). Examining effects of the COVID-19 national lockdown on ambient air quality across urban India. Aerosol Air Qual. Res. 20, 1759–1771. doi:10.4209/AAQR.2020.05.0256
Pandey, S. K., Vinoj, V., and Panwar, A. (2020). The short-term variability of aerosols and their impact on cloud properties and radiative effect over the Indo-Gangetic Plain. Atmos. Pollut. Res. 11, 630–638. doi:10.1016/j.apr.2019.12.017
Pandey, S. K., and Vinoj, V. (2021). Surprising changes in aerosol loading over India amid Covid-19 lockdown. Aerosol Air Qual. Res. 21, 200466–200512. doi:10.4209/AAQR.2020.07.0466
Ramanathan, V., Chung, C., Kim, D., Bettge, T., Buja, L., Kiehl, J. T., et al. (2005). Atmospheric Brown clouds: Impacts on South Asian climate and hydrological cycle. Proc. Natl. Acad. Sci. U. S. A. 102, 5326–5333. doi:10.1073/pnas.0500656102
Rosenfeld, D., Andreae, M. O., Asmi, A., Chin, M., Leeuw, G., Donovan, D. P., et al. (2014). Global observations of aerosol-cloud-precipitationclimate interactions. Rev. Geophys. 52, 750–808. doi:10.1002/2013RG000441
Samset, B. H., Myhre, G., Forster, P. M., Hodnebrog, Ø., Andrews, T., Faluvegi, G., et al. (2016). Fast and slow precipitation responses to individual climate forcers: A pdrmip multimodel study. Geophys. Res. Lett. 43, 2782–2791. doi:10.1002/2016GL068064
Sanap, S. D. (2021). Global and regional variations in aerosol loading during COVID-19 imposed lockdown. Atmos. Environ. X. 246, 118132. doi:10.1016/j.atmosenv.2020.118132
Schultz, M. G., Stadtler, S., Schröder, S., Taraborrelli, D., Franco, B., Krefting, J., et al. (2018). The chemistry–climate model ECHAM6.3-HAM2.3-MOZ1.0. Geosci. Model Dev. 11, 1695–1723. doi:10.5194/gmd-11-1695-2018
Srinivas, C. V., Hariprasad, D., Bhaskar Rao, D. V., Anjaneyulu, Y., Baskaran, R., and Venkatraman, B. (2013). Simulation of the Indian summer monsoon regional climate using advanced research WRF model. Int. J. Climatol. 33, 1195–1210. doi:10.1002/joc.3505
Stevens, B., Giorgetta, M., Esch, M., Mauritsen, T., Crueger, T., Rast, S., et al. (2013). Atmospheric component of the MPI-M earth system model: ECHAM6. J. Adv. Model. Earth Syst. 5, 146–172. doi:10.1002/JAME.20015
Stier, P., Feichter, J., Kinne, S., Kloster, S., Vignati, E., Wilson, J., et al. (2005). The aerosol-climate model ECHAM5-HAM. Atmos. Chem. Phys. 5, 1125–1156. doi:10.5194/acp-5-1125-2005
Stocker, T. F., Qin, D., Plattner, G. K., Tignor, M. M. B., Allen, S. K., Boschung, J., et al. (2013). Climate change 2013 the physical science basis: Working group I contribution to the fifth assessment report of the intergovernmental panel on climate change. Cambridge University Press. doi:10.1017/CBO9781107415324
Tegen, I., Harrison, S. P., Kohfeld, K., Prentice, I. C., Coe, M., and Heimann, M. (2002). Impact of vegetation and preferential source areas on global dust aerosol: Results from a model study. J. Geophys. Res. 107 (D21), AAC-14. doi:10.1029/2001JD000963
Tegen, I., Neubauer, D., Ferrachat, S., Drian, C. S., Bey, I., Schutgens, N., et al. (2019). The global aerosol-climate model echam6.3-ham2.3—Part 1: Aerosol evaluation. Geosci. Model Dev. 12, 1643–1677. doi:10.5194/gmd-12-1643-2019
Thomas, A., Kanawade, V. P., Sarangi, C., and Srivastava, A. K. (2021). Effect of COVID-19 shutdown on aerosol direct radiative forcing over the Indo-Gangetic Plain outflow region of the Bay of Bengal. Sci. Total Environ. 782, 146918. doi:10.1016/j.scitotenv.2021.146918
Timmermann, A., Lee, S.-S., Chu, J.-E., Chung, E.-S., and Lee, J.-Y. (2020). COVID-19-related drop in anthropogenic aerosol emissions in China and corresponding cloud and climate effects. doi:10.31223/osf.io/z5dm8
Vinoj, V., Rasch, P. J., Wang, H., Yoon, J. H., Ma, P. L., Landu, K., et al. (2014). Short-term modulation of Indian summer monsoon rainfall by West Asian dust. Nat. Geosci. 7, 308–313. doi:10.1038/ngeo2107
Vinoj, V., and Swain, D. (2020). Did COVID-19 lockdown brew “amphan” into a super cyclone? doi:10.20944/PREPRINTS202007.0033.V1
Wang, Z., Lin, L., Yang, M., Xu, Y., and Li, J. (2017). Disentangling fast and slow responses of the East Asian summer monsoon to reflecting and absorbing aerosol forcings. Atmos. Chem. Phys. 17, 11075–11088. doi:10.5194/acp-17-11075-2017
Wing, A. A., Emanuel, K., Holloway, C. E. , and Muller, C. (2018). Convective self-aggregation in numerical simulations: A review. Shallow clouds, water vapor, circulation, and climate sensitivity, 1–15.
Xie, X., Myhre, G., Liu, X., Li, X., Shi, Z., Wang, H., et al. (2020). Distinct responses of Asian summer monsoon to black carbon aerosols and greenhouse gases. Atmos. Chem. Phys. 20, 11823–11839. doi:10.5194/acp-20-11823-2020
Yang, Y., Ren, L., Wu, M., Wang, H., Song, F., Leung, L. R., et al. (2022). Abrupt emissions reductions during COVID-19 contributed to record summer rainfall in China. Nat. Commun. 13, 959. doi:10.1038/s41467-022-28537-9
Zhang, K., O’Donnell, D., Kazil, J., Stier, P., Kinne, S., Lohmann, U., et al. (2012). The global aerosol-climate model ECHAM-HAM, version 2: Sensitivity to improvements in process representations. Atmos. Chem. Phys. 12, 8911–8949. doi:10.5194/acp-12-8911-2012
Zhang, M., Katiyar, A., Zhu, S., Shen, J., Xia, M., Ma, J., et al. (2021). Impact of reduced anthropogenic emissions during COVID-19 on air quality in India. Atmos. Chem. Phys. 21, 4025–4037. doi:10.5194/acp-21-4025-2021
Zhao, C., Qiu, Y., Dong, X., Wang, Z., Peng, Y., Li, B., et al. (2018). Negative aerosol‑cloud re relationship from aircraft observations over Hebei, China. Earth and Space Science 5 (1), 19–29.
Appendix A: Calculation of moisture flux convergence
The moisture conservation equation in flux form of vertical integration suggested by Trenberth et al. (2011). Vertical integrated Moisture flux/Transport (VMIT) and its convergence (moisture flux convergence, MFC) are important proxies to understand the source and sink of moisture and hence the precipitation (Chansaengkrachang et al., 2018). Especially, the moisture flux convergence (MFC) has been considered to directly characterize the behaviour of extreme precipitation.
The wind vector, V, is defined by V = (u, v), where u and v are the east-west and north- south components of wind. The vertically integrated moisture transport (VIMT) improved from Fasullo and Webster, 2003 from Fasullo and Webster (2003) is calculated as follows
and the vertically integrated moisture fluxes of u and v components are calculated as
Specific humidity is very small above the 300 hPa level and is not an effect to vertically integrated moisture transport (Fasullo & Webster, 2003).
Finally, Finally, the moisture flux divergence (convergence) is calculated by calculating the divergence of VMIT as follows
Keywords: COVID-19, emission reduction, regional climate, precipitation enhancement, cloud properties
Citation: Asutosh A, Fadnavis S, Chavan P, Sabin TP and Müller R (2022) Abrupt emission reduction during COVID-19 intensified the spring 2020 rainfall over India. Front. Environ. Sci. 10:911363. doi: 10.3389/fenvs.2022.911363
Received: 02 April 2022; Accepted: 27 July 2022;
Published: 24 August 2022.
Edited by:
Yang Gao, Ocean University of China, ChinaReviewed by:
Pinya Wang, Nanjing University of Information Science and Technology, ChinaChenghai Wang, Lanzhou University, China
Copyright © 2022 Asutosh, Fadnavis, Chavan, Sabin and Müller. This is an open-access article distributed under the terms of the Creative Commons Attribution License (CC BY). The use, distribution or reproduction in other forums is permitted, provided the original author(s) and the copyright owner(s) are credited and that the original publication in this journal is cited, in accordance with accepted academic practice. No use, distribution or reproduction is permitted which does not comply with these terms.
*Correspondence: S. Fadnavis, c3V2YXJuYUB0cm9wbWV0LnJlcy5pbg==