 Guangjie Wang
 Xuemei Han
 Chen Yang
 Jiangcheng Qian
- 1The Institute of Geography and Resources Science, Sichuan Normal University, Chengdu, China
- 2Key Lab of Land Resources Evaluation and Monitoring in Southwest, Ministry of Education, Chengdu, China
Climate change threatens the global living environment, and afforestation-based carbon sequestration is an effective measure to relieve and adapt to climate changes. In this study, the ideal distribution patterns of Abies, Picea, Quercus, and Betula species in forests in Mao County, China, were simulated and predicted, respectively, using the maximum entropy niche model, MaxEnt. Afterward, suitable distribution patterns of the four dominant tree species under different scenarios were simulated by overlaying suitable distribution areas for each species. Subsequently, the total carbon sinks of the suitable distribution patterns were estimated by combining the biomass expansion factors (BEFs). The optimal scenario for carbon sequestration was found by comparing the total carbon sinks under different scenarios. By comparing the results with existing forest resources in Mao County, the maximum increase of the carbon sink potential was estimated. The results demonstrated the following: 1) the MaxEnt model has a good simulation effect and the average AUC of the four tree species is higher than 0.8, indicating that the potential distribution areas of the dominant tree species have relatively high accuracy in model simulation. 2) The suitable area size order of the four dominant tree species is Picea > Abies > Betula > Quercus. The total suitable area is 295,593.28ha. The order of biomass of the four tree species per unit area is Abies > Betula > Picea > Quercus. 3) When it is suitable to plant multiple tree species simultaneously, the planting combination mode of the trees was chosen according to biomass to obtain maximum carbon reserves. The carbon reserve of this combination mode was 15.81 Tg C. 4) Compared with existing forest resources, the maximum carbon reserve potential of the four dominant tree species can increase to 2.13 Tg C in the future. In this study, suitable distribution patterns and carbon sink potentials of the four dominant tree species in the northwestern Sichuan Plateau were analyzed and predicted. The results provided a reference for afforestation plans, tree species selection, and regional distribution layouts for future carbon sequestration projects in the plateaus. The study is beneficial for increasing economic benefits and the ecological value of forest carbon sinks in plateaus.
1 Introduction
Global climate warming has many adverse effects on food security, health, the environment, and social-economic development. It has become a global challenge that threatens human survival and sustainable development. Greenhouse gas emissions caused by human activities are major causes of global climate warming at present. There are two major pathways to lowering the concentration of greenhouse gases in the atmosphere: decreasing “carbon sources” and increasing “carbon sinks”. Forests are the largest carbon pool in terrestrial ecosystems. They have an irreplaceable role in lowering concentrations of greenhouse gases and are an important pathway to relieving global climate change effectively (Canadell and Raupach, 2008). Recently, the carbon sink problem of forests has become a research hotspot in relevant fields. Forest ecosystems have rich species diversity and a complicated hierarchical structure (Kurz and Apps, 1993). The carbon sequestration capacity of forest ecosystems on a regional scale is measured according to estimations of carbon reserves of forest resources. Different forest distribution patterns and forest population structures may have different carbon reserves (Kaul et al., 2010). Moreover, increasing the forest stock volume unscientifically may break the balance of terrestrial ecosystem elements. Therefore, studying the suitable distribution pattern of dominant tree species in the region and evaluating their carbon sink potential based on this distribution pattern will have important theoretical and practical significance to increase the carbon sequestration capacity and ecological benefit in these regions.
In previous studies on forest carbon sinks, scholars analyzed the characteristics of forest carbon sinks from the perspectives of the estimated carbon sink volume of the global forest system (FRA, 2015; Pan et al., 2011); biomass, carbon reserves, and the carbon sequestration potential of specific tree species (Kaul et al., 2010; Hariyadi et al., 2019); carbon sequestration, the emission-reduction potentials of forests, and the cost of carbon sequestration projects in different regions and at different climate temperature belts (Raihan et al., 2019); and total carbon reserves and the economic value of carbon sinks in forest landscape ecosystems (Nereoh et al., 2022). Estimating the carbon sink potential of forests based on suitable tree species in plateau mountain areas is yet to be studied.
To predict the dominant tree species in a region, it is important to estimate the carbon sink potential of forests in a region. At present, studies on tree species mainly involve the influence of climate change on tree species distribution (Dyderski et al., 2018), the prediction of temporal-spatial distribution variations of dominant tree species in a region (Chakraborty et al., 2016), and changes in tree species distribution under the climate model using the DISTRIB model (Iverson et al., 2019). All of these studies have focused on forest protection and management, and few were concerned with the ecological value of tree species distribution. In other words, few studies analyzed the ecological benefits of species distribution from the perspective of afforestation-based carbon sequestration.
For studies on the prediction of species distribution, species distribution models based on maximum entropy (MaxEnt) and machine learning theory, that is, niche models, have been widely applied to study the potential distribution scope and laws of species in the study area. Based on the maximum entropy theory, MaxEnt evaluates niches of species with a specific algorithm by combining the distribution time-point data of species and corresponding environmental variables. Then, it reflects the adaptation of species to their habitat according to the entropy value (or probability) through machine learning simulation and establishes a prediction model of the most suitable growth of different species (Elith et al., 2011). Geographical environmental factors have important influences on the distribution features of different species. This model is of significance to the study of the spatial distribution of species under environmental and climate change by establishing laws between environmental factors and species distributions.
Afforestation is one of the most effective methods to improve the climate and environment and relieve climatic changes. Choosing the appropriate tree species and creating the optimal carbon sink is the most important problem in carbon sequestration based on afforestation. In this study, Mao County in the northwestern Sichuan Plateau was chosen as the study area. Using the ecological niche model MaxEnt, suitable distribution patterns of four dominant tree species (Abies, Picea, Quercus, and Betula) were discussed. The carbon sink capacities of four dominant tree species under different scenarios and the future carbon sink potential were calculated using the biomass expansion factor method. Moreover, the suitable distribution scope and increasing carbon sink potential of the four dominant species in Mao County were predicted. These results will aid in the selection and layout of appropriate tree species in future afforestation plans. The results provided a reference for the increase in the forest stock volume and forest carbon sequestration in Mao County in the future.
2 Data and Methodology
2.1 Study Area
Mao County is in the northwest of the Sichuan Province, China, on the southeast edge of the Qinghai-Tibet Plateau. It has unique climatic conditions, landforms, and hydrological characteristics. It has a plateau-type monsoon climate, with an average annual temperature of 12.2°C, average annual precipitation of 486.3 mm, and annual evaporation of 1,500 mm. The landform is mainly high mountains and valleys. The terrain inclines from the northwest to the southeast. The average elevation of the peaks is about 4000m, with a maximum of 5,230 m and a minimum of 906 m (Figure 1). Mao County possesses rich forest resources; arbor species are mainly Abies, Picea, Betula, Quercus semicarpifolia, Cyclobalanopsis glauca, etc. Among them, the proportion of Picea is the highest (17.51%), followed by Abies (17.43%), Quercus (9.09%), and Betula (7.22%). There are developed water resources and water systems in the region mainly belonging to the Minjiang River. There is sufficient water volume, a steep river bed, and a great natural drop to give rich water power resources. Mao County is an accumulation area of cultures including those of Qiang and Zang nationalities in China; it retains a long history of characteristics of Tibetan areas and the culture of the Qiang nationality.
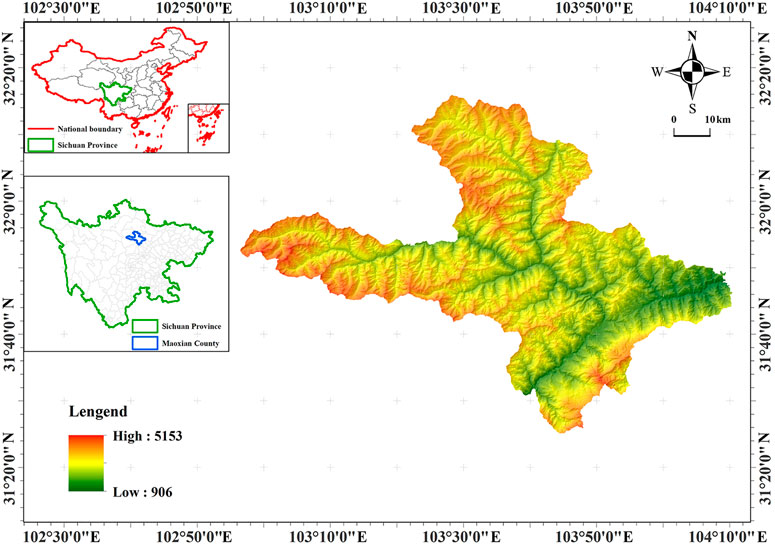
FIGURE 1. Location of the study area.
2.2 Data Source
2.2.1 Data of Sampling Points
The MaxEnt model is built according to the relationship between sampling points and environmental variables. Under general conditions, the simulation accuracy of the model becomes more stable, and the effect is better with an increasing sample size (Hirzel and Guisan, 2002; Mcpherson and Rogers, 2004). Through a survey of existing tree species in the forest, it was found that Abies, Picea, Betula, and Quercus grow the best and account for the highest proportion; hence, they were chosen as the four dominant tree species in this study. Data from sampling points of these four dominant tree species were collected from the latest forest survey database of Mao County. According to the distribution of tree species, a bottom class was used as the unit. To prevent excessive aggregation of distribution points, a 5-km buffer zone was built up for each point, and overlaying sample plots in the buffer zone were eliminated, thus obtaining data on the distribution sampling points of the four tree species. Combined with a field survey, sampling points were eliminated, and finally, 4,307 sampling points were collected, including 836 sampling points for Abies, 1,241 sampling points for Picea, 1,320 sampling points for Quercus, and 910 sampling points for Betula (Figure 2).
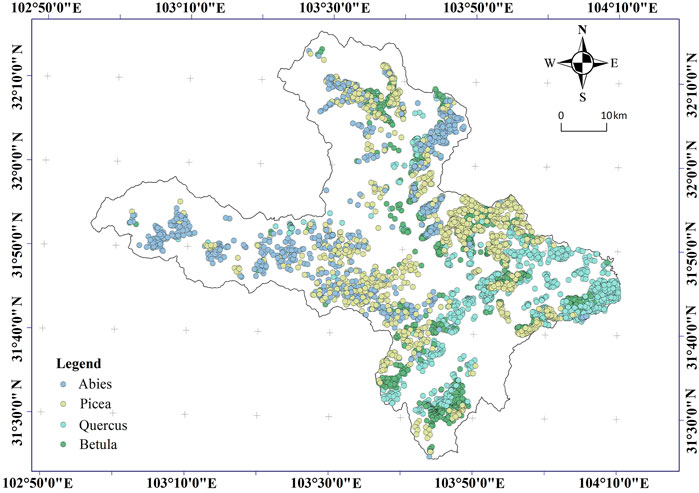
FIGURE 2. Locations of sampling points of the four dominant tree species.
2.2.2 Environmental Variables
In this study, 15 environmental variables within the topography, climate, soil, and evaporation were chosen as major factors that influence the distribution of Abies, Picea, Quercus, and Betula (Table 1). Topographic data came from the DEM elevation data website1. Elevation data in Mao County were collected using the ArcGIS extraction tools. Slope and aspect data were collected by the grid surface analysis of the 3D analysis tool. Evaporation capacity data and climate data were obtained from the Data Center for Resources and Environmental Sciences, Chinese Academy of Sciences2. Soil data sampling points were gained from the forest survey database of Mao County, and relevant vector data of soil factors were collected through the interpolation analysis.
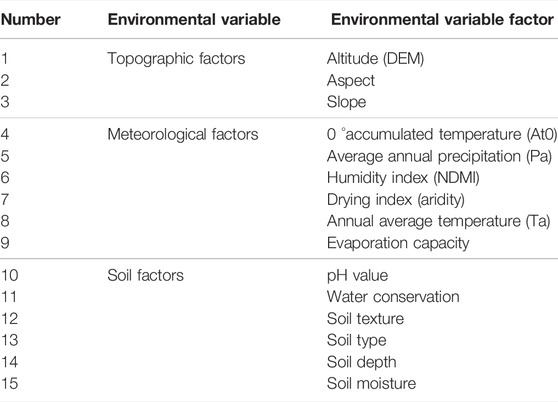
TABLE 1. Environmental variable factors used in the model.
2.3 Methodology
2.3.1 Application of the MaxEnt Model
The MaxEnt model was used to predict a suitable planting layout for the four dominant tree species in Mao County. The MaxEnt model is an ecological niche model based on maximum entropy and machine learning theory developed by Professor Steven Phillips and Miro Dudik et al. from the AT&T Laboratory of Princeton University to study the geographic spatial distribution of species (Phillips, 2005; Phillips et al., 2006; Phillips and Dudík, 2008). Now, the MaxEnt model has been extensively used to predict animal migration, plant distribution, plant diseases, and insect pests, and in other fields ((Shao et al., 2011; Cao et al., 2021; Zeng et al., 2021). The MaxEnt model has the advantages of low requirements of sample size, flexible variable processing (only needs occurrence data), good de-noising effect, and high prediction accuracy.
The MaxEnt model forms the spatial distribution pattern of species by establishing the relationship between samples and environmental layers. For the model setting, the test set was determined as 25%, and the training set was 75%. Response curves were run, and pictures of predictions were produced with a jackknife to measure variable importance. The output form was logistic curves (Babasaheb et al., 2014). To improve the precision and accuracy of the model, the number of operations was set at 10 and the mean values were chosen as the final results. The accuracy of the MaxEnt model was determined by the receiver operating characteristics (ROC) which were gained from the operation of the model; its characteristics were defined by the area under the curve (AUC), ranging between 0 and 1. Generally, if the AUC is 0.5–0.7, the model has a poor simulation effect. If the AUC is 0.7–0.8, the model has a moderate simulation effect. If the AUC is 0.8–0.9, the model has a good simulation effect. If the AUC is 0.9–1, the model has an extremely good simulation effect (Hanley and Mcneil, 1982).
With respect to the division of suitable distribution areas based on the model, the suitable areas of tree species under different scenarios were divided into four grades with reference to previous studies and practical situations encountered in Mao County: grade 1: <0.1, unsuitable area; grade 2: 0.1–0.3, moderately suitable area; grade 3: 0.3–0.5, highly suitable area; and grade 4: >0.5, optimally suitable area.
2.3.2 Carbon Sink Estimation Method
Carbon sinks of four dominant arbor species were estimated using the biomass expansion factor (BEF) method. The BEF method is a popular method to estimate carbon sinks of forests, especially arbors. This method converts the stock volume of tree species into biomass using the BEF calculation and then multiplies the biomass by the carbon stock (CF) of the species, thus obtaining the carbon sink of the species (Wu et al., 2018). The specific formula is as follows:
where:
B——biomass of arbor species per unit area (dry substance) (t/ha); V——carbon stock of arbor species per unit area (m3/ha); SVD——density of basic timber (dry substances) of arbor species (t/ha); BEF——biomass expansion factor of arbor species; B——biomass of arbor species per unit area (dry substance) (t/ha); C——biomass carbon sink of arbor species (t); CF——carbon stock per tons of dry substances of tree species (t/tons); S——area of arbor species (ha).
Among the aforementioned parameters, V was obtained from the forest survey data of Mao County. SVD and BEF used the reference values of national and IPCC carbon accounting parameters. CF used the carbon stock of dominant tree species in China from the Guideline for Carbon Sink Accounting of Forest Ecosystem.
3 Result Analysis
3.1 Model Accuracy
The accuracy of the MaxEnt model was determined by the AUC of the receiver operating characteristic (ROC) curve. In this study, the average AUC values of Abies, Picea, Quercus, and Betula were 0.854, 0.821, 0.874, and 0.854, respectively (Figure 3). This result shows the MaxEnt model has good accuracy, and its predictions of the suitable distribution of tree species are relatively reliable (Elith J et al., 2011).
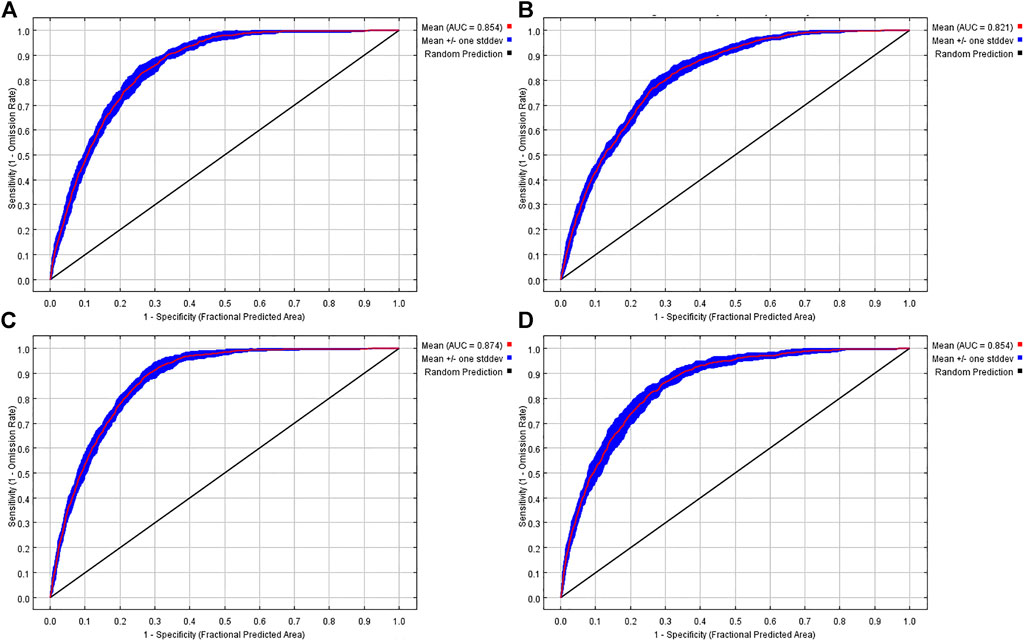
FIGURE 3. AUC values of ROC curves of Abies (A), Picea (B), Quercus (C), and Betula (D).
3.2 Suitable Distribution of Four Dominant Tree Species Under Different Scenarios
In this study, the distribution zones of Abies, Picea, Quercus, and Betula were predicted using the MaxEnt model, thus simulating their suitable distribution patterns (Figure 4). It can be seen from Figure 4 that the suitable area for Picea is the largest, covering almost the whole study area. According to the calculations, the suitable planting area reaches 143,716.18 ha. The suitable area for Abies is mainly located in the northwest regions and is calculated to be 132,924.40 ha. The suitable area for Quercus is concentrated in the southeast regions and is calculated to be 68,509.62 ha. The suitable area for Betula is concentrated in the central and southeast regions, calculated as 95,871.17 ha.
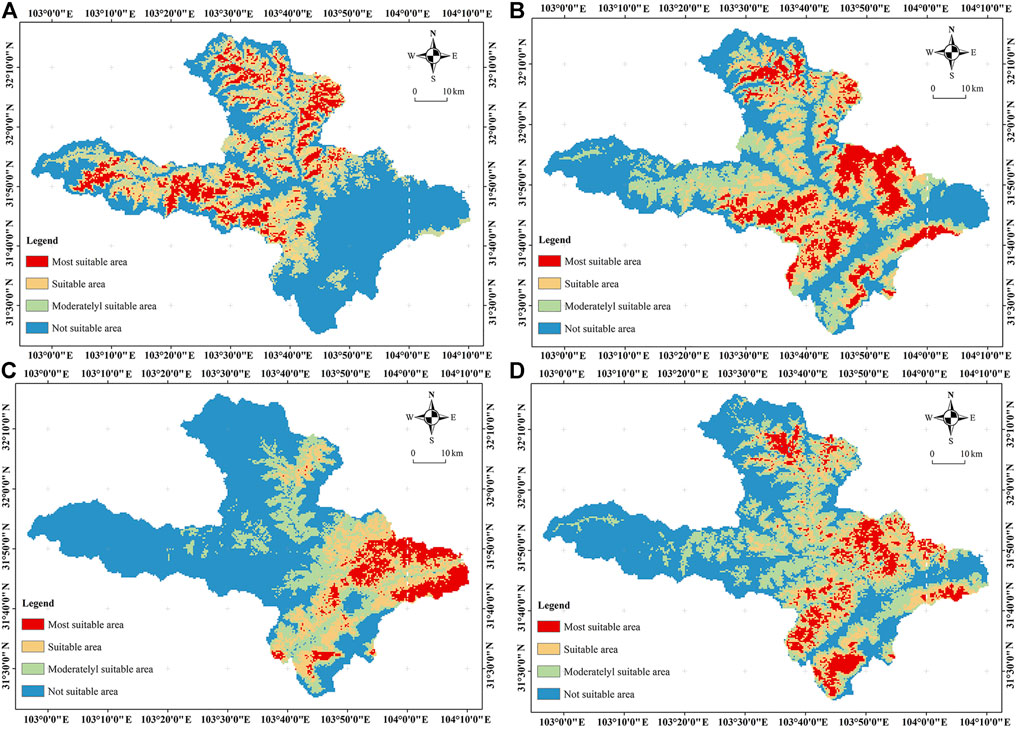
FIGURE 4. Distribution patterns of suitable areas of four tree species: (A) Abies; (B) Picea; (C) Quercus; and (D) Betula.
Since the suitable areas for the four dominant tree species overlap to some extent, weighted overlapping of different suitable areas for Abies, Picea, Quercus, and Betula was performed. Considering the development plan of Mao County, existing development areas and non-forest agricultural development zones were excluded, and spatial distributions of suitable areas for the four dominant tree species under four scenarios were concluded (Table 2). Scenario 1: when the suitable area of the same grade has an overlap of two or more species and one of the species is Abies, Abies is chosen as the dominant species. Scenario 2: when the suitable area of the same grade has an overlap of two or more species and one of the species is Betula, Betula is chosen as the dominant species. Scenario 3: when the suitable area of the same grade has an overlap of two or more species and one of the species is Quercus, Quercus is chosen as the dominant species. Scenario 4: when the suitable area of the same grade has an overlap of two or more species and one of the species is Picea, Picea is chosen as the dominant species.
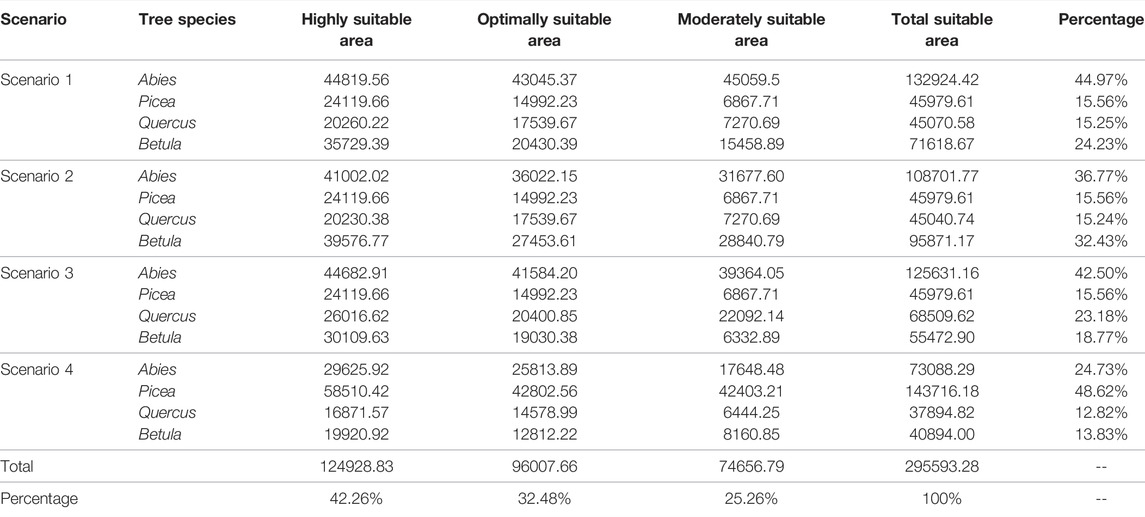
TABLE 2. Distributions of different suitable areas for four dominant tree species under four scenarios (area/ha.).
The total suitable areas of Abies, Picea, Quercus, and Betula amounted to 295,593.28 ha. Under all four scenarios, the highly suitable area was the largest (124,928.83 ha.), accounting for 42.26% of the total suitable area. Its suitable area is the second largest (96,007.66 ha.), accounting for 32.48% of the total suitable area. The moderately suitable area is 74,656.79 ha, and it accounts for 25.26% of the total suitable area (Table 2).
Scenario 1: the suitable area for Abies is the largest, at 132,924.40 ha., and accounts for 44.97%. The suitable area for Betula is the second largest, at 24.23%. The suitable areas for Picea and Quercus are relatively small, at 15.56 and 15.25%, respectively (Table 2).
Scenario 2: the suitable area for Abies decreases by 24,222.65 ha., but its suitable area is still the highest, at 108,701.77 ha., and accounts for 36.77%. The suitable area for Betula increases by 24,252.5 ha. (Figure 5) to 95,871.17 ha, which accounts for 32.43% (Table 2). The suitable areas for Picea and Quercus change slightly. This indicates that suitable areas of Abies and Betula overlap greatly and are relatively large.
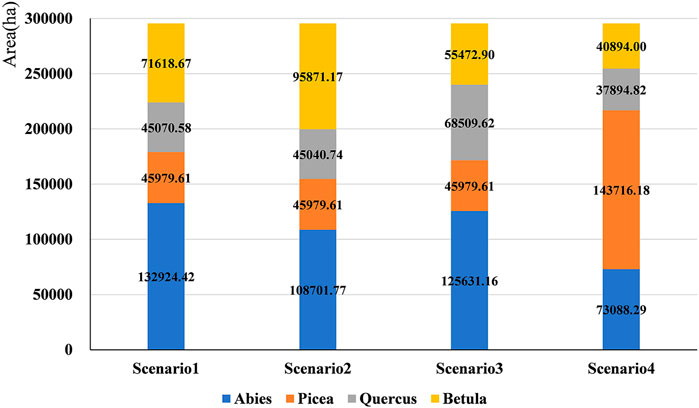
FIGURE 5. Comparison of suitable areas of four dominant tree species under four scenarios.
Scenario 3: the suitable areas for Abies and Betula decrease compared with those in scenario 1 and scenario 2. The suitable area for Abies decreases by 7,293.26 ha. to 125,631.16 ha, but its suitable area is still the highest, which accounts for 42.50% of total suitable areas. The suitable area for Betula decreases significantly by 16,145.77 ha compared to that in scenario 1 and 40,398.27 ha. (Figure 5) compared to that in Scenario 2. The suitable area for Betula is 554,729 ha, which accounts for 18.77%. The suitable areas for Quercus increased by 23,439.04 ha to 68,509.62 ha, which accounts for 23.28% of the total suitable area (Table 2). The suitable area for Picea remains the same. This reflects that the suitable areas for both Picea and Quercus are relatively small. Compared with other species, the overlapping areas of Picea and Quercus are relatively large, indicating extensive areas suitable for both Picea and Quercus.
Scenario 4: suitable areas for Abies, Quercus, and Betula decrease compared with those in the previous three scenarios. Among them, the suitable area for Abies decreases the most, by 59,836.13 ha (Figure 5), compared to that in scenario 1, and the proportion declines from 44.97 to 24.73%. The suitable area for Picea is doubled. It increased by 97,736.57 ha. compared to that in scenario 1 to 143,716.18 ha, which accounts for 48.62%. The suitable areas for Picea and Abies are the most similar and the largest. Moreover, the suitable area for Betula decreases by 30,724.67 ha compared to that in scenario 1 (Table 2). This indicates that the overlapping areas of Betula and Picea are the largest. The suitable area for Quercus decreases to the lowest value, which also indicates the small overlapping areas of Quercus and Picea.
3.3 Carbon Sink Calculation
3.3.1 Biomass of Four Dominant Tree Species per Unit Area
Biomass is the total cumulative organic matter of forest ecosystems and is an important index used to measure the forest ecological environment (Andersson et al., 2000). The biomasses of Abies, Picea, Quercus, and Betula per unit area were calculated using Formula 1. The biomass of Abies is the highest (125.09 t/ha), followed by Betula (92.21 t/ha), Picea (91.22 t/ha), and Quercus (88.09 t/ha), successively (Table 3).
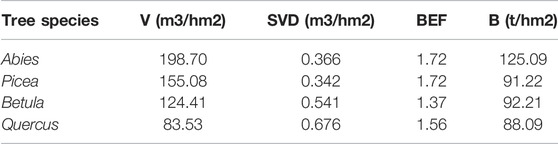
TABLE 3. Biomasses of Abies, Picea, Quercus, and Betula per unit area.
3.3.2 Carbon Sink Analysis Under Different Scenarios
The suitable distribution patterns of four dominant tree species under different scenarios were simulated.
On this basis, the carbon stock of suitable distribution patterns, as well as the total carbon sinks under four scenarios, was calculated through Formula 1 and Formula 2 (Table 4).
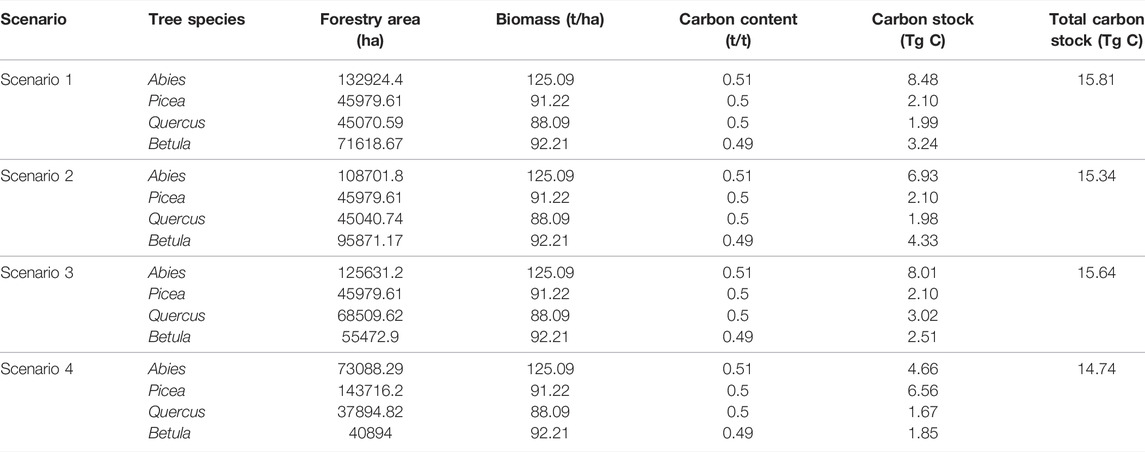
TABLE 4. Carbon stock of suitable distribution patterns under four scenarios.
Among the four scenarios, the carbon stock of scenario 1 was the highest. In other words, Abies is chosen as the dominant species and the total carbon stock is 15.80 Tg C. Specifically, the carbon stock of Abies is significantly higher than those of other species (Table 4). The carbon stock of scenario 3 ranks second, with Quercus chosen as the dominant species and a total carbon stock of 15.64 Tg C. Among them, Abies still shows the highest carbon stock, followed by Quercus (Table 4). The carbon stock of scenario 2 ranks third, with Betula chosen as the dominant species and a total carbon stock of 15.34 Tg C. Among them, Abies still shows the highest carbon stock, followed by Betula (Table 4). The carbon stock of scenario 4 is the lowest. When Picea is chosen as the dominant species, the total carbon stock is 14.74 Tg C. Picea shows the highest carbon stock, followed by Abies (Table 4).
3.3.3 Analysis of Scenarios for Optimal Carbon Stock
The carbon stock of forests is related to biomass, carbon stock, and carbon content, to different extents. To maximize carbon stock, scenario 5 was simulated; here, when there are several tree species overlapping in the suitable areas, the species with the maximum biomass is chosen as the optimal selection. In other words, Abies is chosen as the first choice, followed by Betula, Picea, and Quercus, successively. The carbon stock of scenario 5 is calculated as 15.81 Tg C (Table 5), which is higher than those of the previous four scenarios (0.01 Tg C up to 1.07 Tg C). This result reflects that tree species should be chosen according to biomass. Higher biomass and area lead to a higher carbon content and higher carbon stock.
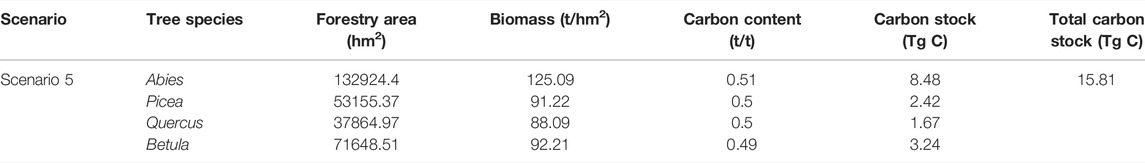
TABLE 5. Carbon stock of the optimal scenario.
3.3.4 Analysis of Optimal Carbon Sink Potentials
Since the carbon sink capacity of scenario 5 is the best and its carbon stock is the highest, scenario 5 is chosen to estimate carbon sink potentials that can be increased. Scenario 5 is superposed with existing land types. Existing development zones and non-forest agricultural development zones are excluded. According to the principle of maximum forest carbon sinks excluding the existing forest area, the distribution of suitable areas of the four dominant tree species is gained (Figure 6). In this way, the maximum carbon sink capacity that can be increased in suitable areas of four dominant tree species can be calculated, thus estimating potential carbon stock for the future (Table 6).
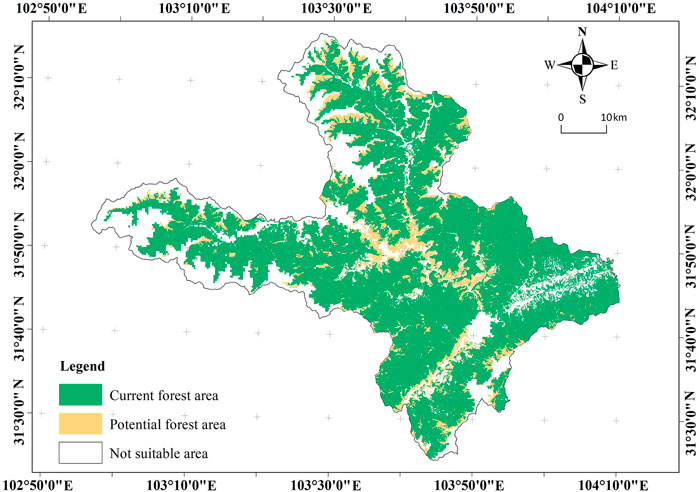
FIGURE 6. Carbon sink potential distributions of the optimal scenario.
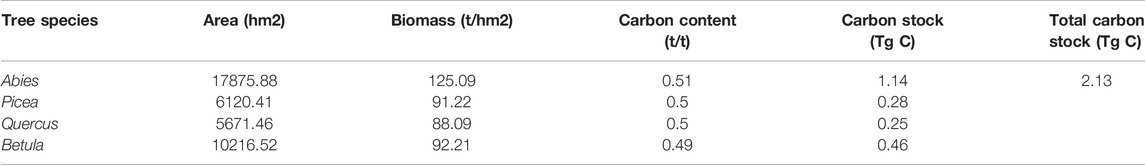
TABLE 6. Carbon stock potential of the optimal scenario.
Now, the forest area in Mao County is large. Due to unreasonable forest resource development and utilization in the early stages, a lot of suitable forests, cutover lands, and wastelands for afforestation and artificial repair remain unused. It can be seen from Figure 5 that suitable areas for the four dominant tree species are mainly distributed in suitable unused regions on two banks of the Min River as well as wasteland, cutover land, and suitable wasteland in the northwest and east regions. Carbon sink potential mainly comes from the increasable carbon sink of suitable forests. It can be seen from Table 6 that the suitable forest area that can be increased in the future in Mao County measures 39,884.28 ha, and the maximum carbon sink potential can be increased to 2.13 Tg C. Specifically, the suitable area of Abies can be increased the most, amounting to 17.875.88 ha, and its carbon sink potential is the highest. Carbon storage can be increased by 1.14 Tg C. The suitable area of Betula ranks second in terms of expansion potential and can be increased by 10,216 ha, which can increase the carbon stock by 0.46 Tg C. The suitable area of Quercus is increased the least, by 5,671.46 ha, thereby increasing carbon stock by 0.25 Tg C.
4 Discussion
Suitable areas of Abies, Picea, Quercus, and Betula were simulated in this study through the MaxEnt model. Simulation results showed that average AUC values of four dominant tree species are higher than 0.8, indicating that the accuracy of the simulation results is relatively high. The MaxEnt model can simulate suitable areas for four dominant tree species well. The results also verified the accuracy of the MaxEnt model in studying species distribution.
The results demonstrated there are suitable areas for Abies, Picea, Quercus, and Betula in Mao County. The total suitable area for the four dominant tree species is 295,593.28 ha (Figure 7). Among these areas, the optimally suitable area is the largest (42.26%), followed by the suitable area (32.48%) and moderately suitable area (25.26%) (Table 2). Among the four dominant tree species, the area suitable for Picea is the largest (143,716.18 ha). The suitable area of Picea covers a wide range and is concentrated in high-altitude areas in the northwest, central, and southeast regions of Mao County except for the plateaus, ice fields, and snow belts (Figure 4B). The area suitable for Abies is the second largest (132,924.40 ha); it is mainly concentrated in the northwest of Mao County (Figure 4A). The area suitable for Betula is the third largest (95,871.17 ha); it is mainly concentrated in the central and southeast regions of Mao County (Figure 4D). The area suitable for Quercus is the smallest (68,509.62 ha), it is concentrated in the southeast and valley areas in Mao County (Figure 4C). Betula and Quercus belong to broad-leaved forests, and they prefer the southeast valleys with a relatively low altitude and appropriate climate. According to the influencing factor curves, the model can recognize differences in suitable altitudes among the four dominant tree species (Figure 7).
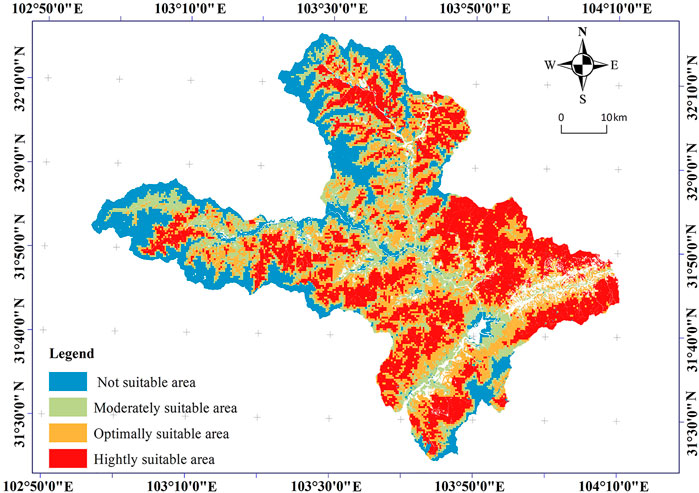
FIGURE 7. Overlapping distribution of suitable areas of four tree species.
The chosen four dominant trees have climate and geographic conditions appropriate for growth in Mao County. Picea and Abies belong to coniferous forests and are cold-resistant species that are distributed in low-temperature alpine regions. Mao County is located in the southeast region of the Qinghai-Tibet Plateau where there are many mountains, high altitudes, and low temperatures. It is more suitable for the growth of Picea and Abies (Liu et al., 2002); therefore, these two species have large overlapping areas. According to the response curves of altitude data and topographic factors of the model results, the altitude appropriate for the growth of Abies is about 2,800–3,700 m (Figure 8A), and the altitude appropriate for the growth of Picea is about 2,600–3,500 m (Figure 8B). The growth areas for Picea and Abies are similar. It is important to note that although Picea and Abies have relatively strong cold resistance and shade tolerance, Picea belongs to shallow-root species and is appropriate to grow in regions with low temperatures, high altitudes, and deep soil layer thickness. Hence, it is mainly distributed in mountainous regions with high altitudes and deep soil thickness in the central and southeast regions. In regions close to the northwest regions of Mao County, there are high altitudes, low temperatures, large-scale exposed rocks, and low soil thickness. These regions are inappropriate for Picea but appropriate for Abies, Betula, and Quercus which belong to broad-leaved forests. The suitable altitude for Betula is 2,300–3,200 m (Figure 8D) and the suitable altitude for Quercus is 1200–2,800 m (Figure 8D). These two species mainly grow in the southeast valley regions where they have relatively low altitudes and appropriate climates. Combining the results with the terrain characteristics, high in the northwest and low in the southeast of Mao County, suitable areas for Abies, Picea, Betula, and Quercus gradually range from northwest to southeast.
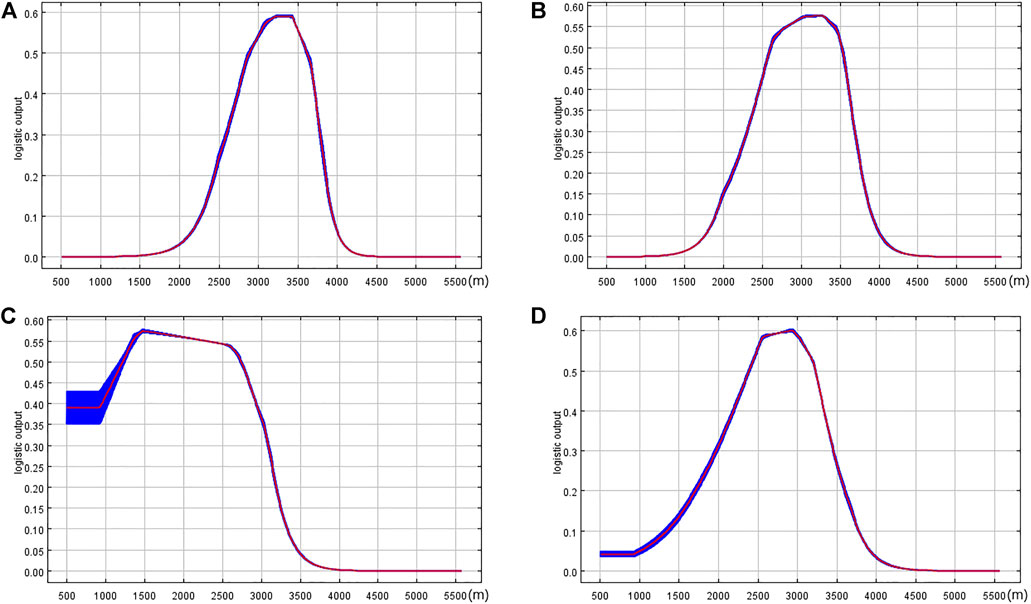
FIGURE 8. Effects of altitude on the suitable area distributions of four dominant tree species: (A) Abies; (B) Picea; (C) Quercus; and (D) Betula.
The carbon stock under different scenarios was analyzed using the BEF method. The test found that the carbon sink capacity of scenario 5 is the best: tree species are chosen according to biomass per unit area, and tree species with high biomass are chosen as much as possible, thus enabling maximum carbon stock. The total carbon sink capacity of tree species is closely related to the biomass, area, and carbon content of a single tree. Although the carbon content of species in different regions is different, the carbon content of coniferous forests is higher than broad-leaved forests (Birdsey, 1992; Lehtonen et al., 2004). In scenario 5, Abies has the largest planting area, followed by Betula, Picea, and Quercus, successively. In view of the biomass and carbon content of the four dominant tree species, although the suitable area of Picea is the largest, the suitable areas of Picea and Abies overlap greatly. Given the same carbon content, since the biomass and carbon sequestration of Abies are higher than those of Picea, Abies is the first choice. Picea and Betula have similar biomass and carbon content; therefore, the carbon stock is relatively high when the area of Betula is larger than Picea. However, this does not mean the carbon sequestration ability of Betula is better than that of Picea. Looking at the carbon stock per unit area, since the carbon content of Picea is higher than that of Betula, the carbon stock per unit area is 45.61 t/hm2 for Picea and 45.18 t/hm2 for Betula. Therefore, the carbon stock per unit area of Picea is higher than that of Betula. This is consistent with previous research conclusions (Cheng et al., 2008). In this study, dominant tree species are chosen according to biomass in scenario 5. Since the overlapping areas of Abies and Picea are large and the biomasses of Abies and Betula are higher than those of Picea, Picea is replaced by Abies, thus making the area of Betula larger than that of Picea. Consequently, the total carbon stock of Betula is higher than that of Picea. Moreover, the total carbon stock of the study area in scenario 5 is higher than in other scenarios, indicating that scenario 5 is the optimal one.
In the present study, suitable distribution patterns of four dominant tree species in Mao County were discussed, and suitable areas of different species under different scenarios were discussed. Moreover, the carbon stock was acquired for different scenarios using the BEF method. The optimal scenario was chosen, and the optimal carbon sink potentials were calculated. The results provide a reference for afforestation-based carbon sequestration in Mao County in the future. However, there remain some aspects worthy of further discussion. When discussing suitable distribution patterns of the four dominant tree species, the influence of changes in the climatic environment with time on an area suitable for the tree species was ignored. In fact, areas suitable for afforestation may vary with climatic changes, which must be considered in practical planning. Meanwhile, the carbon sink potential was calculated, and the BEF and SVD of the four tree species all used universal values for different regions, but the influence of differences in tree ages was ignored. Carbon sink potentials at different tree ages were further analyzed in subsequent studies.
5 Conclusion
There are many suitable areas for Abies, Picea, Quercus, and Betula in Mao County. The suitable areas of Abies and Picea are the largest, followed by Betula. The suitable area of Quercus is the smallest. With consideration of the carbon sink potential of the ecological environment, tree species were chosen first according to biomass and maximum carbon stock. In the optimal scenario, the order of suitable areas of the four species was Abies > Betula > Picea > Quercus, and the order of carbon stock was the same: Abies > Betula > Picea > Quercus. In the future, Mao County should plant suitable tree species in unused regions at two banks of the Min River, wastelands in the northwest and east mountain areas, cutover lands, and wastelands appropriate for afforestation to increase carbon sinks. Therefore, the future afforestation plan in Mao County should first choose large-scale planting of Abies, followed by Betula and Picea. Quercus is the last choice. Such an afforestation plan would achieve the maximum carbon stock. This can not only increase the economic benefits of carbon sinks but can also offer the ability to significantly improve and adapt to climate changes.
Data Availability Statement
The raw data supporting the conclusions of this article will be made available by the authors, without undue reservation.
Author Contributions
Designing experiments: GW and XH; performing experiments: CY and XH; analyzing experimental results: GW and XH; writing manuscript: GW, XH, and JQ; review and Editing: GW, XH, CY, and JQ.
Conflict of Interest
The authors declare that the research was conducted in the absence of any commercial or financial relationships that could be construed as a potential conflict of interest.
Publisher’s Note
All claims expressed in this article are solely those of the authors and do not necessarily represent those of their affiliated organizations, or those of the publisher, the editors, and the reviewers. Any product that may be evaluated in this article, or claim that may be made by its manufacturer, is not guaranteed or endorsed by the publisher.
Footnotes
References
Andersson, F. O., Agren, G. I., and Fuhrer, E. (2000). Sustainable Tree Biomass Production[J]. For. Ecol. Manag. 132, 51–62. doi:10.1016/S0378-1127(00)00379-0
Babasaheb, B. F., Kumar, M., and Kamble, A. L. (2014). Predicting the Potential Geographic Distribution of Cotton Mealybug Phenacoccus solenopsis in India Based on MAXENT Ecological Niche Model[J]. J. Environ. Biol. 35, 973. doi:10.1007/s11367-014-0772-8
Birdsey, R. A. (1992). Carbon Storage and Accumulation in United States Forest Ecosystems[J]. General Tech. Rep. Wo 59. doi:10.1016/j.ecoleng.2016.10.006
Canadell, J. G., and Raupach, M. R. (2008). Managing Forests for Climate Change Mitigation. Science 320 (5882), 1456–1457. doi:10.1126/science.1155458
Cao, Z., Zhang, L., Zhang, X., and Guo, Z. (2021). Predicting the Potential Distribution of Hylomecon Japonica in China under Current and Future Climate Change Based on Maxent Model. Sustainability 13, 11253. doi:10.3390/su132011253
Chakraborty, A., Joshi, P. K., and Sachdeva, K. (2016). Predicting Distribution of Major Forest Tree Species to Potential Impacts of Climate Change in the Central Himalayan Region. Ecol. Eng. 97, 593–609. doi:10.1016/j.ecoleng.2016.10.006
Cheng, T. R., Feng, J., Qin-Yan, M., Wang, Y. T., Kang, F., Zhang, Y. L., et al. (2008). Carbon Pool and Allocation of Forest Vegetations in Xiaolong Mountains Gansu Province[J]. Acta Ecol. sin. 28 (1), 12. doi:10.3321/j.issn:1000-0933.2008.01.004
Dyderski, M. K., Paź, S., Frelich, L. E., and Jagodziński, A. M. (2018). How Much Does Climate Change Threaten European Forest Tree Species Distributions? Glob. Change Biol. 24, 1150–1163. doi:10.1111/gcb.13925
Elith, J., Phillips, S. J., Hastie, T., Dudik, M., Chee, Y. E., and Yates, C. J. (2011). A Statistical Explanation of MaxEnt for Ecologists[J]. Divers. Distributions 17 (1), 43. doi:10.1111/j.1472-4642.2010.00725.x
Hanley, J. A., and Mcneil, B. J. (1982). The Meaning and Use of the Area under a Receiver Operating Characteristic (ROC) Curve. Radiology 143 (1), 29–36. doi:10.1148/radiology.143.1.7063747
Hariyadi, A, Mahulette, A. S., Yahya, S., and Wachjar, A. (2019). Measuring the Potential of Biomass, Carbon Storage, and Carbon Sink of Forest Cloves. IOP Conf. Ser. Earth Environ. Sci. 399 (1), 012063. doi:10.1088/1755-1315/399/1/012063
Hirzel, A., and Guisan, A. (2002). Which is Optimal Sampling Strategy for Habitat Suitability Modeling. Ecol. Modell. 157 (2), 331–341. doi:10.1016/S0304-3800(02)00203-X
Iverson, L., Peters, M., Prasad, A., and Matthews, S. (2019). Analysis of Climate Change Impacts on Tree Species of the Eastern US: Results of DISTRIB-II Modeling. Forests 10 (4), 302. doi:10.3390/f10040302
Kaul, M., Mohren, G. M. J., and Dadhwal, V. K. (2010). Carbon Storage and Sequestration Potential of Selected Tree Species in India. Mitig. Adapt Strateg. Glob. Change 15, 489–510. doi:10.1007/s11027-010-9230-5
Kurz, W. A., and Apps, M. J. (1993). Contribution of Northern Forests to the Global C Cycle: Canada as a Case Study. Water Air & Soil Pollut. 70 (1), 163–176. doi:10.1007/978-94-011-1982-5_10
Lehtonen, A., Mäkipää, R., Heikkinen, J., Sievänen, R., and Liski, J. (2004). Biomass Expansion Factors (BEFs) for Scots Pine, Norway Spruce and Birch According to Stand Age for Boreal Forests. For. Ecol. Manag. 188 (1-3), 211–224. doi:10.1016/j.foreco.2003.07.008
Leley, N. C., Langat, D. K., Kisiwa, A. K., Maina, G. M., and Muga, M. O. (2022). Total Carbon Stock and Potential Carbon Sequestration Economic Value of Mukogodo Forest-Landscape Ecosystem in Drylands of Northern Kenya. Ojf 12 (1), 19–40. doi:10.4236/ojf.2022.121002
Liu, Z. L., Fang, J. Y., and Piao, S. L. (2002). Geographical Distribution of Special in Genera Abies, Picea and Larix in China. Acta Geogr. sin. 57 (5), 577–586. doi:10.3321/j.issn:0375-5444.2002.05.010
Mcpherson, J. M., Jetz, W., and Rogers, D. J. (2004). The Effects of Species' Range Sizes on the Accuracy of Distribution Models: Ecological Phenomenon or Statistical Artefact? J. Appl. Ecol. 41 (5), 811–823. doi:10.1111/j.0021-8901.2004.00943.x
Pan, Y., Birdsey, R. A., Fang, J., Houghton, R., Kauppi, P. E., Kurz, W. A., et al. (2011). A Large and Persistent Carbon Sink in the World's Forests. Science 333, 988–993. doi:10.1126/science.1201609
Phillips, S. J., and Dudík, M. (2008). Modeling of Species Distributions with Maxent: New Extensions and a Comprehensive Evaluation[J]. Ecography 31 (2). doi:10.1111/j.0906-7590.2008.5203.x
Phillips, S. J., Anderson, R. P., and Schapire, R. E. (2006). Maximum Entropy Modeling of Species Geographic Distributions. Ecol. Model. 190 (3-4), 231–259. doi:10.1016/j.ecolmodel.2005.03.026
Raihan, A., Begum, R. A., Mohd Said, M. N., and Abdullah, S. M. S. (2019). A Review of Emission Reduction Potential and Cost Savings through Forest Carbon Sequestration. Ajw 16 (3), 1–7. doi:10.3233/AJW190027
Shao, J., Zhou, Y., Li, J., Wang, X., Luo, Z., and Yan, B. (2011). “Spatial Distribution Analysis of Wild Bird Migration in Qinghai Lake Based on Maximum Entropy Modeling,” in 2011 Second International Conference on Networking and Distributed Computing, Beijing, China, September 21–September 24, 2011. doi:10.1109/ICNDC.2011.36
Wu, S. H., Zhu, J. H., He, Y. J., et al. (2018). Guideline on Carbon Stock Accounting in Forest ecosystem[S]. Beijing: Forestry University.
Keywords: climate changes, dominant tree species, suitable distribution patterns, carbon reserve, MaxEnt model, biomass expansion factors
Citation: Wang G, Han X, Yang C and Qian J (2022) Predicting a Suitable Distribution Pattern of Dominant Tree Species in the Northwestern Sichuan Plateau Under Climate Change and Multi-Scenario Evaluation of Carbon Sink Potentials. Front. Environ. Sci. 10:909841. doi: 10.3389/fenvs.2022.909841
Received: 31 March 2022; Accepted: 19 April 2022;
Published: 20 May 2022.
Edited by:
Dingde Xu, Sichuan Agricultural University, ChinaReviewed by:
Tiantian Chen, Chongqing Normal University, ChinaFei Liu, Institute of Mountain Hazards and Environment (CAS), China
Copyright © 2022 Wang, Han, Yang and Qian. This is an open-access article distributed under the terms of the Creative Commons Attribution License (CC BY). The use, distribution or reproduction in other forums is permitted, provided the original author(s) and the copyright owner(s) are credited and that the original publication in this journal is cited, in accordance with accepted academic practice. No use, distribution or reproduction is permitted which does not comply with these terms.
*Correspondence: Xuemei Han, eG1faGFuMDUxM0AxMjYuY29t