 Lingge Wang
 Rui Zhu1*
 Zexia Chen
 Rui Lu
 Chunshuang Fang
94% of researchers rate our articles as excellent or good
Learn more about the work of our research integrity team to safeguard the quality of each article we publish.
Find out more
ORIGINAL RESEARCH article
Front. Environ. Sci., 08 June 2022
Sec. Drylands
Volume 10 - 2022 | https://doi.org/10.3389/fenvs.2022.908987
This article is part of the Research TopicClimate and Land Use Change in Dryland Ecosystems: Individual and Coupled Mechanisms of ImpactView all 9 articles
Agricultural carbon emissions are supposed to be a fundamental component of the regional carbon cycle in regions with intense agricultural activities. However, the patterns and controls of agricultural carbon emissions based on the water–land resource coupling effect remain poorly understood in arid inland regions. Thus, we constructed a research framework combining water and land resources with agricultural carbon emissions to assess the linkage of water–land–agricultural carbon emissions in arid inland regions. The agricultural carbon emission measurement model and water–land resource coupling coordination degree model (WLCD) were used for exploring the spatial and temporal patterns of agricultural carbon emissions and water–land elements. The interaction between societal , economic , and ecological factors on agricultural carbon emissions was clarified using the logarithmic mean Divisia index (LMDI). The applicability of the method was verified in the Zhangye oasis in northwest China. The results are as follows: 1) from 2012 to 2019, the agricultural carbon emissions in Zhangye increased first and then declined, with 96% of which mainly coming from chemical fertilizers and plowing; 2) the coupling coordination index of water–land resources in Zhangye increased from 0.3715 in 2012 to 0.5399 in 2019, an increase of 45.33%, indicating a conversion from mild disordered to basic coordination; 3) regarding the effects among the factors, the economic output of agricultural water resource, cropland area per capita, and population (the water and land resource ratio and agricultural carbon emission intensity) exerted positive (negative) impacts on agricultural carbon emissions. Accordingly, it is suggested that the green and low-carbon development strategies for oasis agriculture require a high level of integrated planning and management of water and land resources, as well as comprehensive consideration of low-carbon agriculture and elements related to water and land.
With the emissions of carbon dioxide from all countries, greenhouse gas (GHG) is soaring, resulting in global climate change which is threatening ecosystems and human development (IPCC, 2014; Chacko et al., 2019; Pang et al., 2020). Against this backdrop, countries around the world have adopted a global agreement to reduce GHG emissions (Amin et al., 2020; Duan et al., 2020; Wei et al., 2021), which has led China to propose the goals of “2030 carbon peak” and “2060 carbon neutrality” (Xiong et al., 2021; Chen et al., 2022). The FAO reported that at least 30% of global anthropogenic GHG emissions come from agricultural land (FAO, 2021). Meanwhile, the agricultural ecosystems can reduce GHG emissions (such as methane), among which one effective means of reducing GHG emissions is the intensive and efficient use of cultivated land resources (Burney et al., 2010). Therefore, the development of agricultural modernization has put forward higher requirements for low-carbon agriculture (Wu et al., 2020). To achieve carbon peaking, agricultural carbon reduction and sequestration are both meaningful and great potential.
At present, studies on agricultural carbon emissions have been relatively concentrated on the types of agricultural carbon sources (Woomer and Tieszen, 2004; Johnson et al., 2007), influencing factors of agricultural carbon emissions (Dyer et al., 2010; Mohanad et al., 2018), and research on agricultural emissions reduction measures (Elina and Dagnija, 2016; Robin and Mary, 2017), among which most of the agricultural carbon sources are considered as a single production process (Han et al., 2018; Liu and Yang, 2021), and it is believed that agricultural carbon emissions primarily source from fertilizers, pesticides, agricultural films, agricultural machinery utilization, agricultural irrigation, and other agricultural operation. Based on this, scholars have further explored the role of multifactor linkages in agricultural activities. Zhao et al. (2018) constructed a theoretical framework for the coupling of “water–land–energy–carbon,” which hoped to enhance the ensemble study on the development of water–land–energy resources on agricultural carbon emissions at the provincial scale in China. Yu et al. (2022) developed a framework of energy–carbon–water interactions for agricultural production systems to achieve sustainable agricultural development by balancing supply and demand in the Qinghai–Tibet Plateau. Based on the planting system, Li et al. (2022) optimized the water–food–energy–carbon nexus (WFENCN) model to provide scientific suggestions for improving grain yield and reducing agricultural carbon emissions, and got good applications in the Sanjiang Plain.
Thus far, most of the existing studies on agricultural carbon emissions mostly focused on the national level and the area of main grain production, while fewer studies were conducted at the city and county scales, especially in the oasis in northwest China. While oases are the most important regions where agricultural activities occurred in arid zones, the shortage of water and land resources and regional structural damage and other non-sustainable resource utilization problems will directly threaten the regional agricultural production security (Ibarrola-Rivas et al., 2017; Chen et al., 2018; Ren et al., 2018), which requires urgent improvement of related studies. Moreover, the existing research studies mostly focus on the interaction between water resource, land resource, energy, food, and agricultural carbon emissions, while agricultural production in arid zones is characterized by land being controlled by water, and then consuming energy to produce food. Generally, the research studies in oases should pay more attention to the coupling of water resource and land resource, especially the mechanisms of the interactions and interconnections on the water and land resources coupling to agricultural carbon emissions.
Presently, most studies on regional water–land resource coupling mainly take administrative divisions as the research unit (Jiang et al., 2017; Liu et al., 2018), and the research methods mainly include the matching degree of water and land resources (MDWL) (Liu et al., 2006; Zhao et al., 2018), the water–land resources matching model based on the Gini coefficient (Li et al., 2016; Liu et al., 2018), and data envelopment analysis (Vitor, 2020; Lu et al., 2021), etc. For instance, Zhao et al. (2018) evaluated the spatial patterns of MDWL in China during 2005–2013, and found that MDWL was higher in eastern and southern provinces than that in western and northern provinces. To assess the degree of coupling of water and land, Xu et al. (2019) put forward a new coupling index which integrated water consumption with soil fertility. However, if the water and land resources are in shortage or abundant state at the same time, they cannot be effectively evaluated by the aforementioned methods. On account of this, some scholars evaluated water–land resource coupling with applied the WLCD model. The coupling coordination model is the model used to analyze the coordination level of system development, which can integrate several elements of endowment and utilization to more accurately and comprehensively assess the spatial–temporal changes of interdependence and interconstraint between land and water resource subsystems, and is an important reference indicator for sustainable development (Wu et al., 2021). For example, Wen et al. (2017) used a “pressure-state-response” framework and a coupled coordination model to quantify water–land resources and economic development in the Henan Province from 1999 to 2013. To explore the causes of water shortage, Jiang et al. (2017) established the risk indicator system for water shortage evaluation and indicators of land resources, and then used the WLCD model to assess the balance degree of water and land resource.
Generally, the existing studies on agricultural carbon emissions rarely involved the analysis of the effects of water and land resources coupling on agricultural carbon emissions in oases in arid zones. Based on this, we take the agricultural carbon emissions of oasis in arid regions as the research target and constructed a framework combining water and land resources with agricultural carbon emissions to assess the linkage of water–land–agricultural carbon emissions in arid inland regions. The agricultural carbon emission measurement model and WLCD model were used for exploring the spatial and temporal patterns of water and land elements and agricultural carbon emissions. After that, the LMDI model was used to clarify the interaction of societal, economic, and ecological factors on agricultural carbon emissions with ecological factors (water–land resources) as the entry point.
In the arid region of northwest China, water resources mainly come from mountainous surface runoff and groundwater. After coming out of the mountains, the runoff flows through the middle and lower regions, and is used for human survival and the irrigation for cultivated land. In this process, the exploitation of water and land resources generates large amounts of carbon emissions, which are partly absorbed by water, land, and vegetation, while partly affecting the runoff and land irrigation by changing the climate (Bahman et al., 2018; Fatiha et al., 2020), forming the water–land–carbon nexus on agricultural activities in the oasis of the arid region (Ghimire et al., 2021). In this context, the coupling effect of water and land elements is particularly prominent in the study of carbon emissions.
To this end, we constructed a research framework combining water–land resources with agricultural carbon emissions to evaluate the current situation of water and land resource coupling and agricultural carbon emissions in the arid inland region, demonstrated in Figure 1. As we know, water and land resources are intimately related to carbon emissions. So water and land elements were deemed to be ecological indicators combined with social and economic indicators to ascertain the impact factors of agricultural carbon emissions. In conclusion, this study constructed a water–land–carbon framework to clarify the relevance between water–land elements and agricultural carbon emissions, aiming to bring thought and insights for the future management of water–land resources and efficient agriculture in the arid region. This study took the Zhangye oasis in northwest China as a case to verify the rationality and feasibility of this method.
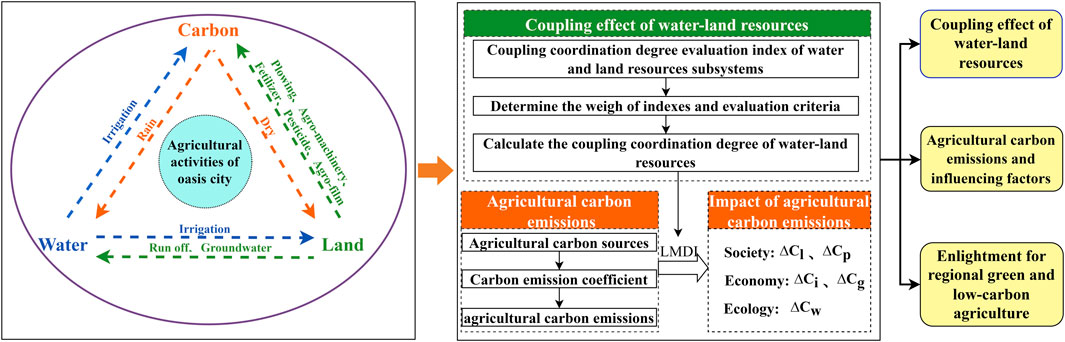
FIGURE 1. System framework for impact factors of agricultural carbon emissions combined water–land resource coupling in the arid inland region.
The Zhangye city (37°28′–39°57′N, 97°20′–102°12′E), with mountains to the north and south, long and narrow territory, high in the southeast and low in the northwest with the complex terrain, is situated in the central part of the Hexi Corridor in the arid region of northwest China (Figure 2). Zhangye resides in the continental arid climate with an annual evaporation of about 1,700 mm and uneven spatial distribution of annual precipitation. The average annual rainfall in the southern part of Zhangye city (Qilian Mountain) is 280 mm, while the crop area in the north is dry with little rainfall, about 90 mm. Zhangye city is one of the 12 key commercial grain bases of China, which consists of six counties (Ganzhou, Linze, Gaotai, Shandan, Minle, and Sunan) (Bai et al., 2021). Due to the shortage of water resources and harmful human activities, the region faced a series of ecological and environmental problems (Wang Q. et al., 2021). At the end of 2019, Zhangye city had a resident population of 1,237,600, and occupied a total area of 3.859 × 10⁴ km2, including 0.356 × 10⁴ km2 of arable land and 0.298 × 10⁴ km2 of cropland. The amount of fertilizer used in Zhangye was 8.62 × 10⁴ t and that of the agricultural film was 1.17 × 10⁴ t. The study of spatial–temporal patterns and influencing factors of agricultural carbon emissions based on water and land resource coupling in Zhangye can proffer us better understand the function of water–land resource utilization on carbon emissions in crop production (Xu et al., 2019), so as to promote the regional low-carbon content of agriculture development and proffer the theoretical support to realize the scientific and green development of agriculture in the arid area of northwest China.
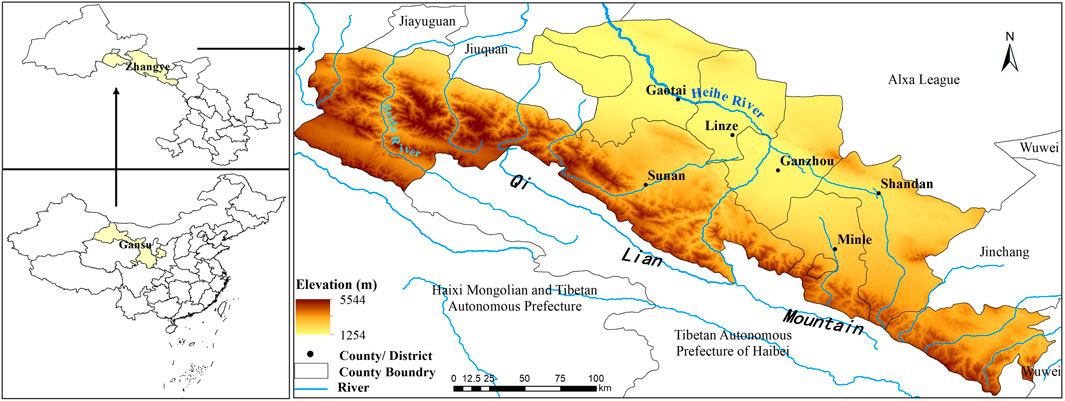
FIGURE 2. Geographical location of Zhangye city.
We deem that the agricultural carbon emissions are primarily caused by agricultural production activities, including fertilizer application, pesticide spraying, agricultural film mulching, agricultural irrigation, plowing, and agricultural machinery utilization. Then, we can use the following formula to calculate agricultural carbon emissions (Liu and Yang, 2021):
where Ctotal is the total agricultural carbon emissions (104 t); Eh, Ey, Em, Eg, Ef, and Ej are carbon emissions from fertilizer application, pesticide spraying, agricultural film mulching, agricultural irrigation, plowing, and agricultural machinery utilization, respectively (104 t); Gh is the net amount of agricultural fertilizer (t); Gy is the amount of pesticide application (t); Gm is the usage amount of agricultural plastic film (t); Ag is the effective irrigated area (hm2); Af is the crop sowing area (hm2); Wj is the aggregate capacity of agricultural machinery (kW); the carbon emission coefficients of each carbon source are denoted as A, B, C, D, E, and F, respectively, which are shown in Table 1 (Han et al., 2018; Liu and Yang, 2021).
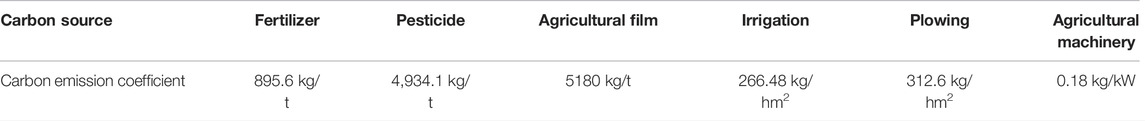
TABLE 1. Agricultural carbon emission sources and coefficient.
Carbon emission intensity measures the relationship between a region’s economy and its carbon emissions. If economic growth is accompanied by less carbon dioxide emissions, the region has achieved low-carbon development. Therefore, we define agricultural carbon emission intensity as the carbon emission triggered by per ten thousands CNY of agricultural gross output.
where Cintensity is the carbon emission intensity of agriculture (t/104 CNY), and G is the gross agricultural output.
The growth rate of Ctotal and Cintensity are defined as the ratio of the growth at the beginning and end to the development level in the base period.
Coupling degree is proposed to describe the strength of the synergy between the parameters in the development of the system. According to the principle of synergy theory, the key to the system’s order is the synergy between the subsystems, and the coupling degree is the measure of synergy (Qu et al., 2021). Coordination degree represents the magnitude of benign coupling in the coupling-interaction interrelationship, which can reflect the positive or negative status of coordination.
The development level and mutual influence of subsystems can be reflected by the coupling coordination degree (Wu et al., 2021). We constructed the WLCD model according to the water and land resource systems. The calculation formulas are shown as follows.
(1) Coupling degree:
(2) Coordination degree:
(3) Coupling coordination degree:
where C indicates the degree of coupling, U1 and U2 are the comprehensive index of land and water resource subsystems, representing the contribution of land resource and water resource subsystems to the total system orderliness, respectively, T is the regional water and land resource comprehensive coordination index, where α and β are the regional water and land resource subsystem contribution coefficients to be determined, reflecting the overall coordination effect. This study takes α = β = 0.5 (Dong et al., 2021), due to the equal importance of water and land resources, and D denotes the coupling coordination degree of each subsystem.
Presently, there are abundant studies on carbon emission influencing factors, among which the mainstream method is the combination of Kaya’s constant equation and the LMDI model (Li et al., 2018). In 1989, Yoichi Kaya first proposed the Kaya’s constant equation (Yoichi, 1989), which decomposes the total carbon emissions into the form of the product of four factors: carbon intensity, energy intensity, gross domestic product (GDP) per capita, and population. Based on the previous research experience on carbon emissions and their influencing factors (Zhao et al., 2018), we added ecological development factors into Kaya identity to build the influencing factor model of agricultural carbon emissions, as follows:
where C denotes agricultural carbon emissions (104 t), G denotes total agricultural added value (108 CNY), W denotes agricultural water consumption (108 m3), L denotes the arable land area (103 hm2), and P denotes year-end population (104 person).
Let
Recently, LMDI has been widely applied in the study of energy consumption and carbon emissions by domestic and foreign scholars (Hatzigeorgiou et al., 2008; Xin et al., 2021). In addition, LMDI is a complete decomposition method, which leaves no residuals (Zhao et al., 2022), and the logarithmic form also supports the conversion of multiplication and addition in the formula, which has great advantages compared with other methods. Therefore, we decomposed the five influencing factors of agricultural carbon emissions from base year (0) to target year (T) in Zhangye city using the LMDI decomposition model, and determined the contribution value of each factor. The decomposition formula could be expressed as follows:
where CT and C0 denote agricultural carbon emissions in the target year and base year, respectively, ∆C is the agricultural carbon emission variation between C0 and CT, ∆Ci and ∆Cg are economy factors, and denote the contribution of agricultural carbon emission intensity and economic output of agricultural water resources to ∆C, respectively. ∆Cw is the ecology factor, which denotes the contribution of water and land resource ratio to ∆C. ∆Cl and ∆Cp are societal factors, which denote the contribution of cropland area per capita and population to ∆C. ∆Crsd denotes the residual term after decomposition of the factors.
On the basis of LMDI decomposition model, the contribution of single factor to ∆C is derived.
The panel data of different counties in the land resource subsystem of Zhangye were used to calculate the WLCD, which included cropland area, total population, regional GDP, and other statistical data derived from the Statistical Yearbook. The data of the water resource subsystem (i.e., consumption of agricultural water, domestic water, and ecological water) were taken from the Water Resource Comprehensive Annual Report of the Zhangye Administration. Moreover, the statistical data which were used to calculate agricultural carbon emissions include six types in Eq. 1, such as fertilizer refraction, agricultural film usage, and crop sowing area, were obtained from the Statistical Yearbook.
Based on the consideration of representativeness, basicity, and accessibility, 19 evaluation indicators were screened according to the characteristics of water and land resources in Zhangye from 2012 to 2019 in terms of endowment and utilization, respectively, which constituted the coupled indicator system of water–land resources of Zhangye, as shown in Table 2. Each indicator was distributed into two categories. The positive indicators are greater than 0, the larger the better. The negative indicators are less than zero, the smaller the better. To avoid the influence of subjectivity on the weight calculation, the entropy value method was applied to calculate the corresponding weight values of 19 indicators.
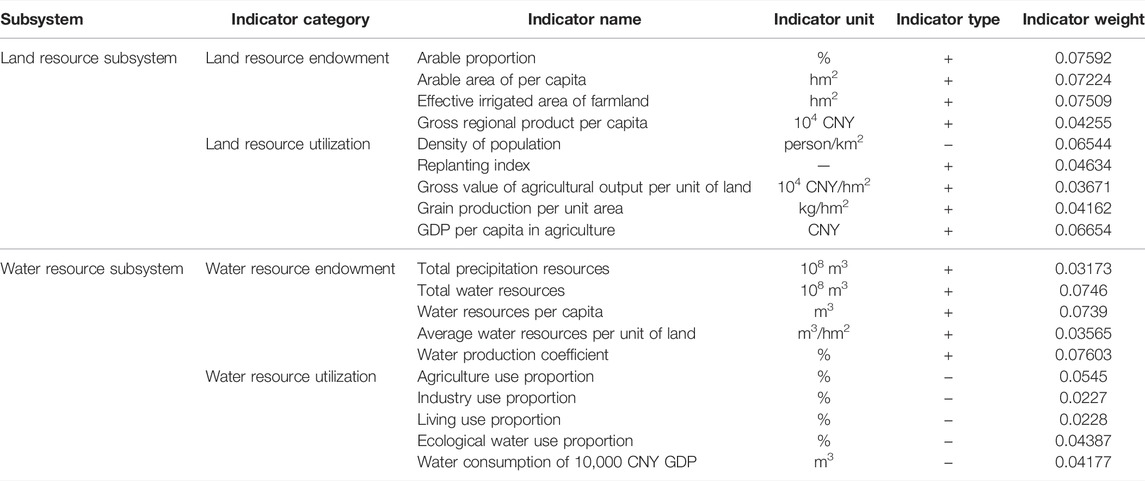
TABLE 2. Coupling coordination degree evaluation index system.
To reveal the coupled and coordinated development level between water and land resources, we classify WLCD according to the magnitude of coupled and coordinated degree. The degree of coupling coordination in the study area is divided into three major categories and 12 subcategories of dysfunctional, transitional, and coordinated (Wen et al., 2017), which are detailed in Table 3.
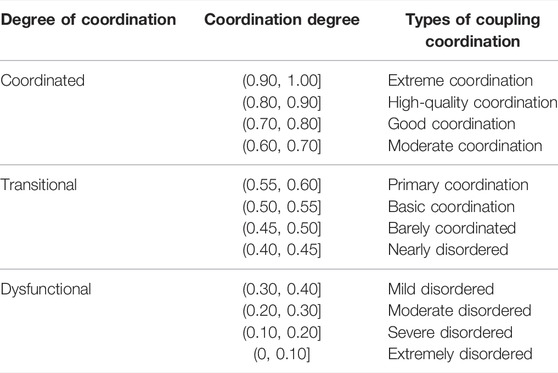
TABLE 3. Classification system and criteria for coupling evaluation of water–land resources.
The total agricultural carbon emissions of Zhangye increased first and then fluctuated with decreasing from 2012 to 2019 (Figure 3), among which it was the highest in 2015 (29.4 × 10⁴ t). From 2012 to 2015, the total agricultural carbon emissions of Zhangye increased by 1.257 × 10⁴ t, mainly coming from chemical fertilizer, accounting for 73% of the increase. Then, the agricultural carbon emissions fell to a minimum in 2018, with a growth rate of −2.13% from 2017 to 2018. From the perspective of agricultural carbon emission intensity, the overall trend was decreasing. The carbon emission triggered by each 10,000 CNY of gross agricultural output decreased from 0.222 t in 2012 to 0.153 t in 2018, a decrease of 31%, indicated that the development of agricultural production in Zhangye was becoming more and more low carbon. According to the composition of agricultural carbon emissions (Table 4), the agricultural carbon emissions of Zhangye mainly came from the four major aspects of fertilizer, plowing, agricultural film, and agricultural irrigation, which approximately account for 96% of the total value. Agricultural carbon emissions from irrigation and plowing showed a significant increase during 2012–2019, with growth rates of 24.01% and 15.01%, respectively. Generally, the agricultural carbon emissions resulted in the synergistic effect of multiple factors. Policies such as “zero” growth of agricultural fertilizers and pesticides would play a vital role in guiding agricultural carbon reduction.
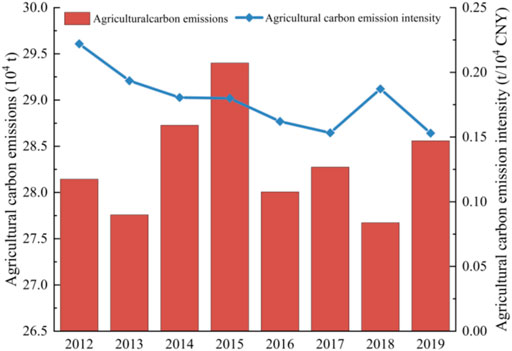
FIGURE 3. Variations and intensity of agricultural carbon emissions in Zhangye during 2012–2019.
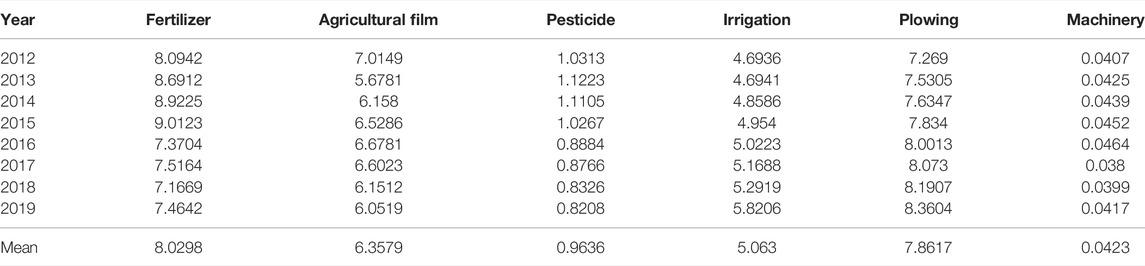
TABLE 4. Composition of agricultural carbon emissions in Zhangye during 2012–2019 (unit: 104 t).
From the changes of Ctotal in each county and district of Zhangye from 2012 to 2019 (Table 5), Ganzhou had the most agricultural carbon emissions, with a trend of fluctuation decline. Minle, Linze, Shandan, and Sunan showed a steady and slow growth trend in agricultural carbon emissions, while Gaotai reached the peak in 2015 and then declined year by year. Based on the average emissions of each carbon source in Zhangye, we analyzed the structure of agricultural carbon emissions of each county and district (Figure 4). The agricultural carbon emissions in Ganzhou were significantly higher than those in other counties, accounting for 35.4% of the Ctotal in Zhangye. In addition, the dosage of fertilizers, pesticides, agricultural films, and other production materials in Ganzhou was much higher than that in other counties, among which agricultural films accounted for the largest proportion of total emissions at 29%. The emissions in Minle were also high, accounting for 21.95% of the Ctotal in Zhangye, while the emissions source from fertilizer and plowing occupied 65% of the total emissions in Minle. The total emissions in Linze and Gaotai were similar, while Shandan was slightly lower, mainly because the use of agricultural films in Shandan was significantly less than that in Linze and Gaotai. The emissions in Sunan were much lower than those in other counties, where the main agricultural carbon source was plowing.
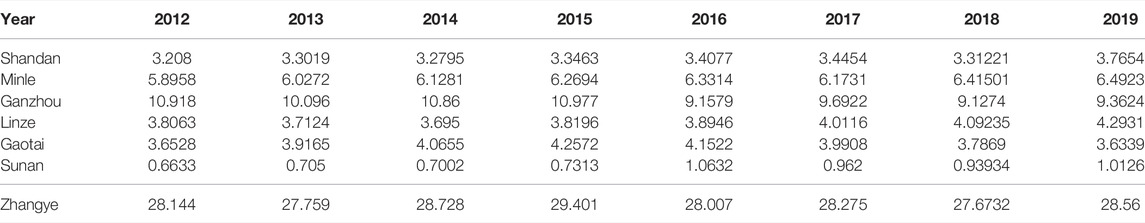
TABLE 5. Agricultural carbon emissions of counties in Zhangye from 2012 to 2019.
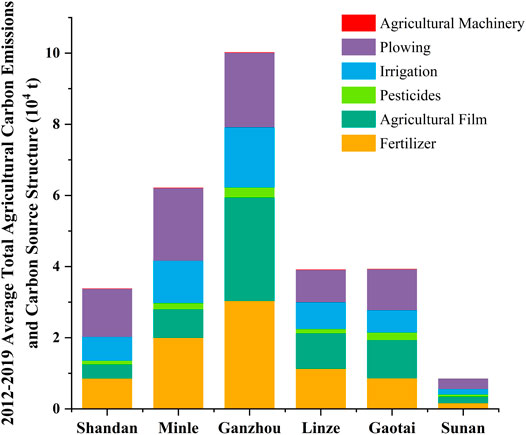
FIGURE 4. Total and structure of agricultural carbon emissions in counties and districts of Zhangye.
The WLCD of Zhangye showed an increasing trend from 2012 to 2019 (Table 6), which increased from 0.3715 in 2012 to 0.5399 in 2019, with an increase of 45.33%. The coupling coordination type converted from mild disordered to basic coordination, reflecting the effectiveness of water–land resource management in Zhangye. The contribution value of land resource subsystems, U1, showed a steady rising trend, while the comprehensive index of water resources U2 fluctuated between 0.2 and 0.3, indicating that the contribution of land resource to WLCD increased year by year. In addition, under the premise of a lower U2, the comprehensive index of land resources increased year by year, indicating that the utilization rate of water resources in Zhangye was getting much higher, thus promoting the utilization of land resource and improving the WLCD. In recent years, Zhangye has implemented the “Ecological Environmental Protection and Comprehensive Management Plan for Water Conservation Area of Qilian Mountain”, “the adjustment and optimization plan for ecological protection and restoration of mountains–rivers–forests–farmlands–lakes–grasslands in the Qilian Mountain and Heihe River Basin” as well as other policies for building a water-saving society, which have promoted the optimal allocation of water and land resources.
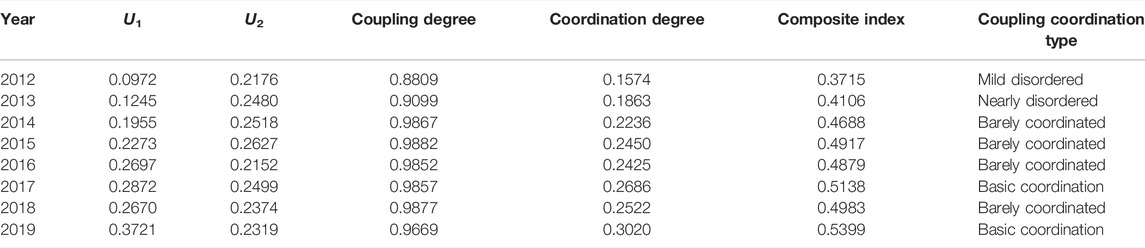
TABLE 6. Comprehensive coupling coordination index of water–land resources in Zhangye.
We divided the period 2012–2019 into four periods (2012–2013, 2014–2015, 2016–2017, and 2018–2019), and then evaluated the average value of WLCD in Zhangye for these four periods (Figure 5). It can be seen that the WLCD in Zhangye continued to rise but with large spatial differences. The WLCD of Ganzhou was the highest from 2012 to 2015. Generally speaking, the spatial distribution of WLCD is determined by water resources and land resources in counties. Ganzhou, the location of Zhangye Municipal Party Committee and Municipal Government, is the political, economic, and cultural center of Zhangye. With the increase of population and economic development, the exploitation intensity of water–land resources in Ganzhou became larger. The pressure on water–land resources was also increasing, resulting in the continuous growth of WLCD in Ganzhou. Sunan is located in the northern foot line of the Qilian Mountains, covered by vast grasslands and dense forests, owning Shiyang River, Heihe River, and Shule River in the territory, whose water resources and land resources are richer than other counties of Zhangye. With the help of mechanization and other modern technology, the WLCD of Sunan grew faster.
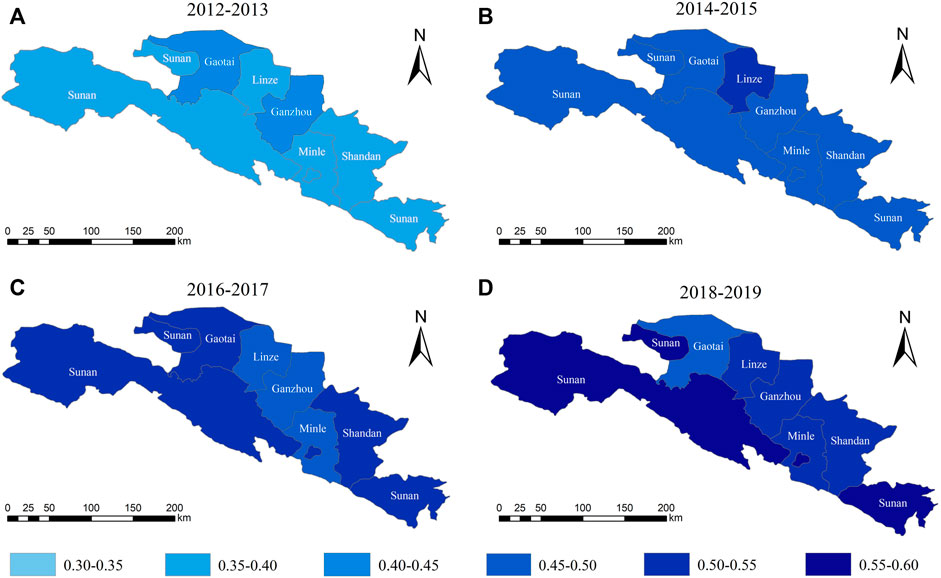
FIGURE 5. (A–D) represent different periods of 2012–2019, which divided in a two-year cycle. Spatial variation of WLCD in Zhangye in different years.
The agricultural carbon emissions in Zhangye were decomposed from five influencing factors (∆Ci, ∆Cg, ∆Cw, ∆Cl, and ∆Cp), which are demonstrated in Figure 6. In the calculation results, the change amount of carbon emission resulting from the change of each influencing factor is positive (negative), indicating the factor contributes (inhibits) to the growth of carbon emissions.
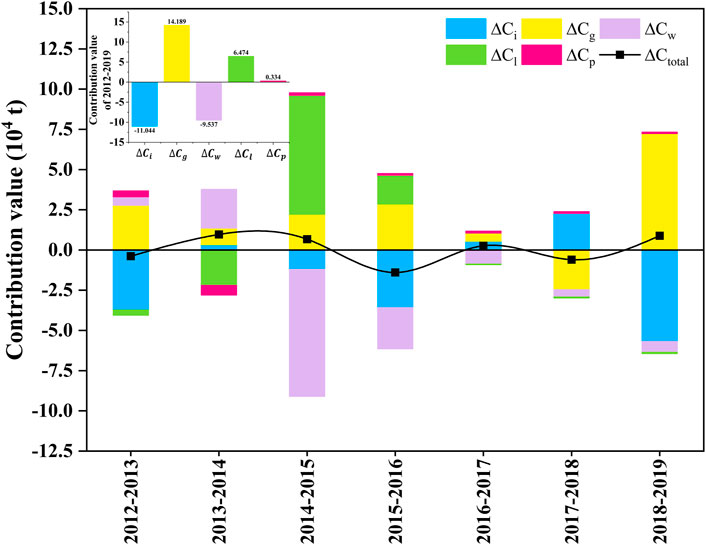
FIGURE 6. Contributions of influencing factors of agricultural carbon emissions in Zhangye during 2012–2019.
During 2012–2019, the contribution of each factor to ∆C was ranked as: ∆Cg > ∆Ci > ∆Cw > ∆Cl > ∆Cp. In those factors, the economic output of agricultural water resources, cropland area per capita, and population contributed positively to ∆C, while the contribution of agricultural water consumption per unit of arable land area and the agricultural carbon emissions intensity inhibited ∆C.
The characteristics of influencing factors of agricultural carbon emission were quite different in Zhangye. With the requirements of decarbonization for social and economic development, ∆Ci, which reflects the relationship between agricultural carbon emissions and agricultural economy, was an inhibited factor of ∆C. ∆Cg showed a promotional role on ∆C in Zhangye. As the agricultural GDP showed an increasing trend, while the agricultural water consumption showed a continuous decline from 2012 to 2019, which means that the reform of the management system and the optimization of farming practices had improved the efficiency of water utilization but also caused extra energy consumption, which in turn generates more carbon emissions.
From 2012 to 2019, ∆Cl played a facilitating role on ∆C in Zhangye, mainly reflected in 2014–2016, while inhibited ∆C in other years. ∆Cw showed a suppressive effect in general, but a facilitating effect in 2012–2014. From 2012 to 2014, the average water–land resource coupling coordination was only 0.42, showing a state of nearly disordered. Because of the poor matching of water–land resources, excessive energy consumption was generated contributing to the agricultural carbon emissions. From 2014 to 2019, the average water and land resource coupling coordination increased to 0.50, showing a basic coordination state. As an arid inland region, water resources in Zhangye are the main limiting factor for social development. Therefore, with the improvement of water resource development and utilization level, the WLCD was better, which would reduce excess energy consumption and decrease the energy input by higher agricultural energy efficiency. The coupled coordination situation of water–land resources was inclining to be better, indicating that the water–land resource matching degree became better, which was beneficial to curb agricultural carbon emissions.
However, the influencing factors of agricultural carbon emissions distributed differently in Zhangye (Figure 7). First, the ∆Ci of all counties were negative from 2012 to 2019 in Zhangye, indicating that the carbon emission intensity of each county showed a downward trend with the rising of total agricultural carbon emissions. Moreover, the suppression degree of agricultural carbon emission intensity of each county had spatial differences. Generally, Ganzhou was the highest (−4.47 × 10⁴ t), while Sunan and Gaotai were lower at −0.95 × 10⁴ t and −0.27 × 10⁴ t, respectively. Second, ∆Cg was the supreme factor for ∆C. Of all counties in Zhangye, Ganzhou’s contributing value was the highest (4.59 × 10⁴ t), and Sunan was the lowest (0.42 × 10⁴ t). Third, the water and land resources vary greatly as Zhangye is located in the oasis of the arid inland river basin, so that the water and land resources ratio of each county in Zhangye had a large difference. In most cases, the ∆Cw in most counties of Zhangye was shown as an inhibitory factor, with that of Ganzhou was the highest (−3.59 × 10⁴ t), and that of Gaotai next (−3.10 × 10⁴ t). However, the ∆Cw of Sunan had a slightly promoting effect on agricultural carbon emissions (0.015 × 10⁴ t). Fourth, the ∆Cl of all counties was shown as a positive effect. Also, the extent of positive effect was relatively similar, lying between 0.02 × 10⁴ t and 1.74 × 10⁴ t with the contributing value of Ganzhou being the highest (1.74 × 10⁴ t) and that of Sunan being the lowest (0.02 × 10⁴ t). Finally, the ∆Cp varied widely across counties in Zhangye, which was a contributing factor in most counties except Linze.
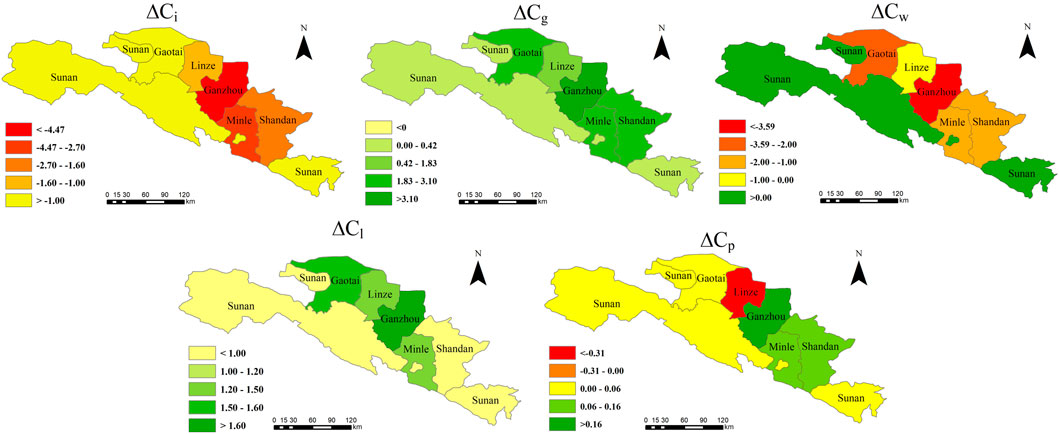
FIGURE 7. Spatial distribution of the contribution values of agricultural carbon emission influencing factors in Zhangye during 2012–2019.
One of the matching measurements of water and land resources in traditional agriculture is the ratio of agricultural water consumption and arable land area (Zhao et al., 2018). However, this method is greatly influenced by regional differences and has few evaluation factors, so it is difficult to make an objective evaluation of the interaction relationship between water and land resources. On the contrary, the coupling coordination degree model establishes the index evaluation system from both utilization and endowment, and integrates multiple factors to evaluate the degree of water and land coupling, which can objectively reflect the coupling coordination level of water and land resources and the possible causes of conflicts (Shi et al., 2020; Wu et al., 2021).
From a temporal perspective, the WLCD of Zhangye showed an upward trend during 2012–2019, which principally benefited from government policy support and socio-economic progress. For the past few years, the central government put forward the concept of “building a resource-saving and environment-friendly society,” “developing high-quality agriculture,” and “water-saving irrigation”. Under this background, Zhangye has reduced agricultural water consumption and increased the agricultural output, which indicated that the reform of farmland management and the changes in farming methods have promoted the water resource utilization efficiency and optimized the spatial layout of water and land resources. From the spatial scale, the coupling coordination of water and land resources in Sunan increased rapidly, slightly higher than those of other counties. The main reason was that Zhangye is an oasis city where water resources are still the main limiting factor of social development and farming, while Sunan is located in the mountainous region, with relatively abundant water resources. The rest counties were constrained by water resources, so they had a slightly lower matching index of water and land resources.
The Chinese government has set a clear goal of achieving “carbon peak” by 2030 and “carbon neutrality” by 2060, requiring industries to explore the ways to reduce carbon emissions. China is a large agricultural producer, and carbon emissions of the agricultural production system are also a vital part that cannot be ignored. At present, agricultural carbon emissions mainly include two parts: planting and livestock. Due to the difficulty of data acquisition, we only considered the carbon emissions generated by planting (including chemical fertilizers, pesticides, agricultural film, irrigation, agricultural plowing, and agricultural machinery), neglecting the carbon emissions from livestock and crop growth.
Oasis, as the gathering areas of agricultural production activities in arid regions, is the key area worthy of attention for agricultural carbon emissions, while agricultural activities in an oasis are mainly restricted by water and land resources. To reduce the agricultural carbon emissions of oasis, the feedback influence of water and land resources must be taken into account, with the relationship of agricultural carbon emissions and water–land resources as the entry point, and take appropriate measures according to local conditions. For example, in the Ganzhou district, where agricultural carbon emissions are large, we can reduce carbon emissions by increasing the intensity of agricultural carbon emissions and the coupling coordination degree of water and land elements. Specific measures can be taken, but not limited to water and energy-saving irrigation methods such as sprinkler, drip irrigation, and self-pressure irrigation which can be adopted to reduce agricultural water and energy consumption without the reducing agricultural output (Wang X. et al., 2021). Organic manure can be used to take place of chemical fertilizers, and new agricultural films can be used to replace ordinary agricultural films, and encourage mechanized agriculture transfer to green, sustainable, and modern agriculture (Sharma et al., 2021).
The main affecting factors of agricultural carbon emissions are economic factors and natural factors, among which economic factors are closely related to national and regional development. It is difficult to regulate economic factors while maintaining regional development. Zhangye is an oasis city in the arid inland river basin of northwest China. The natural factors are mainly water and land resources, so the combination of water and land resources directly affects the quality of agricultural production (Li et al., 2019; Deng et al., 2021). Therefore, this study integrates societal, economic, and ecological factors using the LMDI model, which is widely applied to the decomposition of CO2 emission influencing factors, to measure the main influencing factors of agricultural carbon emissions in Gansu Province (Xin et al., 2021). Some researchers believe that agricultural water utilization per unit of arable land area is a contributing factor to agricultural carbon emissions, which means that the more the agricultural water utilization per unit of arable land area, the better the development of agricultural production, and the higher the agricultural carbon emissions (Zhao et al., 2018; Deng et al., 2021). However, this conclusion is mainly applicable to the provincial stage at the national level. From the actual data, it is concluded that the agricultural water consumption per unit of arable land area in Zhangye has a suppressive effect on agricultural carbon emissions.
In the estimation of agricultural carbon emissions in this study, only the carbon emissions from the agricultural production process are considered, neglecting the carbon emissions generated by livestock and field crop growth. In addition, the analysis of water and land resource coupling takes the whole oasis as the study area, but the actual unit of “water” is “irrigation area” in an arid oasis (Wang and Gao, 2014; Jia, 2017). Taking the “irrigation area” as the study unit of water and land resource coupling will be more representative and scientific, which is the direction we need to strengthen in the future. The study of the coupling of water and land elements also only considered the coupling of water and land resources under socio-economic conditions. However, water and land resource coupling should be a combination of socio-economic and natural states of water and land resources, including land use types, soil quality, rainfall, evaporation, and other natural conditions. In addition, according to research, water and land resources have a strong inhibiting effect on agricultural carbon emissions. Compared with socio-economic and arable land areas, which are difficult to regulate, regulating and optimizing the development and utilization of water and land resources is a more ideal mean to reduce emissions.
In the future, we need to collect much more data to improve the calculation of agricultural carbon emissions. It is necessary to strengthen the research on the coordination mechanism of water and land resource coupling based on the hydrological conditions as the basis for improving the interaction of water, land, and carbon elements. In addition, it is necessary to strengthen the research on the influencing factors and mechanism of coupling state of water and land resources, so as to deploy the main elements of water and land resources more scientifically, gradually realize the efficient allocation of water and soil resources, and achieve the goal of scientific and efficient emission reduction, which will provide technical and theoretical support for scientific and efficient sustainable development of oases in arid inland river basins.
In this study, we first constructed a research framework combining water and land resources with agricultural carbon emissions to assess the linkage of water–land–agricultural carbon emissions in arid inland regions, and took Zhangye in northwest China as an example to verify the applicability. Then, the agricultural carbon emission measurement model and WLCD were used for exploring the spatial and temporal patterns of water and land elements and agricultural carbon emissions. Finally, we discussed the interaction between societal factors (∆Cl and ∆Cp), economic factors (∆Ci and ∆Cg), and ecological factors (∆Cw) on agricultural carbon emissions by LMDI. This study can help in bringing thought and insights for future management of water–land resources and efficient low-carbon development of agriculture in arid inland regions. The following main conclusions are drawn:
1) The agricultural carbon emissions in Zhangye peaked in 2015 and fell to the minimum in 2018, with an overall trend of rising and then fluctuating down. The agricultural carbon emissions in Zhangye mainly come from four sources: fertilizer, plowing, agricultural film, and agricultural irrigation, which approximately account for 96% of the total agricultural carbon emissions. There are significant differences in agricultural carbon emissions among the counties in Zhangye, with Ganzhou and Minle having more agricultural carbon emissions, accounting for 57.35% of the total emissions of Zhangye, which is the district and county that needs to focus on reducing agricultural carbon emissions.
2) The coupled water–land resource coordination index of Zhangye increased from 0.3715 in 2012 to 0.5399 in 2019, with an increase of 45.33%, showing an upward trend from mild disordered to basic coordination. The WLCD in all counties of Zhangye has increased, with the highest in Ganzhou from 2012 to 2015 and Sunan from 2016 to 2019. After analysis, the coupling index of water–land resources is influenced by the differences under natural conditions and the efficiency of water and land resources exploitation.
3) The economic output of agricultural water resources, cropland area per capita, and population contributed to agricultural carbon emissions in Zhangye, while the ratio of water and land resources and agricultural carbon emission intensity inhibited agricultural carbon emissions. Among them, the growth of coupled water and land resource coordination could effectively reduce the agricultural carbon emissions in the arid inland region.
The raw data supporting the conclusion of this article will be made available by the authors, without undue reservation.
LW: conceptualization, formal analysis, methodology, and writing—original draft. RZ and ZY: conceptualization, methodology, designing, supervision, project administration, and writing—review and editing. ZC: methodology, validation, and writing—review and editing. RL and CF: data curation. All authors discussed the results and conclusion.
This work was supported by the National Natural Science Foundation of China (42161018), Youth Innovation Promotion Association CAS, National Key R&D Program of China (2018YFD1100102), and Science and Technology Project of Gansu Province (21ZD4NF044-02).
The authors declare that the research was conducted in the absence of any commercial or financial relationships that could be construed as a potential conflict of interest.
All claims expressed in this article are solely those of the authors and do not necessarily represent those of their affiliated organizations, or those of the publisher, the editors, and the reviewers. Any product that may be evaluated in this article, or claim that may be made by its manufacturer, is not guaranteed or endorsed by the publisher.
The authors would like to thank the editors and reviewers for their detailed and constructive comments, which helped to significantly improve the manuscript.
Amin, M. N., Hossain, M. S., Lobry de Bruyn, L., and Wilson, B. (2020). A Systematic Review of Soil Carbon Management in Australia and the Need for a Social-Ecological Systems Framework. Sci. Total Environ. 719, 135182. doi:10.1016/j.scitotenv.2019.135182
Bahman, M., Mohammad, H. N., Fereydoun, G., and Sepehr, D. (2018). Assessing the Impacts of Climate Change on the Quantity and Quality of Agricultural Runoff (Case Study: Golgol River Basin). Irrig. Drain. 67, 17–28. doi:10.1002/ird.2211
Bai, Y., Zhao, Z., Weng, C., Wang, W., and Hu, Y. (2021). Scenario-Based Analysis of Land Use Competition and Sustainable Land Development in Zhangye of the Heihe River Basin, China. Ijerph 18 (19), 10501. doi:10.3390/ijerph181910501
Burney, J. A., Davis, S. J., and Lobell, D. B. (2010). Greenhouse Gas Mitigation by Agricultural Intensification. Proc. Natl. Acad. Sci. U.S.A. 107, 12052–12057. doi:10.1073/pnas.0914216107
Chacko, S., Ravichandran, C., Vairavel, S. M., and Mathew, J. (2019). Employing Measurers of Spatial Distribution of Carbon Storage in Periyar Tiger Reserve, Southern Western Ghats, India. J. Geovis. Spat. Anal. 3, 1. doi:10.1007/s41651-018-0024-8
Chen, B., Han, M. Y., Peng, K., Zhou, S. L., Shao, L., Wu, X. F., et al. (2018). Global Land-Water Nexus: Agricultural Land and Freshwater Use Embodied in Worldwide Supply Chains. Sci. Total Environ. 613-614, 931–943. doi:10.1016/j.scitotenv.2017.09.138
Chen, B., Xu, C., Wu, Y., Li, Z., Song, M., and Shen, Z. (2022). Spatiotemporal Carbon Emissions across the Spectrum of Chinese Cities: Insights from Socioeconomic Characteristics and Ecological Capacity. J. Environ. Manag. 306, 114510. doi:10.1016/j.jenvman.2022.114510
Dace, E., and Blumberga, D. (2016). How Do 28 European Union Member States Perform in Agricultural Greenhouse Gas Emissions? it Depends on what We Look at: Application of the Multi-Criteria Analysis. Ecol. Indic. 71, 352–358. doi:10.1016/j.ecolind.2016.07.016
Deng, C., Li, R., Xie, B., Wan, Y., Li, Z., and Liu, C. (2021). Impacts of the Integrated Pattern of Water and Land Resources Use on Agricultural Greenhouse Gas Emissions in China during 2006-2017: A Water-Land-Energy-Emissions Nexus Analysis. J. Clean. Prod. 308, 127221. doi:10.1016/j.jclepro.2021.127221
Dong, G., Ge, Y., Zhu, W., Qu, Y., and Zhang, W. (2021). Coupling Coordination and Spatiotemporal Dynamic Evolution between Green Urbanization and Green Finance: A Case Study in China. Front. Environ. Sci. 8, 621846. doi:10.3389/fenvs.2020.621846
Duan, Z., Wang, X. e., Dong, X., Duan, H., and Song, J. (2020). Peaking Industrial Energy-Related CO2 Emissions in Typical Transformation Region: Paths and Mechanism. Sustainability 12 (03), 791. doi:10.3390/su12030791
Dyer, J. A., Kulshershtha, S. N., Mcconkey, B. G., and Desjardins, R. L. (2010). An Assessment of Fossil Fuel Energy Use and CO2 Emissions from Farm Field Operations Using a Regional Level Crop and Land Use Database for Canada. Energy 35 (05), 2261–2269. doi:10.1016/j.energy.2010.02.013
Fatiha, C., Damien, R., Mustapha, N., Mohamed, C., João, P. N., Frédéric, H., et al. (2020). Distinct and Combined Impacts of Climate and Land Use Scenarios on Water Availability and Sediment Loads for a Water Supply Reservoir in Northern Morocco. Int. Soil Water Conse. 8 (02), 141–153. doi:10.1016/j.iswcr.2020.03.003
Ghimire, U., Shrestha, S., Neupane, S., Mohanasundaram, S., and Lorphensri, O. (2021). Climate and Land-Use Change Impacts on Spatiotemporal Variations in Groundwater Recharge: A Case Study of the Bangkok Area, Thailand. Sci. Total Environ. 792, 148370. doi:10.1016/j.scitotenv.2021.148370
Han, H. B., Zhong, Z. Q., Guo, Y., Xi, F., and Liu, S. L. (2018). Coupling and Decoupling Effects of Agricultural Carbon Emissions in China and Their Driving Factors. Environ. Sci. Pollut. Res. Int. 25 (25), 25280–25293. doi:10.1007/s11356-018-2589-7
Hatzigeorgiou, E., Polatidis, H., and Haralambopoulos, D. (2008). CO2 Emissions in Greece for 1990–2002: A Decomposition Analysis and Comparison of Results Using the Arithmetic Mean Divisia Index and Logarithmic Mean Divisia Index Technique. Energy 33 (03), 492–499. doi:10.1016/j.energy.2007.09.014
Ibarrola-Rivas, M. J., Granados-Ramírez, R., and Nonhebel, S. (2017). Is the Available Cropland and Water Enough for Food Demand? A Global Perspective of the Land-Water-Food Nexus. Adv. Water Resour. 110, 476–483. doi:10.1016/j.advwatres.2017.09.018
IPCC (2014). “Team, Core Writing,” in Climate Change2014: Synthesis Report. Contribution of Working Groups I, II and III to the Fifth Assessment Report of the Intergovernmental Panel on Climate Change. Editors R.K. Pachauri, and L.A. Meyer (Geneva, Switzerland: IPCC), 151pp.
Jia, Y. X. (2017). Research Carbon Emission and the Emission Reduction Policy of Land Use Based in Zhangye Irrigation. China: Northwest Normal University. (in Chinese).
Jiang, Q. X., Zhou, Z. M., Wang, Z. L., Fu, Q., Wang, T., and Zhao, Y. Z. (2017). Risk Assessment and Optimization of Water Resources Shortage Based on Water and Land Resources Coupling. Trans. Chin. Soc. Agric. Eng. 33 (12), 136–143. (in Chinese). doi:10.11975/j.issn.1002-6819.2017.12.018
Johnson, J. M., Franzluebbers, A. J., Weyers, S. L., and Reicosky, D. C. (2007). Agricultural Opportunities to Mitigate Greenhouse Gas Emissions. Environ. Pollut. 150 (01), 107–124. doi:10.1016/j.envpol.2007.06.030
Li, H., Li, M., Fu, Q., Cao, K., Liu, D., and Li, T. (2022). Optimization of Biochar Systems in the Water-Food-Energy-Carbon Nexus for Sustainable Circular Agriculture. J. Clean. Prod. 355, 131791. doi:10.1016/j.jclepro.2022.131791
Li, H., Zhou, W. B., Zhuang, Y., Ma, C., and Liu, B. Y. (2016). Agricultural Water and Soil Resources Matching Patterns and Carrying Capacity in Yan’an City. Trans. Chin. Soc. Agric. Eng. 32 (05), 156–162. (in Chinese). doi:10.11975/j.issn.1002-6819.2016.05.022
Li, J. X., Chen, Y. N., Li, Z., and Liu, Z. H. (2018). Quantitative Analysis of the Impact Factors of Conventional Energy Carbon Emissions in Kazakhstan Based on LMDI Decomposition and STIRPAT Model. J. Geogr. Sci. 28 (07), 1001–1019. doi:10.1007/s11442-018-1518-5
Li, M., Li, J., Singh, V. P., Fu, Q., Liu, D., and Yang, G. (2019). Efficient Allocation of Agricultural Land and Water Resources for Soil Environment Protection Using a Mixed Optimization-Simulation Approach under Uncertainty. Geoderma 353, 55–69. doi:10.1016/j.geoderma.2019.06.023
Liu, D., Liu, C., Fu, Q., Li, M., Faiz, M. A., Khan, M. I., et al. (2018). Construction and Application of a Refined Index for Measuring the Regional Matching Characteristics between Water and Land Resources. Ecol. Indic. 91, 203–211. doi:10.1016/j.ecolind.2018.04.011
Liu, M., and Yang, L. (2021). Spatial Pattern of China's Agricultural Carbon Emission Performance. Ecol. Indic. 133, 108345. doi:10.1016/j.ecolind.2021.108345
Liu, Y. S., Gan, H., and Zhang, F. G. (2006). Analysis of the Matching Patterns of Land and Water Resources in Northeast China. Acta Geogr. Sin. 61 (08), 847–854. (in Chinese).
Lu, W. N., Liu, W. X., Hong, M. Y., Deng, Y. J., Deng, Y., Zhou, B. Y., et al. (2021). Spatial-Temporal Evolution Characteristics and Influencing Factors of Agricultural Water Use Efficiency in Northwest China--Based on a Super-DEA Model and a Spatial Panel Econometric Model. Water 13 (05), 632. doi:10.3390/w13050632
Mohanad, I., Fathi, S., and Mohamed, A. B. (2018). Agricultural Technologies and Carbon Emissions: Evidence from Jordanian Economy. Environ. Sci. Pollut. Res. 25, 10867–10877. doi:10.1007/s11356-018-1327-5
Pang, J., Li, H., Lu, C., Lu, C., and Chen, X. (2020). Regional Differences and Dynamic Evolution of Carbon Emission Intensity of Agriculture Production in China. Ijerph 17 (20), 7541. doi:10.3390/ijerph17207541
Qu, L. L., Wang, Y. S., Liu, Y. S., and Ma, Q. (2021). Evaluation of Water and Land Resources System Bearing Capacity and Path Optimization for Rural Revitalization. J. Nat. Res. 36 (02), 300–314. (in Chinese). doi:10.31497/zrzyxb.20210203
Ren, D., Yang, Y., Yang, Y., Richards, K., and Zhou, X. (2018). Land-Water-Food Nexus and Indications of Crop Adjustment for Water Shortage Solution. Sci. Total Environ. 626, 11–21. doi:10.1016/j.scitotenv.2018.01.071
Robin, R. W., and Mary, B. H. (2017). Nutritional and Greenhouse Gas Impacts of Removing Animals from US Agriculture. PNAS 114 (48), E10301–E10308. doi:10.1073/pnas.1707322114
Sharma, G. D., Shah, M. I., Shahzad, U., Jain, M., and Chopra, R. (2021). Exploring the Nexus between Agriculture and Greenhouse Gas Emissions in BIMSTEC Region: The Role of Renewable Energy and Human Capital as Moderators. J. Environ. Manag. 297, 113316. doi:10.1016/j.jenvman.2021.113316
Shi, T. S., Yang, S. Y., Zhang, W., and Zhou, Q. (2020). Coupling Coordination Degree Measurement and Spatiotemporal Heterogeneity between Economic Development and Ecological Environment----Empirical Evidence From Tropical and Subtropical Regions of China. J. Clean. Prod. 244 (C), 118739. doi:10.1016/j.jclepro.2019.118739
Vitor, J. P. D. M. (2020). Efficient Water Management: an Analysis for the Agricultural Sector. Water Policy 22 (03), 396–416. doi:10.2166/wp.2020.191
Wang, L. C., and Gao, J. (2014). Spatial Coupling Relationship between Settlement and Land and Water Resources Based on Irrigation Scale – A Case Study of Zhangye City. J. Nat. Resour. 29 (11), 1888–1909. (in Chinese). doi:10.11849/zrzyxb.2014.11.008
Wang, Q., Guan, Q., Lin, J., Luo, H., Tan, Z., and Ma, Y. (2021a). Simulating Land Use/land Cover Change in an Arid Region with the Coupling Models. Ecol. Indic. 122, 107231. doi:10.1016/j.ecolind.2020.107231
Wang, X., Li, Y., Wang, X., Li, Y., Lian, J., and Gong, X. (2021b). Temporal and Spatial Variations in NDVI and Analysis of the Driving Factors in the Desertified Areas of Northern China from 1998 to 2015. Front. Environ. Sci. 9, 633020. doi:10.3389/fenvs.2021.633020
Wei, J., Zhao, K., Zhang, L., Yang, R., and Wang, M. (2021). Exploring Development and Evolutionary Trends in Carbon Offset Research: a Bibliometric Perspective. Environ. Sci. Pollut. Res. 28 (15), 18850–18869. doi:10.1007/s11356-021-12908-8
Wen, Q., Meng, T. X., Fan, H. P., and Yun, Y. H. (2017). Coupling Effect and Spatiotemporal Differentiation between Water-Land Resource and Economic Development in Henan Province. Res. Soil Water Conse 24 (03), 234–240. doi:10.13869/j.cnki.rswc.2017.03.041 (in Chinese)
Woomer, P. L., and Tieszen, L. L. (2004). Land Use Change and Terrestrial Carbon Stocks in Senegal. J. Arid. Environ. 59 (03), 625–642. doi:10.1016/j.jaridenv.2004.03.025
Wu, F., Zhou, P., and Zhou, D. Q. (2020). Modeling Carbon Emission Performance under a New Joint Production Technology with Energy Input. Energy Econ. 92, 104963. doi:10.1016/j.eneco.2020.104963
Wu, H., Guo, S. S., Guo, P., Shan, B. Y., and Zhang, Y. (2021). Agricultural Water and Land Resources Allocation Considering Carbon Sink/source and Water Scarcity/degradation Footprint. Sci. Total. Environ. 819, 152058. doi:10.1016/j.scitotenv.2021.152058
Xin, L., Jia, J., Hu, W., Zeng, H., Chen, C., and Wu, B. (2021). Decomposition and Decoupling Analysis of CO2 Emissions Based on LMDI and Two-Dimensional Decoupling Model in Gansu Province, China. Ijerph 18 (11), 6013. doi:10.3390/ijerph18116013
Xiong, C., Wang, G., and Xu, L. (2021). Spatial Differentiation Identification of Influencing Factors of Agricultural Carbon Productivity at City Level in Taihu Lake Basin, China. Sci. Total Environ. 800, 149610. doi:10.1016/j.scitotenv.2021.149610
Xu, E., Wang, R., Zhang, H., and Yu, Z. (2019). Coupling Index of Water Consumption and Soil Fertility Correlated with Winter Wheat Production in North China Region. Ecol. Indic. 102, 154–165. doi:10.1016/j.ecolind.2019.02.045
Yoichi, K. (1989). “Impact of Carbon Dioxide Emission on GNP Growth: Interpretation of Proposed Scenarios. Presentation to the Energy and Industry Subgroup,” in Response Strategies Working Group (Paris: IPCC).
Yu, L., Liu, S., Wang, F., Liu, Y., Li, M., Wang, Q., et al. (2022). Effects of Agricultural Activities on Energy-Carbon-Water Nexus of the Qinghai-Tibet Plateau. J. Clean. Prod. 331, 129995. doi:10.1016/j.jclepro.2021.129995
Zhao, R., Liu, Y., Tian, M., Ding, M., Cao, L., Zhang, Z., et al. (2018). Impacts of Water and Land Resources Exploitation on Agricultural Carbon Emissions: The Water-Land-Energy-Carbon Nexus. Land Use Policy 72, 480–492. doi:10.1016/j.landusepol.2017.12.029
Keywords: agricultural carbon emissions, coupling effect, logarithmic mean divisia index, water and land resources, arid inland region
Citation: Wang L, Zhu R, Yin Z, Chen Z, Lu R and Fang C (2022) Quantifying the Spatial–Temporal Patterns and Influencing Factors of Agricultural Carbon Emissions Based on the Coupling Effect of Water–Land Resources in Arid Inland Regions. Front. Environ. Sci. 10:908987. doi: 10.3389/fenvs.2022.908987
Received: 31 March 2022; Accepted: 22 April 2022;
Published: 08 June 2022.
Edited by:
Hongbo Ling, Xinjiang Institute of Ecology and Geography (CAS), ChinaCopyright © 2022 Wang, Zhu, Yin, Chen, Lu and Fang. This is an open-access article distributed under the terms of the Creative Commons Attribution License (CC BY). The use, distribution or reproduction in other forums is permitted, provided the original author(s) and the copyright owner(s) are credited and that the original publication in this journal is cited, in accordance with accepted academic practice. No use, distribution or reproduction is permitted which does not comply with these terms.
*Correspondence: Rui Zhu, emh1ckBtYWlsLmx6anR1LmNu; Zhenliang Yin, eWluemhlbmxpYW5nQGx6Yi5hYy5jbg==
Disclaimer: All claims expressed in this article are solely those of the authors and do not necessarily represent those of their affiliated organizations, or those of the publisher, the editors and the reviewers. Any product that may be evaluated in this article or claim that may be made by its manufacturer is not guaranteed or endorsed by the publisher.
Research integrity at Frontiers
Learn more about the work of our research integrity team to safeguard the quality of each article we publish.