 Hui Yu1†
 Min Huang1,2
 Tao Zhao3*Jianping Wang4*Zihan Li5†
 Dianpeng Chen5Pengshan Li6*Yong Luo5*Haoyu Wang5Zhao Jing5Dongyang Mou5Dan Zhang1,2Xiao Wang7
- 1Institute of Mountain Hazards and Environment, Chinese Academy of Sciences, Chengdu, China
- 2University of Chinese Academy of Sciences, Beijing, China
- 3Sichuan Land Consolidation and Rehabilitation Center, Chengdu, China
- 4Qinghai Institute of Salt Lakes, Chinese Academy of Sciences, Xining, China
- 5College of Earth Sciences, Chengdu University of Technology, Chengdu, China
- 6Chengdu Land Consolidation and Ecological Rehabilitation Center, Chengdu, China
- 7China Southwest Geotechnical Investigation and Design Institute Co.,Ltd, Shanghai, China
The Qaidam Basin has an arid plateau continental climate, with climatic factors strongly influencing agricultural production potential. In the present study, the agro-ecological zone method was applied to study the effects of rainfall, temperature and soil on crop yield, with climatic factors as the main common influencer. By assessing the land production potential, suitable zones for grain production were identified in the Qaidam Basin, and the reasonable current input level was determined, thus, evaluating the population carrying capacity. Strategies for improving crop productivity in these regions were proposed to provide a basis for decision-making by the local government. The results showed that: 1) The photosynthetic and light-temperature production potential was high in Mangya city and the autonomous region; however, the climate production potential was low in Golmud city and the eastern part of Mangya city. After correction based on soil availability, the land production potentials of spring wheat and highland barley were greatly attenuated, and only 15.85 and 16.74% of the photosynthetic production potential, respectively. 2) The current population carrying capacity of the land resources is 595,900 people, which is in a state of human–food balance when the correction coefficient of artificial input is approximately 1.1. If the artificial input can be strengthened to achieve a correction coefficient of 1.2, the population carrying capacity could reach 676,100 people. 3) The suitable area for agricultural production was mainly located in the northeast and west of the Qaidam Basin. These areas can be used as a backup arable land resource. The temperature increase leading to evaporation increase negatively affected the yield per unit area of grain crops in Qaidam Basin. Strengthening water-saving irrigation technology and improving the utilisation rate of chemical fertilisers are good enhancement strategies for the green-oriented agricultural technology system, which would help improve the agricultural productivity potential in the Qaidam Basin.
Introduction
China is a populous country with a per capita land area lower than the world average. It is currently facing severe problems such as high population growth, a sharp decline in arable land area and scarcity of fresh water resources (Yang and Wang, 2015). Food security is an important foundation for economic development, social stability and national security. Over the past 40 years, climate change has had very different impacts on the northern and southern wheat-producing regions of China. Low-temperature frost damage inhibits the increase in wheat yield during winter in the northern wheat region, and climate warming causes a decline in the potential wheat yield in southern China (Zhang et al., 2015). Due to global warming, the potential yield of rice in most regions of China has demonstrated a decreasing trend, and the rice-growing area has shifted northward (Yin, 2017). In previous literature, appropriate adaptation strategies and measures have been found to mitigate the negative impacts of climate change and significantly increase crop yields (Reid et al., 2007). For example, Easterling et al. (2003) proposed and tested a new approach to simulate the agronomic adaptation of farmers to climate change based on a technological innovation/substitution model improving crop yields. The challenges posed by climate change to food security require unprecedented efforts and the ability to simulate and predict the interactions between crop growth dynamics and environmental and crop management (Brown and Funk, 2008). The crop production potential of an area is the highest theoretical yield that a crop can achieve under ideal conditions (Wang X. et al., 2015). Evaluating crop production potential started with the study of photosynthetic production potential, and in the early 1920s, researchers began to use quantum efficiency theory to study photosynthetic processes, arguing that the magnitude of crop production potential ultimately depends on light and light energy utilisation (Wang X. et al., 2012). After the 1960s, the photosynthetic production potential was revised by considering factors such as temperature, precipitation and soil parameters. These models can be divided into two main categories: process-based crop growth dynamics and agro-ecological productivity models (Tian et al., 2012). Process-based crop models, such as the decision-support system for agro-technology transfer model, simulate processes that occur during the crop growth cycle after parameter calibration using multi-year site-level observations (Zhan et al., 2014). Such models simulate dynamic biophysiological processes occurring during the crop growth cycle in a day-by-day stepwise manner and have been applied to assess crop yield responses to climate change, crop varieties and management (Huang et al., 2009; Xiong et al., 2009). However, the accuracy of such models is influenced by different parameters. Even if the model simulation parameters have been determined, the model performance can be severely affected by altered sowing dates and seasonal changes (Wang J. et al., 2012). Furthermore, parameters often vary over large areas within the same region, and it is almost impossible for researchers to fully understand the variation among parameters; therefore, the model often produces problematic results when used for crop simulations over large areas (Butt et al., 2005; Zhan et al., 2014). In contrast, agro-ecological productivity models such as the agro-ecological zone (AEZ) model use simple and reliable crop models involving standardised calculations to derive crop production potential by determining the limitations imposed by climatic factors on crops (Fischer et al., 2012).
Currently, the AEZ method is the most widely used model for assessing agricultural production potential worldwide (Sun et al., 2020). The AEZ model was developed jointly by the Food and Agriculture Organization of the United Nations and the International Institute for Applied Systems Analysis to calculate suitable growing areas and potential crop yields (Zhao et al., 2015). This standardised crop model and environmental matching procedure uses economic zones and is well suited for crop productivity assessment at regional, national and global scales (Masutomi et al., 2009). The AEZ method operates on the principle of logical partitioning based on the distribution of soil, topography and climate, where the natural production potential of land within the zone is similar (Tong et al., 2018). The AEZ model considers factors affecting crop yields such as light, temperature, water and soil, and the reproductive period length and water requirements of each reproductive stage for different crops, and adjusts the parameters based on the characteristics of the crops so that the estimation results are closer to reality (Wang X. et al., 2012). The basic data from the AEZ model are easy to obtain and convenient to calculate. Therefore, its robustness, ease of use and accurate reflection of regional crop production potential status have led to its high popularity. The AEZ model is widely used to evaluate the grain production potential (Xie et al., 2004) and dynamic assessment of grain production capacity (Zhan et al., 2013), and has been applied in approximately 35% of agricultural production potential assessments in China (Wang X. et al., 2015). In the present study, the parameter selection process depended on previous experience (Jiang, 2008) and focused on analysing the influence of the parameters to guide parameter tuning, resulting in improved accuracy.
The Qaidam Basin is located in the northeastern part of the Qinghai-Tibet Plateau, and is one of the three major inland basins in China. The basin has a plateau continental climate, and the total annual solar radiation is 686.64–741.06 kJ/cm2, second only to central and southwestern Tibet, and much higher than areas in eastern China at the same latitude. As such, this area is one of the most radiation-rich regions in China. The annual sunshine hours exceed 3000 h, the highest in the country, providing sufficient light for the photosynthesis of crops (Wang et al., 2017). The main crops are spring wheat, rape, barley, potatoes, beans and wolfberries (Wang et al., 2019). The area produces the highest wheat yield in the country (Zhang et al., 2008). The superior climatic conditions provide favourable and reliable conditions for the development of agriculture, which is particularly important in this critical agricultural and livestock production base in Qinghai Province that assures food security in northwest China (Wang et al., 2019; Wang et al., 2020). The Qaidam Basin is located in a climate change-sensitive area of the Tibetan Plateau (Li et al., 2015). It has an arid plateau continental climate, with annual precipitation decreasing from 200 mm in the southeast to 15 mm in the northwest, and an average annual relative humidity of 30–40%. Therefore, it is essential to research the impact of climate change on crop yields in the Qaidam Basin and systematically analyse the main climatic factors (temperature and precipitation) and changing characteristics of crop yields. In the manuscript, by assessing the land production potential, the reasonable current input level was determined, thus, evaluating the population carrying capacity, and proposed the enhancement strategies, which are innovation. Enhancement strategies are critical for optimising the rational use of local climatic resources and improving crop production potential in the Qaidam Basin.
Study Area
The Qaidam Basin is located in the northern part of Qinghai Province, mainly in the Haixi Mongolian and Tibetan Autonomous Prefecture (Figure 1). It is a closed plateau-type basin surrounded by the Kunlun Mountains, Arjinshan, Qilian Mountains and other mountain ranges, between 90°16′ E—99°16′ E and 35°00′ N—39°20′ N. The basin is approximately 800 km wide from east to west and 300 km long from north to south, with an area of approximately 240,000 km2, making it one of the three largest major inland basins in China. The southern edge of the basin is located in the northeastern part of the Qinghai-Tibet Plateau at an elevation of 2767–3191 m. It has oasis agricultural areas, including Golmud, Xiangrid and Chakhan Usu. Suitable agricultural land is mainly distributed in the eastern and southern parts of the basin along the fine soil belt under the flood alluvial fan. The region has significant temperature accumulation and good thermal conditions, and the existing arable land is concentrated in the eastern and southeastern oasis areas, mainly producing grain and oilseeds.
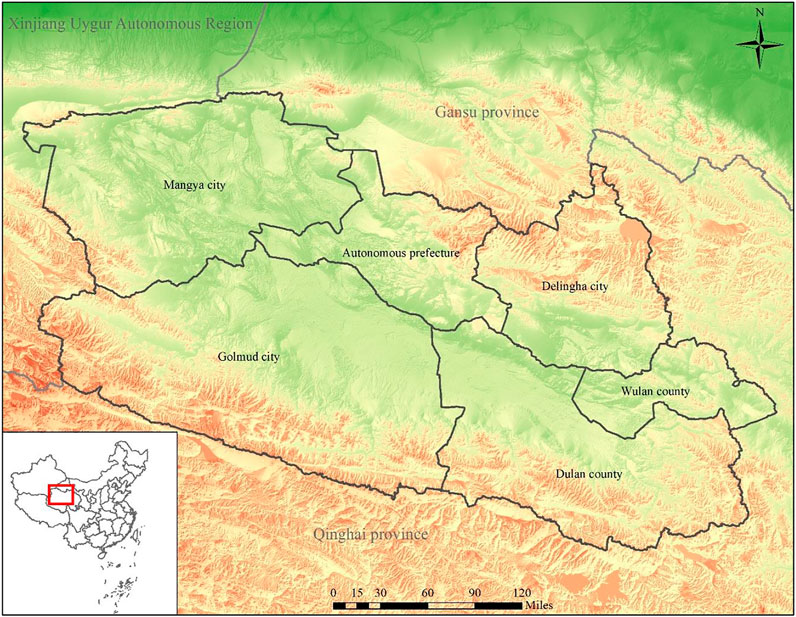
FIGURE 1. Schematic diagram of the study area.
Data Sources and Research Methods
Data Sources and Processing
1) Land use data for 2020 were obtained from the 30 m raster data released by the Ministry of Natural Resources (http://www.globallandcover.com/home.html?type=data). 2) Socioeconomic data such as crop yield and planted area were procured from the Statistical Yearbook of Haixi Prefecture. 3) Soil type and physical and chemical property data were acquired from the World Soil Database. 4) Meteorological data such as rainfall, temperature and sunshine hours were collected from the National Meteorological Science Data Center (http://data.cma.cn/). 5) Atmospheric radiation data were obtained from the National Tibetan Plateau Scientific Data Center (https://data.tpdc.ac.cn). 6) Annual rainfall, average annual temperature and average yield per unit area of spring wheat and highland barley were acquired from the Haixi State Statistical Yearbook. 7)The DEM data were obtained from geospatial data cloud platform (http://www.gscloud.cn/).
Research Methods
The two main crops, spring wheat and highland barley, were utilised as the research objects. Light, temperature, precipitation and soil texture were the influencing factors. The AEZ model was applied to calculate the photosynthetic production potential. The temperature influence coefficient was used to calculate the light and temperature production potential, which was then revised to obtain the climate production potential by accounting for the influence of precipitation. The land production potential was then obtained by taking soil availability into account. By assessing the range of suitable regions for growing crops, strategies for improving crop productivity in these regions were proposed to provide a basis for decision-making by the local government. The agricultural production potential was determined using the land production potential under various input level coefficients in the Haixi Prefecture. Simultaneously, the land production potential was used to identify suitable areas for agricultural production with spatial analysis technology (Figure 2).

FIGURE 2. Technical process.
The AEZ method was proposed by Kassam et al. with the support of the Food and Agriculture Organization of the United Nations to calculate the crop production potential (Sun et al., 2020). Based on the biomass and total dry matter of standard crops, this method used the following data: climate, land use, soil type and agricultural input level to modify the photosynthesis production potential, light-temperature production potential and climate production potential in a stepwise manner to obtain the agricultural production potential. The calculation formula used was as follows:
where, AP indicates the agricultural production potential, YQ indicates the photosynthetic production potential, YT indicates the light-temperature production potential, YW indicates the climate production potential, YS indicates the land production potential, h(T) indicates the air temperature correction coefficient, h(W) indicates the moisture correction coefficient, h(S) indicates the soil correction coefficient and h(M) indicates the input-level correction coefficient.
Photosynthetic Production Potential
The photosynthetic production potential refers to the total dry matter yield of a standard crop as determined by photosynthetically active radiation when all other conditions are ideal. The calculation formula used was as follows:
where, YQ indicates the photosynthetic production potential, C indicates the unit conversion coefficient and ∑Qi indicates the sum of the total solar radiation during the growth period of the crop (MJ·m−2). The values of other parameters (Table 1) were used as previously published (Yang, 2020).
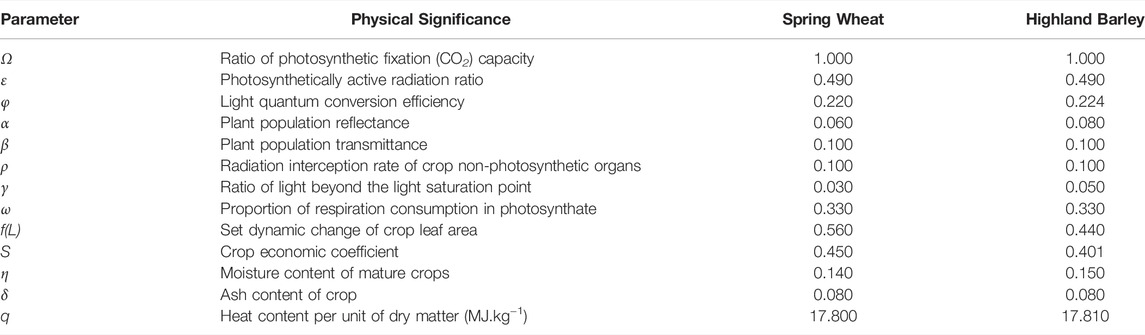
TABLE 1. Photosynthetic production potential parameters of crops.
Light-Temperature Production Potential
The light-temperature production potential refers to the productivity potential determined by light and temperature conditions under ideal water and soil conditions, agricultural input level and other conditions. This potential is modified by crop growth and development temperatures and the average temperature in the study area based on the photosynthetic production potential. The specific calculation formula used was as follows:
where, YT indicates the light-temperature production potential; YQ indicates the photosynthetic production potential; f (T) indicates the temperature correction coefficient; T indicates the average temperature during the growth period of the crops and T0, T1 and the T2 indicate the optimum temperature, the lower temperature limit and the upper temperature limit, respectively, in the growth period of the crops. The specific values (Table 2) were obtained from the research of Wang X. Y. et al. (2015), Wang et al. (2020).
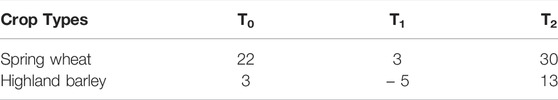
TABLE 2. Optimum temperature and temperature limits of main crops during the growth period.
Climate Production Potential
The climate production potential was revised using the moisture correction factor based on the light-temperature production potential. The specific calculation formula used was as follows:
where, YW indicates the climate production potential; f(w) indicates the moisture correction coefficient; P indicates the precipitation during the growth period of the crop (mm); ETC indicates the theoretical water demand (mm) and KC indicates the crop water demand coefficient, determined from published literature (Shi et al., 2015). Specifically, the crop water requirement coefficient of spring wheat was 1.12 and highland barley was 0.93. ET0 indicates the reference crop evapotranspiration; Tmean, Tmax and Tmin indicate the average temperature, maximum temperature and minimum temperature, respectively and Ra indicates the radiation from the top layer of the atmosphere.
Land Production Potential
The land production potential was based on the climate production potential, which was obtained through correction using the soil availability coefficient. The formula used was as follows:
where, Ys indicates the land production potential, Yw indicates the climate production potential, f(S) indicates the soil availability coefficient and Ai indicates the raster layer of each factor after scoring.
Based on the literature (Jiang, 2008), the soil pH value, organic matter content and soil texture were combined with the slope to construct a soil availability factor scoring system to obtain the soil availability coefficient (Table 3).
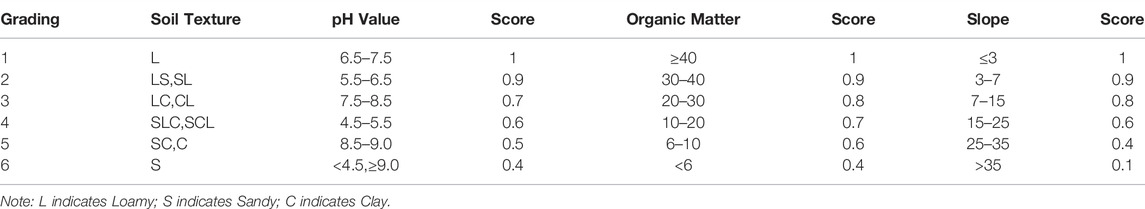
TABLE 3. Scoring of soil and slope conditions.
Agricultural Production Potential
In addition to natural factors, human factors influence the production potential, especially the amount of fertiliser used and investment in agricultural science and technology (Yin et al., 2005). The latter includes popularising good crop varieties and optimising irrigation techniques. Considering the arid climatic conditions in the Qaidam Basin, methods for developing water-saving irrigation techniques are the main focus of agricultural science and technology investment. Based on the land production potential, the agricultural production potential was achieved after correcting for the positive impact of the level of labour input on production potential; usually, the input level coefficient is between 1 and 1.3. Therefore, the present study calculated the agricultural production potential three times, when the input level coefficient was 1, 1.1 and 1.2, and compared the theoretical grain yield with the actual yield to determine the reasonable current input level and evaluate the agricultural production potential.
Results
Climate and Yield Trends
From 2008 to 2018, the average annual rainfall in Golmud city was approximately 50 mm, and the average annual rainfall in Delingha city, Wulan county and Dulan county was between 100 and 400 mm, with the rainfall in the four counties (cities) all increasing (Figure 3). The annual average temperature in Golmud city was approximately 6–7°C, and the average annual temperature of the four counties (cities) increased (Figure 4). The yield per unit area of the four counties (cities) showed a downward trend (Figure 5). Although rainfall increased, the temperature increase led to evaporation increase, indicating that the temperature increase negatively affected the yield per unit area of grain crops in the Qaidam Basin.
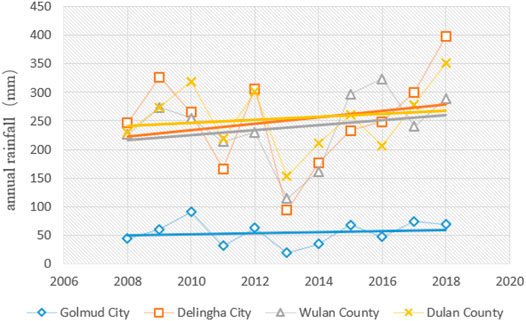
FIGURE 3. Trend chart of annual average rainfall between 2008 and 2018.
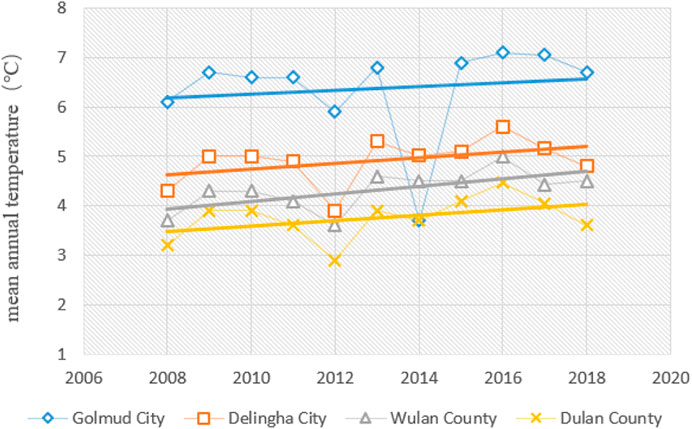
FIGURE 4. Multi-year mean temperature trend chart.
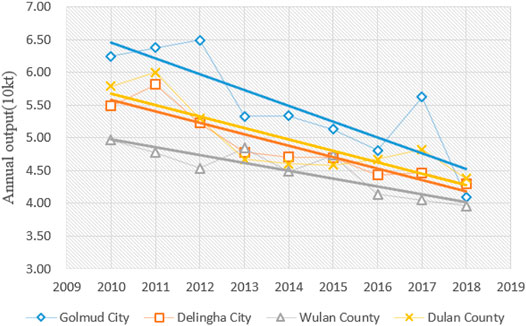
FIGURE 5. Multi-year production trend chart.
Photosynthetic Production Potential
The photosynthetic potential of spring wheat in 2018 in the Qaidam Basin ranged from 24256.56 kg·hm−2–34353.34 kg·hm-2, with significant spatial differences. The total photosynthetic potential of spring wheat was higher in the northwest and lower in the southeast (Figure 6A). The photosynthetic potential in Mangya city in the north was the highest, reaching 31178.11 kg·hm−2. The second-highest value was observed in the autonomous prefectures. The photosynthetic potential of highland barley ranged from 14677.08 to 20771.71 kg·hm−2, with the overall highest value in the north and the lowest value in the east, and the high values were concentrated in the east of Mangya city (Figure 6B).
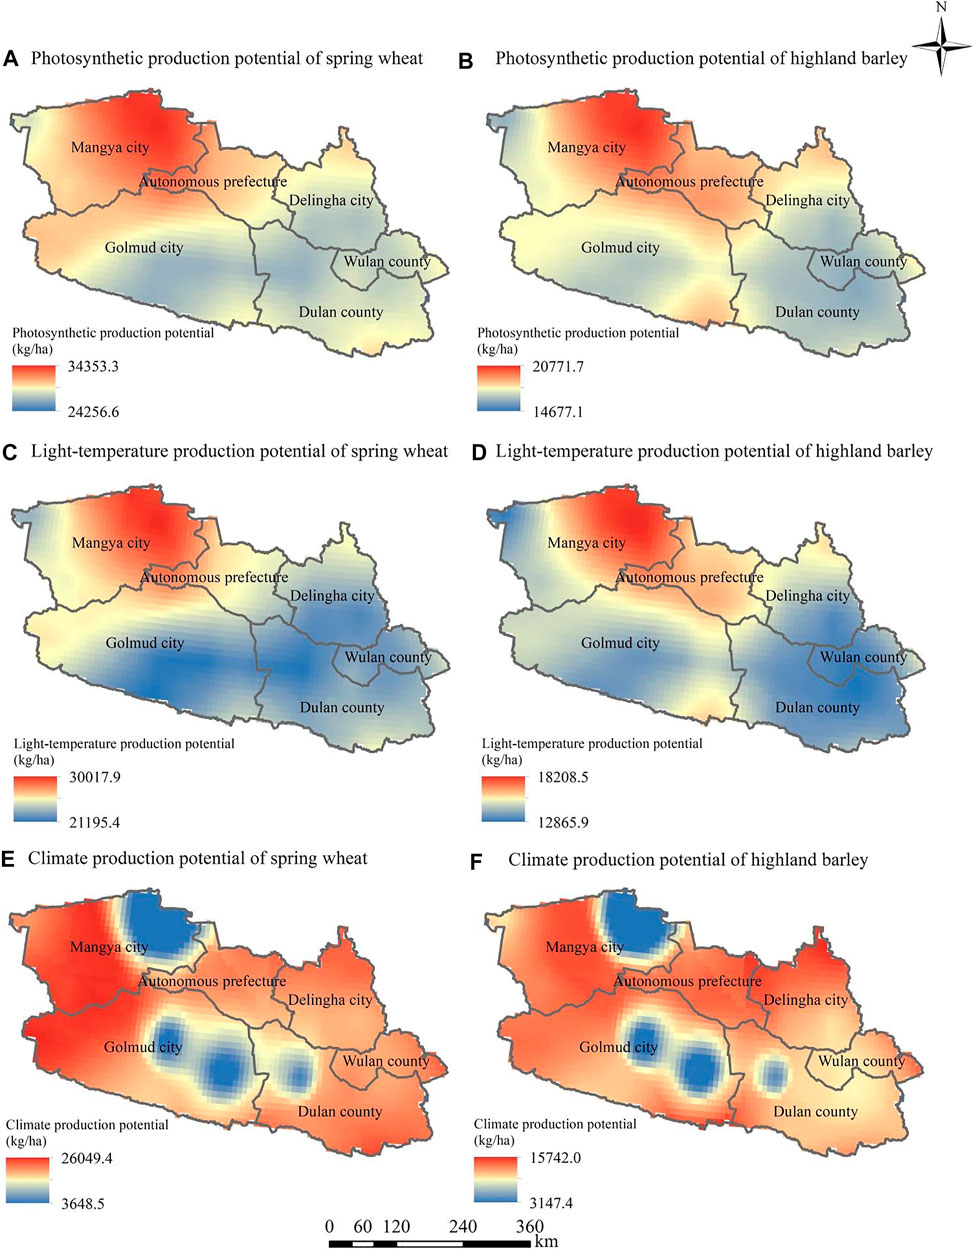
FIGURE 6. Photosynthetic, light-temperature and climate production potential of spring wheat (A,C,E), respectively and highland barley (B,D,F), respectively. (A) Photosynthetic production potential of spring wheat (B) Photosynthetic production potential of highland barley (C) Light-temperature production potential of spring wheat (D) Light-temperature production potential of highland barley (E) Climate production potential of spring wheat (F) Climate production potential of highland barley.
Light-Temperature Production Potential
After temperature effects were taken into account, the production potential was reduced by approximately 13%. The light-temperature production potential of spring wheat ranged from 21208.53 kg·hm−2–30017.95 kg·hm−2, with a high yield in the northwest and a low yield in central regions (Figure 6C). The high yield was mainly concentrated in Mangya city in the northwest. The mean value of the light-temperature production potential of spring wheat was the highest in Mangya city. The second-highest value was observed in the autonomous prefecture. The mean values in the other administrative regions showed few differences. The total yield potential of highland barley was between 12865.93 kg·hm−2 and 18208.48 kg·hm−2. The overall yield potential was high in the north and low in the east, with the highest values concentrated in the east of Mangya city (Figure 6D). The average photosynthetic potential of highland barley in the autonomous prefecture was the highest, followed by Mangya city.
Climate Production Potential
The climate production potential of spring wheat ranged from 3648.54 kg·hm−2–26049.37 kg·hm−2, and both the minimum and maximum values were observed in Mangya city (Figure 6E). There were no significant differences among the mean values of different cities and counties; however, there were three low-value clusters in the east of Mangya city, the middle and east of Geermu city, and Dulan county, which showed poor rainfall conditions. The climate production potential of highland barley ranged from 3147.37 kg·hm−2–15741.97 kg·hm−2 (Figure 6F), and its spatial distribution was similar to that of spring wheat.
Land Production Potential
The land production potential is the lower limit of productive potential under real conditions, which can be obtained by multiplying the soil availability coefficient with the climate production potential. The soil availability coefficient of the Qaidam Basin was between 0 and 0.57. Because there were large areas of bare land and desert in the central and northwestern parts of the Qaidam Basin, the land production potential was greatly attenuated. The land production potential of spring wheat and highland barley was only 15.85 and 16.74% of the photosynthetic production potential, respectively. The average land production potential of spring wheat in cultivated areas was 4908.3 kg·hm−2 and highland barley was 3084.25 kg·hm−2 (Figure 7).
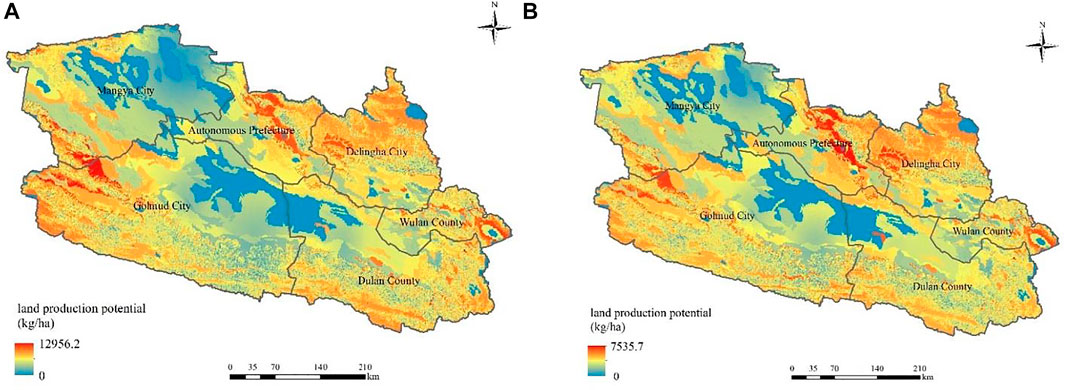
FIGURE 7. Land production potential of spring wheat (A) and highland barley (B).
The highest grade was determined as an appropriate area for grain production in the Qaidam Basin. The areas with high land production potential were mainly distributed in the northeast, southeast and west of the Qaidam Basin. The suitable area in Wulan county was close to Qinghai Lake, in Delingha city it was close to Hala Lake, directly under the autonomous prefecture it was connected to Dachaidan Lake and Xiaochaidan Lake, and in Mangya and Golmud cities these areas were distributed in the Yangtze River originates.
Agricultural Production Potential
More than 85% of the grain crops in the Qaidam Basin are spring wheat and highland barley, and the proportion of their planting area was approximately 4:5 in 2018.
According to (Jiang, 2008), in terms of fertilization level, the input level coefficients corresponding to high fertilization area, medium fertilization area and low fertilization area are 1.2, 1.3 and 1.1 respectively. Based on the land production potential and considering the positive impact of artificial input of agriculture on crop yield, the agricultural production potential was revised, and the average agricultural production potentials of cultivated land areas with input level coefficients of 1, 1.1 and 1.2 were calculated (Table 4). By comparing the theoretical yield with the actual yield, it was found that when the input level coefficient was 1, the planting area of grain crops in 2018 was 18.40 thousand hectares and the corresponding agricultural production potential was 71,600 tonnes. This was 0.42 million tonnes lower than the actual yield, indicating that the yield per unit area exceeded the upper limit without artificial intervention. When the input level coefficient was 1.1, the agricultural production potential was 78,800 tonnes, which was closest to the actual output. With an input level coefficient of 1.2, the agricultural production potential reached 8600 tonnes, higher than the actual output of 75,800 tonnes. Therefore, the actual yield was closest to the agricultural production potential when the coefficient of labour input was 1.1.
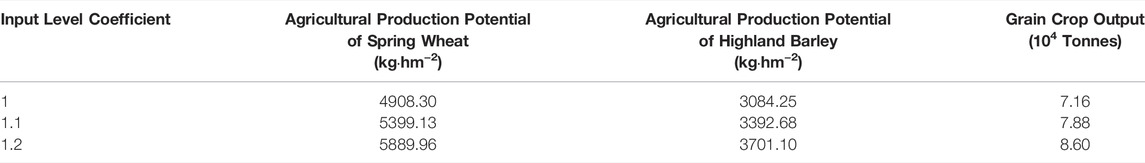
TABLE 4. Agricultural production potential and grain yield under different input level coefficients.
Discussion
Grain is an important strategic material and its output must continue to expand to maintain social stability (Zhou and Guan, 2000). The present study calculated the land population carrying capacity based on per capita grain consumption (Table 5). If all consumed calories were powered by food crops, approximately 400 kg would be needed per person per year. According to the National Bureau of Statistics in 2018, only 36% of the calories in the diet of the Chinese population come from grains. At present, the main grain crops in the Qaidam Basin are spring wheat and highland barley. According to the China Statistical Yearbook in 2018, China’s per capita grain consumption was 127.2 kg (most of which was grain). Based on this, the actual grain crop output in the Qaidam Basin in 2018 could support 562,900 people, whereas the permanent population of Haixi was 518,600. Therefore, the carrying rate was 0.87, achieving a sufficient balance between people and food. However, the development potential of the population carrying capacity was insufficient. If the correction coefficient of labour input can reach 1.2, the population carrying capacity can reach 676,100 people, and the carrying rate would be 0.76. In such a scenario, the development potential of the population carrying capacity would have much room for improvement. At present, the grain and oil output of Qaidam Basin could be more than self-sufficient. Taking advantage of the favourable factors of rich land resources, good light and heat, and good water and soil conditions in the Qaidam Basin, the primary position of agricultural development should be to improve the yield per unit area (Zhou and Guan, 2000).
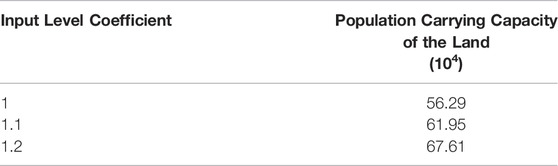
TABLE 5. Land population carrying capacity under different input level coefficients.
Due to global climate change, the climate of the Qaidam Basin has changed markedly, with considerable warming and a temperature increase significantly higher than the national and global average (Li et al., 2015). The temperature increase has affected crops (Wang et al., 2010; Qin et al., 2013) and directly impacted the climatic production potential of crops (Ding et al., 2006). Many studies have shown that climate change negatively impacts agriculture and may reduce crop productivity in the future (Lobell and Asner, 2003; Tan and Shibasaki, 2003; Ciais et al., 2005) to the extent that it poses some threat to food security (Yin et al., 2008; Xie et al., 2014). Increasing temperature and precipitation have led to the warming and humidification of the climate, causing a significant impact on the crop yield in the Qaidam Basin (Wang et al., 2020). Although rainfall and temperature have increased over the past 10 years, the yield per unit area showed a downward trend in the Qaidam Basin.
The Qaidam Basin is a typical oasis agricultural environment with good hydrothermal conditions and abundant potential arable land resources. The agricultural area is close to natural water sources, and most of the agricultural areas are distributed along the north and south edge of the basin beside the water, which is conducive to good irrigation conditions and development prospects. At present, almost all the cultivated land in the Qaidam Basin is irrigated, with the effective irrigated area exceeding 97%. Developing water-saving irrigation is critical to improving the realistic production potential of crops (Zhou and Guan, 2000). Developing green and efficient water-saving methods and precision agriculture technology can shift the cultivation industry towards pollution-free and environmentally friendly methods (Yu et al., 2021).
In 2018, the grain crop yield per unit area of the Qaidam Basin exceeded the yield ceiling without artificial intervention; therefore, the following enhancement strategies are required to improve the grain crop yield and further improve the population bearing capacity. 1) Strengthen water-saving irrigation technology and improve the utilisation rate of water resources. This should be implemented in light of local conditions to achieve increased water-saving and open source technology in critical areas, vigorous promotion of drip irrigation and other technologies, rational high-level planning and management of surface water and groundwater, and greater water supply and drainage. 2) Improve the utilisation rate of chemical fertilisers and pesticides and replace chemical fertiliser with organic fertiliser. Excessive fertiliser use can inhibit crop growth and cause environmental pollution. The use of chemical fertiliser in Haixi peaked in 2018; however, implementing reduced application and greater efficiency of chemical fertilisers and pesticides in 2019 achieved promising preliminary results, reducing the use of chemical fertilisers by more than 50%. Organic fertiliser should be further promoted to replace chemical fertilisers and a green-oriented agricultural technology system should be constructed.
Conclusion
It is important to research the impact of climate change on crop yields in the Qaidam Basin. The present study employed the AEZ method to calculate the production potential of the Qaidam Basin at multiple levels based on photosynthetic capacity, temperature, light, climate and soil availability to ultimately obtain the land production potential. Based on correction using different input coefficients, the potential for agricultural production potential was calculated. These data were then used to calculate the land population carrying capacity. Thus, this study provides a reference for improving agricultural productivity in the Qaidam Basin. The specific conclusions are as follows:
1) By combining the AEZ method with GIS technology, every single factor of land production potential was considered comprehensively through step-by-step correction, ensuring that the results were closer to reality. It is critical to optimise the rational use of local climatic resources and improve agricultural production potential. The research methods have wide application value.
2) The photothermal conditions of the Qaidam Basin are good, and the photosynthetic and photothermal productivity potential of Manya city and the autonomous prefecture in the northern basin is high. The rainfall is low, especially in the eastern part of Golmud city and Mangya city; therefore, the climate production potential of this region is low. After correction using the soil availability coefficient, the land production potential was only approximately 1/6 of the photosynthetic production potential, and the highest values occurred in the northeast and west of the basin margin. The suitable area for agricultural production is a reserve arable land resource to the production potential under natural conditions, and provides a scientific basis for the rational distribution of grain crops.
3) The current population carrying capacity of the land resources is 562,900, which achieves a balance between people and food when the correction coefficient of artificial input is approximately 1.1. If the correction coefficient reaches 1.2 by improving irrigation efficiency and reducing fertiliser use, the population carrying capacity could reach 676,100; hence, there remains potential to increase grain yield. Over the past 10 years, increasing temperature and rainfall have led to warming and humidification, and the grain yield per unit area has shown a downward trend. Therefore, climate change negatively influences agriculture and decreases crop productivity in the Qaidam Basin. Enhancement strategies, such as strengthening water-saving irrigation technology and improving the utilisation rate of chemical fertilisers, are required to improve the agriculture productivity potential in Qaidam Basin, and help advance the green-oriented agricultural technology system.
Data Availability Statement
The original contributions presented in the study are included in the article/Supplementary material, further inquiries can be directed to the corresponding authors.
Author Contributions
HY: Writing original draft. MH: Investigation. TZ: Methodology. JW: Data curation. ZL: Methodology. DC: Formal analysis. PL: Writing -review and editing. YL: Editing. HW: Investigation. ZJ: Validation. DM: Introduction. DZ: Data. XW: Review and editing.
Funding
The research was funded by the National Natural Science Foundation of China (Grant No. U20A2088), Sichuan Science and Technology Program (Grant Nos. 2022YFS0494 and 2019YFS0467), Sichuan Natural Resources Scientific Research Project (Kj-2021-12).
Conflict of Interest
Author XY was employed by company China Southwest Geotechnical Investigation and Design Institute Co.,Ltd.
The remaining authors declare that the research was conducted in the absence of any commercial or financial relationships that could be construed as a potential conflict of interest.
Publisher’s Note
All claims expressed in this article are solely those of the authors and do not necessarily represent those of their affiliated organizations, or those of the publisher, the editors and the reviewers. Any product that may be evaluated in this article, or claim that may be made by its manufacturer, is not guaranteed or endorsed by the publisher.
References
Brown, M. E., and Funk, C. C. (2008). Food Security under Climate Change. Science 319, 580–581. doi:10.1126/science.1154102
Butt, T. A., Mccarl, B. A., Angerer, J., Dyke, P. T., and Stuth, J. W. (2005). The Economic and Food Security Implications of Climate Change in Mali. Clim. Change 68 (3), 355–378. doi:10.1007/s10584-005-6014-0
Ciais, P., Reichstein, M., Viovy, N., Granier, A., Ogée, J., Allard, V., et al. (2005). Europe-Wide Reduction in Primary Productivity Caused by the Heat and Drought in 2003. Nature 437 (7058), 529–533. doi:10.1038/nature03972
Ding, Y., Ren, G., Shi, G., Gong, P., Zheng, X., Zhai, P., et al. (2006). China’s National Assessment Report on Climate Change (1): Climate Change in China and the Future Trend. Prog. Clim. Change Res. 2 (1), 3–8+50. doi:10.3969/j.issn.1673-1719.2007.z1.001
Easterling, W. E., Chhetri, N., and Niu, X. (2003). Improving the Realism of Modeling Agronomic Adaptation to Climate Change: Simulating Technological Substitution. Clim. Change 60 (1), 149–173. doi:10.1023/A:1026023712494
Fischer, G., Nachtergaele, F. O., Prieler, S., Teixeira, E., Tóth, G., Velthuizen, H. V., et al. (2012). Global Agro-Ecological Zones (GAEZ v3.0)-Model Documentation. IIASA and FAO, Laxenburg, Austria and Rome, Italy.
Huang, Y., Yu, Y., Zhang, W., Sun, W., Liu, S., Jiang, J., et al. (2009). Agro-C: A Biogeophysical Model for Simulating the Carbon Budget of Agroecosystems. Agric. For. Meteorol. 149, 106–129. doi:10.1016/j.agrformet.2008.07.013
Jiang, Q. (2008). Estimation of Agricultural Productivity in China Based on AEZ Model and its Response to Changes in Cultivated Land Use. Changsha: Central South University.
Li, L., Shen, H., Li, H., and Xiao, J. (2015). Regional Differences of Climate Change in Qaidam Basin and its Contributing Factors. J. Nat. Resour. 30 (4), 641–650. doi:10.11849/zrzyxb.2015.04.010
Lobell, D. B., and Asner, G. P. (2003). Climate and Management Contributions to Recent Trends in U.S. Agricultural Yields. Science 299 (5609), 1032. doi:10.1126/science.108392010.1126/science.1078475
Masutomi, Y., Takahashi, K., Harasawa, H., and Matsuoka, Y. (2009). Impact Assessment of Climate Change on Rice Production in Asia in Comprehensive Consideration of Process/Parameter Uncertainty in General Circulation Models. Agric. Ecosyst. Environ. 131, 281–291. doi:10.1016/j.agee.2009.02.004
Qin, Z., Tang, H., Li, W., and Zhao, S. (2013). Progress and Directions in Studying the Impacts of Climate Change on Agriculture and Grain Productiong in China. China Agric. Resour. Zoning 34 (5), 1–7. doi:10.7621/cjarrp.1005-9121.20130501
Reid, S., Smit, B., Caldwell, W., and Belliveau, S. (2007). Vulnerability and Adaptation to Climate Risks in Ontario Agriculture. Mitig. Adapt Strat. Glob. Change 12 (4), 609–637. doi:10.1007/s11027-006-9051-8
Shi, X., Li, F., Yan, B., He, D., Pu, B., and Qu, Z. (2015). Effects of Water Deficit in Different Growth Stages on Water Use and Yield of Spring Barley. J. Agric. Mach. 46 (10), 9. doi:10.6041/j.issn.1000-1298.2015.10.019
Sun, Y., Wang, L., Liu, Z., Wen, N., Hu, Y., Xie, J., et al. (2020). Research Progress on Identification of Key Influencing Factors and Typical Evaluation Models of Cultivated Land Resource Carrying Capacity. J. Agric. Resour. Environ. 37 (6), 829–844. doi:10.13254/j.jare.2020.0467
Tan, G., and Shibasaki, R. (2003). Global Estimation of Crop Productivity and the Impacts of Global Warming by GIS and EPIC Integration. Ecol. Model. 168 (3), 357–370. doi:10.1016/S0304-3800(03)00146-7
Tian, Z., Zhong, H., Sun, L., Fischer, G., van Velthuizen, H., and Liang, Z. (2012). Improving Performance of Agro-Ecological Zone (Aez) Modeling by Cross-Scale Model Coupling: An Application to Japonica Rice Production in Northeast china. Ecol. Model. 290, 155–164. doi:10.1016/j.ecolmodel.2013.11.020
Tong, S., Zhiming, F., Yanzhao, Y., Yumei, L., and Yanjuan, W. (2018). Research on Land Resource Carrying Capacity: Progress and Prospects. J. Resour. Ecol. 9 (4), 331–340. doi:10.5814/j.issn.1674-764x.2018.04.001
Wang, F., Lei, Y., Du, Z., and Cai, Y. (2020). Climate Change Affects Major Crops’Yield in Qaidam Basin. China Agric. Sci. Bull. 36 (14), 6. doi:10.3981/j.issn.1000-7857.2017.10.013
Wang, F., Lei, Y., Han, T., and Cai, Y. (2019). Characteristics and Sensitivity Analysis of Climatic Production Potential in the Qaidam Basin. Qinghai Grass Ind. 28 (4), 6.
Wang, J., Wang, E., Yang, X., Zhang, F., and Yin, H. (2012a). Increased Yield Potential of Wheat-Maize Cropping System in the North china Plain by Climate Change Adaptation. Clim. Change 113, 825–840. doi:10.1007/s10584-011-0385-1
Wang, L., Li, F., Xu, W., Xiao, H., Su, W., and Zhou, W. (2010). Impact of Climate Change on Growth of Wheat in the Irrigation District of Qaidam Oasis. Chin. J. Agrometeorology 31 (S1), 81–83+89. doi:10.11849/zrzyxb.2015.04.010
Wang, X., Hongyan, R., and Huang, Z. (2015b). Analysis on Potential Productivity of Sugarcane in Guangxi Province Based on AEZ Model. J. Crops (1), 121–126. doi:10.16035/j.issn.1001-7283.2015.01.023
Wang, X., Kong, F., Kong, W., and Zheng, M. (2017). Resource Base of Developing Saline Lake Agriculture in Qaidam Basin. Sci. Technol. Her. 35 (10), 6. doi:10.3981/j.issn.1000-7857.2017.10.013
Wang, X. Y., Yang, X. G., Sun, S., and Xie, W. J. (2015a). Comparison of Potential Yield and Resource Utilization Efficiency of Main Food Crops in Three Provinces of Northeast china under Climate Change. Chin. J. Appl. Ecol. 26 (10), 3091–3102. doi:10.13287/j.1001-9332.20150921.028
Wang, X., You, F., and Yang, Y. (2012b). Analysis of Maize Potential Productivity Change Based on AEZ Model in Heilongjiang Province. J. Northwest A&F Univ. (Natural Sci. Edition) 40 (6), 59–64. doi:10.13207/j.cnki.jnwafu.2012.06.013
Xie, J., Cai, Y., Zheng, Z., and Lin, P. (2004). Evaluation of China's Arable Land Grain Production Potential Based on Improved Agro-Ecological Zone Method. China Land Sci. 18 (4), 31–37. doi:10.3969/j.issn.1001-8158.2004.04.006
Xie, L., Li, Y., Xu, Y., Zhao, X., Song, Y., Jiang, T., et al. (2014). Updated Understanding on the Impacts of Climate Change on Agricultural Production and Food Security. Res. Prog. Clim. Change 10 (4), 235–289. doi:10.3969/j.issn.1673-1719.2014.04.001
Xiong, W., Conway, D., Lin, E., and Holman, I. (2009). Potential Impacts of Climate Change and Climate Variability on china's Rice Yield and Production. Clim. Res. 40 (1), 23–35. doi:10.3354/cr00802
Yang, F. (2020). Research on the Temporal and Spatial Differentiation of Climate Production Potential in Huangshui Basin under Climate Change. Chongqing: Southwest University.
Yang, Z., and Wang, B. (2015). Present Status of Saline Soil Resources and Countermeasures for Improvement and Utilization in China. Shandong Agric. Sci. 47 (4), 125–130. doi:10.14083/j.issn.1001-4942.2015.04.032
Yin, C. (2017). Study on the Climate Change Impact on Chinese Rice Production. Wuhan: Huazhong Agricultural University.
Yin, P., Fang, X., and Yun, Y. (2008). Regional Differences of Vulnerability of Food Security in China. J. Geogr. Sci. 19 (5), 532–544. doi:10.1007/s11442-009-0532-z
Yin, X., Chen, G., and Fu, X. (2005). An Empirical Analysis of the Influencing Factors of My Country's Agricultural Comprehensive Productivity. Statistics Decis. (12S), 73–75. doi:10.3969/j.issn.1002-6487.2005.23.039
Yu, H., Liu, K., Bai, Y., Luo, Y., Wang, T., Zhong, J., et al. (2021). The Agricultural Planting Structure Adjustment Based on Water Footprint and Multi-Objective Optimisation Models in China. J. Clean. Prod. 297, 126646. doi:10.1016/j.jclepro.2021.126646
Zhan, J., Yu, ., and Shi, Q. (2013). Dynamic Assessment of China's Grain Production Capacity Based on Agro-Ecological Zone Model. China's Popul. Resour. Environ. 23 (10), 8. doi:10.3969/j.issn.1002-2104.2013.10.015
Zhan, T., Zhong, H., Sun., L., Fischer., G., and Liang, Z. (2014). Estimating Potential Yield of Wheat Production in china Based on Cross-Scale Data-Model Fusion. Front. Earth Sci. 6 (4), 9. doi:10.1109/pma.2012.6524862
Zhang, W., Li, X., and Wang, X. (2008). Emergy Analysis of Farm-Stock Raising Ecosystemin Cold Temperate Arid Area——A Case Study of the Qaidam Basin. Resour. Environ. Arid Areas 22 (6), 6. doi:10.3969/j.issn.1003-7578.2008.06.013
Zhang, Y., Liu, J., and Yang, M. (2015). Summary of the Effects of Climate Change on Crop Production Potential. J. Agron. 5 (1), 5.
Zhao, Z. C., Luo, Y., Wang, S. W., and Huang, J. B. (2015). Science Issues on Global Warming. J. Meteorology Environ. 31 (1), 1–5. doi:10.3969/j.issn.1673-503X.2015.01.001
Keywords: agro-ecological zone method, qaidam basin, land production potential, agricultural production potential, population carrying capacity, enhancement strategy
Citation: Yu H, Huang M, Zhao T, Wang J, Li Z, Chen D, Li P, Luo Y, Wang H, Jing Z, Mou D, Zhang D and Wang X (2022) Analysis of Agricultural Production Potential and Enhancement Strategy in the Qaidam Basin Based on the Agro-Ecological Zone Method. Front. Environ. Sci. 10:908888. doi: 10.3389/fenvs.2022.908888
Received: 31 March 2022; Accepted: 13 May 2022;
Published: 24 June 2022.
Edited by:
Dingde Xu, Sichuan Agricultural University, ChinaCopyright © 2022 Yu, Huang, Zhao, Wang, Li, Chen, Li, Luo, Wang, Jing, Mou, Zhang and Wang. This is an open-access article distributed under the terms of the Creative Commons Attribution License (CC BY). The use, distribution or reproduction in other forums is permitted, provided the original author(s) and the copyright owner(s) are credited and that the original publication in this journal is cited, in accordance with accepted academic practice. No use, distribution or reproduction is permitted which does not comply with these terms.
*Correspondence: Tao Zhao, NDYyNzgyMjY1QHFxLmNvbQ==; Jianping Wang, amlhbnBpbmd3YW5nQGlzbC5hYy5jbg==; Pengshan Li, dGFyZ2V0bHBzQDE2My5jb20=; Yong Luo, bHVveW9uZzIwMTRAY2R1dC5lZHUuY24=
†These authors have contributed equally to this work and share first authorship