 Zhuzi Zhao
 Ning Sun
- School of Chemical and Environmental Engineering, Jiangsu University of Technology, Changzhou, China
Changzhou, a typical industrial city located in the center of the Yangtze River Delta (YRD) region, has experienced serious air pollution in winter. However, Changzhou still receives less attention compared with other big cities in YRD. In this study, a four-month PM2.5 sampling campaign was conducted in Changzhou, China from 1 November 2019, to 1 February 2020. The period covers the entire wintertime and includes first week of the Level 1 response stage of the lockdown period due to the outbreak of COVID-19. The mean PM2.5 concentrations were 67.9 ± 29.0 μg m−3, ranging from 17.4 to 157.4 μg m−3. Secondary inorganic ions were the most abundant species, accounting for 37 and 50% during the low and high PM2.5 pollution periods, respectively. Nitrogen oxidation ratio (NOR) during the high PM concentration level period was twice the low PM concentration period whereas sulfur oxidation ratio (SOR) showed a less significant increase. This represents that nitrate formation is potentially the predominant factor controlling the occurrence of PM pollution. The analysis of NOR, SOR as functions of relative humidity (RH) and ozone (O3) concentrations suggest that the sulfate formation was mainly through aqueous-phase reaction, while nitrate formation was driven by both photochemistry and heterogeneous reaction. And, excess ammonium could promote the formation of nitrate during the high PM period, indicating that ammonia gas played a critical role in regulating nitrate. Furthermore, a special period-Chinese New Year overlapping first week of COVID-19 lockdown period, offered a precious window to study the impact of human activity pattern changes on air pollution variation. During the special period, the average PM2.5 mean concentration was 60.4 μg m−3, which did not show in a low value as expected. The declines in nitrogen oxide (NOx) emissions led to rapid increases in O3 and atmospheric oxidizing capacity, as well as sulfate formation. The chemical profiles and compositions obtained during different periods provide a scientific basis for establishing efficient atmospheric governance policies in the future.
1 Introduction
As one of the most economically developed zones with high energy consumption in China, the Yangtze River Delta (YRD) region has experienced serious air pollution problems in recent years (Fu et al., 2013). The temporal distribution showed the highest PM2.5 concentration is found in winter, heavily affected by prevailing northerly and westerly winds (Qian et al., 2021). Hence, in-depth investigation at typical heavily polluted cities in the YRD region in winter is critical, assisting the formulation of efficient regional pollution control strategies (Ye et al., 2019).
At the end of the year 2019, the tragic coronavirus disease (COVID-19) pandemic occurred. To combat the rapid dispersion of the virus, many national lockdown policies were implemented in China to keep social distance. Quarantine measures have effectively alleviated the spread of the epidemic, and simultaneously resulted in declines in anthropogenic emissions from industry and transportation, and import and export of goods (Chen H. et al., 2020). Such a shutdown serves as a natural experiment to evaluate air-quality responses to a marked emissions reduction, and also to assess the interplay between emission, atmospheric chemistry, and meteorological conditions (Le et al., 2020). For example, Li et al. (2020) found that the implemented lockdown policy caused approximately 80% and 20–40% emission reductions for the traffic and the industrial sectors, respectively, corresponding to a reduction of >20 μg m−3 PM2.5 compared to that during the pre-lockdown period. However, despite primary emissions being significantly reduced during the lockdown period, the air quality in some megacities has not been improved as expected due to the complex responses in terms of aerosol chemistry, with the variations of precursors and meteorological conditions (Sun et al., 2020).
Changzhou, a typical industrial city located in the center of the YRD region, has suffered haze pollution, especially in wintertime (Ma et al., 2019; Ye et al., 2019). To reduce air pollution, the establishment of effective pollution control strategies is important. However, there are many challenges such as the requirement of accurate apportionment of predominant sources and distinguishing primary emissions or secondary formations (Huang et al., 2014). In this study, we present the major chemical compositions of PM2.5 and the concentrations of gaseous pollutants in urban Changzhou from 1 November 2019 to 1 February 2020. The period covers the entire wintertime and includes the first week of the Level 1 response stage of the lockdown period. It should be noted that the Chinese New Year (abbreviated as CNY, also as known as the Spring Festival) overlapped with the Level I response period. The YRD region hosted the first level of response started on 24 January 2020. The government actively executed epidemic prevention actions and control steps to the cities, including the adoption of compulsory measures following the law that prohibit all large-scale mass activities (Li et al., 2020). During the Level 1 response period, the number of people accessed and vehicles passed by the public places decreased substantially, and there were large-scale stoppages or even closures for the industrial factories, construction sites, and catering enterprises (Li et al., 2020). Due to the strict lockdown policy in Changzhou starting on February 2nd, no more offline sampling could be continuously carried out. Even though this circumstance, the samples collected in the days before the complete city lockdown could still provide a precious window to study how the air quality responds to the quick decline of anthropogenic emissions in Changzhou.
As the above description, we studied the temporal characteristics of PM2.5 and its chemical compositions, gaseous pollutants, and meteorological factors during the wintertime. In addition, we investigated the characteristics of chemical compositions during different periods as well as the responses to the lockdown policies. Furthermore, the influence factors to the concentrations of air pollutants were interpreted to demonstrate the relationships between the meteorological conditions, emissions of primary pollutants, secondary species formation, etc. Our findings could assist to understand the winter haze formation, the impacts of different pollutants abatement, and the development of effective control strategies in this typical industrial city.
2 Experiment and Method
2.1 Site Description
Changzhou, is located in central-south Jiangsu Province, geographically in the center of the YRD region, China (Figure 1). The Beijing-Hangzhou Canal runs through the city. To the south of the city is Lake Taihu, the third-largest freshwater lake in China. Moreover, the Yangtze River lies to the north of Changzhou. Abundant water sources around the city supply plentiful moisture in the air, leading to a humid atmosphere in Changzhou throughout the year.
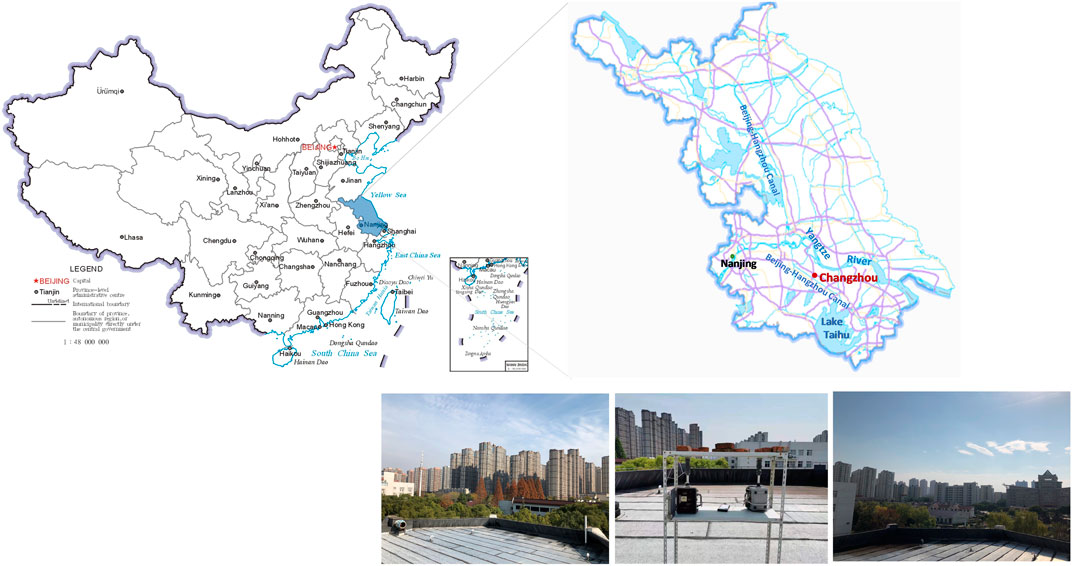
FIGURE 1. Map of Jiangsu province (filled with blue in the left panel) and Changzhou (red dot in the red panel). The observation site photos were displayed in the bottom right panel. (Maps downloaded from the website http://bzdt.ch.mnr.gov.cn/index.html.).
The sampling site locates in the western part of downtown Changzhou where situates on the rooftop of a four-story building inside the campus of the Jiangsu University of Technology (31.7°N, 119.9°E). It is approximately 10 m above ground level. The location represents a typical urban monitoring site, surrounded by school and residential areas with medium-scaled population and middle traffic volume. There were no major industrial or constructive activities nearby during the observation period.
2.2 Measurements
2.2.1 Ambient PM2.5 Sampling and Chemical Analyses
Ambient daily PM2.5 samples (from 10:00 to 09:50 next day local time) were collected on Ø47 mm quartz-fiber filters (Whatman Ltd., Maidstone, United Kingdom) using a mini-volume air sample (Mini_TAS, Arimetric, Oregon, United States) at a flow rate of ∼5 L min−1. Before sampling, all filters were pre-combusted at 900°C for 4 h to remove organic contaminants. A total of 92 PM2.5 filter samples were collected from 1 November 2019, to 1 February 2020. No more sampling could be continuous beyond February 1st due to the strict lockdown policies conducted in Changzhou. Mass concentrations, carbonaceous fractions, major inorganic ions, and elements were measured with an electronic microbalance balance, DRI OCEC analyzer, DX-600 ion chromatography and Epsilon-5 PANalytical ED-XRF, repectively. The details of sampling and analyses could be found in supplementary.
2.2.2 Air Quality Data and Meteorological Data
Hourly concentrations of the six pollutants (including SO2, NO2, CO, O3, PM2.5, and PM10) were achieved from the website of the Ministry of Ecology and Environment of the People’s Republic of China (http://datacenter.mep.gov.cn). In this study, the citywide hourly and daily concentrations of the target air pollutants were calculated by averaging the hourly and daily data from all monitoring sites.
Meteorological data in Changzhou were obtained from the China Meteorological Administration and used to interpret the influence on air pollution. The observations include 2-m temperature (T), 10-m wind speed (WS) and wind direction (WD), and sea level pressure (P) available every 3 h at 02:00, 05:00, 08:00, 11:00, 14:00, 17:00, 20:00, and 23:00 LT, as well as 2-m RH (RH) available every hour.
2.3 Data Analysis
2.3.1 Secondary Organic Carbon Calculation
For secondary organic carbon (SOC) calculation, most studies estimated SOC using the EC-tracer method (Turpin and Huntzicker, 1995), which applies the following equation.
Here, we used Minimum R Squared (MRS) method for the (OC/EC)primary calculation according to Wu and Yu (2016). Briefly, this method derives (OC/EC)primary through calculating a hypothetical set of (OC/EC)primary and SOC followed by seeking the minimum of the coefficient of correlation (R2) between SOC and EC. The hypothetical (OC/EC)primary that generates the minimum R2 (SOC, EC) then represents the actual (OC/EC)primary ratio if variations of EC and SOC are independent and (OC/EC)primary is relatively constant. In comparison, the MRS is identified as more accurate than the conventional subset percentile or minimum OCEC ratio approaches (Wu et al., 2016). Therefore, MRS was employed for the SOC calculation in this study.
2.3.2 Sulfur Oxidation Ratio and Nitrogen Oxidation Ratio Calculation
To assess the degrees of the secondary formation of SO42- and NO3−, sulfur oxidation ratio (SOR) and nitrogen oxidation ratio (NOR) was calculated by the following equation.
where n-SO42− and n-NO3− are the molar concentrations of SO42− and NO3−, n-SO2 and n-NO2 are the molar concentrations of SO2 and NO2, respectively.
3 Results
3.1 Comparison of Online and Offline PM2.5 Measurements
To cross-check the reliability of the offline sampling, data comparison between online monitoring and offline gravimetric analysis for PM2.5 was performed, and the results are presented in Supplementary Figure S1. Notably, the online PM2.5 data with 1 h resolution were integrated to calculate the average for 24 h, corresponding to the offline filter collection. Good linearity (r2 = 0.97) was found between the online and offline approaches. Besides, the linear regression that passed through the origin of the plot yielded a slope of 1.053, indicating that the concentrations were relatively close. Therefore, the two approaches produced the PM2.5 results in a good agreement.
3.2 General Characteristics of Atmospheric Pollutants
3.2.1. Online Measure for Six Criteria Pollutants
Figures 2A–C illustrate the time series of six criteria pollutants (i.e., PM2.5, PM10, SO2, NO2, CO, and O3) and the meteorological parameters including temperature, relative humidity, wind speed, and precipitation during the sampling period. The CNY from January 23rd to February 2nd was highlighted by the light green column. In general, the trends of PM10 and PM2.5 are consistent with each other, showing peaks in mid-January. The PM2.5 concentration levels ranged from 16.1 to 194.8 μg m−3. An arithmetic mean of 61.6 ± 31.6 μg m−3 was found during the observation period, lower than the 24-h averaged Chinese PM2.5 Grade II standard of 75 μg m−3 but greatly exceeded the Grade I standard of 35 μg m−3 (GB3095-2012). It should be noted that relatively low PM2.5 concentrations were seen in November 2019 (48.7 ± 19.2 μg m−3), and increased 1.3 and 1.4 fold in December and January, respectively. Compared to the PM2.5, the PM10 concentration levels from November to January are relatively stable, showing the monthly averages of 90.1–96.1 μg m−3 (<10% difference). In another word, the monthly averaged PM2.5/PM10 ratios increased from 0.53 (November) to 0.69 (December) and 0.77 (January), indicating particles might be more influenced by crustal matters in November while the fine particles played an important role in January.
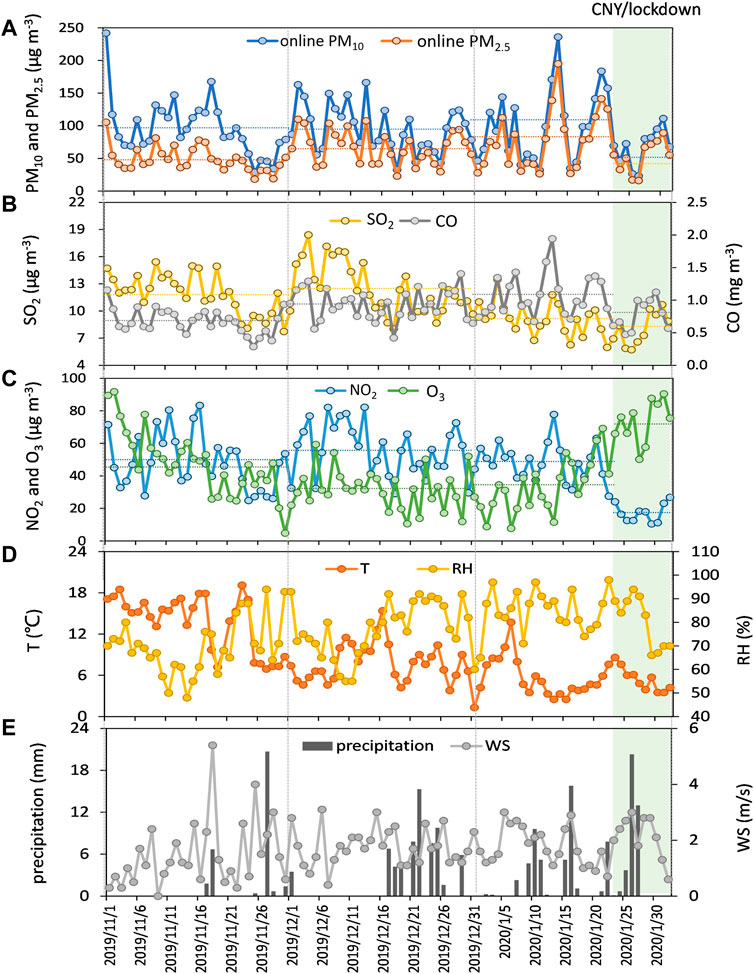
FIGURE 2. Time series of (A) PM10 and PM2.5 concentrations, (B) SO2 and CO concentrations, (C) NO2 and O3 concentrations, (D) temperature and relative humidity, and (E) precipitation and wind speed from 1 November 2019 to 1 February 2020 (The dotted lines represent the mean concentrations for each pollutant).
For the gaseous precursor species, the average concentrations of NO2 and CO at the monitoring site were 47.6 μg m−3 and 0.9 mg m−3, respectively, which are lower than the daily Grade I means of 50 μg m−3 and 4 mg m−3 for NO2 and CO, respectively, established by the National Ambient Air Quality Standard (NAAQS) of China. Daily mean SO2 concentrations ranged from 5.7 to 18.4 μg m−3, much lower than the daily average SO2 Grade I value (50 μg m−3) from the NAAQS, indicating the implementation of the clean air policy since 2013 has substantially reduced the ambient SO2 concentration in China (Zhang et al., 2019). The correlation of CO was well consistent with that of PM2.5 (R2 = 0.69, figure not shown), while the correlation between SO2 and PM2.5 was weak (R2 = 0.11). CO is often used as a primary emission indicator due to its lifetime against oxidation by OH radicals (DeCarlo et al., 2010), thus the significant correlation between CO and PM2.5 reflected the influence of primary combustion emissions during the sampling period.
Each species showed a different pattern during the sampling periods. As shown in Figure 2, in January (before Jan. 24th), major peaks of particulate matter coincided with high levels of CO and NO2, NO2 in November, and NO2 and SO2 in December. Overall, there was a doward trend of PM10, PM2.5, NO2, SO2 and CO in the CNY that overlapped the COVID-19 lockdown period. Compared with the first 3-week mean in January, NO2 plummeted 65% due to the sharp decrease from the traffic sector, while SO2 and CO reduced by 10% and 26%, respectively. The decreases of particulate matter are not obvious as expected (33% for online PM10 and 32% for online PM2.5). These phenomena suggested the variations of dominant emission sources or formation mechanisms at the different phases. In contrast to the changes to these pollutants, O3 increased by a factor of 2.13. The increase of O3 could be attributed to insufficient NO for its uptake via the titration effect (Pei et al., 2020). More further discussions on the gaseous pollutants variations in different phrases were conducted in Section 3.3.1.
3.2.2 Offline PM2.5 and Its Chemical Compositions
The time series of offline PM2.5 and major chemical species (OC, EC, sulfate, nitrate, ammonium, Fe) are shown in Figure 3. The mean offline PM2.5 concentrations were 67.9 ± 29.0 μg m−3, ranging from 17.4 to 157.4 μg m−3. Such levels were close to that observed in Changzhou in February 2017 (68.9 μg m−3) (Ye et al., 2019) but significantly lower than that (126.9 ± 50.4 μg m−3) in December 2015 to January 2016 in Changzhou (Ye et al., 2016). As mentioned in Section 3.2.1, the offline PM2.5 mass also exhibited a well-defined trend, with higher mass concentrations observed during January and relatively low values in November.
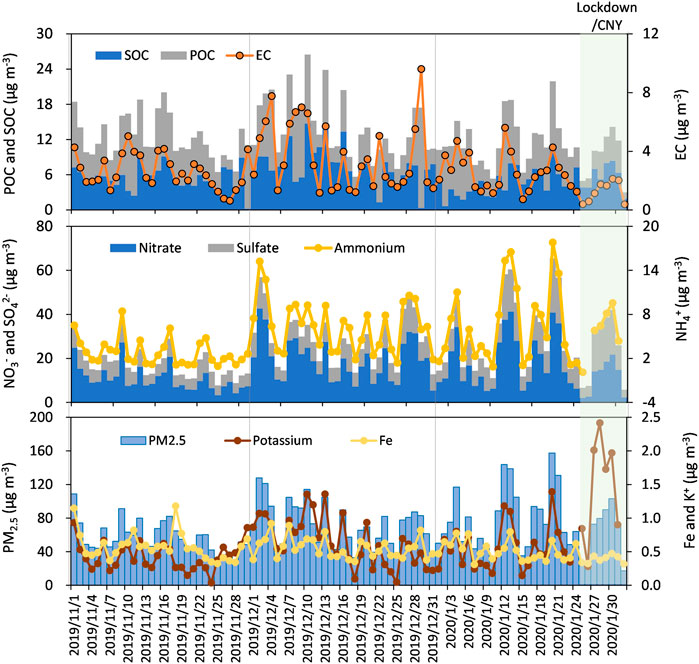
FIGURE 3. Daily variation of major chemical compositions in PM2.5 at the sampling site.
Supplementary Table S1 summarizes the statistical data for the water-soluble ions, carbonaceous fractions concentrations in PM2.5. For the carbonaceous fractions, the overall average concentrations of OC and EC were 12.4 ± 4.5 μg m−3 and 2.8 ± 1.8 μg m−3, respectively. A moderate correlation between OC and EC was observed (r = 0.66, figure not shown). The ratios of OC to EC ranged from 1.8 to 13.6, with an average of 5.3 ± 2.1, suggesting complex sources for OC likely include both primary emission and also secondary formation (Ye et al., 2016). As shown in Supplementary Figure S2, the (OC/EC)primary was 2.62, 1.78, and 2.71 in November, December, and January, respectively. Correspondingly, the estimated SOC was 6.0 ± 4.5 μg m−3 during the sampling period, accounting for ∼49.7% of OC. SOC/OC ratios were 45.4, 56.4, and 40.4 and 64.4% in November, December, January (before Jan. 24th) and the special period (Jan. 24th to Feb. 1st), respectively, demonstrating the importance of secondary aerosol formation, especially in December and the special period. A positive correlation between SOC/OC ratio and RH was observed in November and December (r = 0.44, figure not shown). That indicated that SOC formed at elevated levels of RH was likely part of water-soluble. However, in January, the SOC/OC ratio was not well correlated with RH. For the CNY overlapping lockdown period, high SOC/OC ratios could be explained by 1) the significant reduction of primary emissions leading to the relatively high contributions from secondary components; and 2) the enhancement of atmospheric oxidizing capacity and consequently strong photochemical processes due to the high levels of O3.
The sum of the concentrations of the water-soluble ions was 39.2 ± 18.4 μg m−3, accounting for ∼57.8% of the total PM2.5 mass. Among the water-soluble ions, Nitrate accounted for the largest fraction, with an average concentration of 15.8 ± 10.0 μg m−3, followed by SO42-, NH4+, Na+, Ca2+ and Cl−, with averages of 9.2 ± 4.5, 5.2 ± 4.0, 4.0 ± 0.6, 1.7 ± 0.5 and 1.6 ± 0.9 μg m−3, respectively. The concentrations of other ions (i.e., K+, Mg2+, F−, and NO2−) were relatively low. The fraction of the secondary inorganic compounds (sulfate, nitrate, and ammonium, namely as SNA) had the highest contributions (∼72.9% of total ions). Ion mass balance calculations were used to evaluate the acid-base balance of aerosol. The average ratio of anions and cations (AC ratio) was 0.85 (averages of 0.77, 0.89, and 0.88 for November, December, and January, respectively), suggesting that Changzhou PM2.5 was alkaline in the 2019 winter.
We further estimated the average aerosol acidity level ([H+]total) and in-situ acidity ([H+]in-situ) by E-AIM model, which described in Section 2.3.3 in supplement. The in-situ acidity of aerosols is an important parameter, because it could affect many acidity-dependent heterogeneous chemical processes (e.g., the oxidation of SO2, the hydrolysis of N2O5) on the aerosol surfaces. On average, the aerosol acidity levels in Changzhou (164 nmol m−3) were comparable with those in Shanghai (157 nmol m−3) (Zhao et al., 2015), but higher than those in Lanzhou (59 nmol m−3) and Guangzhou (90 nmol m−3) (Pathak et al., 2011). And the in-situ acidity was 90.3 nmol m−3, accounting for 55% of [H+]total. Previous study revealed that the [H+]in-situ was related to water content. In high levels of aerosol water content conditions, H2SO4 and HSO4− molecules would release more [H+]. But overall, it also dilutes the [H+] concentrations (moles per mole of aerosol water), making the aerosol less acidic (Pathak et al., 2004; Pathak et al., 2009). Thus, a large fraction of aerosol acidity releasing as in-situ acidity may related to the high levels of aerosol water content.
Among all species as shown in Figure 3, NH4+, NO3−, SO42-, K+, and EC showed low levels in November but some fluctuations from December to January. Comparatively, Fe remained stable (0.54 ± 0.17 μg m−3) throughout the entire observation period. PM2.5 showed three prominent peaks (December 1 ∼ 4, January 12 ∼14, and January 20 ∼ 21, respectively), which coincided with relatively high loadings of secondary inorganic ions (NH4+, NO3− and SO42−), OC, EC, and K+, indicating both contributions of direct combustion emissions and secondary aerosol formation during these episodes. However, from December 7th to 13th, the high PM2.5 mass co-varied with high loadings of POC, EC, and K+, but moderate loading of secondary inorganic ions, suggesting the primary combustion emissions played a more important role in PM2.5 pollution these days. In addition, the concentration K+ substantially rose in the Chinese New Year within the lockdown period. More frequent fireworks occurred for the celebrations. Major oxidizers in the fireworks include KNO3 or KClO4, which are common constitutes used to generate green flames and are widely used as coloring agents and stabilizers (Zhang et al., 2017). Besides, Sr(NO3)2 can be used to generate red color fireworks, while Cu can produce blue flames and be used as a catalyzer (Kong et al., 2015). These elements are important fireworks constitutes, thus exhibited significant correlations with K+ as shown in Supplementary Figure S3. Therefore, we concluded that K+ was more influenced by the traditional fireworks rather than biomass burning during this period.
3.3 Characteristics of Chemical Compositions in Different Phases
The study was divided into three phases based on the PM2.5 daily mass concentration thresholds established by the NAAQS as follows: low PM levels (clean) phase (PM2.5 ≤ 35 μg m−3, 6 days), moderate PM levels phase (35 < PM2.5 ≤ 75 μg m−3, 48 days) and high PM levels phase (PM > 75 μg m−3, polluted phase, 30 days). In addition, the local coronavirus broke out in Wuhan, China at the end of 2019 and was confirmed to be human-to-human transmission on 20 January 2020. Since then, several provincial administrative units in China have declared the highest level of public health emergency response and imposed national lockdown policies within a week (Pei et al., 2020). During the lockdown period, emissions from the traffic sector, industrial activities, construction sites, and eateries were markedly reduced (Pei et al., 2020). Therefore, the CNY covered lockdown period (9 days) was separately listed as the special changeover of anthropogenic emissions.
3.3.1 Variations of Gaseous Pollutants
For gaseous pollutants, the average concentrations of SO2, NO2, and CO were 12.4 μg m−3, 62.1 μg m−3, and 1.1 mg m−3 during the high PM levels phase, which were 1.5, 2.0, and 2.1 times higher than those of the clean phase, respectively. Among these, the increases of NO2 and CO were more remarkable, while the variation of SO2 was not obvious, indicating the importance of vehicle emissions on the polluted days. In contrast, O3 declined from 43.4 μg m−3 during the clean phase to 36.9 μg m−3 during more polluted phases. This could be attributed to the higher mass concentration of particles that weaken the radiation, as a result of the concentration of photochemical oxidants decreased (Zhang et al., 2018). The gaseous pollutants showed different responses to the COVID-19 lockdown. As previous studies revealed, the COVID-19 lockdown indeed helped reduce NOx levels with a substantial decrease in traffic volume and closure of small to middle sizes enterprises (Li et al., 2020; Pei et al., 2020). In Changzhou, the concentration of NO2 plunged to 16.6 μg m−3 during the special period, even 50% lower than that during the low PM level phase. The concentration level of SO2 is relatively steady (8.1 μg m−3), comparable with that during the low PM level phase.
3.3.2 Material Balance of PM2.5
The average chemical compositions of PM2.5 during different phases are presented in Figure 4, grouping as, secondary inorganic aerosols (i.e., sulfate, nitrate, and ammonium), EC, primary organic matter (POM), secondary organic matter (SOM), and others. The dust was calculated by dividing the measured elemental Fe concentration by 4% based on its composition in the Asian dust and Chinese loess (Zhang et al., 2003). Most studies estimated OM by OC with the empirical conversion factors ranging from 1.4 to 2.2 shown in the literature (Turpin and Lim, 2001). In this study, OM was divided into POM and SOM to assess the relative contributions of primary or secondary OM to PM2.5 during different phases. The POM concentrations were calculated as 1.2 times POC, while SOM concentrations were estimated as SOC multiplied by 1.8 because of the aerosol aging. The conversion factors were chosen based on the assumption that hydrocarbon-like organic aerosols were considered as the dominant aspect of the POM, while oxygenated organic aerosols were a priority in SOM because of the aging process.
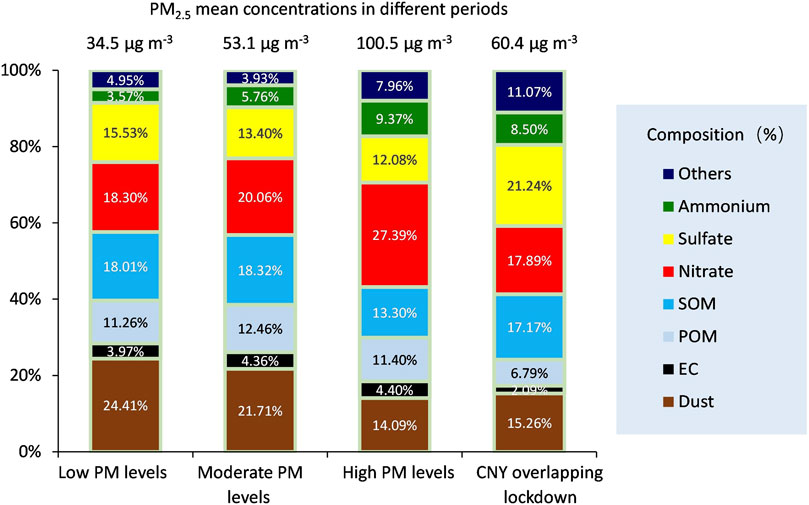
FIGURE 4. Material balance during different PM concentration level periods. [The campaign was divided into three levels depending on the threshold values of the PM2.5 concentrations as Low (≤35 μg m−3), moderate (35–75 μg m−3) and high (>75 μg m−3) PM concentration levels. And the CNY overlapping lockdown period was separately listed.].
Overall, PM2.5 mean concentrations were 34.5, 53.1, 100.5, and 60.4 μg m−3 during the low, moderate, high PM level phases and the special period, respectively. The quantified compounds were reconstructed for ∼95.0, 96.1, 92.0, and 88.9% of the measured PM2.5 mass during the different periods. The chemical compositions showed no obvious differences (approximately ±10%) between the low PM and moderate PM concentration phases (Figure 3), suggesting the primary emissions and secondary formations have not altered greatly between the two phases. From the clean to polluted phases, the compositions of different components varied. For example, the dust in PM2.5 decreased from 24.4 to 14.1%, while the fractions of ammonium and nitrate showed 2.6-fold and 1.5-fold increases, respectively. POM and EC had consistent contributions from the clean to the polluted phase indicating primary combustion emissions were steady. The proportion of SOM to PM2.5 declined from 26.1% (low PM level phase) to 13.3% (high PM level phase). SOA aerosol is a product of photochemical reactions (Zheng et al., 2013) while O3 is the crucial oxidant for the formation of SOA (Jimenez et al., 2009). Along the pollution periods, with the increase of particles, the concentration of photochemical oxidants decreased, and the photochemical reactions weakened, consequently, the concentration of SOM decreased.
Major compositions of PM2.5 showed significantly different patterns during the CNY overlapping lockdown period. Firstly, under a low emission scenario with the quarantine policy, the concentrations of POM and EC dropped by almost half compared with those during other phases, accounting for 6.8 and 2.1% of PM2.5 only. Secondly, the percentage of SOM to PM2.5 was 17.2%, lower than that of the clean phase but higher than that of polluted phases. However, there was a considerable rise in the SOM/POM ratio, from 1.2 to 1.6 during different PM level phases to 2.5 during the special period, suggesting the important contribution of SOA while the anthropological activities were terminated. Lastly, the proportion of sulfate increased obviously and became dominant (21.2%), while the proportion of nitrate decreased noticeably.
4 Discussions
Many factors influenced the concentration levels of air pollutants and the process of haze evolution, including meteorological conditions, emissions of primary pollutants, the conversion rate of secondary species, regional transport, etc. These factors will be discussed thoroughly in the following section.
4.1 Meteorological Influences
Meteorological conditions pose important effects on air quality. A previous study revealed that strong winds and precipitation would be effective in reducing air pollution (Liu et al., 2020). And, RH is generally regarded as one of the main factors facilitating the formation of secondary inorganic ions, which highly contributed to the episode events (Wu et al., 2019; Ye et al., 2019; Chen C. et al., 2020). A previous study conducted in Changzhou found that high PM2.5 concentrations typically appeared at high RH and low WS (Ye et al., 2019). Figures 1D,E displayed the major meteorological parameters (temperature, RH, WS, and precipitation) during the sampling period. The geography of Changzhou (e.g., lakes and rivers) sustain the RH at high levels. The mean temperature, RH and WS were 8.9 ± 4.7°C, 76.9 ± 12.2% and 1.7 ± 0.9 m s−1, respectively, demonstrating relatively high moisture and poor air diffusion. The averaged WS were 2.6, 1.7, 1.4, and 2.2 m s−1 during the low, moderate, high PM concentration phases and the special period, respectively, demonstrating that relatively low WS favored the accumulation of atmospheric pollutants such as airborne particles. And the relatively low PM concentrations were observed on the rainy days due to the wet scavenging effect. The high humidity environment could serve as reaction media promoting the secondary inorganic ions formation. The impact of RH on the secondary species formations will be further discussed in Section 4.1.2.
In addition, the regional sources and transport of air pollutants affect the local air quality (Xu et al., 2016). The 72 h air mass back trajectories starting 500 m above ground level at 00:00 UTC were calculated using the Hybrid single-particle Lagrangian integrated trajectory (HYSPLIT 4) model developed by the National Oceanic and Atmospheric Administration (NOAA) Air Resource Laboratory. The calculated back trajectories were conducted by cluster analysis (Supplementary Figure S4) to obtain the main transport pathway of air masses. During the moderate PM concentration level phase (Supplementary Figure S4B), moist air mass trajectories were in cluster 3 (accounting for 46.2% of the total clusters) from the north, passing through highly industrialized and densely populated areas (i.e., Hebei and Shandong Province). Approximately 36.5% of air masses transport originated from the Yellow Sea and the East China Sea, which expectedly brought relatively clean air to Changzhou. The rapid air masses (cluster 1 and cluster 2, a sum of 17.3%) came from the northwest, sweeping across the northern region of Xingjiang Province and the northwest region of Inner Mongolia. With strong wind and declined temperatures, these factors consequently reduced the pollution in Changzhou to some extent. During the clean phase (Supplementary Figure S4A), it can be seen that nearly all air masses originated from Mongolia, passed through the Yellow Sea and the East China Sea with fast speed before reaching Changzhou. Comparatively, during the polluted phases (Supplementary Figure S4C), the air masses mainly came from local areas (Cluster 3, 36.4%), or the nearby provinces (cluster 4 from the southwest: 24.2%; cluster 1 from the northwest: 33.3%). These slow air masses represent the stable synoptic conditions these days, which limited the vertical and horizontal diffusions of pollutants, trapped the gas precursors and primary emission pollutants, and finally favored the secondary formation and the accumulation of atmospheric pollutants. Only 6.1% of clusters came from the north with relatively fast speed.
4.2 Conversion of Secondary Species
4.2.1 Characteristics of Secondary Formation Indicators
In general, direct emissions from the sources as well as reactions between primary pollutants in the atmosphere contribute to the generation of ambient PM (Chang et al., 2011). In Section 3.3.2, we found that the secondary inorganic ions drove the haze formation in Changzhou, consistent with the findings in the previous local studies (Li et al., 2017; Seo et al., 2017). Sulfate and nitrate are the major constituents of PM2.5 which are mainly formed through atmospheric oxidation of SO2 emitted mainly from coal burning, and NOx emitted from vehicle exhaust and power plants in urban areas, respectively (Huang et al., 2014; Ye et al., 2019). To evaluate the gas-to-particle partitioning and secondary conversion degree, NOR (nitrogen oxidation ratio) and SOR (sulfur oxidation ratio) were used the conversion degree of NO2 and SO2 (Xu et al., 2017; Tang et al., 2021). Literature reported that SOR and NOR less than 0.1 represent primary emissions, and greater than 0.1 represent the significant oxidation of primary pollutants (NO2 and SO2) (Zhang et al., 2013; Liu et al., 2020). The average NOR and SOR were 0.20 ± 0.10 and 0.35 ± 0.12 respectively, suggesting sulfate and nitrate mainly formed from the secondary transformation. As shown in Figure 5, the NOR during the high PM level period was twice that during first week in lockdown period, whereas SOR only showed a slight increase from 0.30 to 0.39, indicating the higher oxidation rate of NO2 in more polluted airs. During the special period, NOR increased gently to 0.30 and SOR surged to 0.48. This could be explained by that SO2 and NOx competed to react with OH radicals to form sulfate and nitrate, respectively, in the photochemical reaction system. During the special period, a substantial decrease in NOx emissions resulted in a large increase of O3 as well as the atmospheric oxidizing capacity (Chen H. et al., 2020; Chang et al., 2020). When NOx is reduced but the oxidation capacity is kept constant, SO2 could participate more in photochemical reactions and form sulfate (Chen H. et al., 2020).
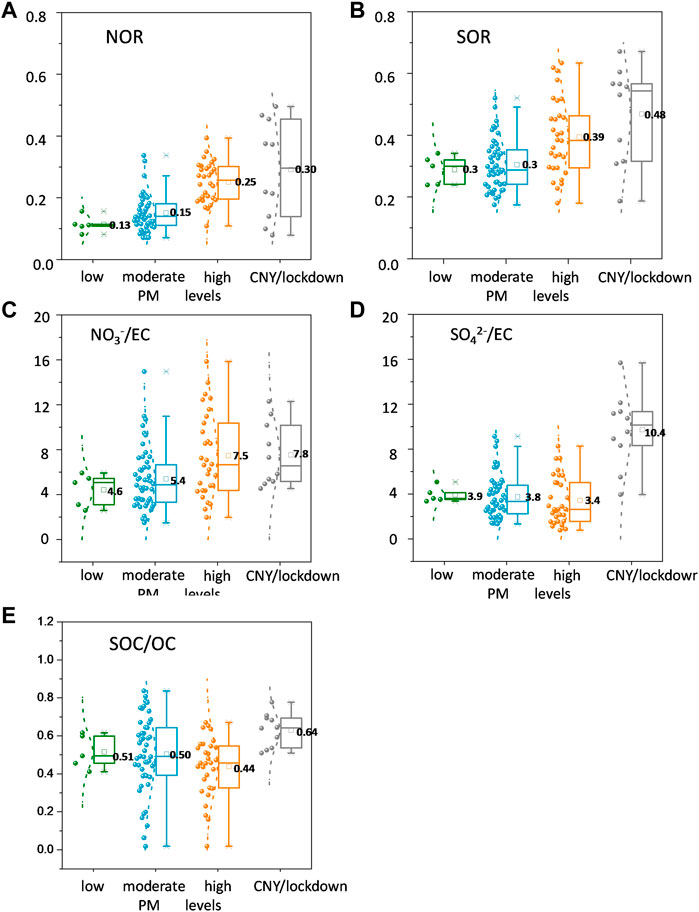
FIGURE 5. Box and whisker plots of variation of (A) NOR, (B) SOR, (C) NO3−/EC, (D) SO42-/EC and (E) SOC/OC in different phases. The mean (the small box), median (horizontal line), 25th and 75th percentiles (lower and upper box), and the 10th and 90th percentiles (lower and upper whiskers) are shown in the plots.
Besides, considering the variability of EC only controlled by emission intensity and atmospheric physical processes (such as the dilution/mixing effects at different boundary layer height), the EC-scaled concentrations of chemical species were used to isolate chemical processes from physical processes (Zhang et al., 2018). To assess the role of chemical outputs, the EC-scaled NO3− and SO42 were calculated and shown in Figures 5C,D. The EC-scaled NO3− showed obvious differences from that of SO42- during different periods. Along the low PM concentration to high PM concentration period, NO3−/EC ratio showed a rise from 4.6 to 7.5, while SO42−/EC ratio reduced mildly from 3.9 to 3.4, illustrating the increasing chemical production of NO3− but constant chemical production of SO42−. The phenomenon could be explained by the limited and low SO2 levels in Changzhou. However, during the special period, NO3−/EC ratio remained constant, but SO42−/EC ratio rose sharply to 10.4. Significantly reduction of NO2 from the large decrease of vehicle emissions and the closure of small and middle-sized enterprises. Different mechanisms of sulfate and nitrate formation might be the major reason for their variations of EC-scaled concentrations. Here, the contributions of SOC to OC during different periods were also discussed. The trend of SOC/OC was close to that of SO42−/EC, with a slight decrease from the clean (0.51) to polluted (0.44) periods, and a leap during the lockdown (0.64) period. The weakening of photochemical reactions caused by the aggravation of haze led to the reduction of SOA in PM2.5 (Zhang et al., 2018).
4.2.2 Formation Mechanisms of Secondary Species
As discussed above, the secondary conversion of gaseous precursors contributed a lot to the pollution events. Nitrate and sulfate form chemically from the oxidation of SO2 and NO2 through two major pathways: 1) homogeneous gas-phase oxidation of SO2 and NO2 by OH radicals, and 2) heterogeneous reactions on the particle surfaces (Cheng et al., 2016; Tian et al., 2016; Chen X. et al., 2020). RH was generally regarded as one of the main factors facilitating the formation of haze through heterogonous reaction (Cheng et al., 2016), while O3 was commonly regarded as an indicator of the atmospheric oxidation capacity or photochemical reaction (Ye et al., 2019; Chen H. et al., 2020).
We conducted further analysis of NOR, SOR, and SOC/OC as functions of RH and O3 concentrations to explore the underlying mechanism. As shown in Figure 6, SOR and NOR showed a positive relationship with RH, reached the maximum at 86–90%, and then decreased when RH exceeded 90%. It is noted that SOC/OC oscillated with RH increased. This suggests the contributions of aqueous-phase reaction on both the sulfate and nitrate formations under humid conditions because the heterogeneous reaction positively correlated with high RH. In contrast, no obvious relationship was found between SOC formation and RH. In addition, the increasing trend of SOR was more pronounced than that of NOR, indicating more importance of heterogeneous reactions to the secondary transformation of SO42−. Previous studies suggested that high levels of NO2 and transition metals promoted the conversion of SO2 to SO42− by aqueous-phase oxidation during winter haze rather than gas-phase oxidation (Sun et al., 2013; He et al., 2014; Ma et al., 2018). This could be ascribed with the weak photochemical activities resulting in insufficient production of oxidants (e.g., OH and H2O2 radicals) for gas-phase oxidation (Zheng et al., 2015). Those days with RH exceeded 90% were always associated with rainy, reversibly reducing the particulates concentrations efficiently, and thus led to the decreases of SOR and NOR.
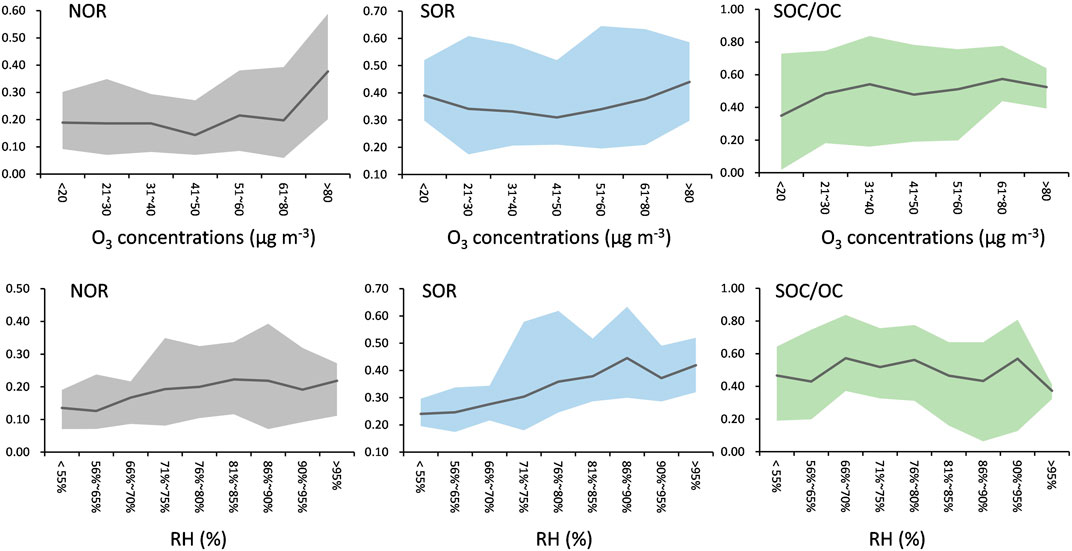
FIGURE 6. Variations of species (NOR, SOR and SOC/OC) as functions of RH and O3 concentrations. The solid lines represent the average values, and the shaded areas indicate the variation range.
It is found that SOC/OC was more sensitive when O3 was in relatively low concentrations (ranged from <20 to 40 μg m−3). It stayed at a stable level when O3 concentration levels rose >40 μg m−3. Comparatively, the NOR remained stable under a low O3 environment and rose substantially when O3 was higher than 40 μg m−3, while the SOR did not show obvious dependence with the variation of O3 concentrations. This suggests important contributions of photochemical reaction to SOC formation under relatively low O3 conditions, and the nitrate formation was driven by both photochemistry reaction and heterogeneous reaction during our sampling campaign.
4.2.3 Important Role of Ammonium
Ammonia is an important alkaline gas in the atmosphere which could react with acidic compounds including H2SO4, HNO3, and HCl to generate ammonium sulfate, ammonium nitrate, and ammonium chloride through gas phase and aqueous phase reactions (Zhao et al., 2015). As discussed in Section 3.3.2, from the clean to the polluted periods, the fractions of ammonium and nitrate increased from 18.3 to 27.4% and 3.57–9.37%, respectively (Figure 4), indicating that the co-increase of these two species had contributed to the aggravation of atmospheric pollution in Changzhou.
The formations of sulfate and nitrate were related to the existed amount of ammonium, namely, ammonia-rich (AR) or ammonia-poor (AP) conditions (Zhao et al., 2015), which estimated by ammonium to sulfate molar ratio (AR conditions: [NH4+]/[SO42−]> 1.5; AP conditions: [NH4+]/[SO42−]<1.5). It assumes that in AP conditions, all the NH3 is used to neutralize H2SO4 formed NH4HSO4 and (NH4)2SO4. Under AR conditions, the excess NH4+ could transfer HNO3 to NH4NO3 (Li et al., 2013; Griffith et al., 2015). In Changzhou, the average molar ratio of ammonium to sulfate was 1.4 ± 0.7, suggesting that the aerosol environment was generally at AP condition. About 61.7% of the samples in Changzhou in winter were ammonia-poor, indicating sulfate and nitrate were not neutralized by ammonium completely. Hence, sulfate and nitrate might have other ways to be chemically formed such as the heterogeneous reactions with crustal and marine species in PM2.5 (Li et al., 2013). Secondly, the comparisons among the different periods reveal that the [NH4+]/[SO42−] molar ratios were 0.6 ± 0.1, 1.1 ± 0.4, 2.1 ± 0.5, and 0.8 ± 0.4 during the low, moderate, high PM concentration levels, and the special periods, respectively. The higher value during the polluted periods represents that SO42− and NO3− could be neutralized by NH4+ and particulate sulfate and nitrate could be formed by gas-phase reactions of acid precursors with NH3. In addition, the in-situ acidity were 100.83 nmol m−3 (69.5% of the [H+]total), 90.68 nmol m−3 (60.4% of the [H+]total), 79.90 nmol m−3 (46.0% of the [H+]total) and 116.04 nmol m−3 (52.8% of the [H+]total) in low PM, moderate PM, high PM and the special period, respectively, as shown in Supplementary Figure S5. The lower concentrations [H+]total and [H+]in-situ obtaining in the polluted period indicated the important role of ammonium in neutralization in this period.
We further calculated the excess ammonium during the high PM concentration period using the below equation (Tian, et al., 2016).
The concentration is of excess ammonium well correlated with the nitrate concentrations (R2 = 0.61) as shown in Supplementary Figure S6. This indicates that the formation of nitrate was strongly associated with ammonium formation. Previous studies revealed that with the participation of ammonia during the daytime, NO2 reacts with OH radicals to form nitric acid, which is efficiently converted into particulate NO3−. O3 produced by NO2 photolysis during the daytime is consumed by the nighttime oxidation of NO2 to N2O5, which advances nitrate formation in the particle phase (Lu et al., 2019; Chen X. et al., 2020). This could be a possible reason for the high NO3− formation and contributions during the polluted periods.
4.4 Air Pollution Control Strategies in Changzhou
The four months observation in winter 2019 offers an opportunity to obtain the chemical compositions during different periods in Changzhou. And the CNY overlapped lockdown period provided a precious window to study how the air quality responds to the quick decline of anthropogenic emissions, which would be the critical basis to make atmospheric governance policies in the future (Pei et al., 2020).
For the elaboration and discussed in the above sections, the secondary inorganic ions were the most abundant species in PM2.5 in urban Changzhou, accounting for 37 to ∼50% during the clean and the polluted periods, respectively. Since NO3− contributed to a majority of the secondary inorganic ion formation during the high PM period in winter, reducing nitrate formation should rank as the highest priority for air pollution mitigation. Thus, the NOx emission control needs to be strengthened. Improvements on the denitrification technology for both industries and motor vehicle exhausts must be advocated (Niu et al., 2016). In addition, excess ammonium promoted the formation of nitrate during the high PM concentration period, indicating the critical role of NH3 in regulating atmospheric nitrate. Given NH4+ plays a vital role in the formation of fine inorganic secondary particles, particularly in the winter season (Sharma et al., 2007), there is a need to identify and regulate the ammonia emissions in Changzhou.
The SO2 emissions as well as ambient sulfate formation have shown a considerable drop since 2006 due to the nationwide implementation of flue gas desulphurization controls (Wang et al., 2013). After the execution in Changzhou, the sulfate contributions to PM2.5 are usually limited to ∼15% during the normal period. However, during the CNY covered lockdown period, the plummet of NOx emissions led to the rapid increase of O3 and the atmospheric oxidizing capacity, resulting in a leap of sulfate formation through photochemical reactions. This is similar to a “seesaw effect” between nitrate and sulfate. The benefit of nitrate reduction completely could be offset due to the significant increase of sulfate. Therefore, more attention should be paid to the impacts with the elevation of O3 while NOx emissions are reduced.
5 Conclusion
In this study, we evaluated the air quality and chemical compositions in the atmosphere of urban Changzhou, China during periods with different PM2.5 levels and the first week of city lockdown due to the outbreak of COVID-19. The analyses of NOR, SOR as functions of RH and O3 concentrations reveal that sulfate formation mainly from the aqueous-phase reaction, while nitrate formation was driven by both photochemistry and heterogeneous reaction. In addition, the concentrations of excess ammonium linearly correlated with nitrate concentration, indicating that the formation of nitrate was strongly associated with ammonium.
Under the low PM2.5 emission scenario during the CNY overlapping city lockdown, NO2 plummeted 65% due to the traffic sector being markedly reduced. However, there were gentle to moderate declines in SO2 and CO, as well as PMs. For the chemical compositions in PM2.5, POM and EC dropped significantly, well representing the remarkable reduction of primary emissions. The proportion of sulfate increased obviously and became dominant in PM2.5, whereas nitrate decreased observably. The declines of NOx emissions led to the rapid increase of O3 and the atmospheric oxidizing capacity, promoting sulfate formation through photochemical reactions. This finally offset the benefit of nitrate reduction. Our study illustrates a clear picture of the characteristics and responses of chemical compositions in PM2.5 during different periods in Changzhou in winter. The findings would serve as a critical basis for the establishment of atmospheric governance policies in the future.
Data Availability Statement
The original contributions presented in the study are included in the article/Supplementary Material, further inquiries can be directed to the corresponding authors.
Author Contributions
Conceptualization, ZZ and ZY; methodology, NS, DL and ST; formal analysis, ML and XZ; writing original draft preparation, ZZ and NS; writing review and editing, WZ, SM, and ZY; funding acquisition, ZZ, and ZY. All authors contributed to manuscript revision, read, and approved the submitted version.
Funding
State Key Laboratory of Loess and Quaternary Geology, Institute of Earth Environment, CAS (Number: SKLLQG1944); Jiangsu Innovation and Entrepreneurship Talents Plan 2020 (Number: (2020)30865); Jisangsu University of Technology, Program of Zhongwu Scientific research and innovation team (Number: 202101002).
Conflict of Interest
The authors declare that the research was conducted in the absence of any commercial or financial relationships that could be construed as a potential conflict of interest.
Publisher’s Note
All claims expressed in this article are solely those of the authors and do not necessarily represent those of their affiliated organizations, or those of the publisher, the editors and the reviewers. Any product that may be evaluated in this article, or claim that may be made by its manufacturer, is not guaranteed or endorsed by the publisher.
Supplementary Material
The Supplementary Material for this article can be found online at: https://www.frontiersin.org/articles/10.3389/fenvs.2022.907735/full#supplementary-material
References
Chang, L. T.-C., Tsai, J.-H., Lin, J.-M., Huang, Y.-S., and Chiang, H.-L. (2011). Particulate Matter and Gaseous Pollutants during a Tropical Storm and Air Pollution Episode in Southern Taiwan. Atmos. Res. 99 (1), 67–79. doi:10.1016/j.atmosres.2010.09.002
Chang, Y., Huang, R. J., Ge, X., Huang, X., Hu, J., Duan, Y., et al. (2020). Puzzling Haze Events in China during the Coronavirus (COVID-19) Shutdown. Geophys. Res. Lett., e2020GL088533.
Chen, C., Zhang, H., Li, H., Wu, N., and Zhang, Q. (2020a). Chemical Characteristics and Source Apportionment of Ambient PM1.0 and PM2.5 in a Polluted City in North China Plain. Atmos. Environ. 242, 117867. doi:10.1016/j.atmosenv.2020.117867
Chen, H., Huo, J., Fu, Q., Duan, Y., Xiao, H., and Chen, J. (2020b). Impact of Quarantine Measures on Chemical Compositions of PM2.5 during the COVID-19 Epidemic in Shanghai, China. Sci. Total Environ. 743, 140758. doi:10.1016/j.scitotenv.2020.140758
Chen, X., Wang, H., Lu, K., Li, C., Zhai, T., Tan, Z., et al. (2020c). Field Determination of Nitrate Formation Pathway in Winter Beijing. Environ. Sci. Technol. 54 (15), 9243–9253. doi:10.1021/acs.est.0c00972
Cheng, Y., Zheng, G., Wei, C., Mu, Q., Zheng, B., Wang, Z., et al. (2016). Reactive Nitrogen Chemistry in Aerosol Water as a Source of Sulfate during Haze Events in China. Sci. Adv. 2 (12), e1601530. doi:10.1126/sciadv.1601530
Decarlo, P. F., Ulbrich, I. M., Crounse, J., De Foy, B., Dunlea, E. J., Aiken, A. C., et al. (2010). Investigation of the Sources and Processing of Organic Aerosol over the Central Mexican Plateau from Aircraft Measurements during MILAGRO. Atmos. Chem. Phys. 10 (12), 5257–5280. doi:10.5194/acp-10-5257-2010
Fu, X., Wang, S., Zhao, B., Xing, J., Cheng, Z., Liu, H., et al. (2013). Emission Inventory of Primary Pollutants and Chemical Speciation in 2010 for the Yangtze River Delta Region, China. Atmos. Environ. 70, 39–50. doi:10.1016/j.atmosenv.2012.12.034
Griffith, S. M., Huang, X. H. H., Louie, P. K. K., and Yu, J. Z. (2015). Characterizing the Thermodynamic and Chemical Composition Factors Controlling PM 2.5 Nitrate: Insights Gained from Two Years of Online Measurements in Hong Kong. Atmos. Environ. 122, 864–875. doi:10.1016/j.atmosenv.2015.02.009
He, H., Wang, Y., Ma, Q., Ma, J., Chu, B., Ji, D., et al. (2014). Mineral Dust and NOx Promote the Conversion of SO2 to Sulfate in Heavy Pollution Days. Sci. Rep. 4, 4172. doi:10.1038/srep04172
Huang, R-J., Zhang, Y., Bozzetti, C., Ho, K-F., Cao, J-J., Han, Y., et al. (2014). High Secondary Aerosol Contribution to Particulate Pollution during Haze Events in China. Nature 514, 218-222. doi:10.1038/nature13774
Jimenez, J. L., Canagaratna, M. R., Donahue, N. M., Prevot, A. S. H., Zhang, Q., Kroll, J. H., et al. (2009). Evolution of Organic Aerosols in the Atmosphere. Science 326 (5959), 1525–1529. doi:10.1126/science.1180353
Le, T., Wang, Y., Liu, L., Yang, J., Yung, Y. L., Li, G., et al. (2020). Unexpected Air Pollution with Marked Emission Reductions during the COVID-19 Outbreak in China. Science 369 (6504), 702–706. doi:10.1126/science.abb7431
Li, H., Ma, Y., Duan, F., He, K., Zhu, L., Huang, T., et al. (2017). Typical Winter Haze Pollution in Zibo, an Industrial City in China: Characteristics, Secondary Formation, and Regional Contribution. Environ. Pollut. 229, 339–349. doi:10.1016/j.envpol.2017.05.081
Li, L., Li, Q., Huang, L., Wang, Q., Zhu, A., Xu, J., et al. (2020). Air Quality Changes during the COVID-19 Lockdown over the Yangtze River Delta Region: An Insight into the Impact of Human Activity Pattern Changes on Air Pollution Variation. Sci. Total Environ. 732, 139282. doi:10.1016/j.scitotenv.2020.139282
Li, X., Wang, L., Ji, D., Wen, T., Pan, Y., Sun, Y., et al. (2013). Characterization of the Size-Segregated Water-Soluble Inorganic Ions in the Jing-Jin-Ji Urban Agglomeration: Spatial/temporal Variability, Size Distribution and Sources. Atmos. Environ. 77, 250–259. doi:10.1016/j.atmosenv.2013.03.042
Liu, X., Pan, X., Wang, Z., He, H., Wang, D., Liu, H., et al. (2020). Chemical Characteristics and Potential Sources of PM2.5 in Shahe City during Severe Haze Pollution Episodes in the Winter. Aerosol Air Qual. Res. 20 (12), 2741–2753. doi:10.4209/aaqr.2020.03.0124
Lu, K., Fuchs, H., Hofzumahaus, A., Tan, Z., Wang, H., Zhang, L., et al. (2019). Fast Photochemistry in Wintertime Haze: Consequences for Pollution Mitigation Strategies. Environ. Sci. Technol. 53 (18), 10676–10684. doi:10.1021/acs.est.9b02422
Ma, J., Chu, B., Liu, J., Liu, Y., Zhang, H., and He, H. (2018). NO Promotion of SO2 Conversion to Sulfate: An Important Mechanism for the Occurrence of Heavy Haze during Winter in Beijing. Environ. Pollut. 233, 662–669. doi:10.1016/j.envpol.2017.10.103
Ma, T., Duan, F., He, K., Qin, Y., Tong, D., Geng, G., et al. (2019). Air Pollution Characteristics and Their Relationship with Emissions and Meteorology in the Yangtze River Delta Region during 2014-2016. J. Environ. Sci. 83, 8–20. doi:10.1016/j.jes.2019.02.031
Niu, X., Cao, J., Shen, Z., Ho, S. S. H., Tie, X., Zhao, S., et al. (2016). PM2.5 from the Guanzhong Plain: Chemical Composition and Implications for Emission Reductions. Atmos. Environ. 147, 458–469. doi:10.1016/j.atmosenv.2016.10.029
Pathak, R. K., Wang, T., Ho, K. F., and Lee, S. C. (2011). Characteristics of Summertime PM2.5 Organic and Elemental Carbon in Four Major Chinese Cities: Implications of High Acidity for Water-Soluble Organic Carbon (WSOC). Atmos. Environ. 45 (2), 318–325. doi:10.1016/j.atmosenv.2010.10.021
Pathak, R. K., Wu, W. S., and Wang, T. (2009). Summertime PM<sub>2.5</sub> Ionic Species in Four Major Cities of China: Nitrate Formation in an Ammonia-Deficient Atmosphere. Atmos. Chem. Phys. 9 (5), 1711–1722. doi:10.5194/acp-9-1711-2009
Pathak, R., Louie, P. K. K., and Chan, C. K. (2004). Characteristics of Aerosol Acidity in Hong Kong. Atmos. Environ. 38 (19), 2965–2974. doi:10.1016/j.atmosenv.2004.02.044
Pei, Z., Han, G., Ma, X., Su, H., and Gong, W. (2020). Response of Major Air Pollutants to COVID-19 Lockdowns in China. Sci. Total Environ. 743, 140879. doi:10.1016/j.scitotenv.2020.140879
Qian, W., Wang, X., Huang, R., Wu, J., Xiao, Y., Hu, M., et al. (2021). Regional Transport of PM2.5 and O3 Based on Complex Network Method and Source Apportionment Technology in the Yangtze River Delta. China.
Seo, J., Kim, J. Y., Youn, D., Lee, J. Y., Kim, H., Lim, Y. B., et al. (2017). On the Multiday Haze in the Asian Continental Outflow: the Important Role of Synoptic Conditions Combined with Regional and Local Sources. Atmos. Chem. Phys. 17 (15), 9311–9332. doi:10.5194/acp-17-9311-2017
Sharma, M., Kishore, S., Tripathi, S. N., and Behera, S. N. (2007). Role of Atmospheric Ammonia in the Formation of Inorganic Secondary Particulate Matter: A Study at Kanpur, India. J. Atmos. Chem. 58 (1), 1–17. doi:10.1007/s10874-007-9074-x
Sun, Y., Lei, L., Zhou, W., Chen, C., He, Y., Sun, J., et al. (2020). A Chemical Cocktail during the COVID-19 Outbreak in Beijing, China: Insights from Six-Year Aerosol Particle Composition Measurements during the Chinese New Year Holiday. Sci. Total Environ. 742, 140739. doi:10.1016/j.scitotenv.2020.140739
Sun, Y., Wang, Z., Fu, P., Jiang, Q., Yang, T., Li, J., et al. (2013). The Impact of Relative Humidity on Aerosol Composition and Evolution Processes during Wintertime in Beijing, China. Atmos. Environ. 77 (0), 927–934. doi:10.1016/j.atmosenv.2013.06.019
Tang, M., Liu, Y., He, J., Wang, Z., Wu, Z., and Ji, D. (2021). In Situ continuous Hourly Observations of Wintertime Nitrate, Sulfate and Ammonium in a Megacity in the North China Plain from 2014 to 2019: Temporal Variation, Chemical Formation and Regional Transport. Chemosphere 262, 127745. doi:10.1016/j.chemosphere.2020.127745
Tian, M., Wang, H., Chen, Y., Yang, F., Zhang, X., Zou, Q., et al. (2016). Characteristics of Aerosol Pollution during Heavy Haze Events in Suzhou, China. Atmos. Chem. Phys. 16 (11), 7357–7371. doi:10.5194/acp-16-7357-2016
Turpin, B. J., and Huntzicker, J. J. (1995). Identification of Secondary Organic Aerosol Episodes and Quantitation of Primary and Secondary Organic Aerosol Concentrations during SCAQS. Atmos. Environ. 29 (23), 3527–3544. doi:10.1016/1352-2310(94)00276-q
Turpin, B. J., and Lim, H.-J. (2001). Species Contributions to PM2.5 Mass Concentrations: Revisiting Common Assumptions for Estimating Organic Mass. Aerosol Sci. Technol. 35 (1), 602–610. doi:10.1080/02786820119445
Wang, Y., Zhang, Q. Q., He, K., Zhang, Q., and Chai, L. (2013). Sulfate-nitrate-ammonium Aerosols over China: Response to 2000-2015 Emission Changes of Sulfur Dioxide, Nitrogen Oxides, and Ammonia. Atmos. Chem. Phys. 13 (5), 2635–2652. doi:10.5194/acp-13-2635-2013
Wu, C., Huang, X. H. H., Ng, W. M., Griffith, S. M., and Yu, J. Z. (2016). Inter-comparison of NIOSH and IMPROVE Protocols for OC and EC Determination: Implications for Inter-protocol Data Conversion. Atmos. Meas. Tech. 9 (9), 4547–4560. doi:10.5194/amt-9-4547-2016
Wu, C., and Yu, J. Z. (2016). Determination of Primary Combustion Source Organic Carbon-To-Elemental Carbon (OC/EC) Ratio Using Ambient OC and EC Measurements: Secondary OC-EC Correlation Minimization Method. Atmos. Chem. Phys. 16 (8), 5453–5465. doi:10.5194/acp-16-5453-2016
Wu, L., Sun, J., Zhang, X., Zhang, Y., Wang, Y., Zhong, J., et al. (2019). Aqueous-phase Reactions Occurred in the PM2.5 Cumulative Explosive Growth during the Heavy Pollution Episode (HPE) in 2016 Beijing Wintertime. Tellus B Chem. Phys. Meteorology 71 (1), 1620079. doi:10.1080/16000889.2019.1620079
Xu, J.-S., Xu, H.-H., Xiao, H., Tong, L., Snape, C. E., Wang, C.-J., et al. (2016). Aerosol Composition and Sources during High and Low Pollution Periods in Ningbo, China. Atmos. Res. 178-179, 559–569. doi:10.1016/j.atmosres.2016.05.006
Xu, J.-S., Xu, M.-X., Snape, C., He, J., Behera, S. N., Xu, H.-H., et al. (2017). Temporal and Spatial Variation in Major Ion Chemistry and Source Identification of Secondary Inorganic Aerosols in Northern Zhejiang Province, China. Chemosphere 179, 316–330. doi:10.1016/j.chemosphere.2017.03.119
Ye, S., Ma, T., Duan, F., Li, H., He, K., Xia, J., et al. (2019). Characteristics and Formation Mechanisms of Winter Haze in Changzhou, a Highly Polluted Industrial City in the Yangtze River Delta, China. Environ. Pollut. 253, 377–383. doi:10.1016/j.envpol.2019.07.011
Ye, Z., Liu, J., Gu, A., Feng, F., Liu, Y., Bi, C., et al. (2016). Chemical Characterization of Fine Particular Matter in Changzhou, China and Source Apportionment with Offline Aerosol Mass Spectrometry. Atmos. Chem. Phys. Discuss., 1–46.
Zhang, C., Litao Wang, L., Qi, M., Ma, X., Zhao, L., Ji, S., et al. (2018). Evolution of Key Chemical Components in PM2.5 and Potential Formation Mechanisms of Serious Haze Events in Handan, China. Aerosol Air Qual. Res. 18 (7), 1545–1557. doi:10.4209/aaqr.2017.10.0386
Zhang, F., Xu, L., Chen, J., Chen, X., Niu, Z., Lei, T., et al. (2013). Chemical Characteristics of PM2.5 during Haze Episodes in the Urban of Fuzhou, China. Particuology 11 (3), 264–272. doi:10.1016/j.partic.2012.07.001
Zhang, J., Yang, L., Chen, J., Mellouki, A., Jiang, P., Gao, Y., et al. (2017). Influence of Fireworks Displays on the Chemical Characteristics of PM2.5 in Rural and Suburban Areas in Central and East China. Sci. Total Environ. 578, 476–484. doi:10.1016/j.scitotenv.2016.10.212
Zhang, Q., Zheng, Y., Tong, D., Shao, M., Wang, S., Zhang, Y., et al. (2019). Drivers of Improved PM 2.5 Air Quality in China from 2013 to 2017. Proc. Natl. Acad. Sci. U.S.A. 116 (49), 24463–24469. doi:10.1073/pnas.1907956116
Zhang, X. Y., Gong, S. L., Arimoto, R., Shen, Z. X., Mei, F. M., Wang, D., et al. (2003). Characterization and Temporal Variation of Asian Dust Aerosol from a Site in the Northern Chinese Deserts. J. Atmos. Chem. 44 (3), 241–257. doi:10.1023/a:1022900220357
Zhao, M., Qiao, T., Huang, Z., Zhu, M., Xu, W., Xiu, G., et al. (2015). Comparison of Ionic and Carbonaceous Compositions of PM 2.5 in 2009 and 2012 in Shanghai, China. Sci. Total Environ. 536, 695–703. doi:10.1016/j.scitotenv.2015.07.100
Keywords: secondary formation, oxidation capacity, anthropogenic emission, different periods, PM2.5
Citation: Zhao Z, Sun N, Zhou W, Ma S, Li X, Li M, Zhang X, Tang S and Ye Z (2022) Chemical Compositions in Winter PM2.5 in Changzhou of the Yangtze River Delta Region, China: Characteristics and Atmospheric Responses Along With the Different Pollution Levels. Front. Environ. Sci. 10:907735. doi: 10.3389/fenvs.2022.907735
Received: 30 March 2022; Accepted: 25 April 2022;
Published: 30 May 2022.
Edited by:
Lang Liu, Northwestern Polytechnical University, ChinaReviewed by:
Cheng Hu, Nanjing Forestry University, ChinaJun He, The University of Nottingham Ningbo, China
Copyright © 2022 Zhao, Sun, Zhou, Ma, Li, Li, Zhang, Tang and Ye. This is an open-access article distributed under the terms of the Creative Commons Attribution License (CC BY). The use, distribution or reproduction in other forums is permitted, provided the original author(s) and the copyright owner(s) are credited and that the original publication in this journal is cited, in accordance with accepted academic practice. No use, distribution or reproduction is permitted which does not comply with these terms.
*Correspondence: Zhuzi Zhao, emhhb3p6QGpzdXQuZWR1LmNu; Zhaolian Ye, YmVzc195ZUBqc3R1LmVkdS5jbg==