
94% of researchers rate our articles as excellent or good
Learn more about the work of our research integrity team to safeguard the quality of each article we publish.
Find out more
ORIGINAL RESEARCH article
Front. Environ. Sci., 23 September 2022
Sec. Environmental Economics and Management
Volume 10 - 2022 | https://doi.org/10.3389/fenvs.2022.907311
This article is part of the Research TopicGreen Innovation and Industrial Ecosystem Reconstruction in Achieving Environmental SustainabilityView all 34 articles
 Hongzhen Liang1,2*
 Hongxing Yao3*
“Made in China” has spread all over the world, and China has the status of “world factory”. However, the weak ability of independent innovation has affected the sustainable development of China’s manufacturing industry. The industrial revolution with digital and intelligent manufacturing as the core is coming. In the future, our development is not fast, and the key is how to be sustainable and healthy. The development of zero carbon vehicles such as intelligent transportation and electric vehicles is one of the highlands of technological competition in the transportation field, and it is also the core measure to achieve carbon peak and carbon neutralization. Identifying important firms in the automobile industry has always been a topical issue. This study used the transaction data of listed companies in China’s automobile manufacturing industry to build a complex network based on the quantitative data of enterprise development status using network modeling and the multi-attribute decision evaluation method. The relationship between the network structure of the financial market and the multi-index sustainability evaluation of enterprises were also studied. By extracting the financial information of environmental protection investment from the social responsibility reports of listed companies and analyzing the current status of target investment in the automobile manufacturing industry, the research shows that the current environmental protection investment in the automobile manufacturing industry is not strong and the government needs to increase supervision. The finding reveals three dynamic relationships for practical impact. The empirical result verifies that our method is effective and reliable. This approach can effectively overcome the effect of subjective factors on evaluation and provide sustainable evaluation strategy suggestions for investors in the automobile manufacturing industry.
As we all know, China is a large manufacturing country. Manufacturing is an important basis for China’s economic growth and the key to whether China’s economy can grow steadily. Among them, the automobile manufacturing industry has become the cornerstone of China’s manufacturing industry. As one of the main sectors of China’s energy consumption and carbon emission, the automobile industry’s carbon peaking and carbon neutralization is of great significance to the realization of China’s vision of carbon peaking and carbon neutralization (Sun et al., 2021a). Green and low-carbon transformation has become a world trend, and China will face great challenges. The development of zero carbon vehicles such as public transportation, intelligent transportation, electric vehicles, and hydrogen fuel vehicles is not only one of the highlands of technological competition in the transportation field but also the core measure to achieve carbon peak and carbon neutralization (Sun et al., 2021b). More and more people pay attention to how to evaluate the sustainable development of the automobile manufacturing industry, and how to evaluate the automobile manufacturing industry from the perspective of financial analysis is the research focus of this article.
The importance of the type of methodology adopted in research cannot be overestimated. The traditional financial analysis methods, such as principal component analysis (PCA), random matrix analysis (RMA), and cluster analysis (CA), are of great significance to investment theory and risk management. They have developed theories such as efficiency market hypothesis, asset pricing model, Markowitz portfolio model, Black–Scholes formula, and many other theoretical models which have been widely used. With the development of the complex network, financial market research has a new perspective. For instance, suppose the listed company is abstracted as a point and the relationship between the stocks issued by the listed company is taken as an edge, in that case a financial market network is constructed. Many scholars use complex network theory to study the financial economy and have achieved many meaningful research results. It all started with Mantegna (1999) who introduced the network analysis method into stock market research giving a firm foundation for other authors to propagate relevant theories. Vandewalle et al. (2001) used the correlation coefficient between stocks to establish a dependency network theory. Bonanno et al. (2004), Tse et al. (2010), and Acemoglu et al. (2012) extracted economic information from the correlation coefficient matrix of stocks and studied the hierarchical relationship of the stock market, which showed that the interaction between network nodes is an internal propagation. This interaction expands the effect from the micro-level. Minoru et al. (2013) analyzed financial relevance as the prediction index of the banking system risk, whereas Hautsch et al. (2015) proposed the realized systemic risk beta to measure financial companies’ contribution to the systemic risk. From the financial point of view, the development of companies must have the characteristics of sustainability, that is, without exhausting financial resources, companies finance has the greatest possibility of growth. The value of an enterprise largely depends on its future profitability and the future growth of operating income, income, and dividends, rather than the income obtained by the enterprise in the past or at present. Assessing the sustainable development ability of enterprises can inhibit the short-term behavior of enterprises and help to improve the modern enterprise system. The short-term behavior of enterprises focuses on pursuing immediate profits and ignoring the preservation and appreciation of enterprise assets. In order to achieve short-term profits, some enterprises do not hesitate to spend equipment and calculate less expenses and costs. Research on how to find sustainable development ability of enterprises is becoming more and more popular, and identifying a nodes’ importance of complex networks brings this research a new perspective.
Sustainable development also means that environmental concerns and considerations are included in development plans and policies, and the social responsibility of enterprises is becoming more and more important. Cormier et al. (2011) studied the role of environmental accounting information disclosure and social responsibility information disclosure in reducing information asymmetry between investors and managers in the form of investigation and found that environmental accounting information disclosed in the paper form can reduce information asymmetry in the stock market. When the uncertainty of economic policy rises, the enthusiasm of companies to voluntarily release social responsibility reports increases (Liu and Yongjia, 2020). The quality of social responsibility information disclosure has also improved significantly. The environmental protection cost of listed companies in China has the anti-stickiness characteristic of “easy to fall but difficult to rise”, whereas government subsidies can restrain the anti-stickiness of environmental protection cost of enterprises (Wang and chen, 2021). Government subsidies exert a restraining effect by improving the capital capacity of enterprises’ environmental protection investment and weakening the willingness of enterprises to conduct earnings management through environmental protection expenses. The environmental tax burden of enterprises significantly promotes their environmental protection investment, which is more significant in politically related enterprises and more significant in regions with low marketization process (Wang and cao, 2022).
In recent years, the research on identifying nodes’ importance of complex networks has attracted much attention due to its great theoretical significance and the wide range of applications. These nodes can affect the structure and functions of the network (Linyuan et al., 2016). There are various methods to evaluate the importance of nodes by using network topology. The commonly used methods include the degree centrality method (Bonacich, 1972), betweenness centrality method (Estrada and Rodríguez-Velázquez, 2005), K-shell decomposition method (Kitsap et al., 2010), and PageRank method (Lü et al., 2016). Liu et al. (2016) then used different equations to evaluate the propagation process to rank the importance of nodes. In addition to that, Zeng and Cheng (2013) proposed a mixed degree decomposition (MDD) procedure in which both the residual degree and the exhausted degree are considered. Furthermore, Gao et al. (2014) proposed local structure centrality according to the properties of nodes and their neighbors. Again, Ma and Ma (2017) propagated mixed degree centrality theory based on network topology. Wang et al. (2017) also developed a new node importance evaluation method according to the location of nodes and the properties of their neighbors, and all these methods can evaluate the performance through tuning parameter. Ai (2017) introduced the entropy change theory and sorts the importance of nodes by using the change of network entropy after removing nodes. Fu et al. (2015) developed a double-layer network node evaluation method; as the result, Bian et al. (2017) used multi-attribute decision-making technology to improve the accuracy of node importance evaluation.
Based on the influence of node neighbors, some evaluation methods were proposed, which are based on iterative neighbor information or multiple influence matrix by analyzing the location importance of nodes and the dependencies between all nodes in the network (Wang and Guo, 2017; Xu et al., 2017). In addition to the aforementioned method of obtaining the local information of complex networks, Chen et al. (2012) proposed semi-local centrality, and Bonan et al. (Bonan et al., 2012) comprehensively evaluated the importance of nodes by considering multi-index evaluation and calculating the combined measurement of different indexes such as degree value, intermediate number, and K-shell of nodes based on Euler distance formula. Kong et al. (2018) proposed two more comprehensive node importance evaluation methods based on the evaluation results of a complex network dynamic model, disturbance test, and failure test. Gao et al. (2013) combined the degree of nodes and the strength to form a new index to represent the importance of nodes. Zhao et al. (2009) proposed identifying important nodes by an importance contribution matrix.
Zhou et al. (2012) proposed the importance evaluation matrix, which combines the degree and efficiency indicators to characterize the important contribution between adjacent nodes. The third-order influence criterion proposed by Fowler (2008) points out that nodes will affect the associated nodes within the third-order range. Fan and Liu (2014) and Hu et al. (2015) proposed important node identification methods based on the transmission efficiency matrix and importance incidence matrix, respectively, considering the important contribution of non-neighbor nodes to nodes, which expanded the influence range of nodes. Chen et al. (2019) work on a centrality fusion index related to communication influence, which identifies the importance of nodes by integrating the traditional centrality and the communication influence of nodes. Jiang et al. (2018) then proposed an important identification method that considers the bridging characteristics of nodes, which believes that the more pairs of nodes with the shortest path passing through the target node, the less the number of shortest paths between adjacent nodes and the more significant the bridge function and structural importance of the nodes are. Zareie et al. (2019) method on node ranking based on neighbor diversity effectively improves the accuracy of algorithm ranking. Based on the shell values of nodes and multi-order neighbor’s in the network, Wang et al. (2019) put forward a vector centrality algorithm for multi-order neighbor’s shell numbers, which revealed the relative importance of nodes in the complex network in the vector form.
HE et al. (2013) evaluated the impact of the supply network and network stability according to the stock ratio relationship among enterprises. Zhao and Liu (2016) took new energy vehicles as an example to simulate the evolution path of the innovation network. Liu and Zhao (2016) divided the innovation network into three situations: the stage of substantial financial subsidies, stage of subsidy reduction, and stage after partial withdrawal of subsidies. The author simulated the operation mechanism of three types of innovation networks before and after the withdrawal of financial subsidies and analyzed the characteristics of network evolution under different dynamic forces. Zhang and Qian (2021) described the characteristics of China’s new energy vehicle of patent innovation network during rapid industrial development from 2009 to 2014 from the dimensions of region and subject nature.
Liu and Qian (2019) constructed a patent cooperation network based on the patent joint application data of China’s new energy vehicle industry and investigated its topological structure, evolution path, and spatial structure evolution process in time intervals. Wang et al. (2020) built an organization cooperation network, member cooperation network, and a knowledge fusion innovation network. This was based on the patent application data in the field of new energy vehicles in China and quantified the structural hole characteristics in the network. Zhou and Zhu (2018) used the life cycle sustainability assessment method to assess the environmental, economic, and social dimensions of the performance of pure electric vehicles and fuel-fired vehicles. Overall, the life cycle sustainability assessment results of pure electric vehicles are better.
Some studies have explored the importance of nodes from the topology perspective without considering each node’s characteristics. These studies only consider the optimal path length when measuring the contribution rate of importance. The evaluation performance of some methods depends on the performance of the combination mode as there is a certain gap with the true importance of the nodes. The important influence between nodes is closely related to the shortest path and the information dissemination rate. The existing important evaluation of nodes based on local network structure focuses on the research of node attributes. Extant literature did not fully consider the influence of the structural characteristics between nodes and neighbors on the node propagation force. The large-scale complex network structure changes with time, and it is relatively difficult to obtain complete network structure data. There are certain limitations to quantifying the importance of nodes through global information. There is also a lack of evaluation of the network in terms of multiple indicators. There is, therefore, the need for further sustainability analysis to deepen knowledge and understanding.
The existing research results provide the basis for building China’s automobile financial market network. However, many of the studies only focus on partial and quantitative approach. There is gap in literature about the relationship between the correlation of enterprises and the evaluation of enterprise development. The impact of enterprises on the manufacturing industry is less explored, and the evaluation and application of clustering coefficient, betweenness, and H-index in the network structure are few. Based on the existing research, this study makes further in-depth research to find out the influential diffusion and communication mechanism of important nodes in the development of the industry and focuses on the relationship between the network structure of listed companies in China’s automobile manufacturing industry and enterprise sustainability evaluation to provide a scientific basis for the enterprise sustainability assessment.
The first year of China’s 14th 5 year plan was 2021. Standing at the new historical intersection, the automotive industry has also ushered in unprecedented changes. The trend of the automotive industry toward electrification, intelligence, networking, sharing, and greening is becoming more and more obvious. From the guiding direction of the national manufacturing industry, the development trend of the automobile industry toward electrification, intelligence, networking, sharing, and greening is becoming more and more obvious (Hui et al., 2013). Facts have also proved that enterprises that conform to the direction of technology, environmental protection, and shared interconnection have a better sustainable development (Zuo, 1988).
The nodes in China’s automobile financial market network are the listed companies in the automobile manufacturing industry. The relationship between the changes of stocks issued by the listed companies is defined as edge. The correlation coefficient of the returns of two stocks in a specific time can be considered the relationship between them. There are N stocks in the financial market. The duration is n trading days. pi(t) represents the closing price of the stock I on day t, and the logarithmic returns of the two stocks are Yi and Yj, respectively, as follows:
The correlation coefficient of price fluctuation of the two stocks is as follows:
where < > represents mathematical expectation,
According to the correlation coefficient of any stock price volatility return, the corresponding correlation coefficient matrix C is constructed. C is a symmetric matrix, expressed as
In this way, the association network of stocks can be established. The graph G = (V, E) represents the financial market network, where V is the set point composed of stocks, and e represents the edge set between nodes, shown below:
Degree refers to the number of points connecting to other network points. Degree centrality is the most direct indicator to describe node centrality in a network analysis. The greater the degree of a node, the higher the degree centrality of the node, which means the more important the node is in the network, the larger the company in the automotive financial market network. The more companies have relationships, the greater its influence.
The clustering coefficient indicates the degree of aggregation between the nodes’ neighbors. If there is a relationship between the two companies, there is a “length of one” connection between them by default. The kedges connected to the node may constitute
Betweenness is an index based on the path rather than the node, representing the influence of the point in the network. The Betweenness of node i means the number of nodes i passing through all the shortest paths in the network, expressed as
The H-index of listed companies in the automobile manufacturing industry means that there are at least n listed companies cooperating with this enterprise; therefore, the H-index of this enterprise is n. The strength of the listed company cooperating with this enterprise is strong, which can also explain the strength. The stronger ones are united, and they are always strong.
As an important subject of society, in order to ensure the legitimacy of operation, enterprises must fulfill the requirements of the contract, provide the required products and services for the society, and bear certain social responsibilities. If they transmit the signal of their legitimate operation to the society, they will invest more environmental costs to reduce public doubts. Under these pressures, enterprises have to restrict their behavior, undertake the responsibility of governing and restoring the environment, increase the input of environmental costs in production and operation, disclose more environmental accounting information, and transmit the signal of good operation to the outside world. A large number of studies have shown that the relationship between enterprise environmental protection investment and enterprise value is a U-shaped curve. With the increase of environmental protection investment, the enterprise value first decreases and then increases. At present, it is more manifested in the value impairment effect of environmental protection investment.
Environmental protection input (EPI). Environmental protection input can be defined as all the efforts made by the company to protect the environment (Nakamura, 2011). In combination with the environmental protection information disclosed by Chinese listed companies in the social responsibility report, the enterprise environmental protection investment referred to in this study includes environmental technology research and development investment, cleaner production investment, environmental protection equipment purchase, construction and transformation investment, pollution control investment, ecological protection investment, and environmental management expenditure. Among them, R and D investment in environmental protection technology refers to the investment of enterprises in developing new technologies and products for environmental protection. Cleaner production input refers to the input made by enterprises to implement cleaner production, involving the recovery and recycling of materials, energy, and intermediate products. The investment in the purchase, construction, and transformation of environmental protection equipment refers to the investment in the purchase and construction of new environmental protection equipment or the transformation of the original environmental protection equipment. Pollution control investment refers to the emission reduction and treatment funds and operating costs of environmental protection equipment invested by enterprises in the treatment of waste gas, waste water, solid waste, and noise pollution. Ecological protection investment refers to the investment of enterprises in the construction and maintenance of ecological environment. Environmental management expenditure includes environmental management system certification expenditure, cleaner production audit fee, environmental assessment fee, expenditure on environmental protection education, training and publicity, environmental tax, and pollution discharge fee.
The multi-index node sustainability comprehensive evaluation method (Wang et al., 2020) can be described as follows: a node in a complex network is a problem scheme, and the node’s importance becomes a multi-index decision-making problem. This method uses the proximity between the idealized goal and the evaluation object to sort, which only requires that each utility function has a monotonic increment (or decrement).
Let
There are many indicators in the scheme. There are benefit indicators (the higher the index value, the stronger the ability) and cost indicators (the higher the index value, the worse the ability). The dimensions of each indicator are different. In order to facilitate comparison, the index matrix is standardized as follows:
If this indicator is a benefit indicator, the processing result is
If this indicator is a cost indicator, the processing result is
A note on the normalized decision matrix
Let the weight of the jth index be
Determine positive ideal decision scheme
Calculate each scheme a with the following formula
Calculate the closeness
This study uses the four-node importance evaluation indexes of degree centrality (DC), clustering coefficient (CC), intermediate centrality (BC), and H-index centrality (HC) as examples (M = 4) to comprehensively calculate the importance of nodes in the network. In terms of structure, DC, CC, and HC are central indicators based on adjacent properties, and BC is central indicators based on the path. Both local and comprehensive indicators can be reflected in the distribution of indicators. The weight of each index of DC > CC > BC > HC is calculated by the analytic hierarchy process (AHP), and the steps are as follows:
In the first stage, a three scale method (0, 1, and 2) (Zhou and Zhu, 2018) is used to compare each index and establish a comparison matrix.
In the second stage, the comparison matrix is transformed into a judgment matrix through transformation, and the consistency test is carried out. Finally, the index weight is obtained.
The comparison matrix is constructed according to the three scale value method:
The judgment matrix is constructed according to the range method for comparison matrix B, as shown in Table 1. After calculation, the largest characteristic root of the judgment matrix is
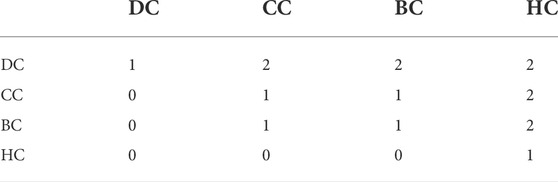
TABLE 1. Comparative values of importance indicators constructed by the three scale method.
The transaction data of listed companies in the automobile manufacturing industry were collected from forecaster.com. The original data are from the Shanghai and Shenzhen stock exchanges.
These are all reliable data sources. Based on the correlation between the transaction data and financial data of listed companies in the automobile manufacturing industry, this study analyzes the characteristics and trends of the development of the automobile manufacturing industry to construct China’s automobile financial market network. The data of enterprise environmental protection input required in this study comes from the corporate social responsibility report (or sustainable development report or environmental report). With the issuance of the guidelines on social responsibility of listed companies (2006) of Shenzhen Stock Exchange and the guidelines on environmental information disclosure of listed companies (2008) of Shanghai Stock Exchange, the number of corporate social responsibility reports is increasing, which provides an available data source for this study.
The authors study the relationship between the network structure of the financial market and the multi-index sustainability evaluation of enterprises and obtain a more intuitive enterprise development evaluation method.
According to the industry classification guidelines for listed companies issued by the CSRC, the number of listed companies in China’s automobile manufacturing industry increased from more than 70 to nearly 140 from 2012 to 2020. According to the daily closing price of Shanghai and Shenzhen stock exchanges, the market value of the automobile manufacturing industry is expanding. The total market value has increased from 559.3 billion yuan in the fourth quarter of 2012 to 2.55 trillion yuan in the fourth quarter of 2020, accounting for 3.2% of the total market value in the same period.
As shown in Figure 1, from 2012 to 2020, BYD, SAIC Group, GAC group, Great Wall group, and other enterprises were ranked among the top in market value, and the ranking showed a changing trend. From the perspective of trend, since 2012 to 2020, the market value of enterprises in the automobile manufacturing industry fluctuated and increased evenly from 2012 to 2015. After reaching the peak in 2015, it showed an inverted “V” shape from 2015 to 2018 and entered a new round of inverted “V” shape fluctuation from 2018 to the end of 2020. BYD has little fluctuation in this trend, and the overall upward trend is obvious. From 2019 to the end of 2020, the market value change is also the largest. In fact, Great Wall Motors and Changan motors are inseparable from their continuous efforts and achieving a notable performance in the field of new energy. SAIC’s total market value ranks first in the automobile manufacturing industry in most quarters. BYD has achieved reverse surpassing due to its continuous efforts in new energy by 2020. After the market value reached a high point in 2017, it has not recovered to the level of market value in 2017 after cyclical fluctuations. The changes in the market value of SAIC and BYD reflect investors’ recognition for the development of new energy and the technological capacity of enterprises supported by the state.
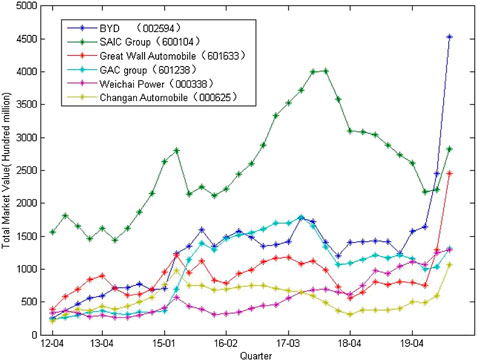
FIGURE 1. Changes in the total market value of key enterprises in China’s automobile manufacturing industry from 2012 to 2020.
The 19th National Congress of the Communist Party of China agreed in their report to construct a market-oriented green technology innovation system, expand energy conservation and environmental protection industries and clean energy industries, and promote the revolution in energy production and consumption and construct a clean, low-carbon, safe, and efficient energy system. In the government work report of the State Council in 2021, the executives bolster the need to intensify jobs in carbon peaking and carbon neutralization and formulate an action plan for reaching the peak of carbon emissions by 2030 and optimize the industrial structure and energy structure. As shown in Table 2, from 2012 to 2020, the average carbon dioxide emission of single-vehicle in China decreased year by year, and the pollutant emission did not rise but fell. The average pollutant emission per vehicle has been declining. It is observed that China’s measures to strengthen the prevention and control of air pollution have achieved tangible results. As green transportation with broad development prospects, new energy vehicles, especially electric vehicles, are an important means to tap the potential of traffic carbon reduction and improve the level of traffic electrification and an important way to achieve the goal of “carbon peaking and carbon neutralization”. Promoting the green, low-carbon, and sustainable development of the automobile industry has become an important part of national economic development.
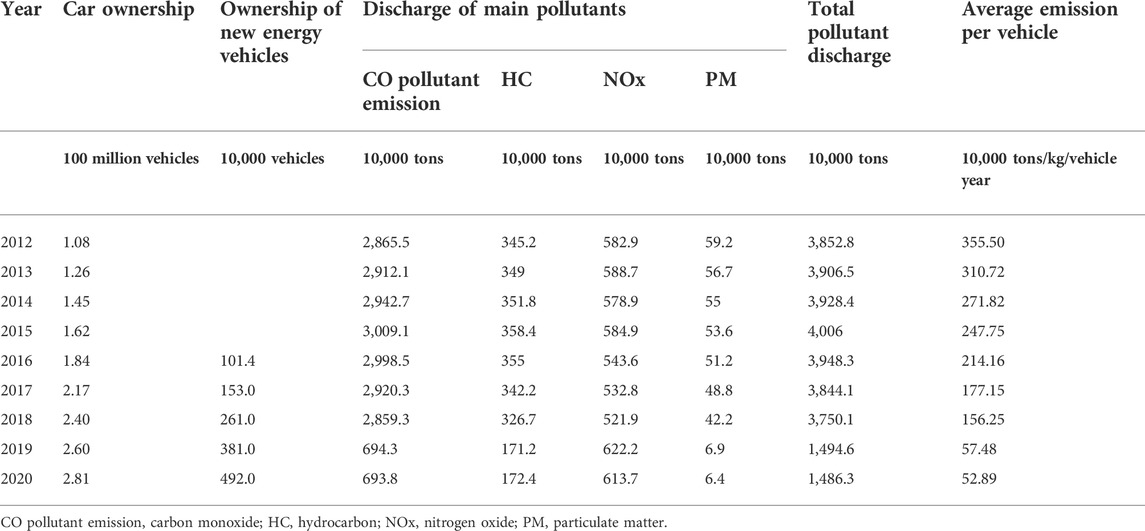
TABLE 2. Statistics of vehicle ownership and pollutant emission in China from 2012 to 2020 (Ministry of Ecology and Environment of the Peoples Republic of China, 2016).
By 2020, China’s automobile output was ranked first in the world for 12 consecutive years. The new energy vehicle market has exceeded one million for three consecutive years, showing a sustained and rapid growth trend, ranking first globally for 6 years. As an important pillar of the national economy, the automobile industry drives the rapid development of upstream and downstream-related industries, which is of great significance in stabilizing industrial development, promoting residents’ consumption, ensuring taxes and employment, and promoting scientific and technological development innovation. China’s automobile manufacturing industry plays an important role in the sustainable development of the national economy, society, resources, and ecology. The automobile industry has become the leader driving China’s new round of economic growth and maintaining continuous rapid growth. The automobile manufacturing industry has become the main force of China’s economic development.
The figures show the statistics on the correlation coefficient of the stocks of listed companies in the automobile manufacturing industry. The non-zero value of the correlation coefficient of each quarter was divided into 50 groups to make the frequency histogram and carry out the Jarque BERA test. The number of each group meets the normal distribution criteria, and the estimated value of the mean value μ ranges from 0.0136 to 0.4507. The estimated value of the standard deviation σ ranges from 0.2780 to 0.4665. According to the Jarque BERA test result for the relevant data itself, in the statistics of 2012–2020, the value of H is 0 only in the first quarter of 2012, and the rest are one. The hypothesis of normal distribution of correlation among listed companies in the automobile manufacturing industry can therefore be rejected. It also indicates that the correlation coefficient contains other information. As shown in Figure 3, from 2012 to 2020, the market value of listed companies in China’s automobile manufacturing industry is expanding and the number of listed companies with correlation is also increasing significantly, but the proportion of negative correlation is fluctuating, indicating that the overall development of the automobile industry is strong but the development among enterprises is not stable.
Figure 2 shows large fluctuations in early 2014, early 2016, and mid-2017. This is a huge new energy experimental market led by the government. The state attaches great importance to the new energy vehicle industry. The 2014 is considered to be the first year of China’s electric vehicles. In the quest to support new energy vehicles, there are 16 new policies that have been issued this year as well as some subsidy policies. At the end of September 2015, the State Council launched the policy of halving the purchase tax to promote the development of new energy and small-displacement vehicles and eliminate vehicles with excessive emissions. In October and November of that year, China’s data show that the country sold 1.87 million sedans with 1.6 L or less, a year-on-year increase of 9.8%. In November, the sales volume of new energy vehicles was nearly 25,000, a year-on-year increase of 2.4 times.
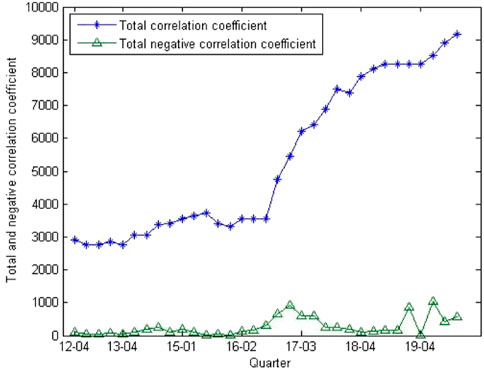
FIGURE 2. Quarterly changes of total stock correlation and negative correlation in China’s automobile manufacturing industry from 2012 to 2021.
Figure 3 shows the number of negative correlation coefficients in the third quarter of 2015 and the first quarter of 2016. The first quarter of 2020 (special time) is very low, and the proportion is close to zero. In 2015, due to the high share price, the large proportion of leveraged funds, short-selling of stock index futures, reduction of senior executives of listed companies, and acceleration of the issuance of new shares in China’s stock market plummeted, and individual stocks fell by 75% in just 2 months. At the beginning of 2016, shares were closed early twice, and nearly 2000 stocks in the two markets fell by a limit. The market value declined by more than 4.24 trillion on January 4 and by more than 3.8 trillion on January 7. In 2020, due to the sudden outbreak of the COVID-19 epidemic in the world, the stock market and commodity futures market experienced severe turmoil. The trend of stock data in the financial market of the automobile manufacturing industry is the same in these periods. The biggest reason for the market fluctuation of automobile manufacturing enterprises is the influence of the change in the form of the whole financial market. The change of each enterprise has little influence due to its factors, and the correlation coefficients between enterprises are highly consistent. The financial market is at a stage of great risk, and the number of negative correlation coefficients is naturally insufficient. It does not have the basic conditions for building a network.
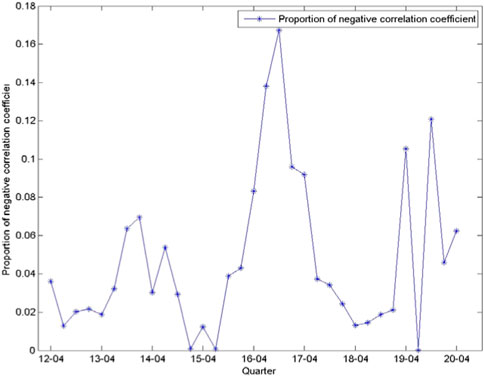
FIGURE 3. 2012–2020 Shanghai and Shenzhen stock markets of China’s automobile manufacturing industry negative correlation quarterly changes.
To sum up, when the stock market is at extreme risk, investors cannot avoid the impact of extreme risk unless they leave the market at that time. The low negative correlation ratio statistics show that the negative correlation coefficient among enterprises decreases when encountering the stock market crash, fuse, public health emergencies, and other events. The influence of force majeure is enormous. At this time, the stock market risk is at a great stage. The proportion fluctuation of negative correlation provides an important reference for judging the development risk of the industry.
Through the aforementioned analysis, the network is constructed based on the negative correlation between the two listed companies in each quarter further to analyze the other information in the correlation coefficient. The Chinese automotive financial market network is obtained by quarter classification (see Figure 4 for example).
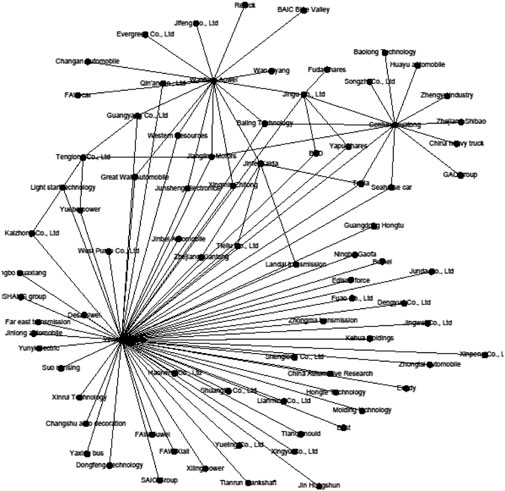
FIGURE 4. Network diagram of China’s auto finance market in the fourth quarter of 2018.
As shown in Table 3, the negative correlation network is formed by calculating the correlation coefficients of listed companies in 33 quarter. Each quarter’s top 10 listed companies are counted. SAIC Group, Yutong Bus, Great Wall Motor, Boying investment, and Baling Technology rank among the top five, including SAIC Group, Yutong Bus, Great Wall Motors, and others, with typical characteristics in China’s automobile manufacturing industry. They are generally leading enterprises in some aspects. For example, the SAIC Group has many brands and ranked first in domestic sales for 15 consecutive years. Yutong Bus ranked first in the production and sales of large and medium-sized buses, whereas Great Wall Motor is the largest SUV manufacturing enterprise in China. There are also high-risk enterprises with poor financial conditions, such as Boying investment and baling technology. As shown from Table 4, Boying investment (000760) has been ranked in the top 10 networks composed of negative correlation since 2012. The company has experienced several changes in business scope and key products and was finally delisted by the CSRC due to financial problems.
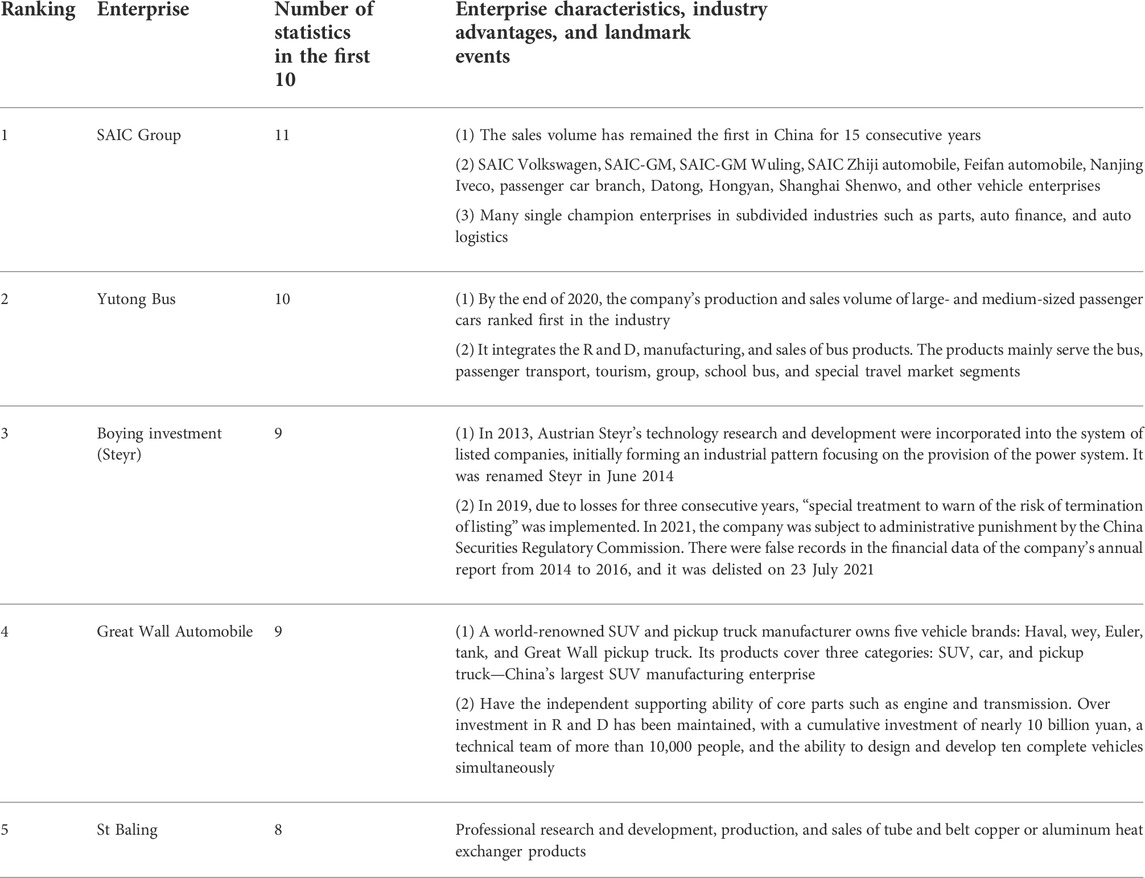
TABLE 3. Top 10 quarterly statistics of China’s auto finance market network from 2012 to 2020.
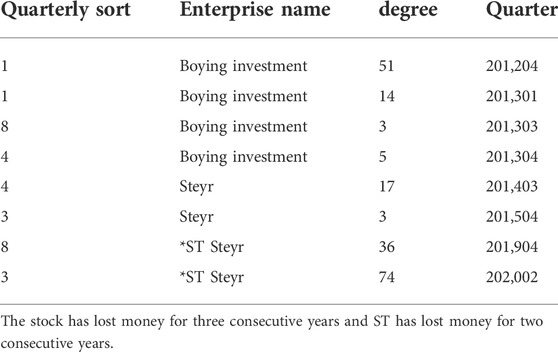
TABLE 4. Statistics of changes in company name and degree of Boying investment (000760) from 2012 to 2020.
Based on the aforementioned analysis, in the financial market network of the automobile manufacturing industry, the top companies are mainly the leading enterprises in the industry. The comprehensive strength of the business system and the individual strength of the industry segments have an important influence, which is radial and mainly accumulated influence. The impact of the financial situation of enterprises in the industry cannot be ignored. This impact on the industry network increases the volatility of the financial market, and the passive changes of relevant enterprises increase the uncertainty of the financial market.
Through the comparative analysis of the average clustering coefficient, Figure 5 shows that the quarterly change of the average clustering coefficient from 2012 to 2020 is between 0 and 0.38, and the change of the average clustering coefficient presents the characteristics of periodic change. The change of the average clustering coefficient of the network has obvious periodic fluctuation, and the cycle fluctuates up and down in 3 years.
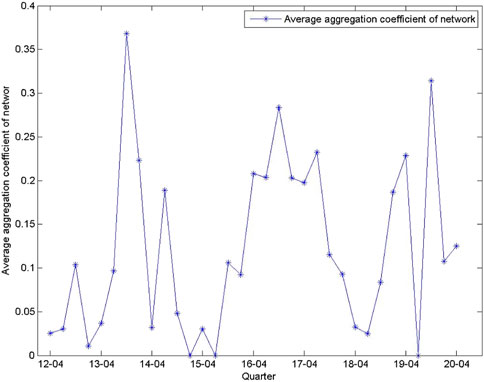
FIGURE 5. Quarterly variation of average clustering coefficient of China’s auto finance market network from 2012 to 2021.
Table 5 shows the top 10 negative correlation network degree of the automobile manufacturing industry in China’s stock market from 2012 to 2021, * ST Site, Xingmin Zhitong, and Jiangling Automobile ranks top. The clustering coefficient can well express the relationship between enterprises. Some enterprises with high clustering coefficient are superior to the same industry in operation, and some are on the verge of bankruptcy because of poor management. According to the clustering coefficient definition, the clustering coefficient’s determination is directly related to the degree of nodes, degree of nodes, and density of connections. From the definition of clustering coefficient, we can infer that the larger the clustering coefficient is, the more connections the related enterprises. Among the related listed companies in the automobile manufacturing industry network, the direct impact comes from the daily rate of return of listed companies. The reason is that there are synchronous relations between national policy guidance, market competition, and supply chain. It can be seen from Table 5 that the enterprises with the highest clustering coefficient are less well-known than the enterprises with the highest clustering coefficient, and there is no display degree of leading enterprises. This is reflected in the network diagram in Figure 4. Their degree value is not too high and has little correlation with the degree value.
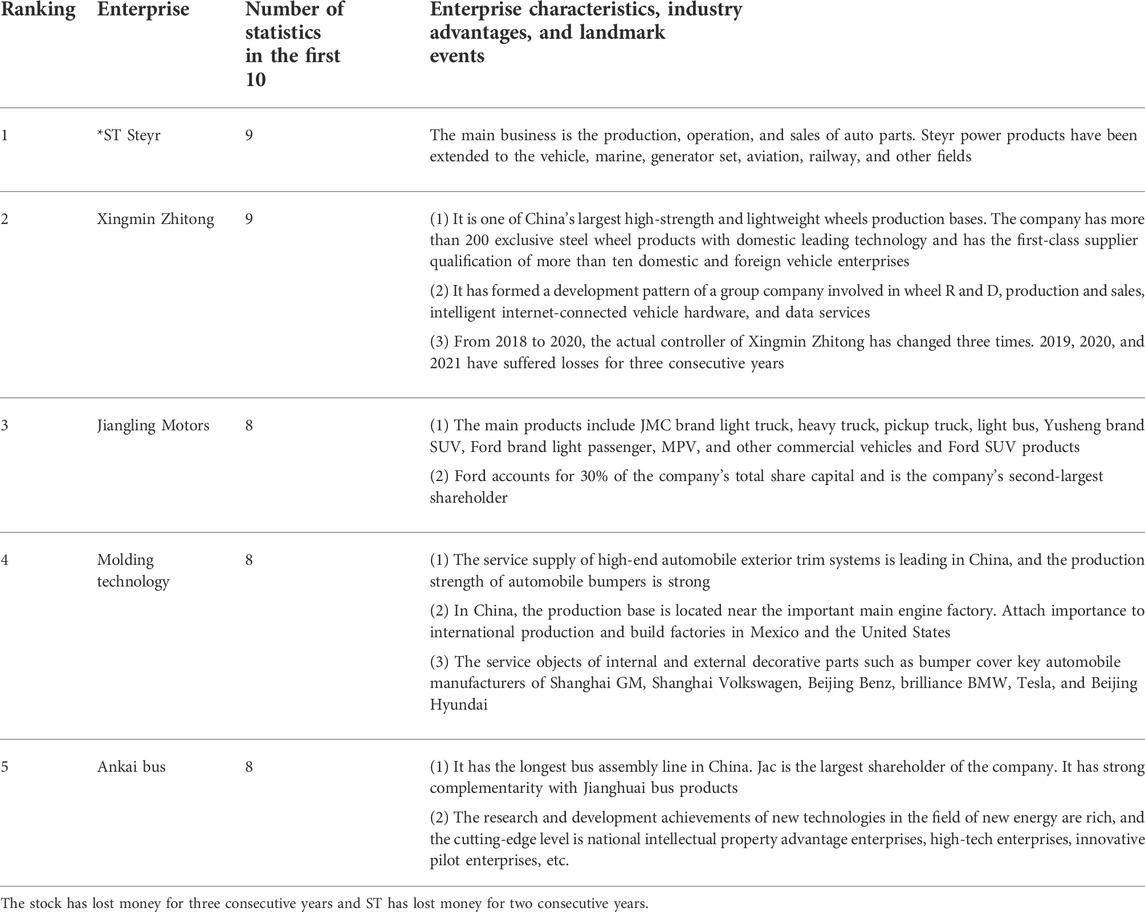
TABLE 5. Statistics of the top 10 network clustering coefficients of China’s auto finance market from 2012 to 2020.
According to Figure 6, the average network medium fluctuated below 50, and the periodicity is not obvious. In the second quarter of 2020, the average number of network betweenness suddenly rose to 214.3. There was a sudden change in the number of nodes participating in the shortest path. According to the China Automobile Industry Association statistics, in the first quarter of 2020, the production and sales of new energy vehicles in China fell sharply, with a year-on-year decrease of 60.2% and 56.4%, and the major automobile manufacturing enterprises entered a dormant state. From January to June 2020, 10.012 million and 10.257 million vehicles were produced and sold with a year-on-year decrease of 16.8% and 16.9%, respectively, and the decline continued to narrow. The automobile manufacturing industry has shown the toughness of the industrial chain in hitting bottom and rebounding, which is reflected in the huge fluctuation in the average medium.
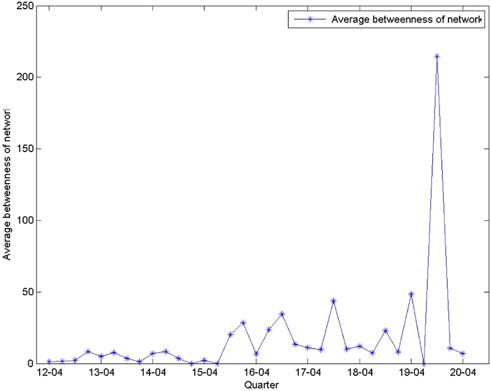
FIGURE 6. Quarterly changes in the average number of betweenness in China’s auto finance market network from 2012 to 2021.
The number of nodes refers to the number of shortest paths through nodes in a network, reflecting the importance of nodes as a “bridge”. Because there are many connections between enterprises in the automobile manufacturing network, many edges can be formed. The premise of calculating the intermediate number is to obtain the shortest path between two points and to traverse all possible paths between two points. The final result is the minimum spanning tree. Table 6 that the top average betweenness in the network are mainly enterprises with advantages in parts, power systems, vehicle control systems, and other industries.
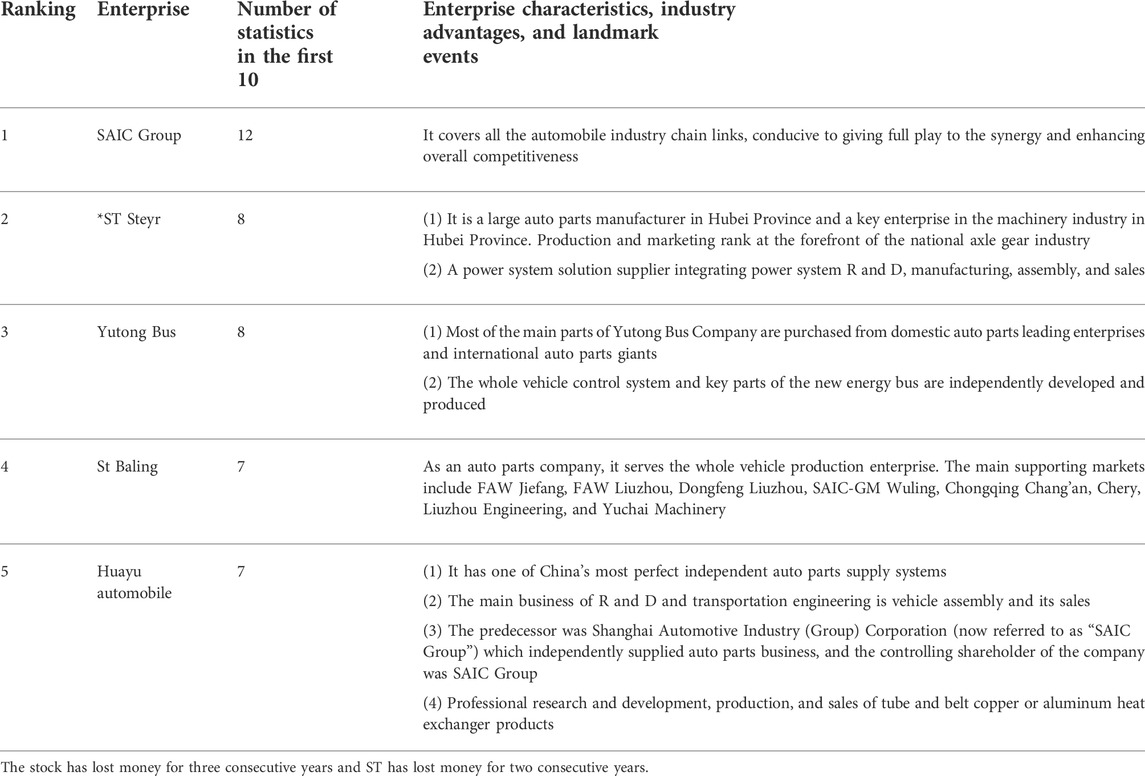
TABLE 6. Statistics of top 10 network betweenness in China’s auto finance market from 2012 to 2020.
According to the analysis of the companies with the highest rankings, the number of small and medium-sized companies in the supply chain in the automobile manufacturing industry exceeds the average network number. The stable production of these enterprises is very important for the healthy and sustainable development of the entire industry. In the current dispensation where the automobile manufacturing industry is moving toward intelligent and electric development, whether it is software or hardware such as chips and technology platforms, the automobile manufacturing industry is becoming increasingly systematic. In some aspects, enterprises with R and D, technology, and manufacturing advantages will play an important role. Mastering the key technologies in the core fields has become the general trend of transforming traditional automobile enterprises. The autonomy and controllability of core technologies will also become the fundamental competitiveness of traditional automobile enterprises to deal with industrial transformation and new entrants.
As can be seen from Figure 7, the average H-index in the second quarter of 2017 and the second quarter of 2020 is 10.29 and 10.28 respectively, and the average H-index also fluctuates periodically, with a cycle of about 3 years, 2012–2015, 2015–2018, and 2018–2020.
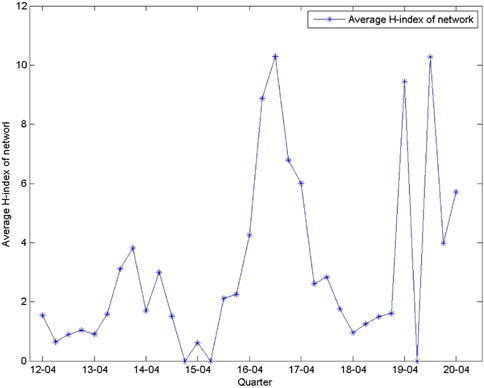
FIGURE 7. Quarterly change of average H-index of China’s auto finance market network from 2012 to 2021.
As can be seen from Table 7, the enterprises with the top H-index in the network, the enterprises with which they have business contacts, have huge advantages in some aspects, and the enterprises themselves and their affiliated enterprises have certain or overall advantages. It is revealed from the H-index that the advantages of a strong alliance in the automobile manufacturing industry are relatively prominent, which can reflect the agglomeration effect of the industry.
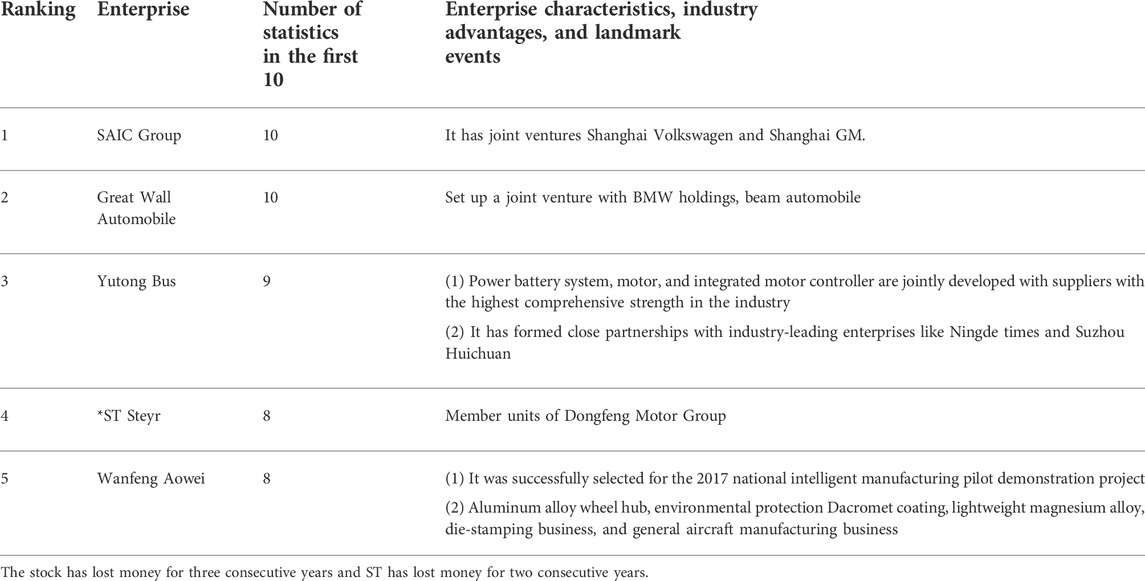
TABLE 7. Top 10 statistics of China’s auto finance market network H-index from 2012 to 2020.
Next, the index of degree, clustering coefficient, intermediate number, and H-index of listed companies in the automobile manufacturing industry will be counted, respectively. As shown in Table 8, the list of the top 10 in the evaluation for the three quarters is given. In Table 9, we have the statistical result for comprehensive evaluation of network sustainability nodes of China’s auto finance market from 2012 to 2020. These indexes will be subject to the multi-attribute comprehensive evaluation and sorted according to the importance of network nodes to verify this performance evaluation’s effectiveness.
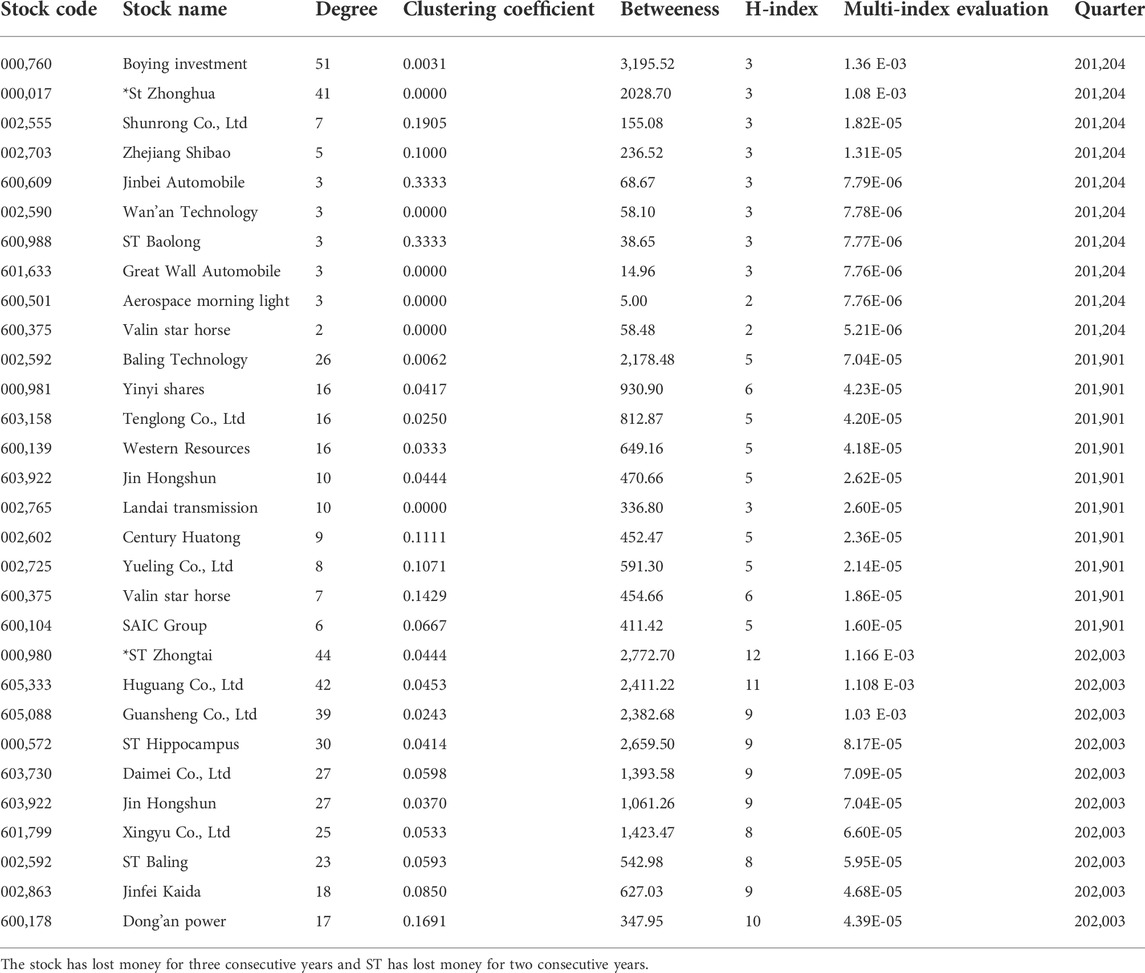
TABLE 8. Multi-index sustainable evaluation index table of China’s auto finance market network from 2012 to 2020.
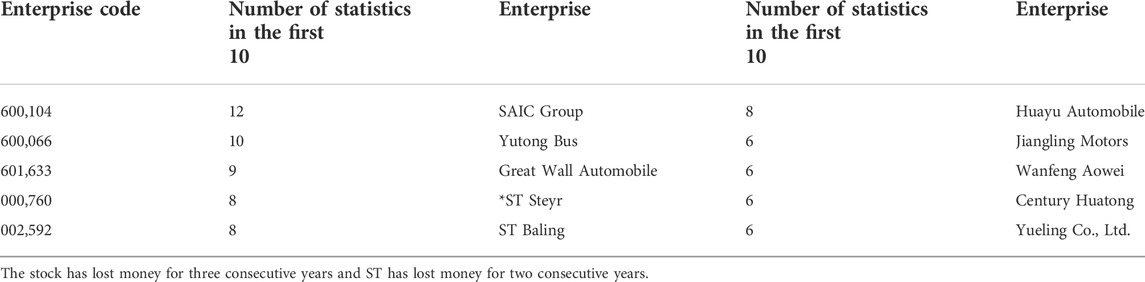
TABLE 9. Statistical table for comprehensive evaluation of network sustainability nodes of China’s auto finance market from 2012 to 2020.
The sustainability evaluation of the automobile manufacturing industry refers to the evaluation of whether the established strategic objectives can be achieved on schedule and produce better benefits when the automobile manufacturing enterprise enters into operation, and whether the automobile manufacturing enterprise can continue to achieve the established objectives and have repeatability depending on its ability. Sustainability assessment mainly includes government policy, management, organization and participation, and technical factors.
The aforementioned analysis shows that the ranking of node importance may objectively find the development of enterprises in China’s automobile manufacturing industry to arrange the investment focus more reasonably. The multi-attribute evaluation of the listed companies in the automobile manufacturing industry can obtain more information than the traditional evaluation method and thus coordinate the development of the listed companies.
Table 10, the social responsibility reports of listed companies in the automobile manufacturing industry specified 66 reports on EPI, accounting for 7.7% of the listed companies in the industry from 2012 to 2020. More than 190 EPI projects were collected in all social responsibility reports.
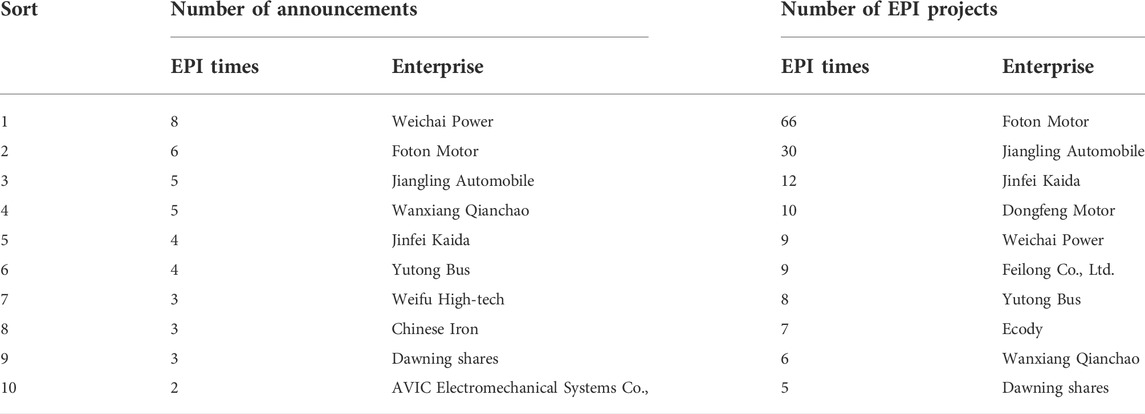
TABLE 10. Number of EPI announcements issued by listed companies in the automobile manufacturing industry.
It can be seen from Table 11 that in the year of high market value of EPI, the investment will be more than 1% from 2015 to 2017. At the same time, it shows that the EPI of listed companies in the automobile manufacturing industry is not proportional to the change of the company’s market value. For the sustainable development of enterprises, there are passive factors in environmental protection investment. National policy guidance and legislation are meaningful for the performance of corporate social responsibility.
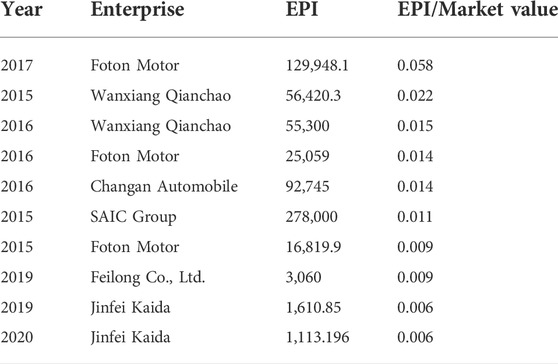
TABLE 11. Ranking of market value ratio of EPI of listed companies in automobile manufacturing industry from 2012 to 2020.
The analysis of the negative correlation network formed by the transaction data of listed companies in the automobile manufacturing industry shows that the network structure and multi-index sustainable evaluation method are easy to operate and objective, and feasible. The degree analysis of the network can effectively identify the industry’s leading-edge with special financial conditions. The clustering coefficient can directly find out the enterprises independent of the general characteristics of industry development. The dynamic changes of network indicators in different quarters show the development heterogeneity of listed companies in the automobile manufacturing industry. By evaluating the intermediate number, we found the minimum spanning tree of the network and obtain the core network composed of key enterprises in the automobile manufacturing industry. The intuitive nature of the network makes it less difficult to spot problems such as business operations. The head aggregation effect of leading enterprises can be seen through the H-index. The comprehensive evaluation method of node importance of multi-attribute decision-making can scientifically integrate several network indicators, overcome subjective speculation, and realize fair and impartial performance evaluation. Thus, from the original simple quantitative statistics to intuitive discovery, performance appraisal is also an important change.
Through the quarterly changes in the market value of listed companies in the automobile manufacturing industry, it can be observed that with the national policy guidance on the electric and intelligent automobile manufacturing industry, BYD, for example, can meet the development requirements and have core competitiveness, which is the key to enterprise development and the foundation of sustainable development. The proportion fluctuation of negative correlation provides an important reference value for judging the development of the industry. In particular, when the stock market is at extreme risk, investors cannot avoid the impact of extreme risk unless they leave the market at that time. The number of negative correlation coefficients is naturally insufficient, and they do not have the basic conditions to build a network. From the ranking of relevant networks, we can realize the position of an automobile manufacturing enterprise in the industry, which can provide early warning information for investors. The network’s average clustering coefficient and H-index have obvious periodic fluctuation, whereas the average betweenness is not obvious. For investors, this study should be vigilant for those who rank high in multi-attribute sustainability. For those enterprises whose business conditions are not ideal but often rank high, it is necessary to expand the channels of evaluation information not only from the financial point of view but also make a comprehensive analysis of their production and operation conditions to reduce the probability of investment risk.
Through the network structure index and empirical research, it is found that there are three main types of relationships among automobile manufacturing enterprises. The first is the unified change balance affected by national policies and macro factors on the automobile manufacturing industry. The second is the influence of leading enterprises in the industry or the enterprises with great influence in a certain direction. The third category is the impact of directly linked supply chains. For automobile manufacturing enterprises, through this method, we should pay attention to the smooth connection between enterprises in automobile production, supply chain and sales. During the recent epidemic, many enterprises stopped production and reduced production due to the epidemic, which affected the supply of the whole industry.
The statistical analysis of multi-index sustainability evaluation of individual stocks is beneficial to the overall evaluation of the automobile manufacturing industry. It has important reference significance for investors and enterprise producers. It can not only find out the existing problems but also help enterprises conduct self-analysis and promote the development of enterprises.
The topology of each node in the complex network system is different, and even the characteristics of each node are diverse. It is of great significance to analyze the importance of nodes in the complex network using quantitative methods, which can effectively guide people to improve the performance of important nodes and avoid disadvantages according to needs. The evaluation of the nodes is helpful to determine the nodes in the network to improve the efficiency of the whole network system and achieve a specific purpose.
The raw data supporting the conclusion of this article will be made available by the authors, without undue reservation.
Conceptualization and methodology, HL and HY; investigation, HL and HY; data collection, HL; data process, HL; data analysis, HL; writing—original draft preparation, HL; writing—review and editing, HL and HY. All authors have read and agreed to the published version of the manuscript.
Foundation item: General project of philosophy and social science research in colleges and universities of Jiangsu Province (Grant 2020SJA2076); Research and innovation program for postgraduates in Jiangsu province (Grant KYLX15_1077); National Natural Science Fund Youth Project of China (Grant 71701082); The Key Project of Philosophy and Social Science Research in Colleges and Universities in Jiangsu Province (Grant 2021SJZDA139).
The authors declare that the research was conducted in the absence of any commercial or financial relationships that could be construed as a potential conflict of interest.
All claims expressed in this article are solely those of the authors and do not necessarily represent those of their affiliated organizations, or those of the publisher, the editors, and the reviewers. Any product that may be evaluated in this article, or claim that may be made by its manufacturer, is not guaranteed or endorsed by the publisher.
Acemoglu, D., Carvalho, V., Ozdaglar, A., and Tahbaz-Salehi, A. (2012). The network origins of aggregate fluctuations. Econometrica 80 (5), 1977–2016.
Ai, X. (2017). Node importance ranking of complex networks with entropy variation. Entropy 19 (7), 303. doi:10.3390/e19070303
Bian, T., Hu, J. T., and Deng, Y. (2017). Identifying influential nodes in complex networks based on AHP. Phys. A Stat. Mech. Its Appl. 479, 422–436. doi:10.1016/j.physa.2017.02.085
Bonacich, P. (1972). Factoring and weighting approaches to status scores and clique identification. J. Math. Sociol. 2 (1), 113–120. doi:10.1080/0022250x.1972.9989806
Bonan, H., Yiping, Y., and Dongsheng, L. (2012). Identifying all-around nodes for spreading dynamics in complex networks. Phys. A Stat. Mech. Its Appl. 391, 4012–4017. doi:10.1016/j.physa.2012.02.033
Bonanno, G., Caldarelli, G., Lillo, F., Micciche, S., Vandewalle, N., and Mantegna, R. N. (2004). Networks of equities in financial markets. Eur. Phys. J. B - Condens. Matter 38 (2), 363–371. doi:10.1140/epjb/e2004-00129-6
Chen, D. B., Lü, L. Y., Shang, M. S., Zhang, Y. C., and Zhou, T. (2012). Identifying influential nodes in complex networks. Phys. A Stat. Mech. Its Appl. 391, 1777–1787. doi:10.1016/j.physa.2011.09.017
Chen, X., Tan, M., Zhao, J., Yang, T., Wu, D., and Zhao, R. (2019). Identifying influential nodes in complex networks based on a spreading influence related centrality. Phys. A Stat. Mech. its Appl. 536, 122481. doi:10.1016/j.physa.2019.122481
Cormier, D., Ledoux, M. J., and Magnan, M. (2011). The informational contribution of social and environmental disclosures for investors. Manag. Decis. 49 (8), 1276–1304. doi:10.1108/00251741111163124
Estrada, Ernesto, and Rodríguez-Velázquez, A. (2005). Subgraph centrality in complex networks. Phys. Rev. E E71, 056103. doi:10.1103/physreve.71.056103
Fan, Wen-Li, and Liu, Z. G. (2014). Ranking method for node importance based on efficiency matrix. J. Southwest Jiaot. Univ. 49 (02), 337–342.
Fowler, J. H. (2008). Dynamic spread of happiness in a large social network: Longitudinal analysis over 20 years in the framingham heart study[J]. BMJ 337, 1–9.
Fu, Y. H., Huang, C. Y., and Sun, C. T. (2015). Using global diversity and local topology features to identify influential network spreaders. Phys. A Stat. Mech. its Appl. 433, 344–355. doi:10.1016/j.physa.2015.03.042
Gao, C., Wei, D. J., Hu, Y., Mahadevan, S., and Deng, Y. (2013). A modified evidential methodology of identifying influential nodes in weighted networks. Phys. A Stat. Mech. its Appl. 392, 5490–5500. doi:10.1016/j.physa.2013.06.059
Gao, S., Ma, J., Chen, Z., Wang, G., and Xing, C. (2014). Ranking the spreading ability of nodes in complex networks based on local structure. Phys. A Stat. Mech. its Appl. 403, 130–147. doi:10.1016/j.physa.2014.02.032
Hautsch, N., Schaumburg, J., and Schienle, M. (2015). Financial network systemic risk contributions. Rev. Finance 19 (2), 685–738. doi:10.1093/rof/rfu010
He, Xi-jun, Wu, Yu-Ying, and Jiang, Guo-ri (2013). An empirical research on structure and stability of automobile supply network. Soft Sci. 27 (1), 20–25.
Hu, P., Fan, W., and Mei, S. (2015). Identifying node importance in complex networks. Phys. A Stat. Mech. its Appl. 429, 169–176. doi:10.1016/j.physa.2015.02.002
Hui, Yu, Liu, Zun, and Li, Yong-Jun (2013). Key nodes in complex networks are identified by the multi-attribute decision-making method. Acta Phys. Sin. 62, 020204.
Jiang, L. C., Jing, Y. M., Hu, S. Z., Ge, B., and Xiao, W. (2018). Identifying node importance in a complex network based on node bridging feature. Appl. Sci. (Basel). 8, 1914. doi:10.3390/app8101914
Kitsap, M., Gallos, L., Havlin, S., Liljeros, F., Muchnik, L., Stanley, H. E., et al. (2010). Identification of influential spreaders in complex networks. Nat. Phys. 6, 888–893. doi:10.1038/nphys1746
Kong, J. T., Huang, J., Gong, J. X., and Li, E. Y. (2018). Evaluation methods of node importance in undirected weighted networks based on complex network dynamics models. Acta Phys. Sin. 67 (9), 098901. doi:10.7498/aps.67.20172295
Linyuan, Lü, Chen, Duanbing, Ren, Xiao-Long, Zhang, Qian-Ming, Zhang, Yi-Cheng, and Zhou, Tao (2016). Vital nodes identification in complex networks. Phys. Rep. 650, 1–63. doi:10.1016/j.physrep.2016.06.007
Liu, H., and Yongjia, F. (2020). Economic policy uncertainty and information disclosure of corporate social responsibility. J. Beijing Technol. Bus. Univ. ( Soc. Sci. 35 (5), 70–82.
Liu, J. G., Lin, J. H., Guo, Q., and Zhou, T. (2016). Locating influential nodes via dynamics-sensitive centrality. Sci. Rep. 6 (3), 21380. doi:10.1038/srep21380
Liu, Lanjian, and Zhao, Zhihua (2016). Simulation of the running mechanism of multi-agent innovation network when fiscal subsidy drops out: A case of new energy vehicles. Sci. Res. Manag. 37 (8), 58–66.
Liu, Yaqin, and Qian, Yu (2019). Structural characteristics and evolution analysis of new energy vehicle patent cooperation network. J. Beijing Inst. Technol. Sci. Ed. 21 (6), 31–40.
Lü, L. Y., Zhou, T., Zhang, Q. M., and Stanley, H. E. (2016). The H-index of a network node and its relation to degree and coreness. Nat. Commun. 7, 10168. doi:10.1038/ncomms10168
Ma, Q., and Ma, J. (2017). Identifying and ranking influential spreaders in complex networks with consideration of spreading probability. Phys. A Stat. Mech. its Appl. 465, 312–330. doi:10.1016/j.physa.2016.08.041
Mantegna, R. (1999). Hierarchical structure in financial markets. Eur. Phys. J. B 11 (11), 193–197. doi:10.1007/s100510050929
Ministry of Ecology and Environment of the Peoples Republic of China (2016). China mobile source environmental managen ment annual report. Available at https://www.mee.gov.cn/hjzl/sthjzk/ydyhjgl/.
Minoru, C., Kang, C., Subrahmanian, V. S., and Berea, A. (2013). Does financial connectedness predict crises. Quant. Finance 15 (4), 607–624.
Sun, H., Edziah, B. K., Kporsu, A. K., Sarkodie, S. A., and Taghizadeh-Hesary, F. (2021). Energy efficiency: The role of technological innovation and knowledge spillover. Technol. Forecast. Soc. Change 167, 120659. doi:10.1016/j.techfore.2021.120659
Sun, H., Edziah, B. K., Sun, C., and Kporsu, A. K. (2021). Institutional quality and its spatial spillover effects on energy efficiency. Socio-Economic Plan. Sci. 83, 101023. doi:10.1016/j.seps.2021.101023
Tse, C. K., Liu, J., and Lau, F. C. (2010). A network perspective of the stock market. J. Empir. Finance 17 (4), 659–667. doi:10.1016/j.jempfin.2010.04.008
Vandewalle, N., Brisbois, F., and Tordoir, X. (2001). Non-random topology of stock markets. Quant. Finance 1 (3), 372–374. doi:10.1088/1469-7688/1/3/308
Wang, C., Cui, Y., and Shang, Z. (2020). Research on the influence of multi-level innovation network structure hole characteristics on organizational innovation performance-empirical analysis based on the new energy vehicle field. Sci. Technol. Prog. Policy 37 (24), 71–79.
Wang, K., Wu, C. X., Ai, J., and Su, Z. (2019). Complex network centrality method based on multi-order K-shell vector. Acta Phys. Sin. 68 (19), 196402. doi:10.7498/aps.68.20190662
Wang, Y., and Guo, J. L. (2017). Evaluation of node importance in directed-weighted complex network based on multiple influence matrix. Acta Phys. Sin. 66 (5), 050201.
Wang, Y., and cao, Y. (2022). Political Connections,Enterprise environmental tax burden and environmental investment based on the empirical research of China’s listed companies. J. China Univ. Petroleum( Ed. Soc. Sci. 38 (02), 1.
Wang, y., and chen, H. (2021). Government subsidies and corporate environmental expense stickiness: An empirical study based on Chinese listed companies. Chin. Rev. financial Stud. 13 (3), 23.
Wang, Z. X., Du, C. J., Fan, J. P., and Xing, Y. (2017). Ranking influential nodes in social networks based on node position and neighborhood. Neurocomputing 260, 466–477. doi:10.1016/j.neucom.2017.04.064
Xu, S., Wang, P., and Lv, J. (2017). Iterative neighbour-information gathering for ranking nodes in complex networks. Sci. Rep. 7, 41321. doi:10.1038/srep41321
Zareie, A., Sheikhahmadi, A., and Jalili, M. (2019). Influential node ranking in social networks based on neighborhood Diversity. Future Gener. Comput. Syst. 94, 120–129. doi:10.1016/j.future.2018.11.023
Zeng, An, and Cheng, J. Z. (2013). Ranking spreaders by decomposing complex networks. Phys. Lett. A 377 (14), 1031–1035. doi:10.1016/j.physleta.2013.02.039
Zhang, K., and Qian, Q. (2021). Characteristics and proximities mechanism of China's new energy vehicle industry innovation network. Geogr. Res. 40 (8), 2170–2187.
Zhao, Y. H., Wang, Z. L., Zheng, J., and Guo, X. J. (2009). Finding most vital node by node importance contribution matrix in communication networks[J]. J. Beijing Univ. Aeronautics Astronautics 35 (9), 1076–1079.
Zhao, Z., and Liu, L. (2016). Simulation of evolution path of high standard innovative network under goal difference situation: The case of new energy automobile. Sci. Technol. Prog. Policy 33 (24), 59–66.
Zhou, M., and Zhu, Z. (2018). Life cycle sustainability assessment of battery electric vehicle in China. J. Industrial Technol. Econ. 37 (10), 75–84.
Zhou, X., Zhang, F. M., Li, K. W., Hui, X. B., and Wu, H. S. (2012). Finding vital node by node importance evaluation matrix in complex networks. Acta Phys. Sin. 61 (5), 050201–050207.
Keywords: sustainability evaluation, automobile manufacturing industry, financial risk, multi-index decision-making, node importance
Citation: Liang H and Yao H (2022) Construction of China’s automobile financial market network and its sustainability evaluation. Front. Environ. Sci. 10:907311. doi: 10.3389/fenvs.2022.907311
Received: 29 March 2022; Accepted: 22 August 2022;
Published: 23 September 2022.
Edited by:
Mobeen Ur Rehman, Shaheed Zulfikar Ali Bhutto Institute of Science and Technology (SZABIST), United Arab EmiratesCopyright © 2022 Liang and Yao. This is an open-access article distributed under the terms of the Creative Commons Attribution License (CC BY). The use, distribution or reproduction in other forums is permitted, provided the original author(s) and the copyright owner(s) are credited and that the original publication in this journal is cited, in accordance with accepted academic practice. No use, distribution or reproduction is permitted which does not comply with these terms.
*Correspondence: Hongzhen Liang, enpsaHpAdWpzLmVkdS5jbg==; Hongxing Yao, aHh5YW9AdWpzLmVkdS5jbg==
Disclaimer: All claims expressed in this article are solely those of the authors and do not necessarily represent those of their affiliated organizations, or those of the publisher, the editors and the reviewers. Any product that may be evaluated in this article or claim that may be made by its manufacturer is not guaranteed or endorsed by the publisher.
Research integrity at Frontiers
Learn more about the work of our research integrity team to safeguard the quality of each article we publish.