 Yanzhao Li
 Xiang Qin
 Yushuo Liu
 Zizhen Jin
 Jun Liu
 Lihui Wang
 Jizu Chen
95% of researchers rate our articles as excellent or good
Learn more about the work of our research integrity team to safeguard the quality of each article we publish.
Find out more
ORIGINAL RESEARCH article
Front. Environ. Sci. , 25 May 2022
Sec. Atmosphere and Climate
Volume 10 - 2022 | https://doi.org/10.3389/fenvs.2022.906821
This article is part of the Research Topic The Impacts of Atmospheric and Environmental Changes of Urban Cities and Suburbs on The Tibetan Plateau and other northern Hemispheric Cryosphere View all 7 articles
Long-term and high-resolution gridded products of precipitation and temperature data are highly important to study the changes in climate and environment under global warming. Considering the uncertainties of these products in mountainous areas, it is necessary to evaluate the data reliability. This study evaluates the performances of the CMFD (China Meteorological Forcing Dataset) and ERA5-Land in simulating precipitation and temperature in the Qilian Mountains over the period of 1980–2018. We use the observation data of 28 basic meteorological stations in the Qilian Mountains to compare with the reanalysis products. Error metrics (the correlation coefficient (CC), the root mean square error (RMSE), the mean absolute error (MAE), and the relative bias (BIAS)) are used to quantify the monthly differences in existence between the observed data and reanalysis data. Our findings indicate that both CMFD and ERA5-Land could well reproduce the spatial distribution of mean monthly precipitation and temperature in the region. A good correlation is found between CMFD and OBS under different amounts of monthly precipitation conditions. The monthly average temperatures of CMFD and ERA5-Land reveal a high correlation with the observed results. Moreover, the CC values of CMFD and ERA5-Land precipitation products are the highest in autumn and the lowest in winter, and the CC values of both CMFD and ERA5-Land temperature products are higher in spring and autumn. However, we find that both reanalysis products underestimate the temperature to varying degrees, and the amount of precipitation is overestimated by ERA5-Land. The results of the evaluation show that the errors in precipitation yielded by CMFD as a whole are distinctly fewer than those yielded by ERA5-Land, while the errors in air temperature yielded by both ERA5-Land and CMFD are nearly identical to each other. Overall, ERA5-Land is more suitable than CMFD for studying the trends of temperature changes in the Qilian Mountains. As for simulation of precipitation, CMFD performs better in the central and eastern parts of the Qilian Mountains, whereas ERA5-Land performs better in the western part of the Qilian Mountains.
The Qilian Mountains is located at the northeast edge of the Qinghai–Tibet Plateau. It is an important ecological security barrier for northwestern China. Affected by the interactions among the Siberian high, East Asian monsoon, and westerly jet streams, this region is highly sensitive to climate changes (Chen F et al., 2011). In the context of global warming and frequent extreme climates, significant changes have taken place in the Qilian Mountains (Xie et al., 2015; Lin et al., 2017; Dehecq et al., 2019; Geng et al., 2019). As an area sensitive to climate changes, the Qilian Mountains have experienced severe ablations of glaciers, degradation of permafrost, variations of vegetation, and changes in runoff over the recent decades.
Generally, the data observed from conventional meteorological stations are considered to be the most reliable and accurate (Jing et al., 2017). However, the installation and maintenance of meteorological stations are often challenging tasks due to the complex terrains and low levels of local economic development in the respective region. Furthermore, the quality and density of meteorological stations in most areas of the plateau do not meet the requirements for research in high-altitude mountainous areas (Hijmans et al., 2005; Chen et al., 2008). Thus, researches on climate changes in the Qilian Mountains have been restricted. With the developments of remote-sensing technology and climate modeling, many reanalysis products for different purposes are produced. In recent decades, scientists and technicians have used remote-sensing data as the background field and data-assimilation technology to make full use of the meteorological data obtained from various sources, including but not limited to basic weather stations, climate model outputs, and multimodal integrational results. At present, many global research institutions and scientific organizations provide links or windows through which one can download reanalysis products for free, such as ECMWF and NCAR. There are many kinds of reanalysis data available; however, they are all quite different from each other in terms of their types, resolutions, fields of coverage, and accuracy levels pertaining to climatic elements. Atmospheric reanalysis products are being widely used for documenting and analyzing environmental changes in the Qinghai–Tibet Plateau (Qin et al., 2020).
Nowadays, many products have been developed and used. For example, there is the Global Precipitation Climatology Project (GPCP) (Huffman et al., 1997), Climate Prediction Center (CPC) morphing technique (CMORPH) (Joyce et al., 2004), China Meteorological Forcing Dataset (CMFD) (Chen Y et al., 2011), Climate Hazards Group Infrared Precipitation with Station data (CHIRPS) (Funk et al., 2015), Multi-Source Weighted-Ensemble Precipitation (MSWEP) (Beck et al., 2017), China Meteorological Assimilation Driving Datasets for the SWAT model (CMADS) (Liu J et al., 2018), and the fifth-generation ECMWF atmospheric reanalysis of the global climate (ERA5) (ECMWF, 2018). Data that are valid for a long term and contain high resolutions are important for analyzing climate changes, water-resource management, numerical weather forecasting, disaster warning, and ecological and environmental monitoring (Luo et al., 2014; Katsanos et al., 2016; Vionnet et al., 2016; Mohammed et al., 2018; Golian et al., 2019). Therefore, it is necessary to use long-term and high-resolution reanalysis products to study the climate changes and related scientific problems in the Qilian Mountains so as to make up for the deficiency of data that basic meteorological stations have observed and recorded. However, there are still many shortcomings among reanalysis products for research and application purposes. Different reanalysis products may have great differences in the same area of study since they might differ in their data sources, numerical models, and assimilation schemes. Some studies have suggested that each of those reanalysis products has its own advantages and disadvantages in the same area of study (Huai et al., 2019). Abundant research works have been carried out regarding the theme of reanalysis products’ evaluations on various scales by comparing them with data observed over the recent years, including the evaluation works of long-term precipitation products such as CHIRPS in mainland China (Bai et al., 2018), CHIRPS and PERSIANN-CDR in Xinjiang (Gao et al., 2018), CHIRPS and MSWEP in the Qinghai–Tibet Plateau (Liu et al., 2019), and the evaluations of products with multiple climatic factors such as ERA-40 and NCEP in the Qinghai–Tibet Plateau (You et al., 2010), ERA-Interim and NCEP in Northwest China (Wang et al., 2015), CMADS and CFSR in the northeast slope of the Qinghai–Tibet Plateau (Liu J et al., 2018), and four soil temperature and moisture products (CFSv2, ERA-Interim, ERA5, and GLDAS-Noah) in the permafrost regions of the Qinghai–Tibetan Plateau (Yang et al., 2020). These studies mainly revealed the performances of the reanalysis products by calculating and analyzing the correlation and error indices between the products and their observed values. These results of the evaluation indicated that not only could the performances of reanalysis products vary from region to region, but they might also vary on different time scales in the same area of study. Not all of these released reanalysis products are capable of capturing the complex precipitation process or spatial distribution of temperature so as to meet the various requirements for the research. Therefore, it is essential to evaluate the quality of these products before using them to study the climate in the Qilian Mountains.
CMFD and ERA5-Land provide precipitation and temperature variables with long time scales and high spatial resolutions, which gives us an unprecedented opportunity to explore long-term trends towards climate changes accurately (He et al., 2020; Peng et al., 2021). Based on the integration of remote-sensing products and model results, CMFD also assimilates observations made and collected in the national weather stations. The temperature of CMFD has been evaluated over the Qinghai–Tibet Plateau by being compared with the observed data in 86 weather stations during the period of 1980–2018 (Peng et al., 2021), and the results indicate that CMFD performs the best when compared to other products in China. The CMFD precipitation product is also used for detecting the temporal and spatial patterns of extreme precipitation events over the Qinghai–Tibet Plateau from 1981 to 2014 (He et al., 2021). The results indicate that CMFD slightly underestimates extreme precipitation indices (except for those of consecutive humid days), but it is generally superior to other datasets in terms of its ability to capture the spatiotemporal patterns of most extreme precipitation indices over the Qinghai–Tibet Plateau. However, the evaluation of extreme precipitation in the Qilian Mountains through the use of CMFD is subject to further discussion. ERA5-Land is being widely used nowadays, and it is used less frequently to assess precipitation and temperature for the high-altitude mountainous areas relative to other reanalysis products. For example, ERA5-Land and UERRA MESCAN-SURFEX (UMS) are used as gridded weather data sources for assessing crop-reference evapotranspiration in irrigation water-budget analyses on regional scales, and the results of the assessment indicate that ERA5-Land outperformed UMS in both weather data and evapotranspiration estimates (Pelosi et al., 2020). ERA5-Land contains not only a variety of climatic elements pertaining to the ground but also several pieces of information regarding soil, in which soil temperature and humidity are widely recorded. The soil temperature of ERA5-Land in permafrost regions was evaluated based on the observations and published permafrost products (Cao et al., 2020). The results show that ERA5-Land overestimates the soil temperature in northern Canada and Alaska, but underestimates it in regions with mid–low latitudes, leading to a bias that averages −0.08°C. Moreover, the warm bias of ERA5-Land soil is stronger in winter than that in the other seasons, and ERA5-Land overestimates active-layer thickness and underestimates it in near-surface (<1.89 m) permafrost areas. In summary, the soil data which are analyzed by ERA5-Land are not well suited for providing information on permafrost research and decision-making directly.
Although CMFD and ERA-Land products with high resolutions have been used extensively, there are few studies geared toward regional climatic trends. In addition, the assessment of products which reanalyze precipitation and temperature in the Qilian Mountains is mostly carried out as a part of the evaluation work on the Qinghai–Tibet Plateau, and the existing studies focus on a daily scale. However, the length and spatial resolution of the data are more important in climate-related research. Therefore, the evaluation of reanalysis products has also become very important on monthly or seasonal scales for the study of regional climatic trends in the long term. In this study, the accuracy of the two long-term, high-resolution, and gridded products (CMFD and ERA5-Land) were evaluated on a monthly scale by being compared with the data that had been obtained from 28 meteorological stations in the Qilian Mountains. We attempt to evaluate and compare these two products. We expect that our work will provide a basis for the future use of the reanalysis products for climate-related research in the Qilian Mountains. Through this study, we hope to reflect the climate changes characteristics of the Qilian Mountains and provide some suggestions and support on climatic data for the relevant research at the Qilian Mountains in the future. Thus, the aims of this study are as follows: 1) to evaluate the precipitation and temperature reanalysis products of CMFD and ERA5-Land on a monthly scale by making comparisons with the climatic observations made in the Qilian Mountains from 1980 to 2018; 2) to analyze the climatic trends of precipitation and temperature in the Qilian Mountains through use of these reanalysis products; 3) to discuss some comparisons made between CMFD and ERA5-Land, and then to present their applicability in the different areas of the Qilian Mountains.
The Qilian Mountains (36°-40°N and 94°-104°E) is located in northwestern China. It is a huge mountain system composed of many paralleled mountains and wide valleys trending northwest. Its elevation averages more than 4000 m (Figure 1). Approximately 2684 glaciers exist in the high mountains of the Qilian Mountains, which have a total area of 1597.81 ± 70.30 Km2 and a total ice volume of about 84.48 Km3 (Guo et al., 2015). The annual mean air temperature in the Qilian Mountains is less than 2°C, and the annual precipitation increases from about 200 mm in the low-mountain zone to about 500 mm in the high-mountain zone (Li et al., 2019). Many inland rivers (Shiyang River, Heihe River, and Shule River) originate from the Qilian Mountains (Zhang et al., 2014). The Qilian Mountains is adjacent to the Qaidam Basin in the West and Badain Jaran and Tengger Deserts in the East. It plays an important and irreplaceable role in maintaining ecological security in western China.
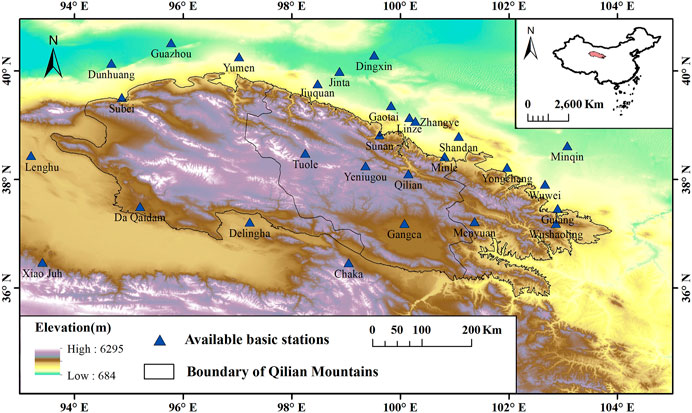
FIGURE 1. Map of the study area and location of 28 weather stations in the Qilian Mountains and its surroundings.
The observed dataset, which comprises eight meteorological elements, including the air temperature, precipitation, relative humidity, wind direction and speed, is provided by the China Meteorological Administration Meteorological Data Center (http://data.cma.cn/) for the period of 1980–2018. It also contains climate-related data collected by 699 meteorological stations. After going through a strict quality check, the quality and completeness of each variable have been significantly improved. The present study selects observations made by 28 meteorological stations in the Qilian Mountains (Table 1 and Figure 1). These stations are mostly sporadically located in the low-altitude area around the Qilian Mountains. The elevations of 22 stations are lower than 3,000 m, and only of the rest six are higher than 3000 m. The one with the highest elevation is 3,367 m high.

TABLE 1. Location information of the basic weather stations.
CMFD is the first high spatiotemporal resolution meteorological forcing dataset for land process studies in China (http://data.tpdc.ac.cn). It includes seven meteorological elements such as air temperature, precipitation rate, downward short-wave radiation, and downward long-wave radiation. CMFD originates from multiple data sources, including Princeton reanalysis datasets, GEWEX-SRB, GLDAS, TRMM 3B42 precipitation datasets, and in situ observations. It was developed by the Institute of Tibetan Plateau Research at the Chinese Academy of Science (He et al., 2020). CMFD provides precipitation and temperature data within China from 1979 to 2018 with a spatial resolution of 0.1° and a temporal resolution of 3 h. CMFD has removed the values of the non-physical range and uses ANU-Spline statistical interpolation algorithm with an accuracy that is between the observational data of the Meteorological Bureau and the remote-sensing data (Yang and He, 2019). Owing to its long temporal coverage and high spatiotemporal resolution, CMFD has become one of the most widely used meteorological datasets in China (Wu et al., 2019; Liu et al., 2020). Its monthly precipitation and temperature gridded products from 1980 to 2018 are used in this study.
ERA5 (http://climate.copernicus.eu/climate-reanalysis) is provided by the European Centre for Medium-Range Weather Forecasts (ECMWF), which is an updated reanalysis product that has replaced ERA-Interim since September 2019 (Hersbach et al., 2019). To date, ERA5 contains a detailed record of the global atmosphere from 1950 to the near present (Wang C et al., 2019). ERA5-Land has been produced by replaying the land component of the ERA5 climate reanalysis. Reanalysis combines model data with observations made from across the world into a globally complete and consistent dataset by using the laws of physics. ERA5-land includes air temperature, total precipitation, relative humidity, evaporation, and other climatic elements. Its hourly and monthly datasets span from the year 1950 to the near present, with a very high spatial resolution of 0.1°. Its horizontal coverage is global. The monthly precipitation and temperature data of ERA5-Land from 1980 to 2018 have been evaluated in this study.
In order to thoroughly evaluate the applicability of the above two products toward reanalyzing the climate in the Qilian Mountains, we selected 28 stations with relatively complete data that could be obtained in the region as the comparative data. Strict quality control measures with respect to site-observed meteorological data were carried out in this study. The potential error data (outliers) in the observed data were carefully checked out and eliminated. The precipitation and temperature drawn from the gridded data, which contain the location of weather stations, were compared with the corresponding observations by the flowing statistic metrics. As we know, the spatial representation of the station is limited. Therefore, we use the spatial matching method to solve the uncertainty of the method (Lu et al., 2021; Jiang et al., 2022). The correlation coefficient (CC), root mean square error (RMSE), mean absolute error (MAE), and relative bias (BIAS) were all used to quantify the monthly differences among the observed data and reanalysis products in the Qilian Mountains. These statistical indices have been widely used in similar evaluation studies (Wang et al., 2016; Feng et al., 2018; Wang L et al., 2019). Some of the detailed information regarding statistical metrics is displayed in Table 2. In the formula,
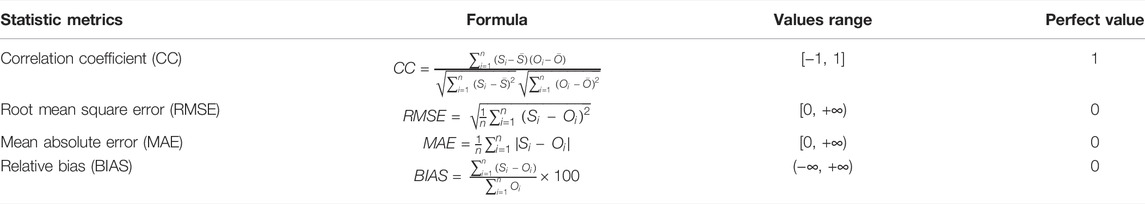
TABLE 2. Information on the statistical indices used in this study.
To estimate the accuracy of reanalysis data in different regions, we calculated the error indexes for CC, RMSE, MAE, and BIAS one by one for each site during the period of 1980–2018. In order to evaluate the quality of reanalysis data in different seasons, we divided the seasons into spring (March to May), summer (June to August), autumn (September to November), and winter (December to February).
The spatial distribution of average monthly precipitation in the Qilian Mountains is shown in Figure 2. OBS, CMFD, and ERA5-Land are presented through the use of amplified cell sizes for each site in Figures 2A–C, and gridded precipitation products are displayed in Figures 2D,E. Both reanalysis products can well reproduce the spatial distribution characteristics of mean monthly precipitations during the period of 1980–2018, which is verified by comparing them with the observed values. CMFD turned out to perform better than ERA5-Land did. Both CMFD and ERA5-Land products showed the pattern that the precipitation decreases from southeast to northwest in the Qilian Mountains, where the East Asian monsoon is blocked and uplifted to form rich precipitations. There is more precipitation in the eastern Qilian Mountains under the combined actions of water vapor from East and South Asia. The eastern Qilian Mountains has the most amount of precipitation (i.e., monthly precipitation within 30–50 mm/month as displayed by CMFD, whereas ERA5-Land displays it as higher than 50 mm/month). The precipitation in the Qilian Mountains is characterized by more in the centers and less in the surroundings (i.e., monthly precipitation is mainly within 0–10 mm/month, as shown in Figure 2A), which is a typical topographic precipitation. Both CMFD and ERA5-Land correctly identified the spatial distribution of precipitation, except for some overestimation in the high-altitude areas. Meanwhile, ERA5-Land apparently overestimated the precipitation in the central and eastern parts of the Qilian Mountains when compared with what was estimated by CMFD (Figure 2C). The precipitation in the western part of the Qilian Mountains is low, the result of which, as analyzed by the two products, is basically in agreement with the observed data. Figures 2D,E show the gridded distribution of precipitation as derived from CMFD and ERA5-Land. The distributions generated by the two products are roughly the same, and the difference is that ERA5-Land shows more precipitation in the Qilian Mountains than CMFD does.
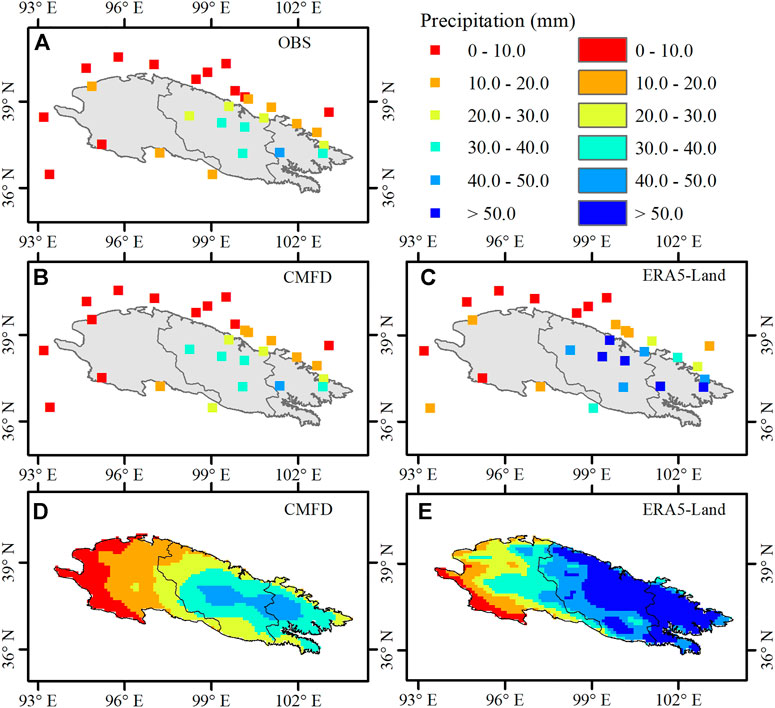
FIGURE 2. (A–C) Spatial distribution of mean monthly precipitation in the Qilian Mountains for the period 1980–2018, from station observations (OBS), CMFD (D) and ERA5-Land (E).
A comprehensive comparison between CMFD and ERA5-Land was also made with respect to the precipitation in the Qilian Mountains based on the monthly precipitation data observed in the 28 stations. Figures 3A,B show the scatter plots of precipitation through the use of the two precipitation products against OBS in the Qilian Mountains from 1980 to 2018. As seen in Figure 3C, the precipitation in the Qilian Mountains gradually increased over recent decades, and there had been an obvious mutation from the end of the 19th century to the beginning of the 20th century. There is a good correlation between CMFD and OBS under different conditions with respect to the different amounts of precipitation (Figure 3A). However, with an increase in monthly precipitation, the overestimation by ERA5-Land becomes more obvious (R2 = 0.707). Figure 3C shows the annual average monthly precipitation, which is derived by CMFD and ERA5-Land. We find that the time-series trends produced by CMFD and ERA5-Land are in good agreement with those under OBS, with the only exception that precipitation is seriously overestimated by ERA5-Land on the whole.
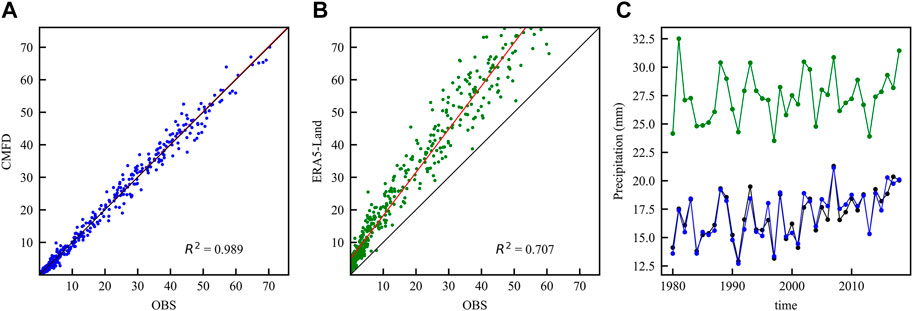
FIGURE 3. Scatter plots of the site observations versus monthly precipitation estimates derived from (A) CMFD and (B) ERA5-Land. The black solid line is the 1:1 line, and the red solid one represents the linear regression fitting line. (C) Time series of mean monthly precipitation in the Qilian Mountains for the period 1980–2018, from observations (OBS, thin black line), CMFD (thin blue line), and ERA5-Land (thin green line).
To more accurately evaluate the accuracy of monthly precipitation, the average monthly CC, RMSE, MAE, and BIAS over all stations were calculated from 1980 to 2018. Figure 4 shows the spatial distribution of the four statistical metrics for CMFD and ERA5-Land as precipitation reanalysis products based on a monthly scale. Figures 4A,B show the spatial distribution of CC as derived from the two products. While both products made a good performance in CC, CMFD is relatively better than ERA5-land in this regard. Figures 4A,B indicate that the CC values of CMFD and ERA5-Land are high in the Qilian Mountains, and almost all of the values are higher than 0.80. However, the CC value of ERA5-Land in the low-altitude area around the Qilian Mountains is lower than that in the interior of the Qilian Mountains, which is opposite to CMFD. Figures 4C,D show the spatial distribution of RMSE. Both CMFD and ERA5-Land show that RMSE decreases gradually from the middle to the periphery. The RMSE values of ERA5-Land are higher than those of CMFD in the central and northern parts of the Qilian Mountains, that is, the number of stations with a large RMSE value (RMSE higher than 7.5 mm) of ERA5-Land is significantly more than that of CMFD. The number of stations marked by the smaller size (RMSE within 0–4 mm) of CMFD is less than that of ERA5-Land as a whole, which indicates that the RMSE value of ERA5-Land is higher than that of CMFD. According to the comparison and verification with the observed results, the MAE value of CMFD is small, and ERA5-Land presents a larger MAE (Figures 4E,F). Considerable differences appear in the performances of the two reanalysis products for monthly precipitation in the regions with different altitudes. In terms of the performance of RMSE and MAE, the two precipitation products show that RMSE and MAE in the central and eastern parts of the Qilian Mountains are higher than that in the west. The small values of RMSE and MAE mainly appear in the areas with less precipitation, while the large values mostly occur in the areas with abundant precipitation. Figures 4G,H display the spatial distribution of BIAS. Precipitations obtained in many stations in the eastern and middle parts of the Qilian Mountains are heavily overestimated by ERA5-Land, and they are marked by large purple points (BIAS >15%). Both CMFD and ERA5-Land overestimated the precipitation of the two stations in the western end of the Qilian Mountains, whereas CMFD only slightly overestimated or underestimated the precipitation of most stations in the Qilian Mountains (−15% < BIAS <15%). In comparison, the CMFD precipitation product makes a better performance, with its BIAS being smaller than that of ERA5-Land.
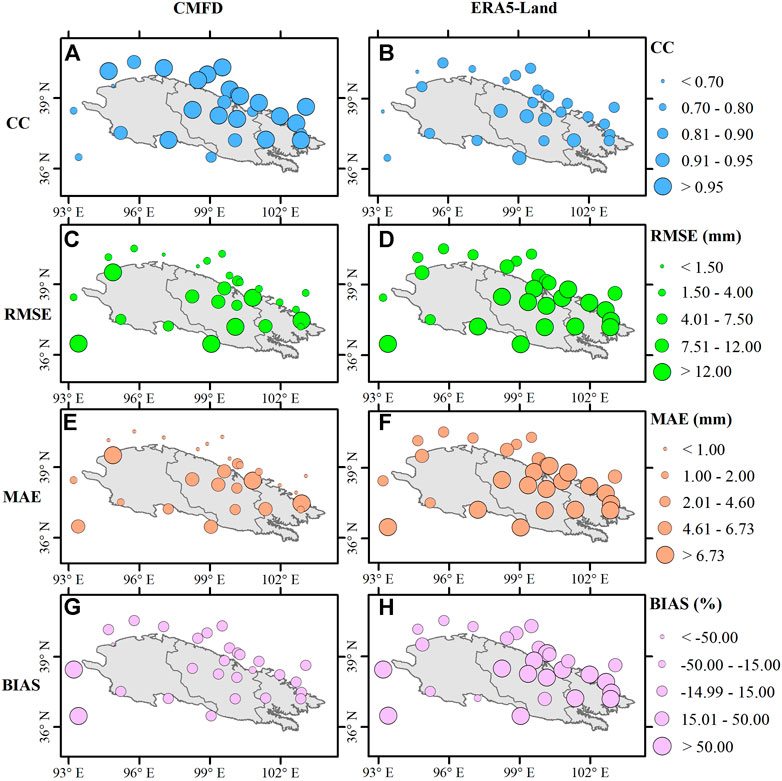
FIGURE 4. Correlation coefficients (CC) (A,B), root mean square error (RMSE) (C,D), mean absolute error (MAE) (E,F), and mean bias (BIAS) (G,H) of monthly precipitation in the two reanalysis datasets, relative to monthly mean precipitation observations.
Figure 5 shows the boxplots of the four statistical metrics which are generated by the CMFD and ERA5-Land precipitation products on a monthly scale during the period of 1980–2018. It indicates that CMFD performs better than ERA5-Land does on all statistical indicators. Figure 5A shows that the CC values of CMFD, which vary from 0.67 to 0.99 and have a mean of 0.94, are higher than those of ERA5-Land, which vary from 0.68 to 0.95 and have a mean of 0.85. This indicates that the CMFD precipitation has a higher linear correlation and is consistent with the observations. Moreover, the CC value of CMFD is significantly higher than that of ERA5-Land in different seasons in the Qilian Mountains. The mean CC value of CMFD in spring is 0.90, and those in summer, autumn, and winter are 0.88, 0.93, and 0.78, respectively. The mean CC value of ERA5-Land in spring, summer, autumn, and winter are 0.81, 0.68, 0.85, and 0.59, respectively. The CC values of CMFD and ERA5-Land are the highest in autumn and the lowest in winter. Figures 5B–D display the errors yielded by CMFD and ERA5-Land when compared with data obtained from the stations. As for RMSE and MAE, which are shown in Figures 5B,C, CMFD performs better than ERA5-Land does (the mean RMSE and MAE values of CMFD are 6.33 mm/month and 3.37 mm/month, respectively, and the mean RMSE and MAE values of ERA5-Land are 17.99 mm/month and 12.55 mm/month, respectively). The RMSE and MAE values of both CMFD and ERA5-Land are the largest in summer and the smallest in winter. Figure 5D shows that there are a lot of points of BIAS derived by CMFD and ERA5-Land which are out of range of the whole, and those points contain very large errors (e.g. the maximum BIAS of CMFD is 257.1%, and the maximum BIAS of ERA5-Land is 523.88%). The mean BIAS of CMFD is 10.76%, and that of ERA5-Land is 67.46%. From the distribution of BIAS values, CMFD and ERA5-Land have both overestimated the precipitation to varying degrees. The BIAS value of CMFD is the highest in autumn (with a mean of 21.6%), while the BIAS value of ERA5-Land is the highest in winter (with a mean of 247.24%). In general, the relative error of precipitation decreases with an increase in precipitation, while the absolute error is just the opposite of this pattern.

FIGURE 5. Boxplots of the statistical metrics [CC (A), RMSE (B), MAE (C), and BIAS (D)] for CMFD and ERA5-Land monthly precipitation against 28 observation stations data. Five lines from bottom to top for one box represent minimum value, 25th percentile, 50th percentile, 75th percentile, and maximum value, respectively. The blackspot inside the box represents the mean values.
Figure 6 shows the distribution of mean monthly temperature in the Qilian Mountains. To enhance the effect of display, the temperatures of observations and reanalysis products are presented through the use of the amplified cell sizes for each site in Figures 6A–C, and the gridded temperatures are displayed in Figures 6D,E. Both CMFD and ERA5-Land well reproduce the spatial distribution of mean monthly temperature during the period of 1980–2018, which is verified by comparing them with the station observed data. The temperature in the Qilian Mountains is low in the center (i.e., with its monthly average temperature being lower than 0°C) and gradually rises towards the surrounding areas because the temperature basically decreases linearly with an increase in altitude (Figures 6D,E). Both CMFD and ERA5-Land correctly identify the spatial distribution of temperature, though both also have a tendency to underestimate it, and this tendency appears in the middle part of the Qilian Mountains. However, when compared with precipitation estimates, the two products make a better description of the temperature in the Qilian Mountains. Figures 6D,E show the gridded distribution of temperatures which are derived by CMFD and ERA5-Land. The temperature in the Qilian Mountains decreases from southeast to northwest, and the analysis made by these two products is basically in agreement with that made by OBS. However, ERA5-Land shows a lower temperature in the central and western parts of the Qilian Mountains than CMFD does.
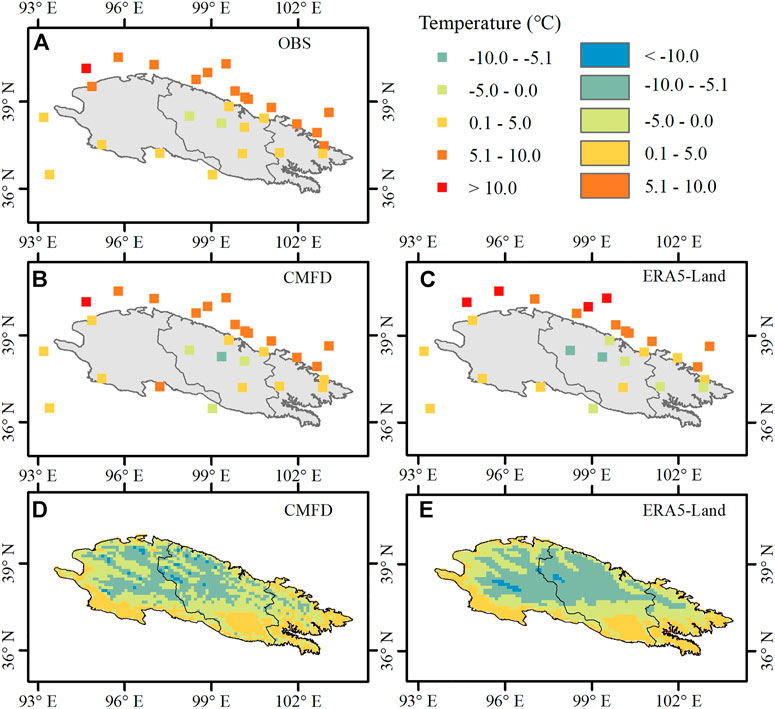
FIGURE 6. (A–C) Spatial distribution of mean monthly temperature in the Qilian Mountains for the period 1980–2018, from station observations (OBS), CMFD (D) and ERA5-Land (E).
In order to show the performance of the two temperature reanalysis products as a whole, a concise and clear comparison between CMFD and ERA5-Land is also made with respect to the climate change in the Qilian Mountains based on the temperatures that were observed in the 28 stations. Figures 7A,B show the scatter plots of the temperature generated by these two products against OBS in the Qilian Mountains on a monthly scale from 1980 to 2018. The monthly average temperatures of CMFD (R2 = 0.994) and ERA5-Land (R2 = 0.986) reveal excellent correlations with the observed results (Figures 7A,B). Figure 7C shows the annual average monthly temperature, which was derived by CMFD and ERA5-Land. We find that the time-series trends of the two products are very consistent with those of OBS, although their temperatures are underestimated at times to varying degrees. In the context of global warming, the Qilian Mountains has warmed up significantly along with the globe in recent decades (Figure 7C). Like precipitation, the Qilian Mountains had gone through an abrupt change in air temperature from the end of the 19th century to the beginning of the 20th century. The two reanalysis products in question can well simulate their warm and humid trend over the recent decades.
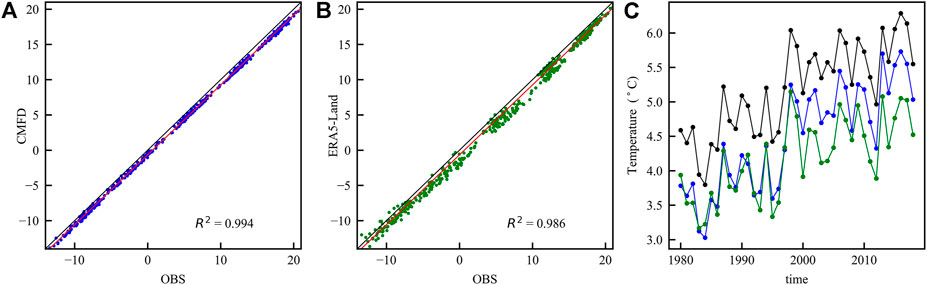
FIGURE 7. Scatter plots of the site observations versus monthly temperature estimates derived from (A) CMFD and (B) ERA5-Land. The black solid line is the 1:1 line, and the red solid one represents the linear regression fitting line. (C) Time series of mean monthly temperature in the Qilian Mountains for the period 1980–2018, from observations (OBS, thin black line), CMFD (thin blue line), and ERA5-Land (thin green line).
Figure 8 shows the spatial distribution of the four statistical metrics for the temperature reanalysis products on a monthly scale from 1980 to 2018. Figures 8A,B show the spatial distribution of CC, which is derived from the two products. The values of CC corresponding to the monthly temperature for each dataset are rather high, which are above 0.98 (Figures 8A,B). ERA5-Land has made important changes relative to the former ERA-Interim, including higher spatial and temporal resolutions, a better model input, and certain improved parameterization schemes. However, the CC value of ERA5-Land in the high-mountain areas of the Qilian Mountains is lower than that in the marginal areas of the Qilian Mountains. Figures 8C,D show the spatial distribution of RMSE. Both CMFD and ERA5-Land show that RMSE gradually decreases from high altitude to low altitude, whereas the RMSE of ERA5-Land changes slightly only. The RMSE values of ERA5-Land are higher than those of CMFD on the northern edge of the Qilian Mountains, and the number of stations with large RMSE values (higher than 1.0°C) of ERA5-Land is significantly higher than that of CMFD. Based on the verification of the observed data, the precipitation MAE is smaller for CMFD, and ERA5-Land presents a larger MAE (Figures 8E,F). In terms of the performances that RMSE and MAE made, the spatial distributions made by the two products are very similar to each other. Figures 8G,H display the spatial distribution of BIAS. Temperatures observed in the three stations in the middle part of the Qilian Mountains are heavily overestimated by CMFD and ERA5-Land, which are marked by maximum purple points (BIAS >50%). The BIAS yielded by the two products in the eastern and western parts of the Qilian Mountains is relatively small. Moreover, the BIAS yielded by ERA5-Land is less than that yielded by CMFD. Both CMFD and ERA5-Land perform well in low-altitude stations on the northern edge of the Qilian Mountains, and they only slightly overestimate or underestimate the temperature of most stations (−15% < BIAS <15%). However, ERA5-Land makes a better performance when the overall BIAS is less than that of CMFD. Due to the scarcity of observations in the high-altitude areas of the Qilian Mountains, we are more concerned about the errors generated by the two reanalysis products in the Qilian Mountains. The simulated results produced by these two products show a good performance.
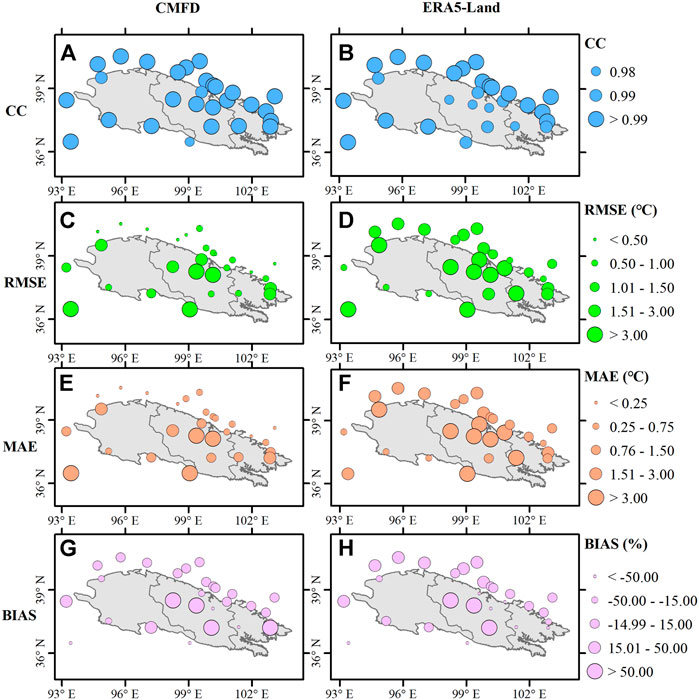
FIGURE 8. Correlation coefficients (CC) (A,B), root mean square error (RMSE) (C,D), mean absolute error (MAE) (E,F), and mean bias (BIAS) (G,H) of monthly temperature in the two reanalysis datasets, relative to monthly mean temperature observations.
Figure 9 shows the boxplots of the four statistical metrics generated by CMFD and ERA5-Land on a monthly scale during the period of 1980–2018. It indicates that CMFD performs better in CC, RMSE, and MAE, while the BIAS yielded by CMFD is greater than that yielded by ERA5-Land. Figure 9A shows that both CMFD and ERA5-Land have high CC values, which indicates that their simulated temperature values have high correlations with the station observed data. The CC of CMFD is significantly higher than that of ERA5-Land in winter (i.e. the mean of CMFD is 0.96, and the mean of ERA5-Land is 0.88). The CC values of both CMFD and ERA5-Land are higher in spring and autumn. Figures 9B–D display the errors of CMFD and ERA5-Land compared with the observed values in the stations. As for RMSE and MAE, which are shown in Figures 9B,C, CMFD performs better than ERA5-Land does (the mean RMSE and MAE values of CMFD are 1.45°C/month and 1.29°C/month, respectively, and the mean RMSE and MAE values of ERA5-Land are 2.37°C/month and 2.14°C/month, respectively). The RMSE and MAE values of CMFD differ little from each other in each season, while the maximum values of ERA5-Land appear in spring. Figure 9D shows that there are a lot of points of BIAS derived by CMFD and ERA5-Land that are out of range on the whole, and these points contain very large errors in spring and autumn (e.g., the maximum BIAS of CMFD in spring is 655.2%, and the maximum BIAS of ERA5-Land in spring is 549.16%). The mean BIAS of CMFD is 22.79%, and the mean BIAS of ERA5-Land is −19.95%. This shows that the temperature deviation between ERA5-Land and the observed data is generally smaller than that of CMFD.
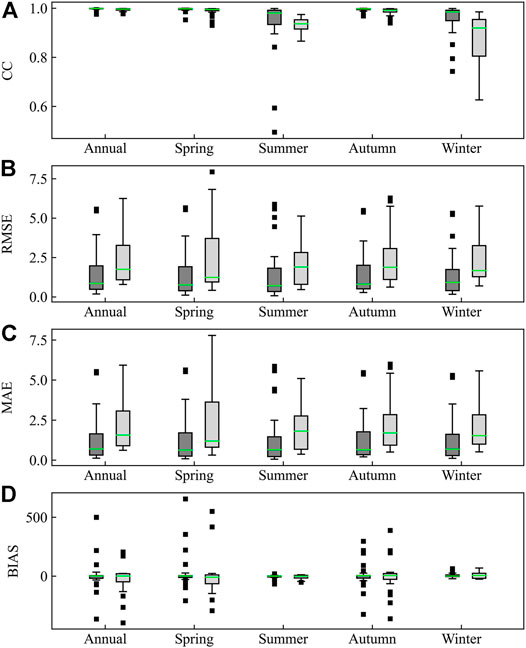
FIGURE 9. Boxplots of the statistical metrics [CC (A), RMSE (B), MAE (C), and BIAS (D)] for CMFD and ERA5-Land monthly temperature against 28 observation stations data. Five lines from bottom to top for one box represent minimum value, 25th percentile, 50th percentile, 75th percentile, and maximum value, respectively. The blackspot inside the box represents the mean values.
In recent years, many research findings on climate changes in Northwest China show that Northwest China has become warmer and more humid in recent decades as a whole. As an important part of Northwest China, do the Qilian Mountains also display this feature in the context of warmer and more humid trend in that region? To answer this question, we used CMFD and ERA5-Land to analyze the trends in climatic changes with respect to precipitation and temperature in the Qilian Mountains from 1980 to 2018. In order to show the spatial distribution of climatic trends clearly, we used the two products with high resolutions to calculate the climatic tendency rate at each grid point and displayed their values in space according to the different colors (Figure 10 and Figure 11).
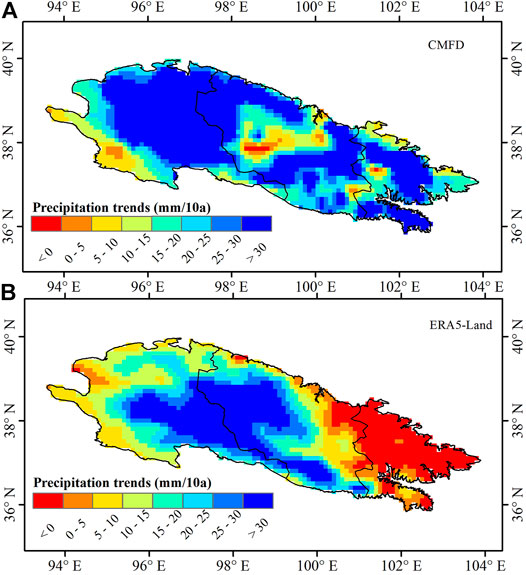
FIGURE 10. Spatial distribution of precipitation climate tendency rate in the Qilian Mountains for the period 1980–2018, from CMFD (A) and ERA5-Land (B).
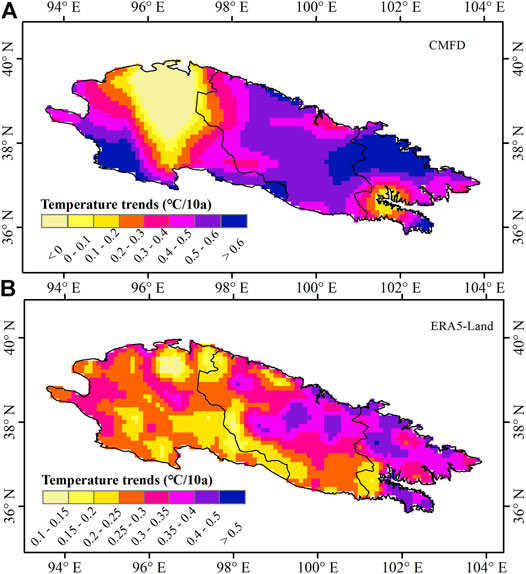
FIGURE 11. Spatial distribution of temperature climate tendency rate in the Qilian Mountains for the period 1980–2018, from CMFD (A) and ERA5-Land (B).
Through the use of linear regression analysis, we have presented the distribution of precipitation as the climate change tendency in Figure 10. There are huge differences between the two reanalysis products in terms of describing the trend of changes in precipitation over the Qilian Mountains. CMFD shows that the precipitation in most areas of the Qilian Mountains demonstrates a significant increase in such a trend. That is to say, the dark-blue grid points (with precipitation trends >30 mm/10a) in the figure account for a large proportion (Figure 10A). CMFD shows that most areas in the western part of the Qilian Mountains demonstrate a significant increase in precipitation, which is very different from the observed results in this area (e.g. Subei station, precipitation trend = 8.6 mm/10a). So, CMFD performs well in the middle and eastern parts of the Qilian Mountains, but just the opposite in the western part of the Qilian Mountains. However, ERA5-Land shows that the precipitation in the central and southern parts of the Qilian Mountains increases significantly, and the precipitation in most parts of the eastern Qilian Mountains has a slightly decreasing trend (i.e., precipitation trends <0 mm/10a, Figure 10B). The observed data in the eastern part of the Qilian Mountains show that the precipitation in this area has also increased significantly in recent decades, which proves that the simulation effect of ERA5-Land in this area is poor. In order to understand the climatic trend more comprehensively, we also used CMFD and ERA5-Land to analyze the precipitation trend of the Qilian Mountains in different seasons from 1980 to 2018 (Table 3), and the results show that the precipitation in the Qilian Mountains displays an apparent increasing trend over different periods. Furthermore, the precipitation reanalysis products show a greater trend of increase than OBS does, which indicates that the increasing trend of precipitation in mountainous areas is significantly stronger than that in the low-altitude areas. Except for the point where the precipitation in spring shows a slightly decreasing trend as analyzed by ERA5-Land, the precipitation of all other seasons shows an increasing trend. The precipitation in the Qilian Mountains increased significantly in summer and autumn, but only slightly in winter and spring. In addition, the growth rate of summer precipitation in the Qilian Mountains has gradually increased in recent decades and has increased significantly from 2010 to 2018. The sharp increase in summer precipitation may form a serious challenge to the management of disasters and predictions on runoffs in the Qilian Mountains.
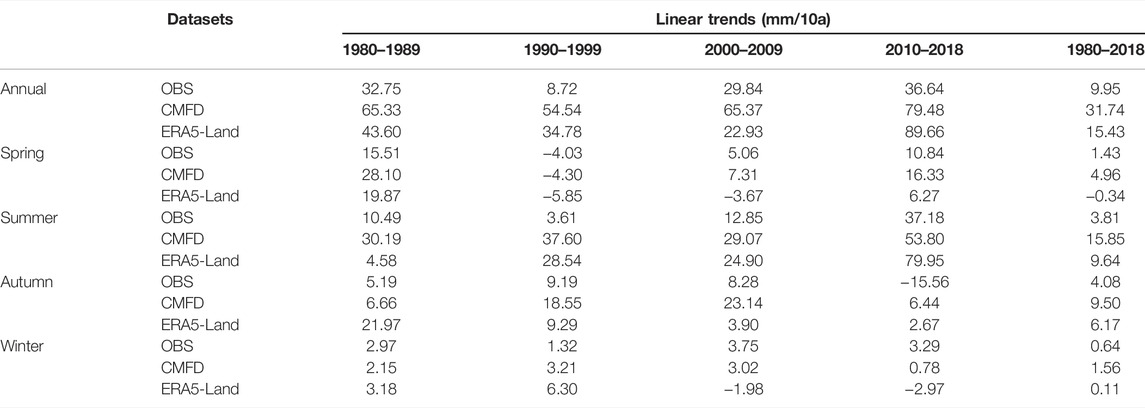
TABLE 3. Precipitation trends of the Qilian Mountains from 1980 to 2018 based on OBS, CMFD, and ERA5-Land; OBS is the average of 28 observation stations.
In the context of global warming and increasing humidity in Northwest China, the Qilian Mountains significantly warm up. As an area susceptible to climate changes, the Qilian Mountains may show different warming trends in each of its segments due to its complex terrain. The temperature climate tendency rates were calculated by the two products by using the linear regression method, and their spatial distributions are shown in Figure 11. Both CMFD and ERA5-Land show that most areas of the Qilian Mountains had a significant warming trend in recent decades, and the range of warmed areas gradually decreased from southeast to northwest. CMFD shows that the warming trend of the central part and western edges of the Qilian Mountains is significantly higher than that of ERA5-Land, and the increasing magnitude of temperature in some areas, which is displayed by CMFD, exceeds 0.6°C/10a (Figure 11A). However, CMFD shows that there is a large area of negative temperature climate tendency rate in the western part of the Qilian Mountains, which is contrary to the observed results in the region (e.g. Subei station, temperature trend = 0.15°C/10a). The values of climate tendency rates for all grid points of ERA5-Land are above zero, which indicate that the warming has been going on significantly in the Qilian Mountains (Figure 11B). Among them, the warming trend, as analyzed by ERA5-Land, is the most obvious in the central and eastern parts of the Qilian Mountains, with a rate exceeding 0.50°C/10a, while the warming rate in most areas ranges from 0.25 to 0.40°C/10a. ERA5-Land shows that the warming rate in the western part of the Qilian Mountains is the lowest, with its value being below 0.30°C/10a in most areas. Through the above comprehensive comparison, ERA5-Land makes a better description of the temperature trends in the Qilian Mountains as a whole. At the same time, the research on the overall and seasonal warming trends of the Qilian Mountains also has important practical significance for the glacier melting and ecological-environment changes. So we used CMFD and ERA5-Land to analyze the temperature change trends over the Qilian Mountains in different seasons from 1980 to 2018 (Table 4). The results show that the Qilian Mountains had distinctly warmed up over different periods, and the temperature rise at the end of the 20th century was the most significant. The warming of the Qilian Mountains in spring (with its rate of increase being 0.59°C/10a for OBS, 0.38°C/10a for CMFD, and 0.46°C/10a for ERA5-Land) is more overt than that in the other seasons. The rise of spring temperature may lead to the advance of glacier melting in alpine areas every year, which will affect the prediction of the runoffs of the Qilian Mountains. Moreover, the rise in temperature will also increase the frequency of extreme climates and disastrous events in the Qilian Mountains (Mora et al., 2017; Niu et al., 2020; Wu et al., 2021).
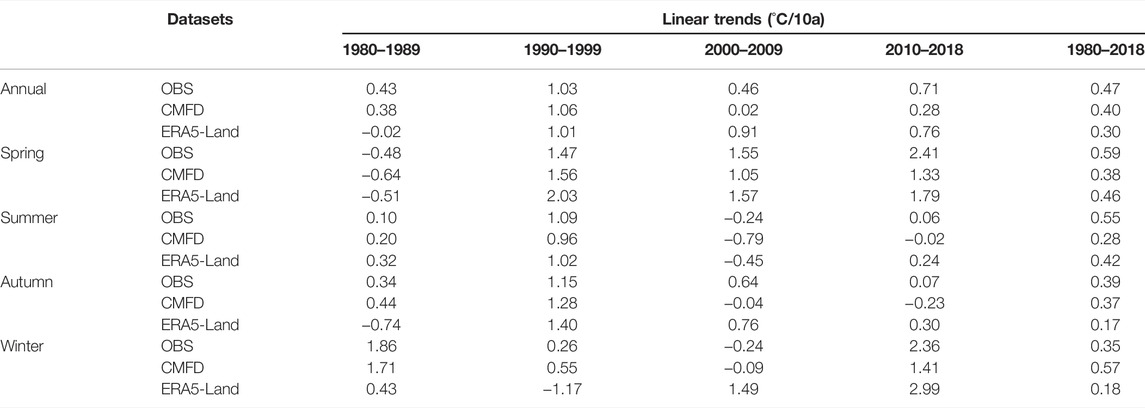
TABLE 4. Temperature trends of the Qilian Mountains from 1980 to 2018 based on OBS, CMFD, and ERA5-Land; OBS is the average of 28 observation stations.
The evaluation showed that both reanalysis products bear similar temporal patterns of precipitation and temperature against the observed data in the Qilian Mountains. However, they systematically underestimated the temperature. ERA5-Land significantly overestimates the precipitation (Figure 3 and Figure 7). Similar to the results produced from the previous studies (Ma et al., 2008; Wang and Zeng, 2012), all reanalysis products over the Qilian Mountains underestimated the temperature and overestimated the precipitation (Ma et al., 2009). The results drawn from some evaluations on a daily scale show that the daily precipitation simulation of the products is relatively poor, especially at a higher altitude. However, most reanalysis products perform fairly satisfactorily with respect to the daily temperature of the Qilian Mountains (e.g., JRA-55 and ERA5) (Huai et al., 2019; Zhao et al., 2020). This resulted mainly because the gradient relationship between the temperature and altitude in high-altitude mountains is better than that of precipitation. In this study, the results of the evaluation are very good, especially in terms of the CC of temperature. Overall, the assessment results from this study regarding precipitation and temperature which were generated by the products in question on a monthly scale are much better than those generated by other studies on a daily scale.
In order for users to use these reanalysis products better, we should analyze the potential causes for errors in more depth. For the products in question, the differences among their input data, elevations of underlying surfaces, parameterization schemes, and simulations’ time intervals may also contribute to the differences in existence among reanalysis data (Hu et al., 2019). This study pointed out that significant differences in elevation do exist between reanalysis grid cells and their corresponding stations. Moreover, the errors in elevation should not be neglected when it comes to the reanalysis products being used for practical applications (Wang and Zeng, 2012). For example, due to the complex terrain inside the Qilian Mountains, the difference in elevation between data produced by the reanalysis product and those observed in the meteorological stations will lead to errors in temperature (Wang et al., 2017; Liu Z et al., 2018). Therefore, in the practical applications of reanalysis products, it is very important to use errors in elevation to correct data on precipitation and temperature. We could also use numerical models to change the underlying surface elevation data generated by the reanalysis products to improve its accuracy level. In addition, the differences in the type of land cover, density of sites, and the period of study may also lead to the differences in existence between our results and those of other similar studies (Zeng et al., 2015; Bi et al., 2016; Deng et al., 2020). Thus, we try to ensure that the same observed data will be used when we evaluate them through the use of different reanalysis products and the period of research is consistent throughout. Of course, it will be more convincing to use more of the observed data collected in high-altitude mountainous areas for the evaluation in question.
In this study, two long-term and high-resolution reanalysis products (CMFD and ERA5-Land) over the Qilian Mountains were evaluated during the period of 1980–2018. Their precipitation and temperature were compared with the observed data of 28 meteorological stations. Four statistical indices (CC, RMSE, MAE, and BIAS) were employed to measure the performances of CMFD and ERA5-Land on a monthly scale. The major conclusions are summarized as follows:
1) Both CMFD and ERA5-Land can well reproduce the spatial distribution of the mean monthly precipitation and temperature in the Qilian Mountains during the period of 1980–2018. The precipitation decreases from southeast to northwest over the Qilian Mountains, and the temperature is low in the center and gradually increases in the surrounding areas.
2) Both reanalysis products can well describe the trends of change in precipitation and temperature over the Qilian Mountains. The CC values of CMFD and ERA5-Land precipitation products are the highest in autumn and the lowest in winter, and the CC values of CMFD and ERA5-Land temperature products are higher in spring and autumn than those in other seasons. However, both reanalysis products underestimate the temperature in the Qilian Mountains to varying degrees, and the precipitation is seriously overestimated by ERA5-Land on the whole. The results of the evaluation show that the error in precipitation made by CMFD is obviously less than that made by ERA5-Land, while the errors in air temperature are almost the same between the two.
3) Considering the error assessment results and the spatial distribution of climatic trends, we believe that the precipitation of CMFD performs better in the central and eastern parts of the Qilian Mountains, while ERA5-Land does so better in the western part of the Qilian Mountains. In terms of temperature, ERA5-Land describes it better in the Qilian Mountains overall, while CMFD describes it poorly in the western part of the Qilian Mountains. Therefore, ERA5-Land is more suitable for studying the trends of temperature changes in the Qilian Mountains than that of CMFD.
4) The reanalysis product that all climate factors are better than other products do not exist, and various reanalysis products should be combined together in doing climate-related research pertaining to the Qilian Mountains. For the situation where the elevation used by the reanalysis product is greatly different from the actual elevation in the study area, we should modify the product based on the elevation error between the two or use a numerical model to replace the underlying surface elevation with the actual elevation so as to downscale it dynamically and thus improve accuracy.
The original contributions presented in the study are included in the article/Supplementary Material; further inquiries can be directed to the corresponding author.
YL and XQ designed the study and edited the manuscript. YL analyzed meteorological data. ZJ and JL evaluated reanalysis products and modified the figures. LW and JC processed the topographic map.
Financial support is gratefully acknowledged to the Second Scientific Expedition Project on the Qinghai–Tibet Plateau (2019QZKK020103); the Strategic Leading Science and technology project of Chinese Academy of Sciences (XDA2002010202); Major projects of Natural Science Foundation of Gansu Province (18JR2RA002) and the State Key Laboratory of Cryospheric Sciences (SKLCS-ZZ-2022).
The authors declare that the research was conducted in the absence of any commercial or financial relationships that could be construed as a potential conflict of interest.
All claims expressed in this article are solely those of the authors and do not necessarily represent those of their affiliated organizations, or those of the publisher, the editors, and the reviewers. Any product that may be evaluated in this article, or claim that may be made by its manufacturer, is not guaranteed or endorsed by the publisher.
Many thanks are also extended to colleagues working at the Qilian Station of Glaciology and Ecological Environment.
Bai, L., Shi, C., Li, L., Yang, Y., and Wu, J. (2018). Accuracy of CHIRPS Satellite-Rainfall Products over Mainland China. Remote Sens. 10, 362. doi:10.3390/rs10030362
Beck, H. E., van Dijk, A. I. J. M., Levizzani, V., Schellekens, J., Miralles, D. G., Martens, B., et al. (2017). MSWEP: 3-hourly 0.25° Global Gridded Precipitation (1979-2015) by Merging Gauge, Satellite, and Reanalysis Data. Hydrol. Earth Syst. Sci. 21, 589–615. doi:10.5194/hess-21-589-2017
Bi, H., Ma, J., Zheng, W., and Zeng, J. (2016). Comparison of Soil Moisture in GLDAS Model Simulations and In Situ Observations over the Tibetan Plateau. J. Geophys. Res. Atmos. 121 (6), 2658–2678. doi:10.1002/2015JD024131
Cao, B., Gruber, S., Zheng, D., and Li, X. (2020). The ERA5-Land Soil Temperature Bias in Permafrost Regions. Cryosphere 14, 2581–2595. doi:10.5194/tc-14-2581-2020
Chen, F., Yuan, Y., and Wei, W. (2011). Climatic Response of Picea Crassifolia Tree-Ring Parameters and Precipitation Reconstruction in the Western Qilian Mountains, China. J. Arid Environ. 75 (11), 1121–1128. doi:10.1016/j.jaridenv.2011.06.010
Chen, M., Shi, W., Xie, P., Silva, V. B. S., Kousky, V. E., Wayne Higgins, R., et al. (2008). Assessing Objective Techniques for Gauge-Based Analyses of Global Daily Precipitation. J. Geophys. Res. 113, D04110. doi:10.1029/2007JD009132
Chen, Y., Yang, K., He, J., Qin, J., Shi, J., Du, J., et al. (2011). Improving Land Surface Temperature Modeling for Dry Land of China. J. Geophys. Res. 116, D20104. doi:10.1029/2011JD015921
Dehecq, A., Gourmelen, N., Gardner, A. S., Brun, F., Goldberg, D., Nienow, P. W., et al. (2019). Twenty-first Century Glacier Slowdown Driven by Mass Loss in High Mountain Asia. Nat. Geosci. 12, 22–27. doi:10.1038/s41561-018-0271-9
Deng, M., Meng, X., Li, Z., Lyv, Y., Lei, H., Zhao, L., et al. (2020). Responses of Soil Moisture to Regional Climate Change over the Three Rivers Source Region on the Tibetan Plateau. Int. J. Climatol. 40 (4), 2403–2417. doi:10.1002/joc.6341
ECMWF (2018). What Are the Changes From ERA-Interim to ERA5? Available at: https://confluence.ecmwf.Int//pages/viewpage.action?pageId=74764925 (Accessed December 15, 2021).
Feng, L., Lin, A., Wang, L., Qin, W., and Gong, W. (2018). Evaluation of Sunshine-Based Models for Predicting Diffuse Solar Radiation in China. Renew. Sustain. Energy Rev. 94, 168–182. doi:10.1016/j.rser.2018.06.009
Funk, C., Peterson, P., Landsfeld, M., Pedreros, D., Verdin, J., Shukla, S., et al. (2015). The Climate Hazards Infrared Precipitation with Stations-A New Environmental Record for Monitoring Extremes. Sci. Data 2, 150066. doi:10.1038/sdata.2015.66
Gao, F., Zhang, Y., Chen, Q., Wang, P., Yang, H., Yao, Y., et al. (2018). Comparison of Two Long-Term and High-Resolution Satellite Precipitation Datasets in Xinjiang, China. Atmos. Res. 212, 150–157. doi:10.1016/j.atmosres.2018.05.016
Geng, L., Che, T., Wang, X., and Wang, H. (2019). Detecting Spatiotemporal Changes in Vegetation with the BFAST Model in the Qilian Mountain Region during 2000-2017. Remote Sens. 11 (2), 103. doi:10.3390/rs11020103
Golian, S., Javadian, M., and Behrangi, A. (2019). On the Use of Satellite, Gauge, and Reanalysis Precipitation Products for Drought Studies. Environ. Res. Lett. 14 (7), 075005. doi:10.1088/1748-9326/ab2203
Guo, W., Liu, S., Xu, J., Wu, L., Shangguan, D., Yao, X., et al. (2015). The Second Chinese Glacier Inventory: Data, Methods and Results. J. Glaciol. 61 (226), 357–372. doi:10.3189/2015JoG14J209
He, J., Yang, K., Tang, W., Lu, H., Qin, J., Chen, Y., et al. (2020). The First High-Resolution Meteorological Forcing Dataset for Land Process Studies over China. Sci. Data 7, 25. doi:10.1038/s41597-020-0369-y
He, Q., Yang, J., Chen, H., Liu, J., Ji, Q., Wang, Y., et al. (2021). Evaluation of Extreme Precipitation Based on Three Long-Term Gridded Products over the Qinghai-Tibet Plateau. Remote Sens. 13, 3010. doi:10.3390/rs13153010
Hersbach, H., Bell, B., Berrisford, P., Horányi, A., Sabater, M. J., Nicolas, J., et al. (2019). Global Reanalysis: Goodbye ERA-Interim, Hello ERA5. ECMWF Newsl. 159, 17–24. Available at: https://www.ecmwf.int/en/newsletter/159/meteorology/global-reanalysis-goodbye-era-interim-hello-era5 (Accessed October 11, 2021).
Hijmans, R. J., Cameron, S. E., Parra, J. L., Jones, P. G., and Jarvis, A. (2005). Very High Resolution Interpolated Climate Surfaces for Global Land Areas. Int. J. Climatol. 25 (15), 1965–1978. doi:10.1002/joc.1276
Hu, G., Zhao, L., Li, R., Wu, X., Wu, T., Xie, C., et al. (2019). Variations in Soil Temperature from 1980 to 2015 in Permafrost Regions on the Qinghai-Tibetan Plateau Based on Observed and Reanalysis Products. Geoderma 337, 893–905. doi:10.1016/j.geoderma.2018.10.044
Huai, B., Wang, Y., Ding, M., Zhang, J., and Dong, X. (2019). An Assessment of Recent Global Atmospheric Reanalyses for Antarctic Near Surface Air Temperature. Atmos. Res. 226, 181–191. doi:10.1016/j.atmosres.2019.04.029
Huffman, G. J., Adler, R. F., Arkin, P., Chang, A., Ferraro, R., Gruber, A., et al. (1997). The Global Precipitation Climatology Project (GPCP) Combined Precipitation Dataset. Bull. Amer. Meteor. Soc. 78 (1), 5–20. doi:10.1175/1520-0477(1997)078<0005:tgpcpg>2.0.co;2
Jiang, D., Wang, L., Yi, X., Su, X., and Zhang, M. (2022). Comprehensive Evaluation of Multisource Aerosol Optical Depth Gridded Products over China. Atmos. Environ. 278, 119088. doi:10.1016/j.atmosenv.2022.119088
Jing, X., Geerts, B., Wang, Y., and Liu, C. (2017). Evaluating Seasonal Orographic Precipitation in the Interior Western United States Using Gauge Data, Gridded Precipitation Estimates, and a Regional Climate Simulation. J. Hydrometeorol. 18, 2541–2558. doi:10.1175/JHM-D-17-0056.1
Joyce, R. J., Janowiak, J. E., Arkin, P. A., and Xie, P. (2004). CMORPH: A Method that Produces Global Precipitation Estimates from Passive Microwave and Infrared Data at High Spatial and Temporal Resolution. J. Hydrometeor 5 (3), 487–503. doi:10.1175/1525-7541(2004)005<0487:camtpg>2.0.co;2
Katsanos, D., Retalis, A., Tymvios, F., and Michaelides, S. (2016). Analysis of Precipitation Extremes Based on Satellite (CHIRPS) and In Situ Dataset over Cyprus. Nat. Hazards 83, 53–63. doi:10.1007/s11069-016-2335-8
Li, Z., Yuan, R., Feng, Q., Zhang, B., Lv, Y., Li, Y., et al. (2019). Climate Background, Relative Rate, and Runoff Effect of Multiphase Water Transformation in Qilian Mountains, the Third Pole Region. Sci. Total Environ. 663, 315–328. doi:10.1016/j.scitotenv.2019.01.339
Lin, P., He, Z., Du, J., Chen, L., Zhu, X., and Li, J. (2017). Recent Changes in Daily Climate Extremes in an Arid Mountain Region, a Case Study in Northwestern China's Qilian Mountains. Sci. Rep. 7, 2245. doi:10.1038/s41598-017-02345-4
Liu, J., Shangguan, D., Liu, S., Ding, Y., Wang, S., and Wang, X. (2019). Evaluation and Comparison of CHIRPS and MSWEP Daily-Precipitation Products in the Qinghai-Tibet Plateau during the Period of 1981-2015. Atmos. Res. 230, 104634. doi:10.1016/j.atmosres.2019.104634
Liu, J., Shanguan, D., Liu, S., and Ding, Y. (2018). Evaluation and Hydrological Simulation of CMADS and CFSR Reanalysis Datasets in the Qinghai-Tibet Plateau. Water 10 (4), 513. doi:10.3390/w10040513
Liu, Y., Xu, J., Lu, X., and Nie, L. (2020). Assessment of Glacier‐ and Snowmelt‐driven Streamflow in the Arid Middle Tianshan Mountains of China. Hydrol. Process. 34 (12), 2750–2762. doi:10.1002/hyp.13760
Liu, Z., Liu, Y., Wang, S., Yang, X., Wang, L., Baig, M. H. A., et al. (2018). Evaluation of Spatial and Temporal Performances of ERA-Interim Precipitation and Temperature in Mainland China. J. Clim. 31 (11), 4347–4365. doi:10.1175/JCLI-D-17-0212.1
Lu, Y., Wang, L., Hu, B., Zhang, M., Qin, W., Zhou, J., et al. (2021). Evaluation of Satellite Land Surface Albedo Products over China Using Ground-Measurements. Int. J. Digital Earth 14 (11), 1493–1513. doi:10.1080/17538947.2021.1946179
Luo, Y., Wang, Z., Liu, X., and Zhang, M. (2014). Spatial and Temporal Variability of Precipitation in Haihe River Basin, China: Characterization and Management Implications. Adv. Meteorology 2014, 1–9. Article ID 143246. doi:10.1155/2014/143246
Ma, L., Zhang, T., Frauenfeld, O. W., Ye, B., Yang, D., and Qin, D. (2009). Evaluation of Precipitation from the ERA-40, NCEP-1, and NCEP-2 Reanalyses and CMAP-1, CMAP-2, and GPCP-2 with Ground-Based Measurements in China. J. Geophys. Res. 114, D09105. doi:10.1029/2008JD011178
Ma, L., Zhang, T., Li, Q., Frauenfeld, O. W., and Qin, D. (2008). Evaluation of ERA-40, NCEP-1, and NCEP-2 Reanalysis Air Temperatures with Ground-Based Measurements in China. J. Geophys. Res. 113, D15115. doi:10.1029/2007JD009549
Mohammed, I., Bolten, J., Srinivasan, R., and Lakshmi, V. (2018). Improved Hydrological Decision Support System for the Lower Mekong River Basin Using Satellite-Based Earth Observations. Remote Sens. 10 (6), 885. doi:10.3390/rs10060885
Mora, C., Dousset, B., Caldwell, I. R., Powell, F. E., Geronimo, R. C., Bielecki, C. R., et al. (2017). Global Risk of Deadly Heat. Nat. Clim. Change 7, 501–506. doi:10.1038/nclimate3322
Niu, Z., Wang, L., Fang, L., Li, J., and Yao, R. (2020). Spatiotemporal Variations in Monthly Relative Humidity in China Based on Observations and CMIP5 Models. Int. J. Climatol. 40 (15), 6382–6395. doi:10.1002/joc.6587
Pelosi, A., Terribile, F., D’Urso, G., and Chirico, G. (2020). Comparison of ERA5-Land and UERRA MESCAN-SURFEX Reanalysis Data with Spatially Interpolated Weather Observations for the Regional Assessment of Reference Evapotranspiration. Water 12 (6), 1669. doi:10.3390/w12061669
Peng, X., Frauenfeld, O. W., Jin, H., Du, R., Qiao, L., Zhao, Y., et al. (2021). Assessment of Temperature Changes on the Tibetan Plateau during 1980-2018. Earth Space Sci. 8 (4), e2020EA001609. doi:10.1029/2020EA001609
Qin, Y., Liu, W., Guo, Z., and Xue, S. (2020). Spatial and Temporal Variations in Soil Temperatures over the Qinghai-Tibet Plateau from 1980 to 2017 Based on Reanalysis Products. Theor. Appl. Climatol. 140, 1055–1069. doi:10.1007/s00704-020-03149-9
Vionnet, V., Dombrowski-Etchevers, I., Lafaysse, M., Quéno, L., Seity, Y., and Bazile, E. (2016). Numerical Weather Forecasts at Kilometer Scale in the French Alps: Evaluation and Application for Snowpack Modeling. J. Hydrometeorol. 17 (10), 2591–2614. doi:10.1175/JHM-D-15-0241.1
Wang, A., and Zeng, X. (2012). Evaluation of Multireanalysis Products with In Situ Observations over the Tibetan Plateau. J. Geophys. Res. 117, D05102. doi:10.1029/2011JD016553
Wang, C., Graham, R. M., Wang, K., Gerland, S., and Granskog, M. A. (2019). Comparison of ERA5 and ERA-Interim Near-Surface Air Temperature, Snowfall and Precipitation over Arctic Sea Ice: Effects on Sea Ice Thermodynamics and Evolution. Cryosphere 13 (6), 1661–1679. doi:10.5194/tc-13-1661-2019
Wang, L., Kisi, O., Zounemat-Kermani, M., Salazar, G. A., Zhu, Z., and Gong, W. (2016). Solar Radiation Prediction Using Different Techniques: Model Evaluation and Comparison. Renew. Sustain. Energy Rev. 61, 384–397. doi:10.1016/j.rser.2016.04.024
Wang, L., Lu, Y., Zou, L., Feng, L., Wei, J., Qin, W., et al. (2019). Prediction of Diffuse Solar Radiation Based on Multiple Variables in China. Renew. Sustain. Energy Rev. 103, 151–216. doi:10.1016/j.rser.2018.12.029
Wang, S., Zhang, M., Sun, M., Wang, B., Huang, X., Wang, Q., et al. (2015). Comparison of Surface Air Temperature Derived from NCEP/DOE R2, ERA-Interim, and Observations in the Arid Northwestern China: a Consideration of Altitude Errors. Theor. Appl. Climatol. 119, 99–111. doi:10.1007/s00704-014-1107-1
Wang, X., Pang, G., Yang, M., and Zhao, G. (2017). Evaluation of Climate on the Tibetan Plateau Using ERA-Interim Reanalysis and Gridded Observations during the Period 1979-2012. Quat. Int. 444, 76–86. doi:10.1016/j.quaint.2016.12.041
Wu, X., Wang, L., Yao, R., Luo, M., and Li, X. (2021). Identifying the Dominant Driving Factors of Heat Waves in the North China Plain. Atmos. Res. 252, 105458. doi:10.1016/j.atmosres.2021.105458
Wu, Y., Guo, L., Zheng, H., Zhang, B., and Li, M. (2019). Hydroclimate Assessment of Gridded Precipitation Products for the Tibetan Plateau. Sci. Total Environ. 660, 1555–1564. doi:10.1016/j.scitotenv.2019.01.119
Xie, S., Qu, J., Lai, Y., Xu, X., and Pang, Y. (2015). Key Evidence of the Role of Desertification in Protecting the Underlying Permafrost in the Qinghai-Tibet Plateau. Sci. Rep. 5, 15152. doi:10.1038/srep15152
Yang, K., and He, J. (2019). China Meteorological Forcing Dataset (1979-2018). Beijing: National Tibetan Plateau Data Center. doi:10.11888/AtmosphericPhysics.tpe.249369.file
Yang, S., Li, R., Wu, T., Hu, G., Xiao, Y., Du, Y., et al. (2020). Evaluation of Reanalysis Soil Temperature and Soil Moisture Products in Permafrost Regions on the Qinghai-Tibetan Plateau. Geoderma 377, 114583. doi:10.1016/j.geoderma.2020.114583
You, Q., Kang, S., Pepin, N., Flügel, W.-A., Yan, Y., Behrawan, H., et al. (2010). Relationship between Temperature Trend Magnitude, Elevation and Mean Temperature in the Tibetan Plateau from Homogenized Surface Stations and Reanalysis Data. Glob. Planet. Change 71 (1-2), 124–133. doi:10.1016/j.gloplacha.2010.01.020
Zeng, J., Li, Z., Chen, Q., Bi, H., Qiu, J., and Zou, P. (2015). Evaluation of Remotely Sensed and Reanalysis Soil Moisture Products over the Tibetan Plateau Using In-Situ Observations. Remote Sens. Environ. 163, 91–110. doi:10.1016/j.rse.2015.03.008
Zhang, L., Zhang, Q., Feng, J. Y., Bai, H. Z., Zhao, J. H., and Xu, X. H. (2014). A Study of Atmospheric Water Cycle over the Qilian Mountains (I): Variation of Annual Water Vapor Transport. J. Glaciol. Geocryol. 36 (5), 1079–1091. doi:10.7522/j.issn.1000-0240.2014.0130
Keywords: evaluation, precipitation, temperature, reanalysis datasets, in-situ observations, Qilian Mountains
Citation: Li Y, Qin X, Liu Y, Jin Z, Liu J, Wang L and Chen J (2022) Evaluation of Long-Term and High-Resolution Gridded Precipitation and Temperature Products in the Qilian Mountains, Qinghai–Tibet Plateau. Front. Environ. Sci. 10:906821. doi: 10.3389/fenvs.2022.906821
Received: 29 March 2022; Accepted: 21 April 2022;
Published: 25 May 2022.
Edited by:
Eric Josef Ribeiro Parteli, University of Duisburg-Essen, GermanyReviewed by:
Lunche Wang, China University of Geosciences Wuhan, ChinaCopyright © 2022 Li, Qin, Liu, Jin, Liu, Wang and Chen. This is an open-access article distributed under the terms of the Creative Commons Attribution License (CC BY). The use, distribution or reproduction in other forums is permitted, provided the original author(s) and the copyright owner(s) are credited and that the original publication in this journal is cited, in accordance with accepted academic practice. No use, distribution or reproduction is permitted which does not comply with these terms.
*Correspondence: Xiang Qin, cWlueGlhbmdAbHpiLmFjLmNu
Disclaimer: All claims expressed in this article are solely those of the authors and do not necessarily represent those of their affiliated organizations, or those of the publisher, the editors and the reviewers. Any product that may be evaluated in this article or claim that may be made by its manufacturer is not guaranteed or endorsed by the publisher.
Research integrity at Frontiers
Learn more about the work of our research integrity team to safeguard the quality of each article we publish.