 Yingjia Liu
 Lixin Wu
 Yuan Qi
 Yifan Ding
- 1School of Geosciences and Info-Physics, Central South University, Changsha, China
- 2Laboratory of Geo-hazards Perception, Cognition and Prediction, Central South University, Changsha, China
The Ms 6.2 Zhangbei earthquake occurred at 3:53 (UTC) on 10 January 1998, with its epicenter located at about 150 km northwest of Beijing, China. Over the past 2 decades, many studies have reported that there was a positive thermal infrared (TIR) anomaly appearing along the direction from the Bohai Sea to Zhangbei within 2–3 days preceding the earthquake, which was considered to be caused by the activity of the great Zhangbei-Bohai fault (ZBF) extending across the Bohai Sea to the southeast, while neither the TIR anomaly is convinced nor the mechanism is clear. A collaborative analysis of the atmospheric disturbances several days before, during, and after the earthquake was conducted by using satellite observations and reanalysis datasets with multiple parameters, including sea surface roughness, evaporation rate, atmospheric CO concentration, atmospheric sea salt concentration, and cloud base height above the sea surface, as well as satellite infrared cloud images. Through individual analysis of the change of each parameter and synergic analysis of multiple parameters, particular atmospheric disturbances, including the formation of strip-shaped clouds on January 7 and 9, were revealed over the ZBF and another great fault named Tancheng-Lujiang fault (TLF), which extends across the Bohai Sea to the northeast. After careful investigation and attribution analysis of the spatio-temporal evolutions of the atmospheric disturbances every hour above and around the Bohai Sea from January 7 to 12, we came to the conclusion that the particular strip-shaped clouds were low-level clouds caused by the seismic activity and submarine gas release from TLF but not ZBF and was forced by particular wind field and lowering boundary layer. As an aftereffect of the gas release from TLF and the formation of the localized low-level clouds of higher brightness temperature than that of the land surface, a positive TIR anomaly, thus, appeared above TLF and by chance along ZBF, preceding the Zhangbei earthquake.
1 Introduction
The Ms 6.2 Zhangbei earthquake that occurred on 10 January 1998 was the most destructive earthquake near the capital city Beijing, China, after the tremendous Ms7.8 Tangshan earthquake in 1976. Since Lv et al. (1998) in their study found that a thermal infrared (TIR) anomaly appeared preceding the earthquake using satellite data from AVHRR (advanced very-high-resolution radiometer), many studies (Lv et al., 2000; Li et al., 2008a; Wu et al., 2009) have verified the positive TIR anomaly developing along the Zhangbei-Bohai fault (ZBF) within 2–3 days preceding the earthquake. Several assumptions have been proposed to explain this abnormal TIR phenomenon. The work by Cui et al. (1998) speculated that the TIR anomaly was caused by the tectonic activity of the ZBF and the change of ground stress field before the earthquake, while Feng et al. (2010) in their study found that the abnormal TIR strip moved with the wind and inferred that the anomaly should exist in the atmosphere, which might be related to the greenhouse gas emission or electromagnetic field anomaly caused by ZBF activity. Based on the IAARF (infrared anomaly analysis based on reference fields) method, Li et al. (2008a) and Wu et al. (2009) extracted the clear range of TIR anomaly preceding the Zhangbei earthquake and considered that meteorological warming might have exaggerated the area of TIR anomaly.
The cloud cover led to the unavailability of TIR data in the 2 days before the Zhangbei earthquake; there were no complete understanding and convincing evidence for the formation and evolution of TIR anomaly. Some other anomalies have also been studied to prove the activity of the ZBF before the event, including underground fluid (Lin et al., 1998; Che, et al., 1999), near-surface air temperature (Guo, 2010), and surface latent heat flux (Li, et al., 2008b), but these anomalies could not provide further support for the mechanism interpretation of the TIR anomalies. Until now, the reported TIR anomaly preceding the Zhangbei earthquake was not yet investigated sufficiently, and many puzzles remained, including unclear mechanisms and unconvincing phenomena.
Figure 1 respectively shows the great fault zones distribution and historical seismicity near Bohai Sea. Most of the previous studies investigated that the earthquake anomalies are related to the west segment of the ZBF in land area, and there was no research focusing on the anomalies of the east segment of the ZBF in the Bohai Sea. Although the gas release was thought to happen possibly along opening active faults due to crustal strain/stress field changes during the seismogenic period (Toutain and Baubron, 1999), rare in situ observations in the area of the continental shelf, bay, or ocean could be carried out limited by the cover of seawater. Most studies monitoring the activity of submarine fault zone were supported by underwater visual, geochemical, and geophysical observation stations (Klaucke, et al., 2012; Geersen, et al., 2016; Johnson, et al., 2019; Zang et al., 2020), which cannot cover the fault zone completely and permanently and are not able to observe the atmospheric anomaly related with seismicity.
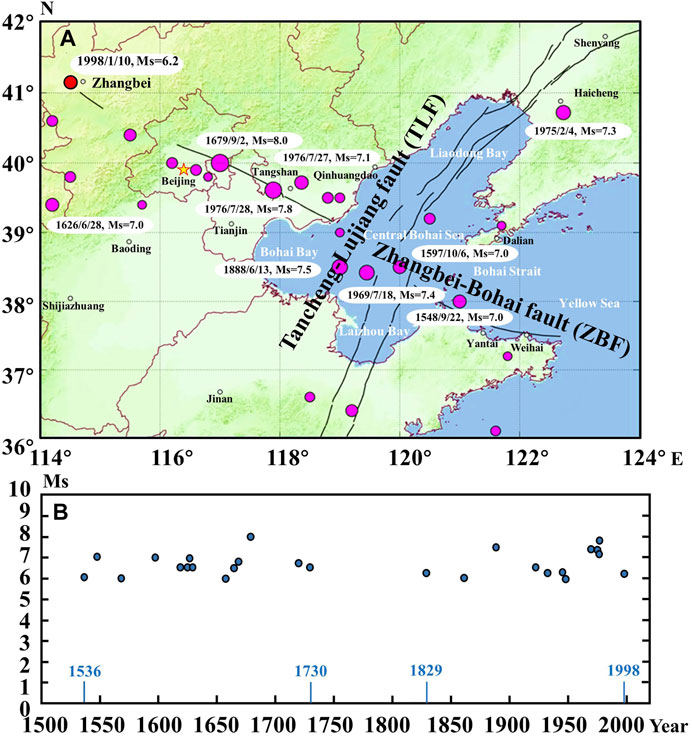
FIGURE 1. (A) Great fault zones and epicenter distribution (B) Time series of historical earthquakes.
However, satellite observations are able to provide global information about land, ocean, and atmosphere (Singh, et al., 2010b). Multi-source satellite data have been widely used in anomaly monitoring and early warning of natural hazards/disasters (Jing, et al., 2019). Many studies (Singh, et al., 2010a; Rawat, et al., 2011; Natarajan and Philipoff, 2018; Singh et al., 2019; Jing and Singh, 2021) reported remarkable changes in land, ocean, and atmospheric parameters preceding strong earthquakes. These changes also provided satellite observation evidence of strong seismic coupling between crust, land–ocean, and atmosphere, which was termed as lithosphere–coversphere–atmosphere (LCA) coupling (Wu, et al., 2012). The great achievements in earthquake anomaly study and the massive accumulation of satellite observations, from multiple satellite sensors and reanalysis datasets, encouraged us to reanalyze carefully the disturbance of sea surface and atmospheric parameters over the Bohai Sea preceding the Zhangbei earthquake, 10 January 1998.
After comparing hourly the TIR data from AVHRR and IGGCD (infrared global geospatial composite sataset) with the cloud data (including cloud base height and low cloud amount) from ERA5 reanalysis dataset, we obtained new cognition on the TIR anomaly. Removing the background field of TIR brightness temperature in the non-seismic years from 1993 to 2003 based on the IAARF method (Wu, et al., 2012), we obtained residual TIR images of the study area covering the epicenter and the entire Bohai Sea. To avoid being obscured by high-level clouds and show obvious TIR anomalies, we used the TIR residuals and the cloud data at 22:00p.m. (UTC) about every day from January 7 to 9, 1998 as examples. As shown in Figure 2, the positive TIR residuals and the low-level clouds show similar spatial distribution along the ZBF. Therefore, we tend to believe that the positive TIR anomaly developing toward the epicenter along ZBF was caused by the low-level clouds, and initiated the subsequent detailed investigations.
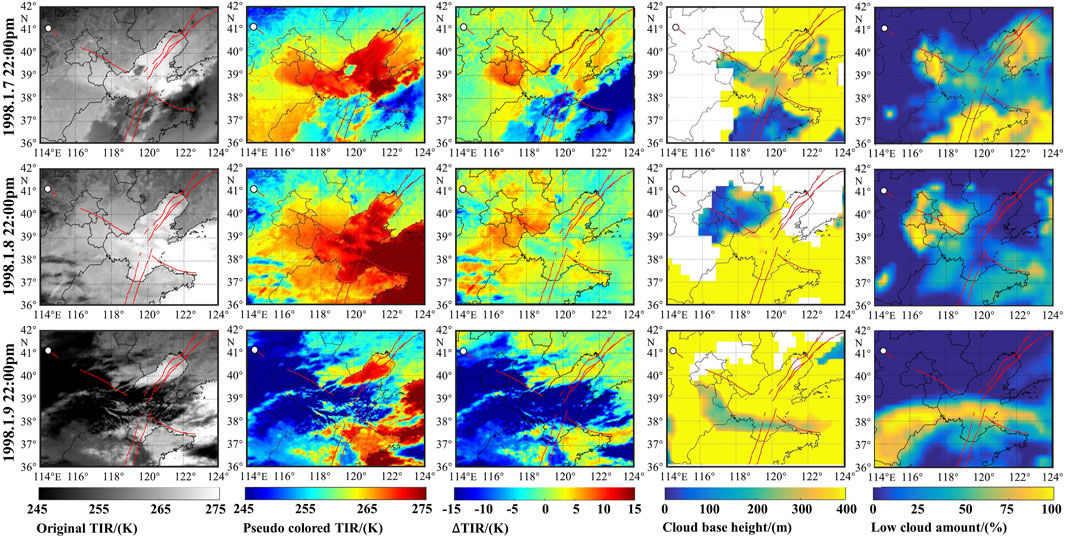
FIGURE 2. The TIR and cloud images from January 7 to 9, 1998.
2 Study Region
The study area is selected as 114°∼ 124°E and 36°∼46°N, covering the whole Bohai Sea and the north part of north China, including the TLF and the ZBF, as shown in Figure 1A.
2.1 Bohai Sea
The Bohai Sea is almost a closed sea, which is composed of the Liaodong Bay, the Bohai Bay, the Laizhou Bay, and the central Bohai Sea (Bian et al., 2016). The Bohai Sea is surrounded by land areas in the north, west, and south, and only connected with the Yellow Sea through the Bohai Strait in the east (Qiao et al., 2017). Therefore, it is greatly affected by land in terms of hydrology and climate. On the one hand, due to the large amount of sediments accumulation brought by rivers, the Bohai Sea is shallow in depth with an average water depth of 18 m (Ning et al., 2010). The Bohai sea bottom is flat, mostly composed of sediments and soft mud, and the terrain is inclined from the three bays to the Bohai Strait. On the other hand, as the thermal dynamics of seawater are deeply affected by land, the seasonal variation of surface water temperature is obvious. The water temperature can rise to 24–25°C in summer and drop to 0°C in winter (Song and Duan, 2019). Affected by the continental monsoon climate, the direction of the wind in the Bohai Sea has obvious seasonal changes. Usually, the north wind prevails in winter, the south wind prevails in summer, and the spring and autumn is the transitional season (Lv et al., 2014). Rich oil and gas resources have been found on the seabed of the Bohai Sea, especially near the great Tancheng-Lujiang fault (TLF). Superior hydrocarbon source conditions and the existence of a sedimentary system provide sufficient oil production and storage conditions for oil and gas fields (Wang, 2021).
2.2 Historical Seismicity
The Bohai Sea is one of the regions with high seismicity in eastern China. The basic geo-framework of the main active faults in the Bohai Sea is controlled by the great TLF in the NE direction and the great ZBF in the NW direction, which intersect each other in the central Bohai Sea. The TLF is a large linear structural belt, with an average width of 50 km about, running through Laizhou Bay, central Bohai Sea, and Liaodong Bay; while the ZBF runs through the central Bohai Sea with Bohai Bay and Laizhou Bay to its south side, and is characterized by a left-lateral slip in the Cenozoic (Deng et al., 2001). Figure 1 separately shows the epicenter distribution and time series of historical earthquakes greater than magnitude six since 1500. The historical earthquake catalog is from National Earthquake Data Center (https://data.earthquake.cn/). Nine strong earthquakes with Ms greater than seven have occurred near the Bohai Sea, which are marked in Figure 1A. The epicenters of strong earthquakes were mainly distributed near the TLF and the ZBF. There were two active seismic periods near the Bohai Sea since 1500, as shown in Figure 1B. The first period lasted from 1536 to 1730. After a quiet seismic period in a length of a hundred years, frequent earthquakes turned to occur again near the Bohai Sea.
3 Materials and Methods
Considering the spatio-temporal distribution of discovered abnormal phenomenon preceding the Zhangbei earthquake, the multi-source reanalysis datasets, including the ERA5 reanalysis dataset and MERRA-2 reanalysis dataset, from January 7 to 12, 1998 (shortly before and after the earthquake) were focused in this study. Meanwhile, the time series results of these datasets 1 month before and after the Zhangbei earthquake were also analyzed and shown in the Supplementary Materials.
ERA5 is a comprehensive reanalysis dataset, which is predicted by the integrated forecast system of ECMWF (european centre for medium-range weather forecasts). ERA5 is the fifth reanalysis developed from ERA-Interim, with higher physical properties compared to its predecessors, such as spatial resolution, time resolution, and number of pressure levels (Hersbach et al., 2020). The main observations of ERA5 comprise atmosphere, land, and ocean waves on a single level and vertical atmosphere field on different pressure levels with the opening access from 1979 to the current year (Belmonte Rivas and Stoffelen, 2019). The second modern-era retrospective analysis for research and applications (MERRA-2) is a reanalysis dataset deriving from the GEOS-5 (goddard earth observing system model, Version 5) atmospheric data assimilation system, which begins in 1980 (Qin et al., 2019). MERRA-2 inherits characteristics from the integral characteristics of MERRA and upgrades in some aspects, including the forecast model, analysis algorithm, and observation system. Besides, the newer microwave/hyperspectral infrared radiance instruments and some new satellite observations, including atmospheric motion vectors, surface wind speeds, total column ozone, and so on are comprised in it (Gelaro et al., 2017).
Five parameters were used to detect the seismic disturbances above the sea surface and in the atmosphere, including the sea surface roughness, evaporation rate, atmospheric CO, small particle sea salt concentration, and cloud bottom height. Their physical meanings and data sources are as follows. Some auxiliary data were also used for anomaly analysis. More details of the main parameters and auxiliary data are shown in Table 1. Considering the limitation of the spatial resolution on the expression of the results, we resampled all the datasets to be of spatial resolution in 0.03° using bilinear interpolation, except the sea surface roughness datasets. Due to the abnormal value of the sea–land boundary after resampling, we did not resample the sea surface roughness datasets but retained its original resolution in 0.25°. Meanwhile, all datasets used the UTC in their study, so as to unify the time zone. Besides, the overall technical routine of this study is shown in Figure 3.
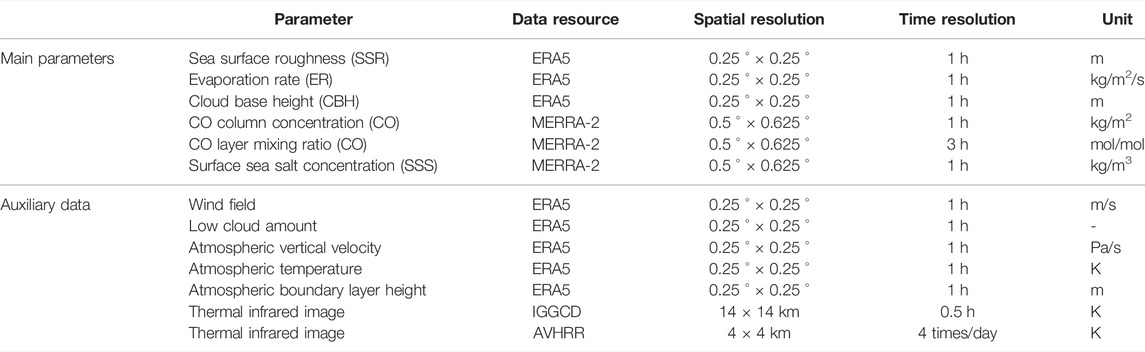
TABLE 1. The information of main parameters and auxiliary data.
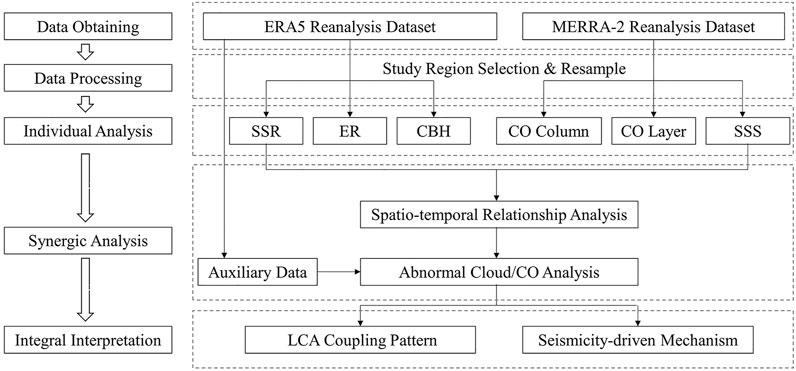
FIGURE 3. The overall technical routine of this study.
3.1 Sea Surface Roughness (SSR)
The parameter SSR means part of the forecast surface roughness (FSR). As an index of estimating surface resistance, the FSR is an aerodynamic roughness length, which quantifies the momentum transfer from air to the sea surface. Low wind speed near the surface is usually caused by high surface roughness under certain atmospheric conditions. Besides, the determining factors of SSR over ocean and land surface are discrepancy. The former depends on the wave speed, while the latter is dominated by the vegetation types and snow cover. Only the surface roughness with ocean pixels was used in this study.
3.2 Evaporation Rate (ER)
The parameter ER means part of the instantaneous moisture flux (IMF). The IMF is the net rate of surface–atmosphere moisture exchange, including evaporation rate and condensation rate in a certain time. By convention, the condensation is positive and the evaporation is negative in value. In this study, we only used the absolute value of evaporation to describe changes in ER.
3.3 Atmospheric CO Concentration (CO)
The CO data is obtained from MERRA-2, including CO Column concentration and CO mixing ratio in 72 atm levels. The data of CO column burden embodies in the carbon monoxide and ozone diagnostics dataset, shortly named as M2T1NXCHM. The CO mixing ratio embodies in the carbon monoxide and ozone mixing ratio dataset, shortly named as M2I3NVCHM. Since the Zhangbei earthquake occurred in 1998, the data of other gas (such as CH4, H2, and CO2) in connection with the strong earthquake at that time were unobservable, only the CO data were used in this study.
3.4 Surface Sea Salt Concentration (SSS)
This parameter means the mass concentration of small particles of sea salt in the land/sea surface atmosphere. The data of sea salt surface mass concentration are included in the aerosol diagnostics dataset, shortly named as M2T1NXAER from MERRA-2.
3.5 Cloud Base Height (CBH)
The parameter CBH means the height of the base of the lowest cloud layer, above the Earth’s surface. The model divides the clouds into multiple layers at different heights. The lowest model layer reflects fog or aerosol, while the second-lowest model layer is low cloud. This parameter is the height of the second-lowest model layer, where cloud amount is greater than 1% and condensate content is greater than 10–6 kg/kg.
4 Results
4.1 Abnormal SSR Pattern
Figure 4 shows the change of the SSR of the Bohai Sea every 4 h from 7 to 12 January, 1998. An abnormal SSR strip appeared along TLF in Liaodong Bay at 8:00a.m. on January 7. After that, the scope of the strip expanded rapidly along TLF in a few hours, and the rough sea surface covered the entire Liaodong Bay at about 24:00p.m. on January 7. Subsequently, the sea surface gradually got calm, while there was slight SSR disturbance along ZBF in the central Bohai Sea. Another more severe SSR disturbance appeared again in Liaodong Bay at about 16:00p.m. on January 9. The abnormal SSR strip expanded quickly to the whole Bohai Sea along TLF, and reached the peak at about 24:00p.m. on January 9. After the earthquake (at 3:53a.m. on January 10), the abnormal SSR strip was drawn back gradually to Liaodong Bay. The intense disturbance lasted a whole day after the earthquake and eventually disappeared on January 12.
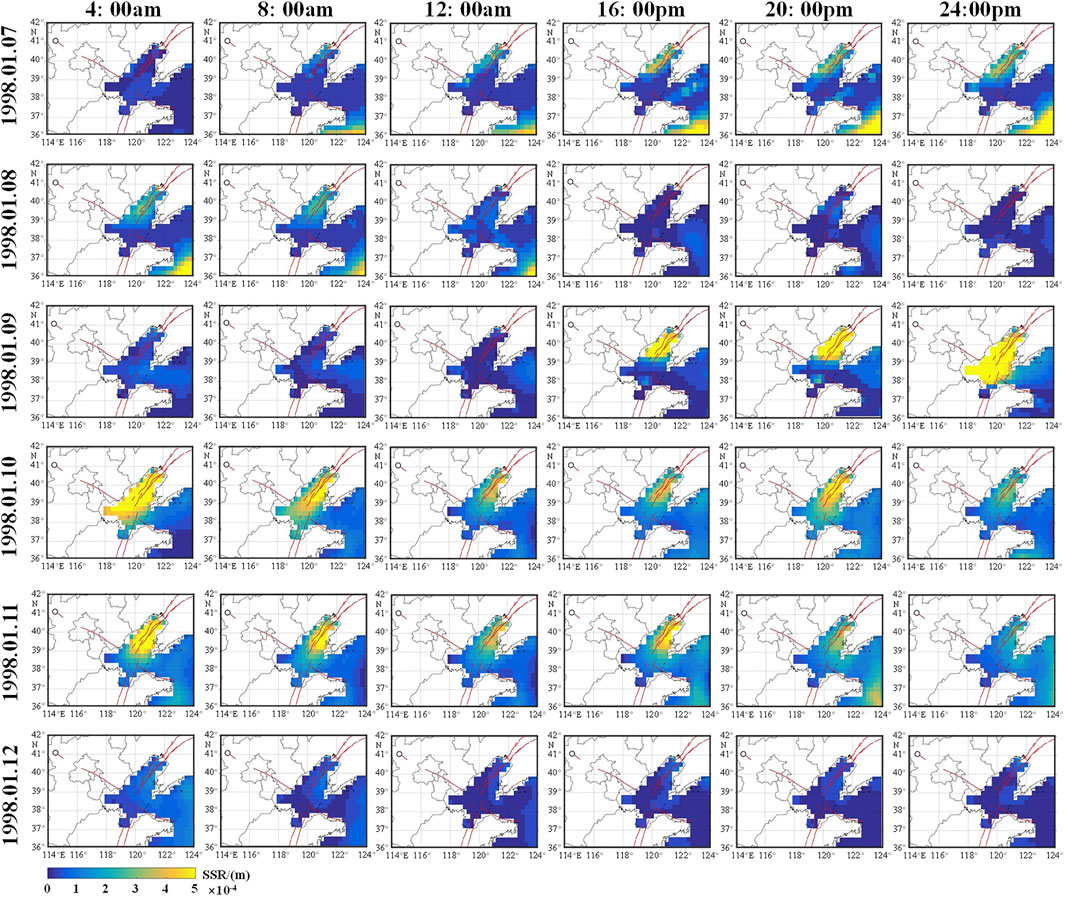
FIGURE 4. The change of SSR pattern over Bohai Sea from 7 to 12 January 1998.
4.2 Abnormal ER Pattern
Evaporation shows significant differences between sea and land in Figure 5. The evaporation of land exhibits obvious changes in a whole day, which is related to solar radiation. Due to the low temperature in north China in winter, the land evaporation rate is almost zero at night and usually below 3 × 10⁻⁵ kg/m2/s during the daytime. Usually, the evaporation rate above the sea is much higher than that of the land, and the diurnal variation is not obvious.
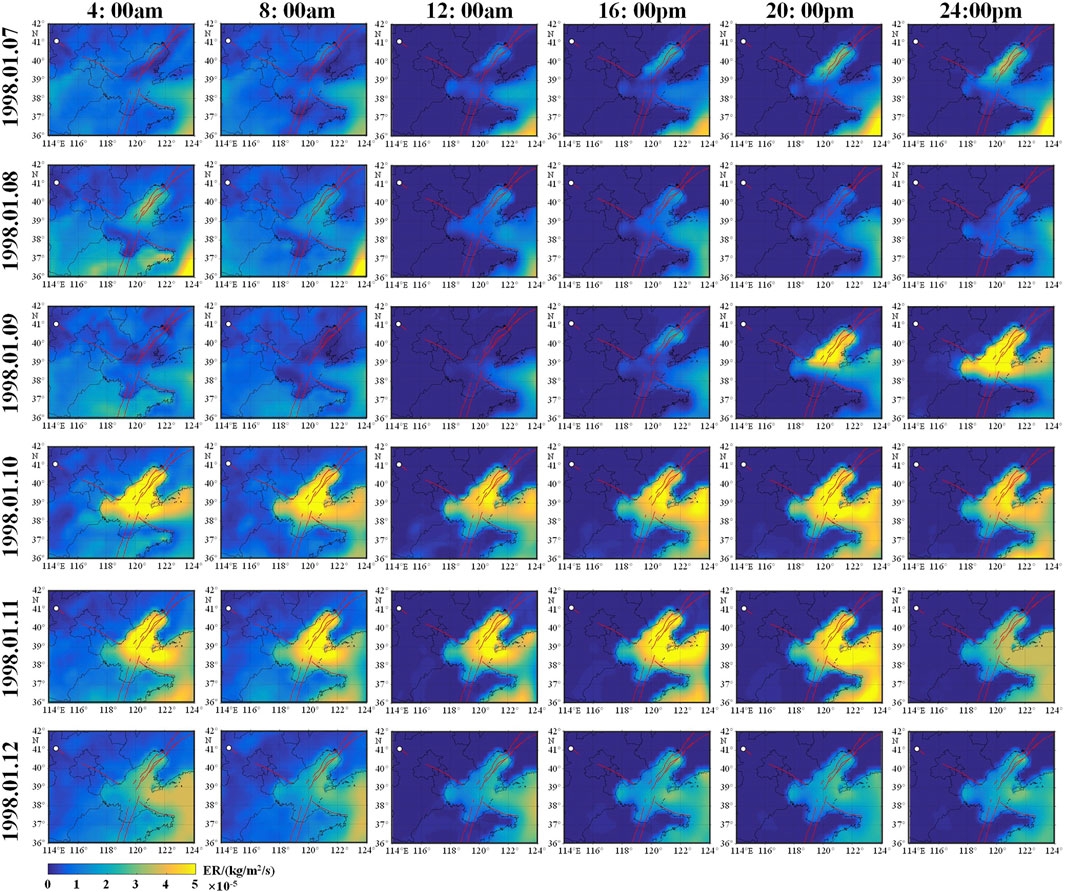
FIGURE 5. The change of ER pattern over Bohai Sea from 7 to 12 January 1998.
During the seismogenic period, the ER anomaly mainly occurred above the Bohai Sea, which is similar to the spatio-temporal distribution of the SSR anomaly. At about 12:00a.m. on January 7, the high ER (more than 4 × 10⁻⁵ kg/m2/s) appeared along TLF in Liaodong Bay. Subsequently, Liaodong Bay evaporated rapidly until 12:00p.m. on January 8. On January 9, at about 20:00p.m., another even higher ER appeared in Liaodong Bay, which was more than 5 × 10⁻⁵ kg/m2/s. A large amount of evaporation soon occurred above almost the whole Bohai Sea, especially in Liaodong Bay and central Bohai Sea. After January 12, the ER gradually decreased to normal.
4.3 Abnormal CO Concentration
Figure 6C shows that the mean CO column concentration in January of the Bohai Sea in the non-seismic years from 1993 to 2003. High CO column concentrations (about 1.2 × 10⁻³ kg/m2) appeared near the two metropolis large cities (Beijing City and Panjin City), which might be related to severe winter heating emissions. The change of CO column concentration every 4 h from 7 to 12 January, 1998 is shown in Figure 6A. An abnormal CO strip started to be noticed over TLF in Liaodong Bay at 12:00a.m. on January 7 and developed southwestward along TLF for several hours with a high concentration of more than 1.4 × 10⁻³ kg/m2. After that, the abnormal CO strip turned to move eastward out the Bohai Bay on January 8. On January 9, the dispersed CO gradually gathered and formed a new abnormal CO strip across the Bohai Sea at 12:00a.m. with a concentration of 1.2 × 10⁻³ kg/m2. Finally, the abnormal CO strip dissipated completely after 4:00a.m. on January 10. Figure 6B shows the variation of CO concentration at different atmospheric pressure layers, taking the CO concentration from 18:00p.m. to 21:00p.m. on January 7 as an example. Obviously, this CO concentration is reduced with the decreasing of atmospheric pressure, which excludes the possibility of CO coming from outside or being generated by chemical reactions inside.
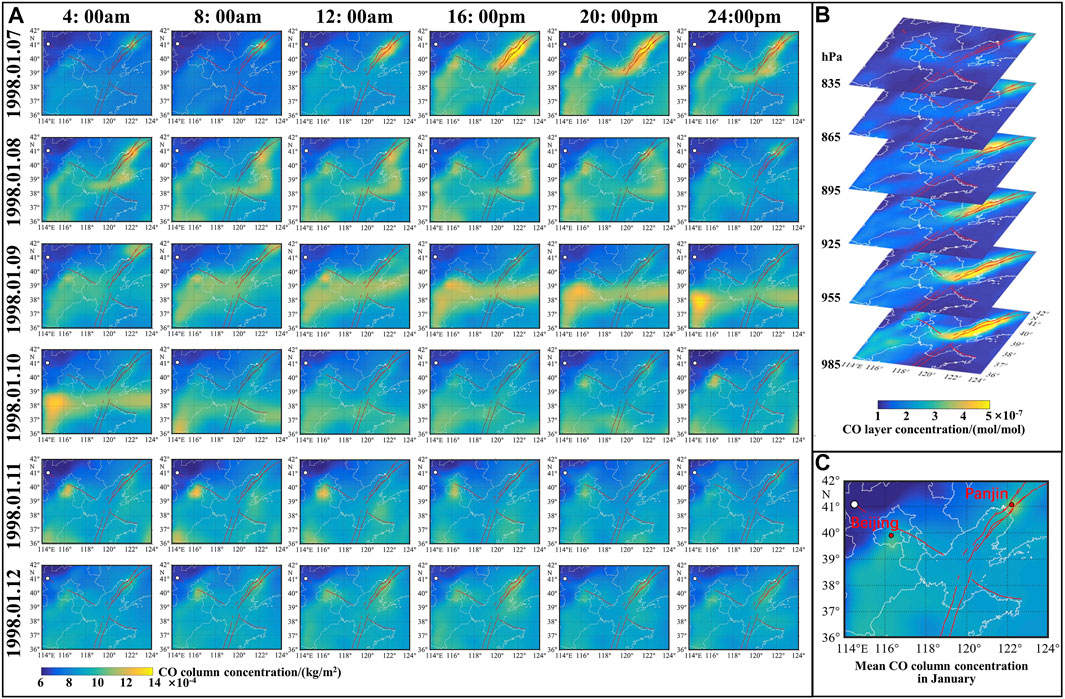
FIGURE 6. (A) The change of CO column concentration over Bohai Sea from 7 to 12 January 1998. (B) The change of CO layer concentration from 18:00 to 21:00 on 7 January 1998. (C) The mean CO column concentration in January of non-seismic years from 1993 to 2003.
4.4 Abnormal SSS Concentration
Figure 7 shows the spatio-temporal changing of the SSS concentration every 4 h over the Bohai Sea from 7 to 12 January, 1998. In fact, SSS refers to the concentration of sea salt in the atmosphere over the surface, not only right over the sea surface but also on the nearby land surface. Under the action of wind, the sea salt particles in the atmosphere over the sea surface may move to the land, resulting in SSS anomaly in the atmosphere over the land surface. We noticed an abnormal SSS strip with a concentration of 1.5 × 10⁻⁸ kg/m3 appeared on the west side of the TLF segment in the central Bohai Sea at 12:00p.m. on January 7, which moved southwestward gradually. After 8:00a.m. on January 8, the high SSS concentration started to diffuse over the Bohai Sea and the western mainland. At 20:00p.m. on January 9, another more significant abnormal SSS strip with a concentration more than 2 × 10⁻⁸ kg/m3 appeared again in the intersection zone of ZBF and TLF, and shifted southwestward approximately in the shape of a triangle. The SSS concentration was very high within a few hours before and after the earthquake. After 20:00p.m. on January 10, the SSS concentration anomaly was drawn back to the south segment of the TLF in Laizhou Bay as a narrow strip. This high abnormal SSS concentration strip continued all day on January 11 and disappeared gradually after 20:00p.m. this day.
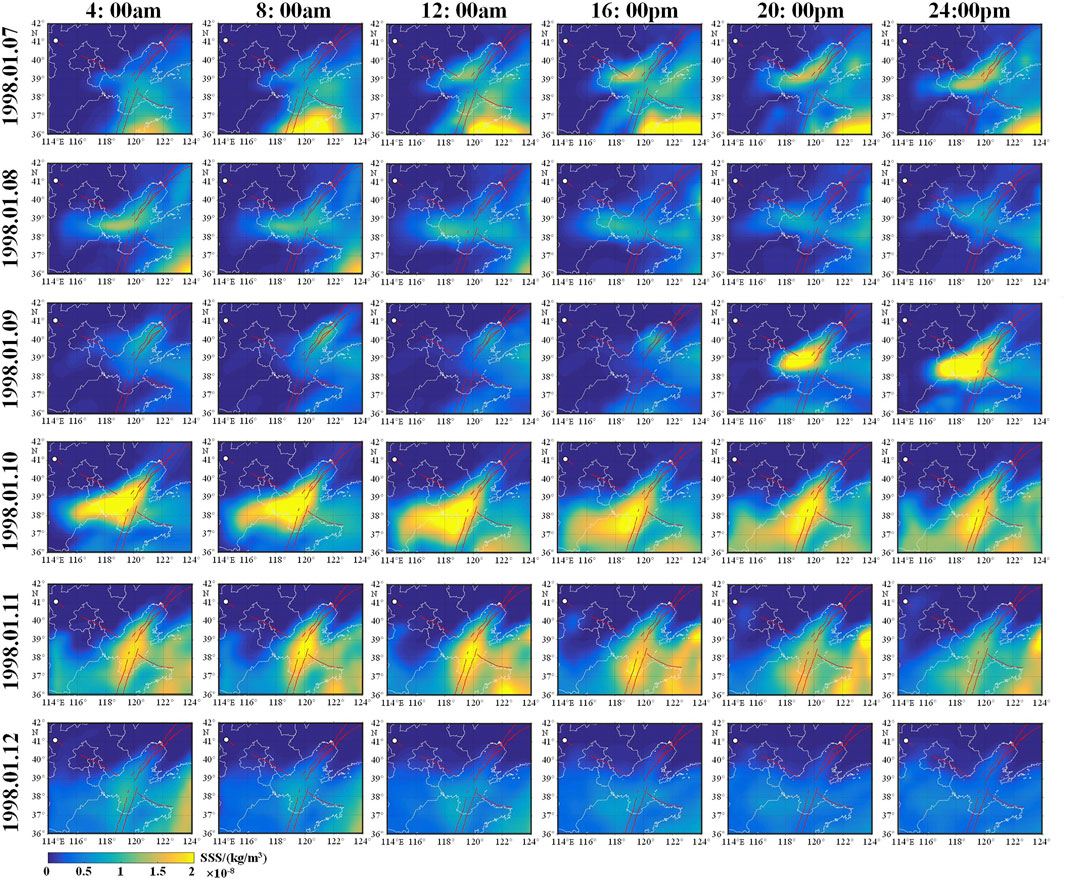
FIGURE 7. The change of SSS concentration over Bohai Sea from 7 to 12 January 1998.
4.5 Abnormal Low-Level Clouds
As shown in Figure 8, the change of the cloud base height over the Bohai Sea from 7 to 12 January, 1998 is shown every 4 h. The pixels without cloud or only including fog and aerosol are set as null values. To investigate the low-level clouds, the height range is set as 0–400 m.
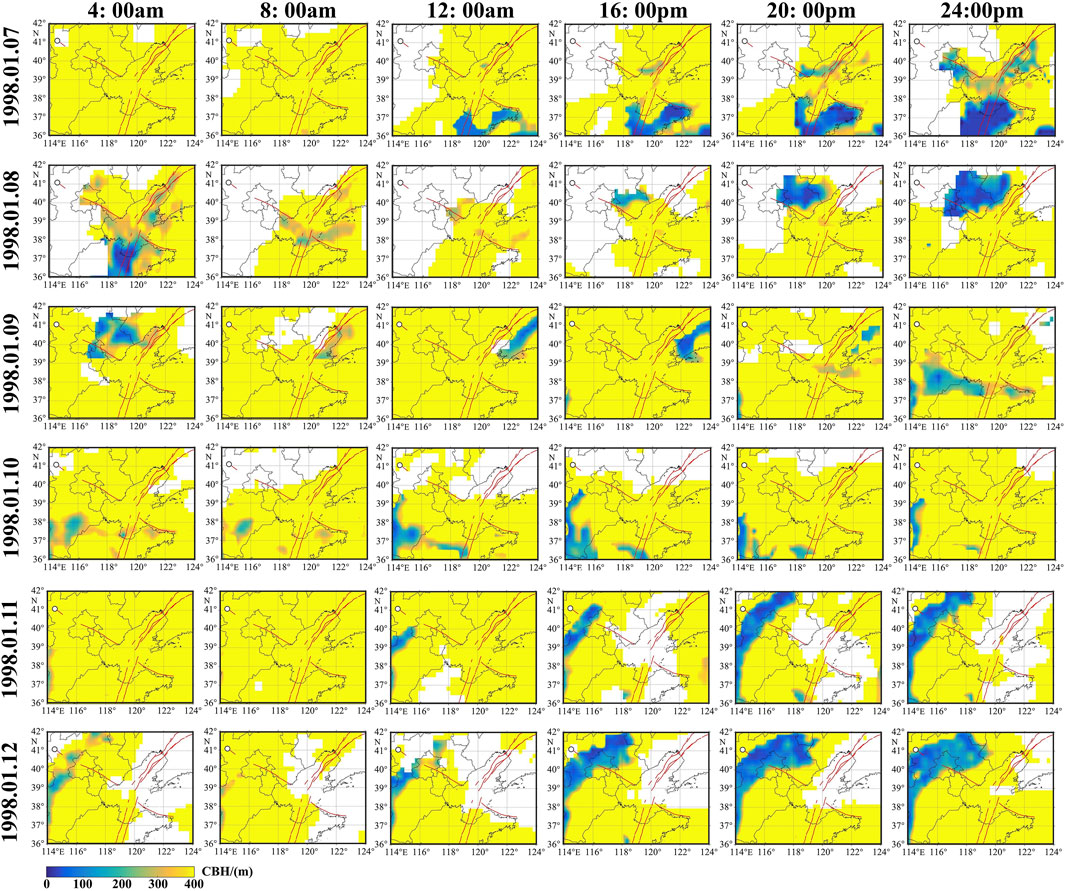
FIGURE 8. The abnormal clouds appeared over Bohai Sea from 7 to 12 January 1998.
Watching the Bohai Sea, we noticed that a small low-level cloud began to form on the west side of the TLF segment in Liaodong Bay at 12:00a.m. on January 7. The cloud appeared at a height of 200 m above the sea surface and then developed gradually into a short strip-shaped cloud. Soon later, a long strip-shaped cloud was developed along TLF since 20:00p.m. Meanwhile, another cloud strip appeared near the northwest coast of the Bohai Sea and expanded westward to the mainland, and finally developed into a long strip-shaped cloud right along ZBF at 24:00p.m. this day. The two abnormal strip-shaped clouds intersecting in the central Bohai Sea lasted for several hours. The first one along TLF disappeared after 8:00a.m. on January 8, while the second one along ZBF disappeared completely at 24:00p.m. the same day. Afterward, a new strip-shaped cloud appeared again along ZBF in the central Bohai Sea at about 20:00p.m. on January 9. This particular cloud started to drift southward soon later and completely dissipated over the Bohai Sea after 8:00a.m. on January 10.
4.6 Long Time Series of Each Parameter
The time series of each parameter 1 month before and after the earthquake were shown in Supplementary Figures S1-S5, so that to understand the parameter characteristics in the non-seismic period. To highlight the seismic anomalies shortly before and after the earthquake, the data at 20:00p.m. every day were used to generate the time series, and the date with the seismic anomaly is in red. We noticed that the SSR and the SSS concentration over the Bohai sea were usually in a steady low-value range in the non-seismic period, and the ER and the CBH sometimes showed obvious abnormalities over the Bohai sea, which could be related to meteorological factors. Meanwhile, the high value of CO over the Bohai sea in a few cases should be occasionally caused by atmospheric transmission from the mainland.
5 Synergic Analysis to Multiple Anomalies
5.1 The Spatio-Temporal Relationship of Multiple Anomalies
To reveal the spatial correlation of the multiple anomalies, the abnormal pattern of the change of all five parameters at the same time every day from January 7 to 12, 1998, are put together for better investigation. Figure 9A shows the collective patterns at 20:00p.m., for example. At 20:00p.m. on January 7, all parameters appeared with some abnormities along TLF, and a low-level cloud strip appeared over ZBF. At 20:00p.m. on January 8, most of the anomalies were not significant. At 20:00p.m. on January 9, the anomalies of SSR, ER, and SSS concentration got distributed widely along TLF, while the low-level cloud and CO concentration anomaly distributed along ZBF. At 20:00p.m. on January 10, the anomalies of SSR, ER, and SSS concentration still existed along TLF, while the low-level cloud and CO concentration anomaly almost dissipated. At 20:00 p.m. on January 11, the anomalies of SSR, ER, and the SSS concentration became weakened along TLF, and the low-level cloud and CO concentration anomaly no longer appeared. At 20:00p.m. on January 12, there was no anomaly observed over the Bohai Sea.
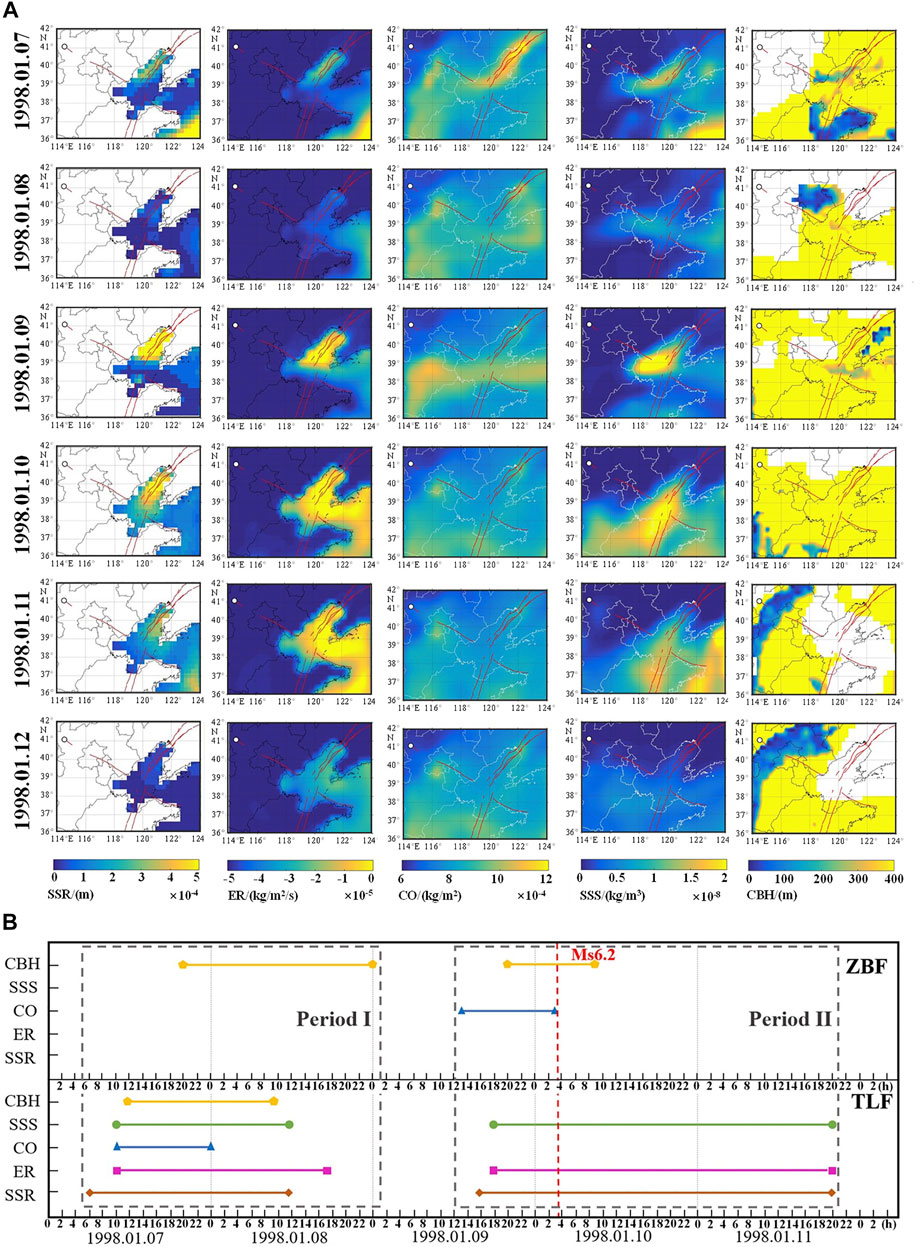
FIGURE 9. The spatial (A) and temporal (B) change of atmospheric anomalies over Bohai Sea.
Figure 9B shows the temporal process of the anomalies of all five parameters. To obtain exactly the temporal order of these anomalies, we used hourly datasets for synergic analysis. As the anomalies are mainly concentrated along TLF and ZBF, the temporal process of anomalies that occurred near the two faults was analyzed separately. We found that the anomalies that occurred from 7 to 11 January, 1998 could be grouped into two periods (period-I and period-II). The period-I started on January 7 and ended on January 8, which was 2–3 days before the earthquake. At about 6:00a.m. on January 7, the SSR anomaly appeared firstly. After 4 h, the ER, CO concentration, and SSS concentration got abnormal one after another. Finally, the low-level cloud anomaly appeared above TLF and ZBF. The period-II started on January 9 and ended on January 11, which covered half a day before and 2 days after the earthquake. The SSR anomaly appeared firstly above TLF, which was followed by the anomalies of ER and SSS concentration. These anomalies lasted for almost 2 days after the earthquake. Nevertheless, in the position of ZBF, the CO concentration anomaly appeared firstly, and the low-level cloud anomaly appeared later. These anomalies dissipated quickly after the earthquake.
5.2 Attribution Analysis
The fault systems in the Bohai Sea are densely distributed and intersected (Li et al., 2009). In the process of earthquake preparation, gas release from fault is to occur along with opening cracks, due to transient crust stress relax in some particular segment of the faults, especially at the last moment of the critical system of seismic fault reaching to shock. The released gas will travel as bubbles from the seabed to surface, and lead to the lift of sea surface roughness (Ding et al., 2021). The burst of bubbles on the sea surface is able to accelerate the evaporation and also produce sea salt particles of different sizes (Keene et al., 2007). The so-produced sea salt particles will come later into the local atmosphere and float in the atmosphere for a long time (Veron, 2015). Because of its hygroscopicity and small size, the sea salt particles are easy to act as cloud condensation nuclei and form clouds in sequence when the water vapor in the air is supersaturated (De Leeuw et al., 2011). Zhou et al. (2017) in their study found that there is CO storage existing in the submarine natural gas reservoir under the Bohai Sea through seabed drilling, which indicates that the released gas may contain some CO molecules, which come from the seabed or submarine lithosphere, together with CH4, H2, and CO2 and so on (Singh et al., 2010b). The CO molecules enter the atmosphere after the bubble burst on the sea surface, resulting in the positive anomaly of CO concentration in the atmosphere.
The aftereffects of submarine gas release could interpret reasonably the formation of the multiple atmospheric anomalies over the TLF in the Bohai Sea preceding the Zhangbei earthquake. In period-I, the gas release might have happened in the structurally-weakened cracks of the TLF before 6:00a.m. on January 7. At about 6:00a.m. this day, the floating bubbles traveled from the seabed cracks to the sea surface, resulting in the observable SSR anomaly over TLF. Then, more and more water vapor, CO molecules, and small particles of sea salt were brought into the surface atmosphere due to the continuous bubbling. After 4 h about, the ER, the CO concentration, and the SSS concentration along TLF got accumulated enough to be observable as an abnormal rise. Finally, the low-level cloud formed over TLF until the water vapor and sea salt particles accumulated enough at a certain temperature and atmospheric pressure. In period-II, a more serious gas release might have occurred in the seabed cracks on the north segment of the TLF in the Liaodong Bay before 16:00p.m. on January 9, causing more severe and extensive anomalies of SSR, ER, and SSS. More bubbles floated up and burst quickly on the sea surface, which would have accelerated the process of sea-atmosphere exchange. Therefore, the atmospheric anomalies of SSS and ER got observable 2 h after the appearance of the SSR anomaly. The gas release process in period-II lasted much longer than that in period-I, and all anomalies over the TLF dissipated 2 days after the earthquake.
However, there was no sea surface disturbance but some atmospheric anomalies observed over ZBF, which cannot be interpreted with submarine gas release behavior. In period-I, the low-level cloud anomaly was not only distributed along TLF, but also along ZBF; while in period-II, the CO concentration anomaly and the low-level cloud anomaly were distributed along ZBF rather than TLF, and the CO concentration anomaly was observed earlier than other anomalies. To explore the potential mechanism of the difference in atmospheric anomalies over ZBF and TLF, some auxiliary datasets were used for further exploration, including the datasets of the wind field, atmospheric temperature, atmospheric vertical velocity, and atmospheric boundary layer height over the Bohai Sea.
5.2.1 Low-Level Cloud Anomaly Along the TLF and ZBF in Period-I
The low-level cloud in period-I lasted from January 7 to 8. To analyze the movement of the low-level cloud, the chances of low-level cloud and wind field from 16:00p.m. to 24:00p.m. on January 7–8, 1998 are shown in Figure 10. The wind field data at a height of 975 hPa are selected for analysis in that the atmospheric pressure of the low-level cloud is about 975hPa. We noticed that the low-level cloud appeared on the west side of the TLF segment in Liaodong Bay at 16:00p.m. on January 7, and then moved toward the mainland with the northeast wind over the Bohai Sea. At 24:00p.m. this day, the low-level cloud that had moved to the mainland with northeast-to-east wind distributed along the ZBF segment in the mainland, with its foreland being stopped by northwest wind over Beijing. On January 8, there were a few low-level clouds appearing over the Bohai Sea. Due to the wind speed being lower than 2 m/s, the low-level clouds were widely distributed over the western mainland but no longer moved rapidly.
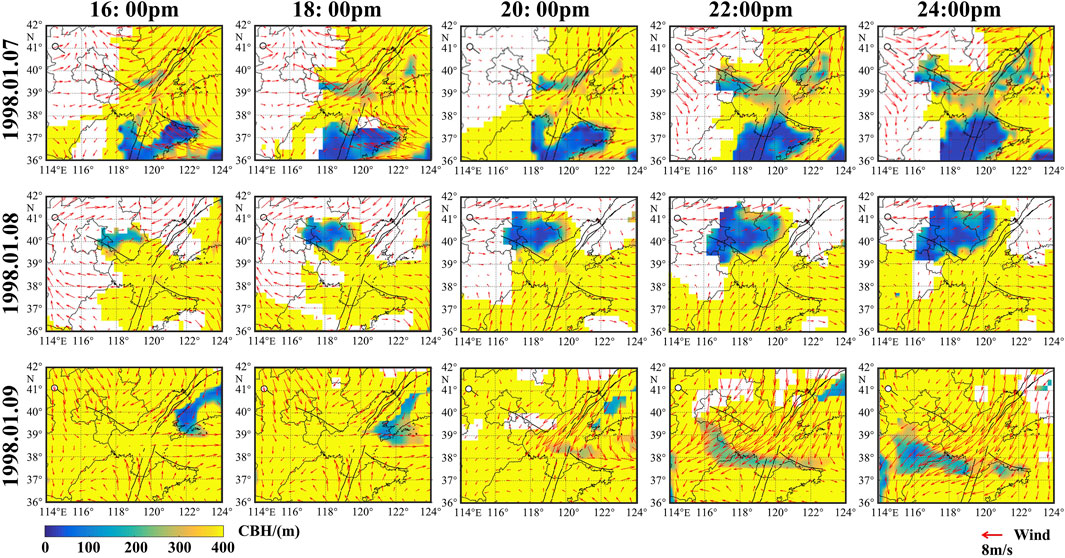
FIGURE 10. Cloud bottom height and wind field from 7–9 January 1998.
We also noticed a low-value area of CBH in the south of the study area on January 7 as shown in Figure 10, which was a matter of distraction. The cloud base height refers to the height from the bottom of the cloud to the ground surface, and high-level clouds might occupy a low value of CBH above the ground surface at high altitude. Referring to the DEM data in Figure 14A, we knew that the south of the study area is the Shandong Peninsula with an average altitude of more than 200 m while the central part of the study area is the North China Plain with an altitude of less than 50 m. The high-level clouds over the Shandong Peninsula on January 7 occupied a low value of CBH and appeared blue in CBH image.
In Figure 11, the atmospheric temperature and the atmospheric vertical velocity at 16:00p.m. on January 7 are used to analyze the possible formation process of the low-level cloud. Since 1,000 hPa is the pressure layer closest to the sea surface, we used the air temperature field and vertical velocity field at 1,000 hPa to analyze the water vapor source of low-level clouds, as shown in Figures 11A,C. Meanwhile, we used the data in different pressure layers from 900–1,000 hPa to show the vertical change of the two parameters, as shown in Figures 11B,D. Figures 11A,B shows the vertical temperature distribution along TLF (a-b direction). It shows that the atmospheric temperature close to the sea surface was almost above zero, while the atmospheric temperature dropped to below zero as air pressure decreased with altitude. The water vapor with higher temperature has lower density and more dynamics to move upward, which could be confirmed in the vertical velocity diagram (positive value means upward movement and a negative value means downward movement) in Figures 11C,D. Figure 11D shows the peak velocity in two directions, which basically corresponds to the position of the low-level cloud over TLF at 16:00p.m. on January 7 in Figure 10.
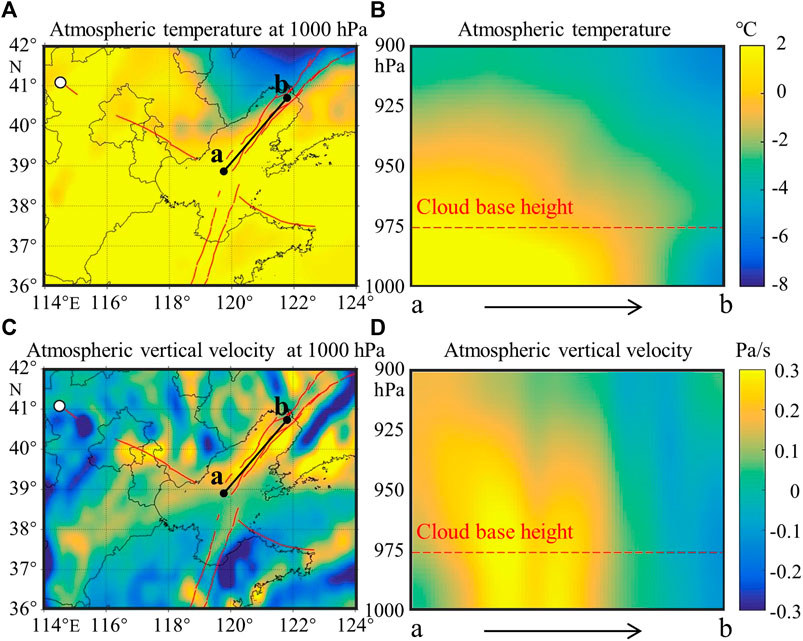
FIGURE 11. Atmospheric temperature (A,B) and atmospheric vertical velocity (C,D) over Bohai Sea at 16:00 on 7 January 1998. (A) The atmospheric temperature at 1,000 hPa. (B) The atmospheric temperature in different pressure layers along TLF (a-b direction). (C) The atmospheric vertical velocity at 1,000 hPa. (D) The atmospheric vertical velocity in different pressure layers along TLF (a-b direction).
A reasonable explanation of this particular phenomenon is that the bubble rising from the gas release along TLF had lifted the sea surface evaporation, which led to water vapor with higher temperature to enter into the atmosphere. If the rising muggy air was supersaturated at a certain height, it would condense into water droplets when the air temperature was higher than zero, and into ice crystals when the air temperature was lower than zero (Paluch and Lenschow, 1991). A large number of small sea salt particles acting as cloud condensation nodules are beneficial for the formation of the low-level cloud. Henceforth, the low-level cloud was produced and moved to the mainland with northeast-to-east wind, which was distributed finally along ZBF by chance.
Since the temperature of a low-level cloud is slightly lower than that of the sea surface and higher than that of the land surface in north China during winter (Yang et al., 2019), the brightness temperature of the top of a low-level cloud is close to that of sea surface but greater than that of mainland surface in the TIR image. This particular mechanism should have led to the positive TIR anomaly occurring only along the west segment of ZBF in land area in previous studies, as shown in the residual TIR images at 22:00p.m. on January 7–8 in Figure 2. Meanwhile, due to the dynamic movement of low-level clouds with the wind, there were subtle differences in the location and shape of TIR anomalies at different observation times.
5.2.2 Low-Level Cloud Anomaly Along the ZBF in Period-II
The low-level cloud in period-II mainly appeared on January 9. The changes in low-level cloud and wind field from 16:00p.m. to 24:00p.m. on 9 January 1998 are shown in Figure 10. At 20:00p.m. on January 9, the low-level cloud anomaly traversed the central Bohai Sea along ZBF in the east-west direction. After that, it moved southwestward with the wind and left gradually over the Bohai Sea. However, referring to the spatial patterns of the five parameter anomalies on January 9 shown in Figure 8, we noticed that the anomalies of SSR, ER, and SSS were distributed along TLF in Liaodong Bay, not along ZBF in the central Bohai Sea. As shown in Figure 12, the atmospheric temperature and the atmospheric vertical velocity at 20:00 on January 9 are used to explain the difference. Figures 12A–C show that the atmospheric temperature above the sea surface was lower than zero in Liaodong Bay and higher than zero in Central Bohai Sea. With the decrease of atmosphere pressure with altitude, the atmospheric temperature should had dropped also to below zero over Central Bohai Sea at some altitude (950 hPa about). Figures 12D–F show that there was no obvious upward movement of water vapor along TLF (a-b direction) in Liaodong Bay, but there were several peaks along ZBF (c-d direction) in Central Bohai Sea, which basically corresponded to the position of the low-level cloud over ZBF at 20:00 on January 9 in Figure 10. Therefore, the mechanisms and forming processes of cloud or fog in Liaodong Bay and central Bohai Sea should be different.
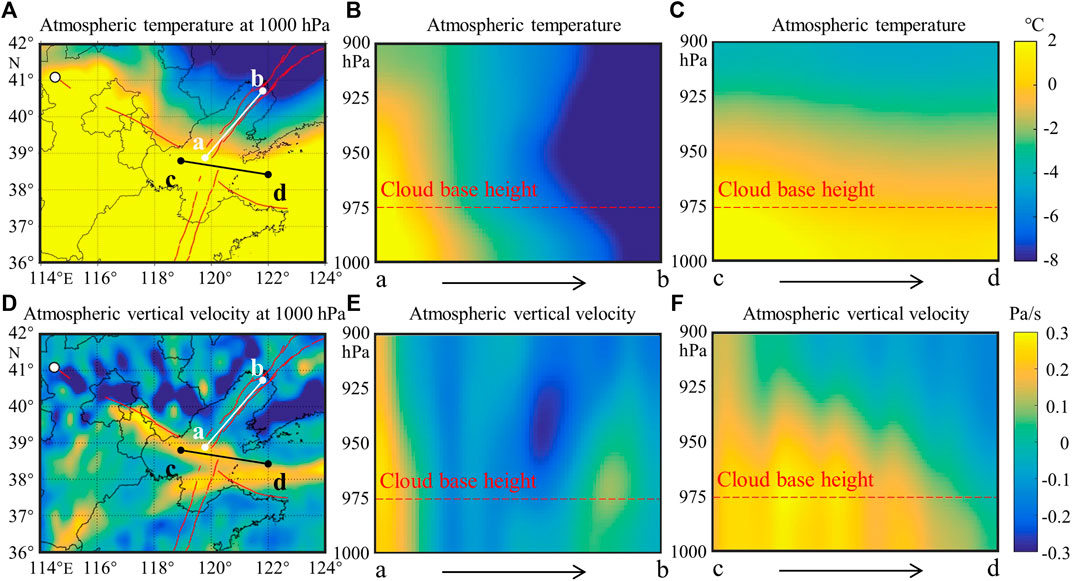
FIGURE 12. Atmospheric temperature (A–C) and atmospheric vertical velocity (D–F) over Bohai Sea at 20:00 on 9 January 1998. (A) The atmospheric temperature at 1000 hPa. (B) The atmospheric temperature in different pressure layers along TLF (a-b direction). (C) The atmospheric temperature in different pressure layers along ZBF (c-d direction). (D) The atmospheric vertical velocity at 1000 hPa. (E) The atmospheric vertical velocity in different pressure layers along TLF (a-b direction). (F) The atmospheric vertical velocity in different pressure layers along ZBF (c-d direction).
In Liaodong Bay, for the atmospheric temperature above the sea surface was lower than zero, some water vapor rising from the sea surface could be condensed rapidly and formed fog or aerosol floating on the sea surface (Brooks and Thornton, 2018; Tian et al., 2019), which was not recognized as a cloud. Under the influence of northeast wind, referring to the wind field on 9 January in Figure 10, the excessive water vapor and small particles of sea salt were transported to the central Bohai Sea. This process was confirmed in Figure 8 that the SSR anomaly only appeared in Liaodong Bay, while the anomalies of ER and SSS continued to spread southward on January 9.
In the central Bohai Sea, the water vapor coming from the north would not condense but continue to rise up since the atmospheric temperature above the sea surface was above zero. When the rising water vapor got supersaturated at a certain height, it would be condensed to the surface of small particles, such as sea salt and then produced small water droplets and/or small ice crystals, which was similar to the cloud formation process on January 7.
The low-level cloud is distributed in the shape of a strip across the central Bohai Sea, which might be affected by the wind. As shown in Figure 10, the low-level cloud strip located just at the intersection zone of the north and south airflow at 20:00p.m. on January 9, these two opposing airflows led to the accumulation of water vapor in the narrow intersection zone, which provided particular benefits for the formation of the cloud strip along direction east-west. After that, the low-level cloud strip gradually moved southward and finally dissipated due to the weakening of the south airflow and the enhancement of the north airflow. While, due to the influence of high-level clouds in TIR image, the TIR anomaly caused by low-level clouds couldn’t be observed at 22:00p.m. on January 9 in Figure 2.
5.2.3 Abnormal CO Concentration Along the ZBF in Period-II
The changing of CO concentration and atmospheric boundary layer height from 4:00a.m. to 16:00p.m. on January 9 are shown in Figure 13. We noticed that the spatio-temporal changing of the atmospheric boundary layer with a low height was similar to that of CO concentration. Before 4:00a.m. on January 9, there was only an abnormally low and dispersed CO concentration over the Bohai Sea and the western mainland, which could be owned to the diffusion of CO released from TLF by previous gas emissions behavior on January 7. From 4:00a.m. to 8:00a.m. on January 9, the atmospheric boundary layer above the Bohai Bay and Laizhou Bay decreased gradually to be lower than 100 m and the CO started to gather above these two bays. From 12:00p.m. to 16:00p.m. this day, the lower atmospheric boundary layer expanded eastward and developed into a strip in the east-west direction above the central Bohai Sea. Meanwhile, an abnormal CO concentration strip also appeared in a west-east direction, which developed across the central Bohai Sea and extended outside to the Yellow Sea.
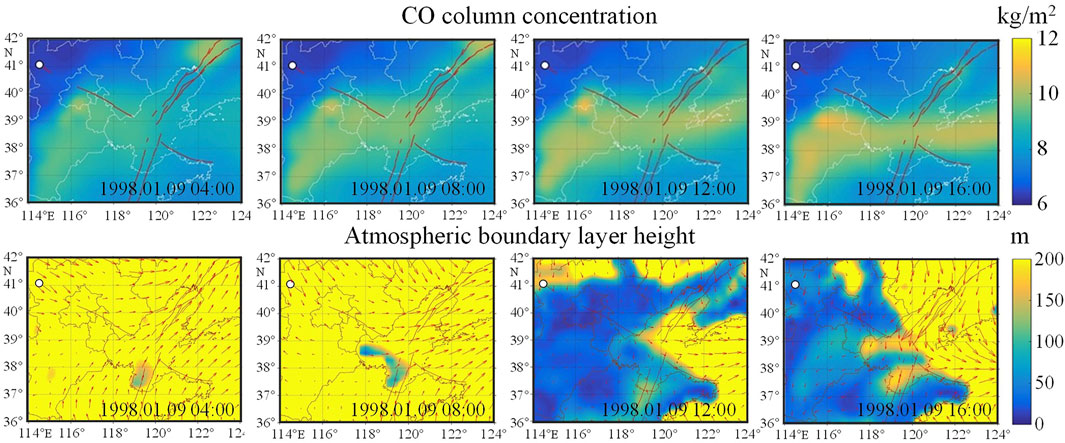
FIGURE 13. The atmospheric boundary layer height and the CO column concentration on 9 January 1998.
The synchronous spatio-temporal changing of these two atmospheric anomalies indicated that the CO concentration anomaly could be correlated with the lower atmospheric boundary layer as the following process in sequence: 1) The intersection of the north airflow and the south airflow or other meteorological factors led to a strip-shaped low boundary layer (Garratt, 1994) produced above the central Bohai Sea from 4:00a.m. to 16:00p.m. on January 9; 2) The lowering atmospheric boundary layer, being able to compress the atmospheric space under boundary layer and led to the aggregation of internal aerosols including CO (Vignati et al., 2001), resulted in a rapid increase of CO concentration above the Bohai Sea; 3) The atmospheric aerosol below the boundary layer, occupying high CO concentration, moved eastward with the west wind, which led to the final formation of an abnormal CO concentration strip across the central Bohai Sea to the Yellow Sea. Therefore, this CO concentration anomaly in period-II was owned to the accumulation of CO existing early in the atmosphere but not to the present gas release from ZBF. Besides, the lowering atmospheric boundary layer might have also promoted the gathering of water vapor and sea salt above the sea surface, so as to facilitate the production of the low-level cloud along ZBF in period-II.
5.3 Mechanism of the Atmospheric Disturbances
This study provided an integral interpretation of the multi-parameter atmospheric disturbances preceding the Zhangbei earthquake. The seismicity-driven mechanism and LCA coupling pattern of the atmospheric anomalies preceding the Zhangbei earthquake are conceptually shown in Figure 14. Figure 14A shows the spatial range of Figures 14B–D, respectively.
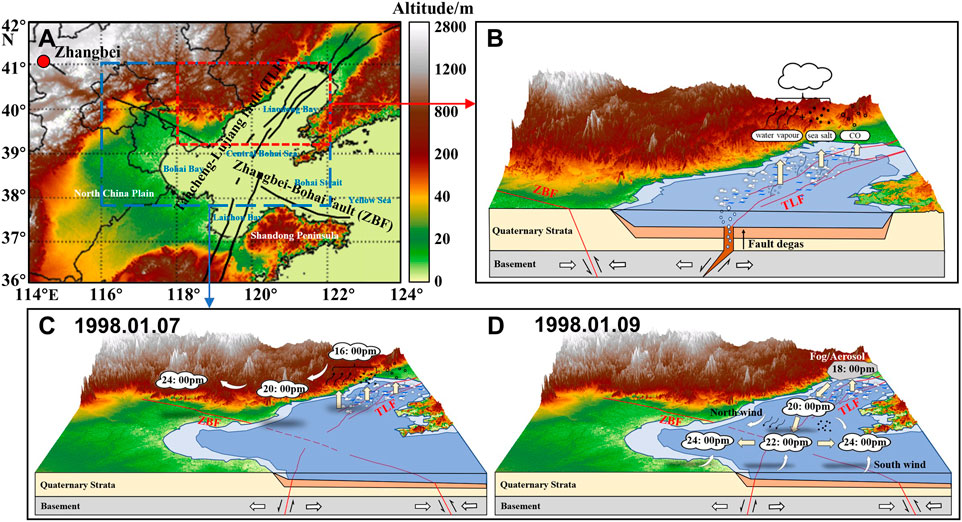
FIGURE 14. (A) The DEM in the study area and the spatial range of (B–D). (B) Conceptual diagram of the LCA coupling and manifestation process of atmospheric disturbances (C,D). The particular spatial distribution and strip-shaped low-level clouds occurred on January 7 and 9 .
Figure 14B shows the formation process of multi-parameter atmospheric disturbances in a manner of integral 3D visualization. Due to the transient crustal stress relaxation of the north segment of the TLF in the Liaodong Bay, gas release might had occurred along with the opened fractures shortly before and after the Zhangbei earthquake. The SSR increased after the bubbles rising from the sea floor reached the sea surface. The burst of bubbles could accelerate the sea–atmosphere exchange process. The water vapor, CO, and small particles of sea salt were continuously brought into the lower atmosphere over the sea surface, which resulted in the anomalies of the ER, the CO concentration, and the SSS concentration over the TLF. A large amount of water vapor and small particles of sea salt acting as cloud condensation nodules provided subsequently necessary conditions for the formation of the low-level clouds.
The particular spatial distribution and strip-shaped low-level clouds that occurred on January 7 and 9 were collaboratively affected by wind field and atmospheric temperature, as shown in Figures 14C,D. Figure 14C shows the formation process of the low-level cloud in period-I. A strip-shaped low-level cloud formed initially above TLF in Liaodong Bay at 16:00p.m. on January 7, then moved southwest to the mainland with the wind at 20:00p.m. about, and finally distributed along the ZBF segment in the mainland area by chance at 24:00p.m. this day. Figure 14D shows the formation process of the low-level cloud in period-II. As the atmospheric temperature above Liaodong Bay was below zero, a part of the water vapor condensed rapidly and formed fog or aerosol floating over the sea surface at 18: 00p.m. on January 9. The remaining water vapor and small particles of sea salt continued to spread southward with the wind, which produced a low-level cloud over the central Bohai Sea at 20:00p.m. Blocked by the south wind from the mainland to Laizhou Bay and compressed by the lowering boundary layer, the water vapor was forced to condense into a strip-shaped low-level cloud along the east-west direction across the Bohai Sea at 24:00p.m. on January 9.
6 Conclusion and Remarks
After careful investigation of multiple satellite observations and reanalysis datasets, significant anomalies from the sea surface to atmosphere were uncovered over the Bohai Sea shortly before and after the Zhangbei earthquake, 10 January 1998. The evolution of the atmospheric disturbances featured as seismic anomalies and affected by a gas release from fault as well as wind field could be interpreted as two periods:
1) Period-I: at 6:00a.m. on January 7, the SSR firstly showed abnormalities along TLF in Liaodong Bay. Four hours later, the anomalies of ER, CO concentration, and SSS concentration appeared subsequently above the sea surface along TLF. Meanwhile, some low-level clouds began to form above TLF with a height of 200 m about and then developed into a short strip-shaped cloud along TLF. Forced by the east wind, the clouds moved westward to the mainland and developed gradually to a low-level cloud strip right along ZBF by chance. All these anomalies lasted throughout January 8 and disappeared completely before January 9.
2) Period-II: at 16:00p.m. on January 9, the SSR anomaly appeared again along TLF, followed by an abnormal rising of ER and SSS concentration. Soon later, as the water vapor and small particles of sea salt moved southward with the wind, and a low-level cloud strip was produced approximately in a direction of east-west along ZBF in the Bohai Sea, blocked by south wind and compressed by the lowering boundary layer. All these anomalies continued until the mainshock on January 10, and dissipated subsequently on January 11.
We conclude that the reported positive TIR strip that occurred preceding the Zhangbei earthquake (Cui et al., 1998; Lv et al., 1998; Lv et al., 2000; Li et al., 2008a; Wu et al., 2009) was caused actually by the low-level clouds, resulting from gas release from TLF, which have higher temperature than that of the land surface in the TIR image, rather than by the land surface thermal anomaly or atmospheric warming. The use of single TIR data, which is usually incomplete or might be polluted by interference factors, may have some defects in the analysis and interpretation of seismic anomalies. Synergic satellite observations and reanalysis datasets are beneficial for the LCA coupling analysis of seismic anomalies. The hourly data of different atmospheric pressure layers is of potentiality to reflect the spatio-temporal evolution process of seismic anomalies in a three-dimensional space.
This study using multi-source reanalysis datasets shows an effective solution to investigate the seismic activity of fault under the ocean, which is difficult to observe in real-time and at a large-scale. The particular activity of the TLF in the Bohai Sea preceding the Zhangbei earthquake is discovered, and the activity of the ZBF previously considered could be at least partly denied. This work initiated a further plan for detailed study of seismic atmospheric anomalies in the Bohai Sea during the past 2 decades since the Zhangbei earthquake, which could help not only to understand the seismic activity of the two great fault systems intersected in the Bohai Sea, but also to seek for potential precursors or omens of future earthquakes that might happen around the Bohai Sea and its nearby.
Data Availability Statement
The publicly available datasets used in this study can be found here: The datasets analyzed for this study are available from National Oceanic and Atmospheric Administration (NOAA) for AVHRR data (https://www.avl.class.noaa.gov/), from ECMWF for ERA5 reanalysis dataset (https://cds.climate.copernicus.eu/), and from National Aeronautics and Space Administration (NASA) for SRTM DEM data, IGGCD data and MERRA-2 reanalysis dataset (https://earthexplorer.usgs.gov).
Author Contributions
YL: data processing and manuscript writing. YL and LW: scientific analysis and article organization. LW: initiative thought and research supervisor. YD and YQ: data collection and article improving.
Funding
This work was jointly supported by the Key Program of the National Natural Science Foundation of China under Grant 41930108, the National Key R&D Program of China under Grant 2018YFC15035, the innovation leading program of Central South University under Grant 506030101.
Conflict of Interest
The authors declare that the research was conducted in the absence of any commercial or financial relationships that could be construed as a potential conflict of interest.
Publisher’s Note
All claims expressed in this article are solely those of the authors and do not necessarily represent those of their affiliated organizations, or those of the publisher, the editors, and the reviewers. Any product that may be evaluated in this article, or claim that may be made by its manufacturer, is not guaranteed or endorsed by the publisher.
Acknowledgments
The authors wish to acknowledge NOAA’s Comprehensive Large Array-data Stewardship System for AVHRR data, ECMWF for the ERA5 reanalysis dataset, and NASA’s Earth Observing System Data and Information System for SRTM DEM data, IGGCD data and the MERRA-2 reanalysis dataset. They would also like to thank the reviewers for their significant improvement on this article.
Supplementary Material
The Supplementary Material for this article can be found online at: https://www.frontiersin.org/articles/10.3389/fenvs.2022.906455/full#supplementary-material
Supplementary Figure S1 | The time series of SSR over Bohai Sea 1 month about before and after Zhangbei earthquake (seismic anomaly appeared on the day labeled in red).
Supplementary Figure S2 | The time series of ER over Bohai Sea 1 month about before and after Zhangbei earthquake (seismic anomaly appeared on the day labeled in red).
Supplementary Figure S3 | The time series of CO concentration over Bohai Sea 1 month about before and after Zhangbei earthquake (seismic anomaly appeared on the day labeled in red).
Supplementary Figure S4 | The time series of SSS concentration over Bohai Sea 1 month about before and after Zhangbei earthquake (seismic anomaly appeared on the day labeled in red).
Supplementary Figure S5 | The time series of CBH over Bohai Sea 1 month about before and after Zhangbei earthquake (anomaly appeared on the day labeled in red).
References
Belmonte Rivas, M., and Stoffelen, A. (2019). Characterizing ERA-Interim and ERA5 Surface Wind Biases Using ASCAT. Ocean. Sci. 15 (3), 831–852. doi:10.5194/os-15-831-2019
Bian, C., Jiang, W., Pohlmann, T., and Sündermann, J. (2016). Hydrography-physical Description of the Bohai Sea. J. Coast. Res. 74 (10074), 1–12. doi:10.2112/SI74-001.1
Brooks, S. D., and Thornton, D. C. O. (2018). Marine Aerosols and Clouds. Annu. Rev. Mar. Sci. 10, 289–313. doi:10.1146/annurev-marine-121916-063148
Che, Y., Yu, J., Liu, W., and Yi, L. (1999). Underground Fluid Anomaly Field and Cause Analysis of Zhangbei-Shangyi Earthquake. Acta seismo. Sin. 2, 194–201. (In Chinese). doi:10.3321/j.issn:0253-3782.1999.02.011
Cui, C., Zhang, J., Qin, Y., Zhi, Y., Lv, Q., Luo, Z., et al. (1998). “Satellite Remote Sensing Monitoring of Thermal Infrared Anomaly before Zhangbei Earthquake,” in Advanced Seminar on China's Strategy of Safe Disaster Reduction and Sustainable Development in the 21st Century. (In Chinese).
De Leeuw, G., Andreas, E. L., Anguelova, M. D., Fairall, C. W., Lewis, E. R., O'Dowd, C., et al. (2011). Production Flux of Sea Spray Aerosol. Rev. Geophys. 49 (2), 349. doi:10.1029/2010RG000349
Deng, Q., Min, W., Chao, H., Li, J., Wang, Z., and Man, H. (2001). “Cenozoic Tectonics and Seismicity in Bohai Area,” in Neotectonics And Environment (In Chinese) (Beijing: Seismological publishing house), 218–233.
Ding, Y., Qi, Y., Wu, L., Mao, W., and Liu, Y. (2021). Discriminating the Multi-Frequency Microwave Brightness Temperature Anomalies Relating to 2017 Mw 7.3 Sarpol Zahab (Iran-Iraq Border) Earthquake. Front. Earth Sci. 9, 216. doi:10.3389/feart.2021.656216
Feng, Y., Chen, Y., and Guo, G. (2010). Satellite Thermal Infrared Anomaly before Zhangbei Earthquake. J. Nanyang Norm. Uni. 9 (9), 55–58. (In Chinese). doi:10.3969/j.issn.1671-6132.2010.09.015
Garratt, J. R. (1994). The Atmospheric Boundary Layer. Earth-Sci. Rev. 37 (1-2), 89–134. doi:10.1016/0012-8252(94)90026-4
Geersen, J., Scholz, F., Linke, P., Schmidt, M., Lange, D., Behrmann, J. H., et al. (2016). Fault Zone Controlled Seafloor Methane Seepage in the Rupture Area of the 2010 Maule Earthquake, Central chile. Geochem. Geophys. Geosyst. 17 (11), 4802–4813. doi:10.1002/2016GC006498
Gelaro, R., McCarty, W., Suárez, M. J., Todling, R., Molod, A., Takacs, L., et al. (2017). The Modern-Era Retrospective Analysis for Research and Applications, Version 2 (MERRA-2). J. Clim. 30 (14), 5419–5454. doi:10.1175/JCLI-D-16-0758.1
Guo, G. (2010). Atmospheric Thermal Anomaly before Zhangbei Earthquake in 1998. Sci. Tech. Rev. 28 (14), 98–100. (In Chinese). doi:10.1017/S0004972710001772
Hersbach, H., Bell, B., Berrisford, P., Hirahara, S., Horányi, A., Muñoz‐Sabater, J., et al. (2020). The ERA5 Global Reanalysis. Q.J.R. Meteorol. Soc. 146 (730), 1999–2049. doi:10.1002/qj.3803
Jing, F., and Singh, R. P. (2021). “Satellite Observed Multi-Parameter Variations Associated with the 2020 Yutian Earthquake, China,” in Proceeding of the 2021 IEEE International Geoscience and Remote Sensing Symposium IGARSS, Brussels, Belgium, July 2021 (IEEE), 1476–1479. doi:10.1109/IGARSS47720.2021.9554237
Jing, F., Singh, R. P., and Shen, X. (2019). Land - Atmosphere - Meteorological Coupling Associated with the 2015 Gorkha (M 7.8) and Dolakha (M 7.3) Nepal Earthquakes. Geomatics, Nat. Hazards Risk 10 (1), 1267–1284. doi:10.1080/19475705.2019.1573629
Johnson, H. P., Merle, S., Salmi, M., Embley, R., Sampaga, E., and Lee, M. (2019). Anomalous Concentration of Methane Emissions at the Continental Shelf Edge of the Northern Cascadia Margin. J. Geophys. Res. Solid Earth 124 (3), 2829–2843. doi:10.1029/2018JB016453
Keene, W. C., Maring, H., Maben, J. R., Kieber, D. J., Pszenny, A. A. P., Dahl, E. E., et al. (2007). Chemical and Physical Characteristics of Nascent Aerosols Produced by Bursting Bubbles at a Model Air-Sea Interface. J. Geophys. Res. 112 (D21), 8464. doi:10.1029/2007JD008464
Klaucke, I., Weinrebe, W., Linke, P., Kläschen, D., and Bialas, J. (2012). Sidescan Sonar Imagery of Widespread Fossil and Active Cold Seeps along the Central Chilean Continental Margin. Geo-Mar. Lett. 32 (5-6), 489–499. doi:10.1007/s00367-012-0283-1
Li, D., Zhang, Z., Zhang, W., and Tao, Q. (2009). Neotectonic Movement Characteristics and Environmental Geological Significance in Bohai Sea Area with its Adjacent Areas. Mar. Geol. Lett. 25 (2), 1–7. (In Chinese). doi:10.3969/j.issn.1009-2722.2009.02.001
Li, J., Wu, L., Liu, S., and Ma, B. (2008a). Pre-earthquake Thermal Infrared Anomaly Recognition Method and Quantitative Analysis Model. J. China Univ. Min. Tech. 37 (6), 808–813. (In Chinese). doi:10.3321/j.issn:1000-1964.2008.06.015
Li, J., Wu, L., Wen, Z., and Liu, S. (2008b). Studies on Abnormal Surface Latent Heat Flux Prior to Major Coastal and Terrestrial Earthquakes in China. Sci. Tech. Rev. 26 (5), 41–46. (In Chinese). doi:10.3321/j.issn:1000-7857.2008.05.008
Lin, Y., Wang, J., and Gao, S. (1998). A New Measurement Method for CO2 in Fault Gas and Prediction of Zhangbei-Shangyi M6.2 Earthquake. Earthquake 18 (4), 353–357. (In Chinese). doi:10.1088/0256-307X/16/9/027
Lv, Q., Ding, J., Cui, C., Zhang, J., and Liu, Q. (1998). Satellite Thermal Infrared Anomaly before the Zhangbei Earthquake Ms=6.2. Earthquake 3, 240–244. (In Chinese).
Lv, Q., Ding, J., and Cui, C. (2000). Possible Satellite Thermal Infrared Anomalies before the Zhangbei Ms6.2 Earthquake on January 10, 1998. Acta seismo. Sin. 022 (002), 183–188. (In Chinese). doi:10.3321/j.issn:0253-3782.2000.02.011
Lv, X., Yuan, D., Ma, X., and Tao, J. (2014). Wave Characteristics Analysis in Bohai Sea Based on ECMWF Wind Field. Ocean. Eng. 91, 159–171. doi:10.1016/j.oceaneng.2014.09.010
Natarajan, V., and Philipoff, P. (2018). Observation of Surface and Atmospheric Parameters Using "NOAA 18" Satellite: a Study on Earthquakes of Sumatra and Nicobar Is Regions for the Year 2014 (M ≥ 6.0). Nat. Hazards 92 (2), 1097–1112. doi:10.1007/s11069-018-3242-y
Ning, X., Lin, C., Su, J., Liu, C., Hao, Q., Le, F., et al. (2010). Long-term Environmental Changes and the Responses of the Ecosystems in the Bohai Sea during 1960–1996. Deep Sea Res. Part II Top. Stud. Oceanogr. 57 (11-12), 1079–1091. doi:10.1016/j.dsr2.2010.02.010
Paluch, I. R., and Lenschow, D. H. (1991). Stratiform Cloud Formation in the Marine Boundary Layer. J. Atmos. Sci. 48 (19), 2141–2158. doi:10.1175/1520-0469(1991)048<2141:scfitm>2.0.co;2
Qiao, S., Shi, X., Wang, G., Zhou, L., Hu, B., Hu, L., et al. (2017). Sediment Accumulation and Budget in the Bohai Sea, Yellow Sea and East China Sea. Mar. Geol. 390, 270–281. doi:10.1016/j.margeo.2017.06.004
Qin, W., Zhang, Y., Chen, J., Yu, Q., Cheng, S., Li, W., et al. (2019). Variation, Sources and Historical Trend of Black Carbon in Beijing, China Based on Ground Observation and MERRA-2 Reanalysis Data. Environ. Pollut. 245, 853–863. doi:10.1016/j.envpol.2018.11.063
Rawat, V., Saraf, A. K., Das, J., Sharma, K., and Shujat, Y. (2011). Anomalous Land Surface Temperature and Outgoing Long-Wave Radiation Observations Prior to Earthquakes in India and Romania. Nat. Hazards 59 (1), 33–46. doi:10.1007/s11069-011-9736-5
Singh, R. P., Jing, F., and Ye, Q. (2019). “Changes in Chlorophyll Concentrations Associated with the 5.1 La Habra Earthquake, California of 29 March 2014,” in Proceeding of the IGARSS 2019-2019 IEEE International Geoscience and Remote Sensing Symposium, Yokohama, Japan, July-Aug. 2019 (IEEE), 9596–9599. doi:10.1109/IGARSS.2019.8900527
Singh, R. P., Mehdi, W., and Sharma, M. (2010a). Complementary Nature of Surface and Atmospheric Parameters Associated with Haiti Earthquake of 12 January 2010. Nat. Hazards Earth Syst. Sci. 10 (6), 1299–1305. doi:10.5194/nhess-10-1299-2010
Singh, R. P., Senthil Kumar, J., Zlotnicki, J., and Kafatos, M. (2010b). Satellite Detection of Carbon Monoxide Emission Prior to the Gujarat Earthquake of 26 January 2001. Appl. Geochem. 25 (4), 580–585. doi:10.1016/j.apgeochem.2010.01.014
Song, J., and Duan, L. (2019). “The Bohai Sea,” in World Seas: An Environmental Evaluation (Academic Press), 377–394. doi:10.1016/B978-0-08-100853-9.00024-5
Tian, M., Wu, B., Huang, H., Zhang, H., Zhang, W., and Wang, Z. (2019). Impact of Water Vapor Transfer on a Circum-Bohai-Sea Heavy Fog: Observation and Numerical Simulation. Atmos. Res. 229, 1–22. doi:10.1016/j.atmosres.2019.06.008
Toutain, J., and Baubron, J. (1999). Gas Geochemistry and Seismotectonics: a Review. Tectonophysics 304 (1-2), 1–27. doi:10.1016/S0040-1951(98)00295-9
Veron, F. (2015). Ocean Spray. Annu. Rev. Fluid Mech. 47, 507–538. doi:10.1146/annurev-fluid-010814-014651
Vignati, E., De Leeuw, G., and Berkowicz, R. (2001). Modeling Coastal Aerosol Transport and Effects of Surf-Produced Aerosols on Processes in the Marine Atmospheric Boundary Layer. J. Geophys. Res. 106 (D17), 20225–20238. doi:10.1029/2000JD000025
Wang, P. (2021). Petroleum Geological Conditions and Distribution Characteristics of Oil and Gas Fields in the Bohai Sea. Chem. Enterp. Manage. 5, 191–192. (In Chinese). doi:10.19900/j.cnki.ISSN1008-4800.2021.05.091
Wu, L., Li, J., and Liu, S. (2009). Infrared Anomaly Analysis Based on Reference Fields for Earthquake Remote Sensing. Earthquake 29 (z1), 26–33. (In Chinese). doi:10.3969/j.issn.1000-3274.2009.z1.005
Wu, L., Qin, K., Liu, S., De Santis, A., and Cianchini, G. (2012). “Importance of Lithosphere-Coversphere-Atmosphere Coupling to Earthquake Anomaly Recognition,” in Proceeding of the 2012 IEEE International Geoscience and Remote Sensing Symposium, Munich, Germany (IEEE), 3532–3535. doi:10.1109/IGARSS.2012.6350657
Yang, Z., Calderer, A., He, S., Sotiropoulos, F., Krishnamurthy, R., Leo, L. S., et al. (2019). Measurement-based Numerical Study of the Effects of Realistic Land Topography and Stratification on the Coastal Marine Atmospheric Surface Layer. Boundary-Layer Meteorol. 171 (2), 289–314. doi:10.1007/s10546-018-00423-2
Zang, K., Zhang, G., and Wang, J. (2020). Methane Emissions from Oil and Gas Platforms in the Bohai Sea, China. Environ. Pollut. 263, 114486. doi:10.1016/j.envpol.2020.114486
Keywords: atmospheric disturbance, low-level cloud, gas release from fault, thermal infrared anomaly, Zhangbei earthquake
Citation: Liu Y, Wu L, Qi Y and Ding Y (2022) Very-Short-Term Variations of Sea Surface and Atmospheric Parameters Before the Ms 6.2 Zhangbei (China) Earthquake in 1998. Front. Environ. Sci. 10:906455. doi: 10.3389/fenvs.2022.906455
Received: 28 March 2022; Accepted: 16 May 2022;
Published: 24 June 2022.
Edited by:
Sergey Alexander Pulinets, Space Research Institute (RAS), RussiaReviewed by:
Feng Jing, China Earthquake Administration, ChinaRamesh P. Singh, Chapman University, United States
Copyright © 2022 Liu, Wu, Qi and Ding. This is an open-access article distributed under the terms of the Creative Commons Attribution License (CC BY). The use, distribution or reproduction in other forums is permitted, provided the original author(s) and the copyright owner(s) are credited and that the original publication in this journal is cited, in accordance with accepted academic practice. No use, distribution or reproduction is permitted which does not comply with these terms.
*Correspondence: Lixin Wu, d3VseDY2QGNzdS5lZHUuY24=