 Isabel B. Key1,2
 Alison C. Smith1,3
 Beth Turner1,4
 Alexandre Chausson1
 Cécile A. J. Girardin1,3Megan Macgillivray1
 Nathalie Seddon1*
- 1Nature-based Solutions Initiative, Department of Biology, University of Oxford, Oxford, United Kingdom
- 2Changing Oceans Research Group, School of GeoSciences, University of Edinburgh, Edinburgh, United Kingdom
- 3Environmental Change Institute, School of Geography and Environment, University of Oxford, Oxford, United Kingdom
- 4Centre d’Étude de la Forêt, Département Des Sciences Biologiques, Université Du Québec à Montréal, Montréal, QC, Canada
Nature-based solutions (NbS) are increasingly recognised for their potential to address both the climate and biodiversity crises. Both these outcomes rely on the capacity of NbS to support and enhance the health of an ecosystem: its biodiversity, the condition of its abiotic and biotic elements, and its capacity to continue to function despite environmental change. However, while understanding of ecosystem health outcomes of NbS for climate change mitigation has developed in recent years, the outcomes of those implemented for adaptation remain poorly understood. To address this, we systematically reviewed the outcomes of 109 nature-based interventions for climate change adaptation using 33 indicators of ecosystem health across eight broad categories (e.g., diversity, biomass, ecosystem composition). We showed that 88% of interventions with reported positive outcomes for climate change adaptation also reported benefits for ecosystem health. We also showed that interventions were associated with a 67% average increase in species richness. All eight studies that reported benefits for both climate change mitigation and adaptation also supported ecosystem health, leading to a “triple win.” However, there were also trade-offs, mainly for forest management and creation of novel ecosystems such as monoculture plantations of non-native species. Our review highlights two key limitations in our understanding of the outcomes of NbS for ecosystem health. First, a limited selection of metrics are used and these rarely include key aspects such as functional diversity and habitat connectivity. Second, taxonomic coverage is limited: 50% of interventions only had evidence for effects on plants, and 57% of outcomes did not distinguish between native and non-native species. We make suggestions of how to improve assessments of the ecosystem health outcomes of NbS, as well as policy recommendations to enable the upscaling of NbS that support flourishing and resilient ecosystems, and are effective in addressing both climate and biodiversity goals.
1 Introduction
Nature-based solutions (NbS)—actions that involve working with nature to address societal challenges, with benefits for both people and biodiversity—are widely recognised as having the potential to provide a win-win for jointly addressing the climate and biodiversity crises (IUCN, 2020; Austin et al., 2021; Mori et al., 2021; Seddon et al., 2021; Seddon, 2022). Through restoring, connecting and protecting a wide range of ecosystems and sustainably managing working lands and seas, NbS can help reduce emissions and enhance sinks of greenhouse gases (Girardin et al., 2021) while also reducing the vulnerability of social-ecological systems to the impacts of climate change (Seddon et al., 2020a; Roe et al., 2021; Turner et al., 2022). Such actions also sustain biodiversity both directly, by protecting and enhancing the health, extent and connectivity of ecosystems and the species they support, and indirectly by reducing climate change and its impacts on species and habitats. Recognising the interlinked nature of these two global challenges, the first ever joint report from the intergovernmental panels on climate change and biodiversity highlighted the need for a paradigm shift towards addressing the ‘simultaneous objectives of a habitable climate, self-sustaining biodiversity, and a good quality of life for all’ across multifunctional landscapes, including prominent use of nature-based solutions (IPBES-IPCC, 2021).
NbS are fundamentally a social-ecological system, where local human communities are inseparable from the ecological elements (Seddon et al., 2020a; Woroniecki et al., 2021; Turner et al., 2022). Here we focus on the links between NbS and their ecological outcomes. This is an essential starting point for future more holistic assessments in which outcomes for people and their interactions with the ecosystem are assessed simultaneously (Caillon et al., 2017).
NbS are reliant not only on biodiversity (the diversity of genes, functions, species and ecosystems) but also on the broader health of ecosystems. Ecosystem health, including its capacity to perform a variety of ecosystem functions and its capacity to resist and recover from environmental shocks and adapt to change, depends on a wide range of factors. These include both biotic and abiotic elements, in particular the diversity, abundance and composition of its component species, the condition of its soils and water, the effective functioning of supporting processes such as carbon, water and nutrient cycling, reproduction and growth and its connections to other ecosystems (Oliver et al., 2015a); biodiversity is one component of ecosystem health (for definitions, see Table 1). Ecosystem health is thus defined as the condition of an ecosystem in which these biotic and abiotic dynamic attributes are expressed within the normal ranges of activity relative to its ecological state of development (Society for Ecological Restoration International Science & Policy Working Group, 2004). Hence, a healthy ecosystem is one with a species composition and biodiversity similar to that of a reference or baseline ecosystem, as well as one with good water, soil and air quality, key ecosystem functions intact, and resilience to environmental change.
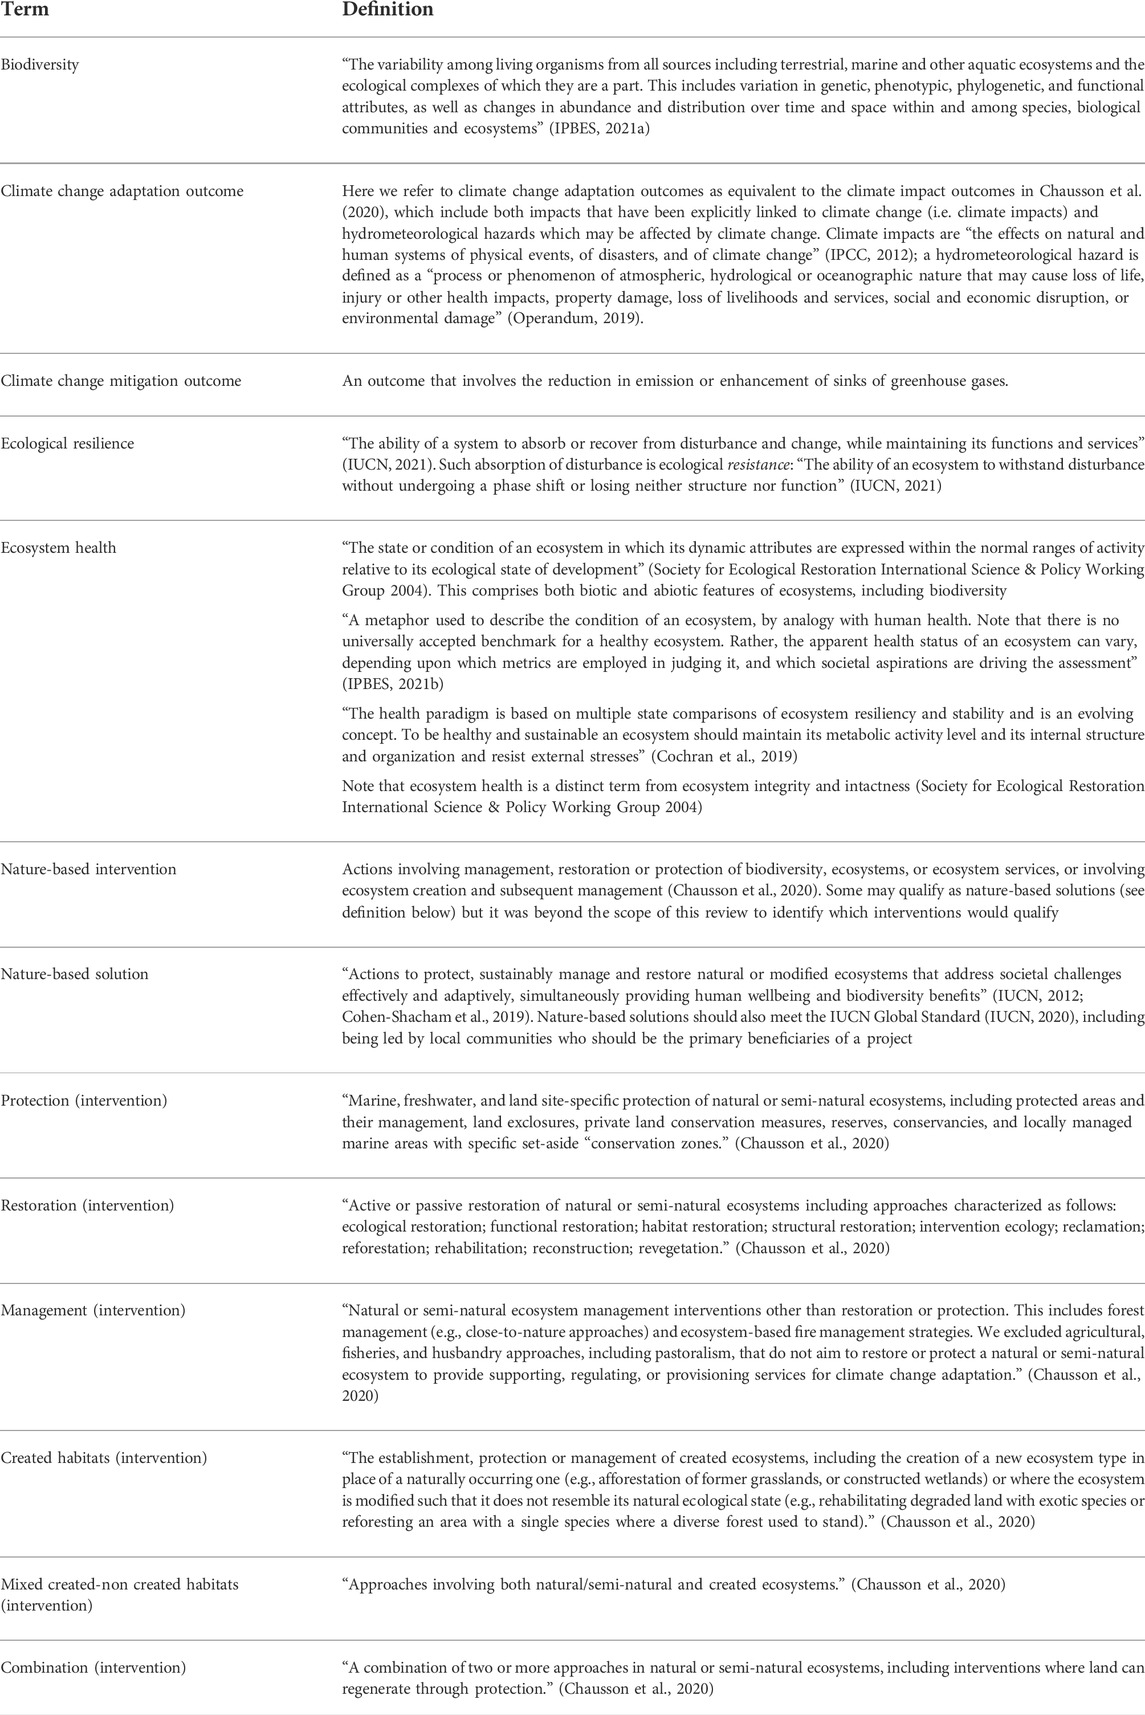
TABLE 1. Definitions of key social-ecological terms and intervention types.
Ecosystem health is fundamental for successful NbS for several reasons. First, ecosystem services—including those that contribute to climate change adaptation, such as flood and erosion protection, freshwater supply and microclimate regulation (cooling and shading)—can only be produced sustainably in the long term by healthy, functioning ecosystems. Also, more biodiverse ecosystems often enable greater supply of ecosystem services, such as when niche complementarity leads to increased biomass production and carbon storage (Qiu and Cardinale, 2020; Mori et al., 2021). Second, biodiversity enables the delivery of multiple ecosystem services and reduces trade-offs between them. For example, natural regeneration of diverse forest rather than creation of monoculture tree plantations can avoid trade-offs between the capacity of a forest to prevent soil erosion and the risk that plantations of fast-growing species can reduce water availability (Smith et al., 2017; Chausson et al., 2020). Third, greater biodiversity tends to enhance the resilience of ecosystems, and the services they provide, to perturbations and long-term environmental changes such as those caused by climate change. For example, when comparing similar ecosystems with different numbers of species, those with more species tend to be able to sustain productivity in the face of environmental stress through an ‘insurance effect’ whereby at least some species are able to adapt to changing conditions and maintain key ecosystem functions (Oliver et al., 2015b). The effect of the resilience provided by biodiversity on carbon sequestration has recently been estimated at a global scale: Mori et al. (2021) found that reducing greenhouse gas emissions could help maintain global tree diversity, in turn avoiding a 9%–39% drop in primary productivity on land over half a century and the associated emissions. Finally, supporting or enhancing ecosystem health through NbS is important because of non-instrumental values of healthy ecosystems, including both intrinsic values (the right of nature to exist independent of its value to humans) and relational values/cultural ecosystem services (e.g., sense of place, aesthetic and spiritual values, and the sense of “living a good life”) (Himes and Muraca, 2018; Chan et al., 2016). Indeed, giving back to ecosystems in ways beyond those needed for human benefits are an essential element of many people’s worldviews and values, notably many Indigenous Peoples and local communities (Comberti et al., 2015).
There has been widespread interest in working with nature to address societal challenges in recent years, such as through planting trees to offset carbon emissions. However, not all of these interventions meet the standards for an action to be defined as an NbS, including delivering measurable benefits for biodiversity and ecosystem health (IUCN, 2020; Seddon, Smith et al., 2021). Indeed, the outcomes of such nature-based interventions for ecosystem health are not always monitored and reported. This is problematic because it could lead to nature-based interventions that are ineffective in the long term, and unable to sustain the many aforementioned benefits associated with ecosystem health. For example, there is concern that funding through carbon credits has encouraged creation of fast-growing, single-species tree plantations that sequester carbon rapidly in the short term, but have low resilience as a carbon store, miss opportunities to support biodiversity, and sometimes lead to water shortages (Scheidel and Work, 2018; Lewis et al., 2019; Heilmayr et al., 2020; Mori, 2020). Such interventions are being mislabelled as NbS; true NbS would be designed to deliver multiple benefits for local communities and to support or enhance ecosystem health, in line with the latest evidence and guidelines, including taking a long-term, holistic approach to evaluating outcomes (Chazdon, 2020; IUCN, 2020; Fischer et al., 2021; Welden et al., 2021; Seddon, 2022).
Designing NbS that deliver multiple benefits for people and nature in the long term requires information on how to support ecosystem health. There is no comprehensive overview of the evidence on the outcomes of NbS for ecosystem health, but there have been a range of studies that provide specific insights on this question. For example, synergies and trade-offs between biodiversity conservation and carbon storage have recently gained attention in scientific research, through broadscale modelling studies (e.g., De Lamo et al., 2020; Strassburg et al., 2020; Sala et al., 2021), and empirical evidence (e.g., Mukul et al., 2016; Rana et al., 2017; Osuri et al., 2020). However, interactions with outcomes for climate change adaptation have received less attention, and synthesis across empirical studies is lacking. A review of the outcomes of nature-based interventions for climate change adaptation by Chausson et al. (2020) recorded information on the overall ecological outcomes of interventions, but did not record individual ecosystem health metrics such as species richness. There are also numerous reviews of the ecosystem health outcomes of specific types of conservation interventions, such as for terrestrial protected areas (e.g., Gray et al., 2016; Geldmann et al., 2018), marine protected areas (e.g., Sala and Giakoumi, 2018), and natural forest regeneration (e.g., Uebel et al., 2017), as well as the outcomes of plantation forestry (e.g., Bremer et al., 2010).
In summary, there is no comprehensive understanding of ecological outcomes from NbS to support claims that NbS can provide a “triple win” for climate, biodiversity and people. There are three key evidence gaps relating to the biodiversity and ecosystem health outcomes of NbS. There has been no systematic assessment of: 1) the ecosystem health outcomes of nature-based interventions that address climate change adaptation; 2) the extent to which outcomes vary depending on metrics used to assess ecosystem health and/or the ecological context of the nature-based interventions; and 3) whether and how nature-based interventions can both reduce climate change impacts and support ecosystem health. Here, we address these evidence gaps by collating evidence on the outcomes of nature-based interventions for ecosystem health, and how these relate to outcomes for climate change adaptation. We use the term ‘nature-based interventions’ because we do not restrict the review to interventions that meet the criteria to be NbS, as there is rarely sufficient evidence in the literature to make this distinction, and also because we can still learn useful lessons on ecosystem health outcomes from studies of non-NbS interventions, which could be applied to the design of high quality NbS.
We use systematic coding of studies and simple meta-analytical methods to answer six key research questions (RQ). RQ1: What is the geographical distribution and typology of nature-based interventions that have evidence on both climate change adaptation and ecosystem health outcomes? RQ2: How are outcomes for ecosystem health measured? RQ3: Is there evidence for nature-based interventions for climate change adaptation supporting ecosystem health, including through increasing biodiversity? RQ4: Do the recorded outcomes for ecosystem health vary depending on the methods used to measure it? RQ5: Do outcomes for ecosystem health vary with the ecological context of the nature-based intervention (i.e., the type of intervention, the ecosystem in which it is implemented, and the time since implementation)? RQ6: Is there evidence for win-win outcomes where nature-based interventions simultaneously support ecosystem health and contribute to climate change adaptation, and how does that vary with the aspects of ecosystem health assessed? Moreover, is there any evidence for a “triple win” where these nature-based interventions also support climate change mitigation?
We use a simplified meta-analysis of outcomes for species richness–a commonly used indicator of biodiversity–to address RQ3. For the meta-analysis, we predict greater changes in species richness for 1) interventions that have been in place longer, because there has been more time for differences from the baseline habitat to develop following the intervention, and 2) interventions involving restoration of degraded ecosystems and creation of new ecosystems, rather than protection and management of existing ecosystems, because the control or baseline sites are likely to be more degraded. For the review as a whole, we predict that there will be more negative or mixed ecosystem health outcomes for 1) interventions involving creation of novel ecosystems such as plantations, because these often involve the use of a low diversity mix of non-native species, and 2) when more taxa and more categories of metric are studied for a single intervention, because there could be trade-offs between outcomes for different species or different aspects of ecosystem health.
We discuss the comprehensiveness and quality of the evidence for ecosystem health outcomes of NbS, and the ability of NbS to deliver a win-win for climate and biodiversity. Finally we outline how ecosystem health assessments for NbS could be improved, make policy recommendations to support NbS that maximise synergies between biodiversity conservation and climate action, and identify key questions for future research.
2 Materials and methods
2.1 Definitions and categorisation of ecosystem health outcomes
Due to variation in the use of some social and ecological terms within research, practice and policy literature, we provide definitions for the key terms we use in this review (Table 1). Our study is focused on nature-based interventions–actions involving the management, restoration or protection of biodiversity, ecosystems, or ecosystem services, or involving ecosystem creation and subsequent management (definitions in Table 1). Such interventions have the potential to qualify as nature-based solutions, but it is beyond the scope of this review to identify which in practice met the essential criteria. Note that some papers in our review contained more than one intervention.
We formulated a three-tiered hierarchy to describe the ecosystem health outcomes of each intervention (Table 2). At the lowest level of the hierarchy are the individual ecosystem health metrics (e.g., Shannon’s diversity index). These are grouped into metric types (e.g., species diversity), derived from a draft list compiled before the review which was then revised through an inductive process whilst coding the studies. The metric types are grouped into broad metric categories (e.g., diversity). The broad categories were chosen to reflect the types of metrics we found across the interventions, rather than “forcing” our dataset into ecosystem health categories defined elsewhere, although we drew in part on a framework developed by Smith et al. (2017). We have assigned each ecosystem health metric to just one broad category, to avoid double-counting in data analysis, although some metrics may be relevant to other categories.
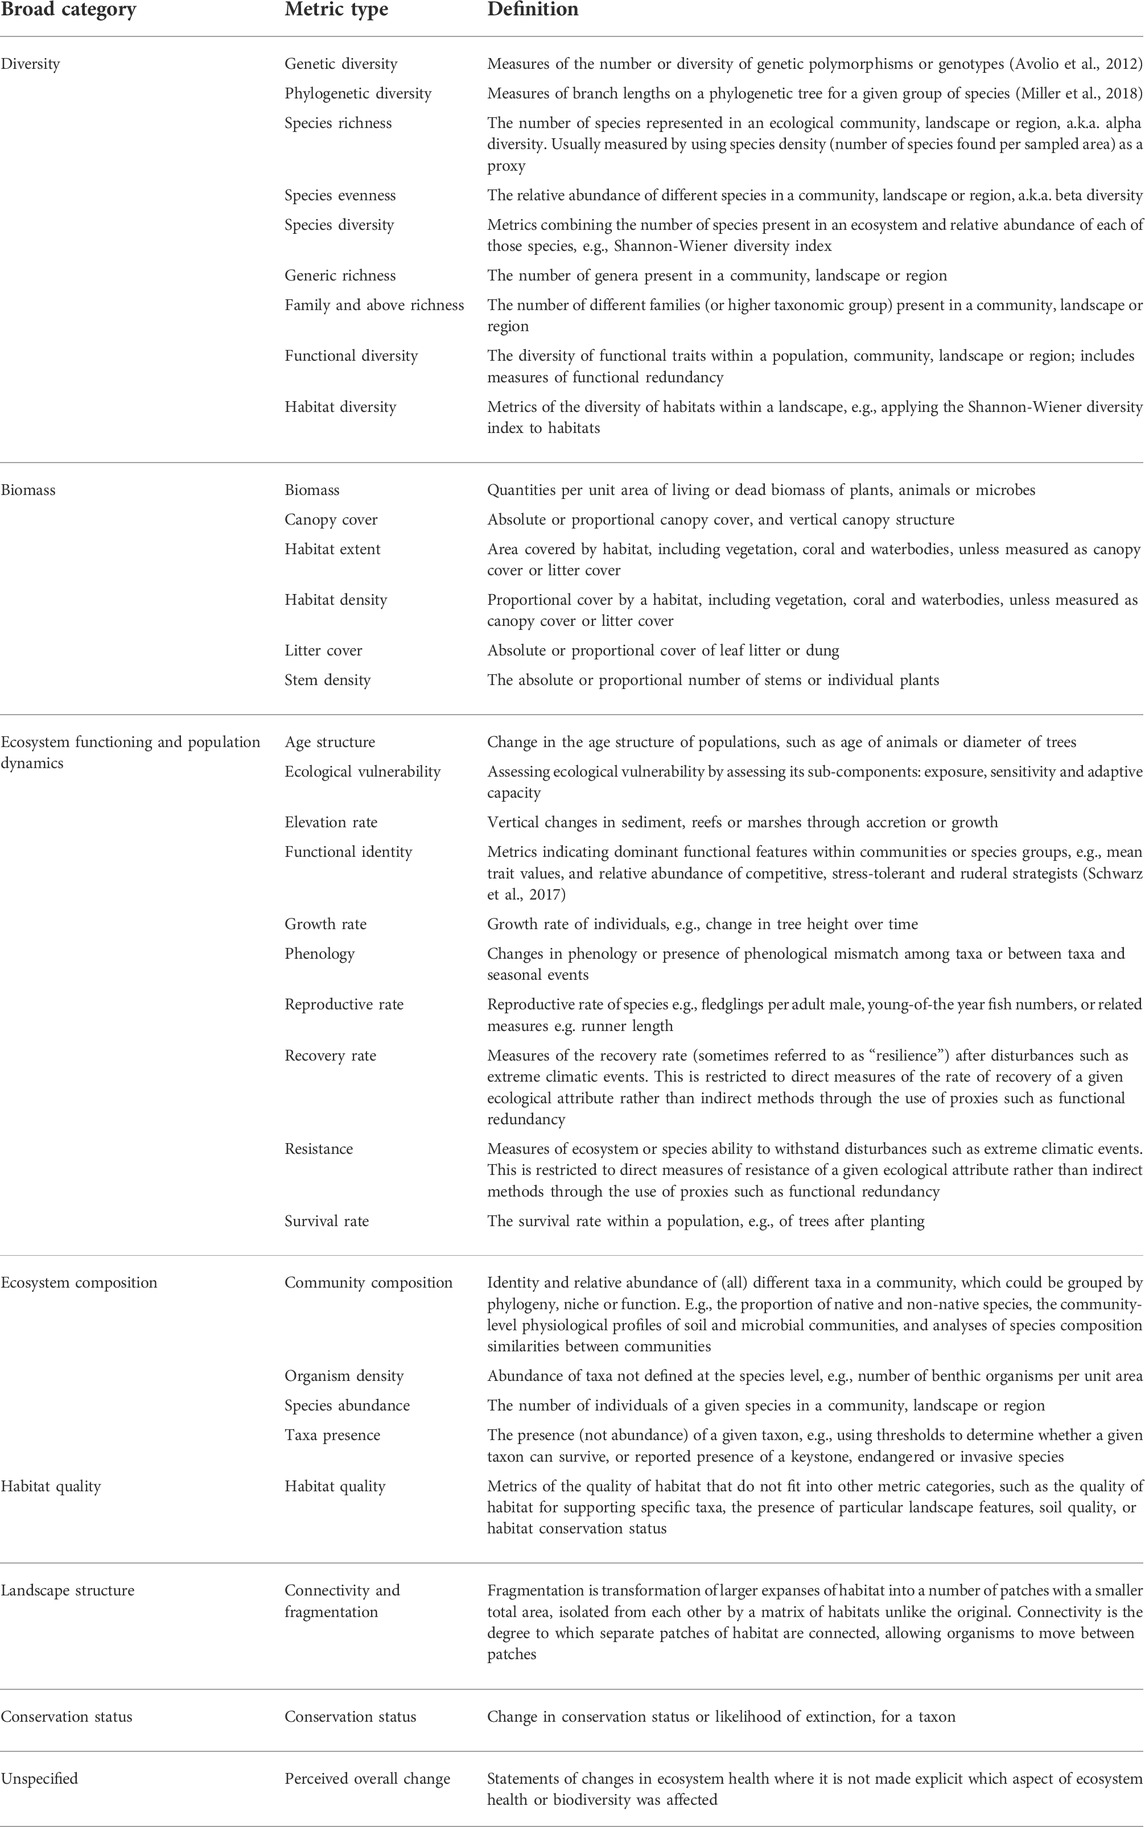
TABLE 2. Ecosystem health broad metric categories, metric types and definitions used to code the ecosystem health outcomes of interventions.
2.2 Data collection
Our review builds on a global systematic map assessing the outcomes of nature-based interventions in any ecosystem, except urban and agricultural, which had at least one reported effect on a climate change or hydrometeorological impact (Chausson et al., 2020). The map was based on a systematic search of academic literature up to April 2018. This systematic mapping and coding protocol was later extended to papers published up until April 2020, this time only for interventions in low and lower-middle income countries, for a review of local development outcomes from nature-based interventions (Roe et al., 2021). The data for both studies are available online on the Nature-based Solutions Initiative’s Evidence Tool (www.naturebasedsolutionsevidence.info/evidence-tool/). While the focus was on extracting evidence for adaptation, any evidence on climate mitigation and ecosystem health were also recorded but were not explored in depth; nor was the quality of this evidence documented. For our review, we used the subset of 79 of these studies that reported outcomes for ecosystem health; for a flow diagram of study inclusion see Supplementary Section S1.1. All the studies in our review therefore contain empirical evidence on the outcomes of interventions both for climate change adaptation and ecosystem health. The subset of these interventions for which both of these outcomes were positive could be effective nature-based solutions for climate change adaptation, provided that the other NbS criteria regarding community involvement and social outcomes are also met (Seddon, Smith et al., 2021). Abiotic aspects of ecosystems, such as air and water quality, were only coded as ecosystem health outcomes if the authors linked these outcomes to ecosystem health. We did not conduct a separate search for interventions with outcomes for climate change mitigation and ecosystem health. This means that the only information we have on the effect of interventions on mitigation is from studies that recorded this information in addition to effects on adaptation.
In this review we disaggregated ecosystem health outcomes into individual metrics, categorised as shown in Table 2. The “direction” of each outcome was coded as positive (increase in ecosystem health metric, or combination of positive and no effect), negative (decrease in ecosystem health metric, or combination of negative and no effect), mixed (combination of positive and negative over space or time), no effect (no change apparent, including non-statistically significant changes, but not changes where no statistical test was applied), or unclear (unclear effect on ecosystem health, e.g., due to lack of a control or baseline, or lack of clarity from the authors as to what constitutes an improvement in the health of the ecosystem). Direction of outcome was determined from the results and supplementary results from papers; the framing of an outcome by authors was used to determine whether a given outcome was beneficial or not for ecosystem health, e.g., an increase in abundance of a non-native species was coded as a positive outcome unless framed as otherwise by the authors. We also coded the following additional information for each metric where appropriate: kingdom of taxa studied, animal class, plant group and native/non-native identity of species. Each intervention was then assigned an overall ecosystem health assessment using the same categories as defined above, to code as either an overall increase, decrease, mixed, no effect or unclear change in ecosystem health based on the individual ecosystem health outcomes (e.g., an increase in Shannon’s diversity index for plants and a decrease in canopy cover would be classed as a mixed effect). This overall ecosystem health assessment is used only to indicate the aggregate direction of impact for the metrics measured in each study. The actual overall ecosystem health is likely to depend on further outcomes that have not been measured, as well as the relative effect of each outcome (e.g., one highly significant negative outcome could outweigh multiple less significant positive outcomes).
The majority of coding was conducted by a single author (IBK), with the first six studies also being separately coded by a second author (MM); for the full coding protocol, see Supplementary Section S1.2. In addition, the following information was collated from the existing systematic coding by Chausson et al., 2020: information on the interventions themselves (e.g., intervention type, ecosystem type), and their outcomes for climate change adaptation and mitigation. For detailed methods on how this information was coded, see Chausson et al. (2020). The full dataset analysed for this study is provided in the Supplementary Material.
2.3 Data analysis
2.3.1 Outcome analysis
We analysed the frequency and coincidence of use of different ecosystem health metrics and broad metric categories, and compared outcomes across taxa and of native vs. non-native species. Analyses of native vs. non-native species excluded ecosystem health outcomes for which the native/non-native identity of species was either not relevant to the metric (e.g., litter cover) or could be incorporated within it (e.g., habitat quality) (Supplementary Section S1.3). Note that we analysed the taxonomic groups and native/non-native identity of species assessed in outcomes, rather than those used for the implementation of an intervention (e.g., tree species selected for planting in a reforestation project) although in some cases they may have been one and the same. Chi-squared tests were used to assess the relationship between ecosystem health outcome direction and four variables: habitat type, intervention type, taxonomic groups studied, and the native/non-native identity of the species studied; where overall relationships were significant, post-hoc analyses were conducted (Ebbert, 2019). To meet the assumptions for chi-squared tests, the dependent variable categories were grouped into two: positive or no effect (the absence of a negative effect), and negative or mixed effect (the presence of at least one negative effect), referred to hereafter as the binary outcome direction. See Supplementary Section S1.3 for details of the independent variable categories, and how assumptions were met for the chi-squared tests. Wilcoxon rank sum tests were used to test the relationship between binary outcome direction at the intervention level and the number of unique metrics, and with the number of broad metric categories used per intervention. We could not statistically test the relationship between broad metric category and outcome direction due to violating assumptions: assessing metric category use at the intervention level would result in too many groups, since one intervention could have several ecosystem health metric categories, and looking at the outcome level was not possible due to non-independence between outcomes of the same interventions. We conducted a robustness assessment on the proportions of interventions with each outcome direction, by sequentially excluding different subsets of the data with weaker evidence: those with poor or absent methods, no comparator, and one, two or three broad ecosystem health metric categories (Supplementary Section S1.4). We chose this approach to quality appraisal rather than excluding studies from the review entirely, so that the effect of such exclusion on the results could be examined. Associations of ecosystem health outcomes with those for climate change adaptation and mitigation were assessed by finding the frequency with which different outcomes co-occurred from the same intervention, discussion of individual cases, and analysis of the types of climate impacts addressed. Note that when percentages are given that do not sum to 100% this is due to there being categories with very few members that we do not report percentages for in the text.
2.3.2 Species richness quantitative assessment
We performed a simple meta-analysis on the effects of interventions on species richness because this is the only metric of ecosystem health that was commonly reported using relatively consistent methods across studies; it is also a useful indicator of ecosystem functioning and broader ecosystem health (Fleishman et al., 2006; Qiu and Cardinale, 2020) and is associated with non-instrumental values of nature (Lindemann-Matthies et al., 2010; Tomitaka et al., 2021). Due to the great variety of interventions, habitats, taxa and study methods included, the size of the mean effect on species richness is not necessarily meaningful or broadly applicable, therefore the aim of the meta-analysis was to determine the average direction of effect rather than the size of this effect. We used the log response ratio (LnR) as the measure of effect size because it is suitable for the varied study designs and taxonomic coverage across our dataset (Spake and Doncaster 2017). LnR was calculated as (Hedges et al., 1999):
where
We took a simplified approach to assessing the average effect of interventions on species richness, due to the heterogeneous nature of our dataset (see Supplementary Section S1.6.3). Our methods consisted of finding the mean LnR, before taking the anti-log to give the geometric mean ratio of species richness in the treatment compared to the control or baseline, and calculating 95% confidence intervals by percentile bootstrapping using the resample R package (Hesterberg, 2015). We report the unweighted results due to the lack of an appropriate weighting method for the small heterogeneous dataset, and exclude outcomes for non-native species from our final analyses due to the relationship between non-native species richness and ecosystem health being unclear. We conducted a sensitivity analysis that showed that our unweighted analysis excluding non-native species produced the most conservative effect size estimate (see Supplementary Section S1.5.2). We could not adjust for publication bias due to many studies not reporting measures of spread (see Supplementary Section S1.6.3) so negative and null results may be under-reported. The relationship between LnR and the length of time for which an intervention had been implemented was tested using a Spearman’s rank test. The relationship between LnR and intervention type was assessed by comparing median values; statistical analysis was not appropriate due to the small number of data points for some intervention types. To see the meta-analysis coding protocol see Supplementary Section S1.5.3. All analyses were conducted in R-4.1.0 (R Core Team, 2021).
3 Results
3.1 What is the geographical distribution and typology of nature-based interventions that have evidence on both climate change adaptation and ecosystem health outcomes? (RQ1)
We identified 79 papers providing evidence on the outcomes of 109 interventions for both climate change adaptation and ecosystem health; 17 of the interventions also reported outcomes for climate change mitigation. The interventions took place across all continents except Antarctica, being relatively evenly spread across Asia and Pacific, Africa, North America and Europe, but with low coverage in West Asia (5%) and Latin America and Caribbean (3%) (Figure 1A). This geographical bias may be explained in part by the focus on studies written in English. Despite this bias, however, due to including post-2018 studies only for low and lower-middle income countries, interventions were relatively evenly distributed across income groups, with 12% of interventions in low-income countries (which comprise 14% of countries globally), 50% middle income (vs. 49%) and 38% high income (vs. 37%). The interventions most commonly involved restoration (28%) or a combination of protection, restoration and/or management (28%); projects that involved at least in part the creation of novel habitats (e.g., planting trees where they were historically absent) made up 18% of interventions (Figure 1B). There was a bias towards terrestrial habitats: 75% of interventions were entirely terrestrial, with the remaining 25% being partially or entirely in coastal, marine or freshwater habitats (Figure 1C). Thirty-four per cent of interventions involved forests, and 18% involved grasslands, whereas only 12% of interventions included coastal or marine habitats and 6% involved freshwater. The studies date back over the last two decades with the earliest published in 2002 and the most recent in 2020 (the year the search was performed), although 81% of studies were published from 2011 onwards.
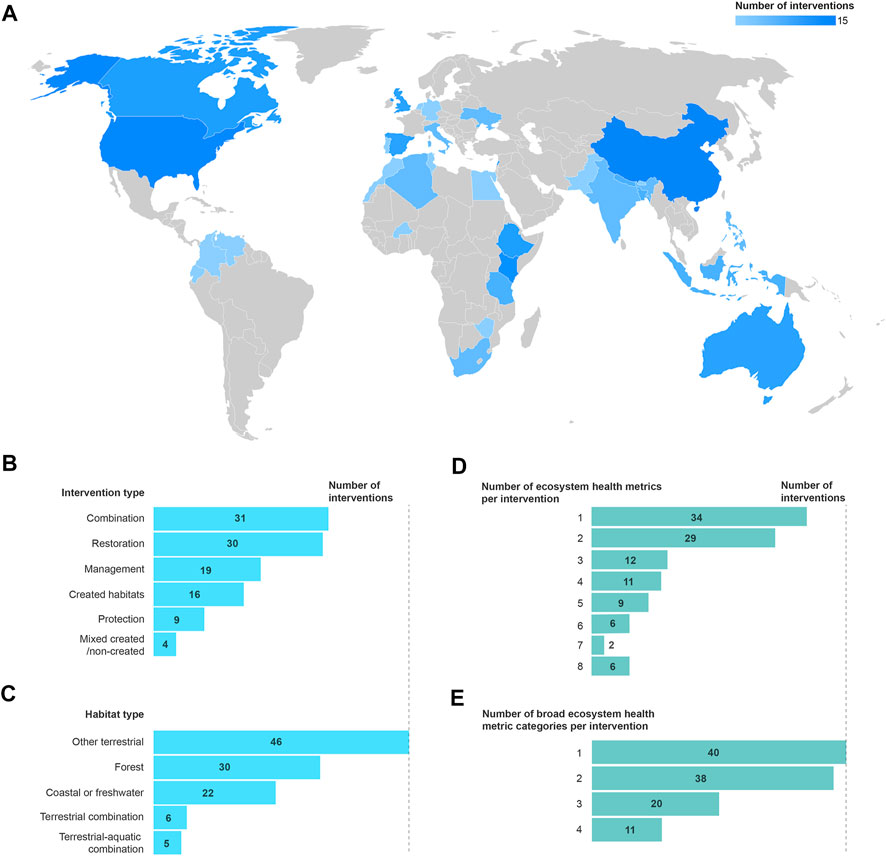
FIGURE 1. Global distribution of nature-based interventions identified in this study (A), number of interventions of each broad type of NbS (B), number of interventions in each habitat type (C), number of unique ecosystem health metrics per intervention (D), and number of unique broad ecosystem health metric categories per intervention (E).
3.2 How are outcomes for ecosystem health measured? (RQ2)
3.2.1 Ecosystem health metrics
Biomass and diversity were the most commonly assessed broad metric categories. The biomass category accounted for 31% of reported outcomes (Figure 2; Supplementary Table S1). A third of these outcomes were measures of plant, animal or microbial biomass; just under a third focused on the density of habitat (i.e., the percentage cover of the habitat in a given area); with the remainder being measures of area of habitat, stem density, canopy cover and litter cover. The next most common broad metric category was diversity; 77% of these were measures at the taxonomic level, with fewer at the functional (17%) and habitat (6%) level, and none at the genetic level. Several aspects of ecosystem functioning and population dynamics were examined, comprising 19% of outcomes, with age structure and functional identity being the most common. Sixteen percent decades with the earliestcent of outcomes involved evaluation of ecosystem composition; 2% were for an unspecified aspect of ecosystem health or biodiversity, usually from local stakeholder observations. The least common metrics were habitat quality, landscape structure (i.e., connectivity and fragmentation) and conservation status. It is noteworthy that two ecosystem health metrics that we defined a priori were not used in any of the studies: phylogenetic diversity and genetic diversity.
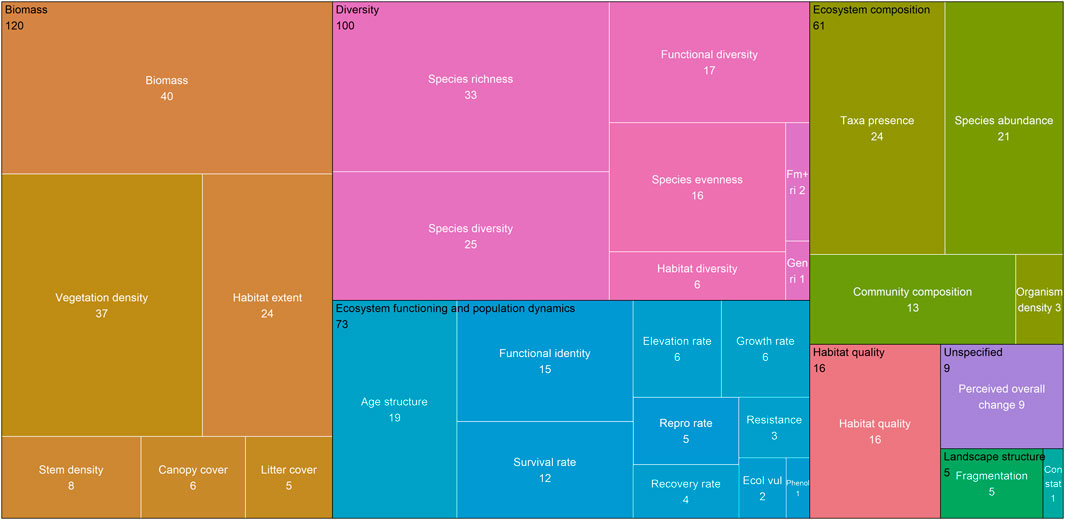
FIGURE 2. Frequency of use of ecosystem health metrics, grouped by broad metric categories. Box areas are proportional to frequency of use of ecosystem health metrics; metric names are in white; broad metric category names are in black; colours correspond to broad metric categories. 385 outcomes are represented here, across 109 interventions. Gen ri = generic richness; Fm + ri = family and above richness; Repro rate = reproductive rate; Ecol vul = ecological vulnerability; Phenol = phenology; Con stat = conservation status. Two metrics that were defined a priori were not used at all by the studies: genetic diversity and phylogenetic diversity. For the number of interventions in each group, see Supplementary Table S1.
Thirty-one per cent of interventions reported ecosystem health outcomes with only a single ecosystem health metric, and 28% reported only two ecosystem health metrics (Figure 1D). Looking at the broad metric category level, 36% of interventions only had metrics from a single category, 35% covered two categories, and only one intervention covered five categories (out of the total of eight) (Figure 1E). The most common broad category to be reported alone was ecosystem functioning and population dynamics (46%) followed by biomass (21%), and the most common categories to be reported together were biomass and diversity (26% of those with two categories; for more details see Supplementary Section S4.1).
3.2.2 Taxonomic coverage and identification of native species
Ecosystem health assessments were strongly skewed towards plants and ecosystem components located aboveground at both the outcome and intervention levels. For example, we found that 67% of outcomes assessed only plants, 9% assessed plants alongside at least one other ecosystem component, 15% assessed animals, and 4% assessed fungi or microorganisms. Looking at the intervention level, 50% of interventions only had evidence for effects on plants, whilst 10% only looked at the effects on animals; 5% included effects on fungi or microorganisms.
Fourteen per cent of the outcomes that included plants assessed only tree species, 28% were for trees alongside grasses and/or other plants, and 16% were for grasses alongside other plants. For animals there was a bias towards invertebrates (56% compared to 30% fish, 22% birds and 16% mammals). Across all these outcomes, 76% assessed only aboveground biotic components, 15% aquatic and 5% soil. Five per cent of outcomes incorporated an abiotic component of the ecosystem, such as litter cover, surface accretion, soil carbon, waterbody structure and water quality.
For most outcomes (57%), it was unclear whether the species assessed were native or non-native. Only 15% of outcomes for which it was relevant to consider native/non-native species assessed native species (Supplementary Section S4.2); 24% assessed a mixture of native and non-native species; and 2% looked at non-native species alone. Three per cent assessed the status of species moved outside their natural range within their country of origin, and one outcome was for the status of a native species that had become over-dominant.
3.3 Ecosystem health outcomes
3.3.1 Do nature-based interventions for adaptation support ecosystem health? (RQ3)
3.3.1.1 Overall effects
Most interventions (72%) were reported to have positive ecosystem health outcomes overall, i.e., for the ecosystem health metrics used for these interventions only positive effects, or a combination of positive and no effect, were reported (noting the caveats discussed in Section 2.2, i.e., the actual health will depend on the full range of outcomes, not just those reported by the studies, and their relative significance). Twelve per cent of interventions reported a mixture of positive and negative outcomes for ecosystem health, 4% were entirely negative, 9% unclear and 3% reported no effect. Examples of ecosystem health outcomes from a sample of interventions with positive overall outcomes are shown in Table 3; examples of negative outcomes are in Table 4. Our robustness assessment revealed that the proportion of interventions with positive outcomes decreased with the application of increasingly stringent evidence quality criteria (Supplementary Table S2). When looking at only the most robust studies (those with strong methods, a comparator, and more than two broad metric categories) 51% of outcomes were positive and 30% mixed across 27 interventions.
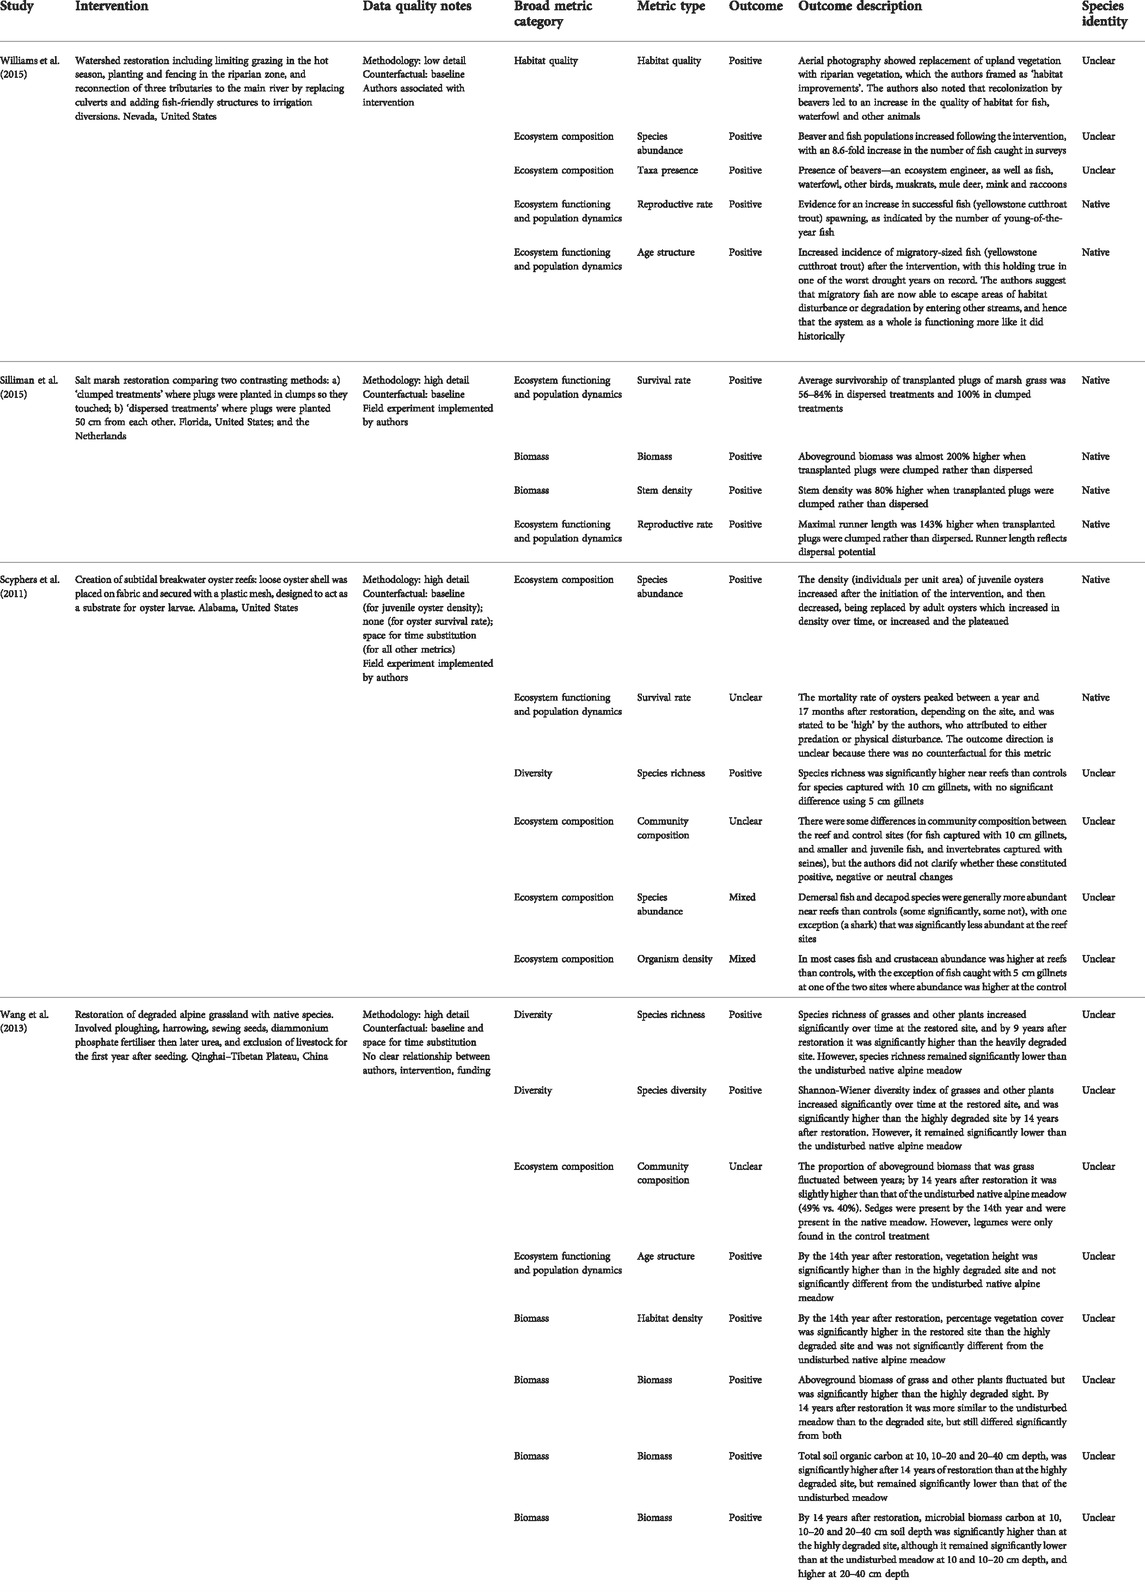
TABLE 3. Examples of ecosystem health outcomes of interventions which were selected to cover a range of habitat and intervention types, each with ecosystem health outcomes across multiple broad metric categories, with either native or unclear species identity.
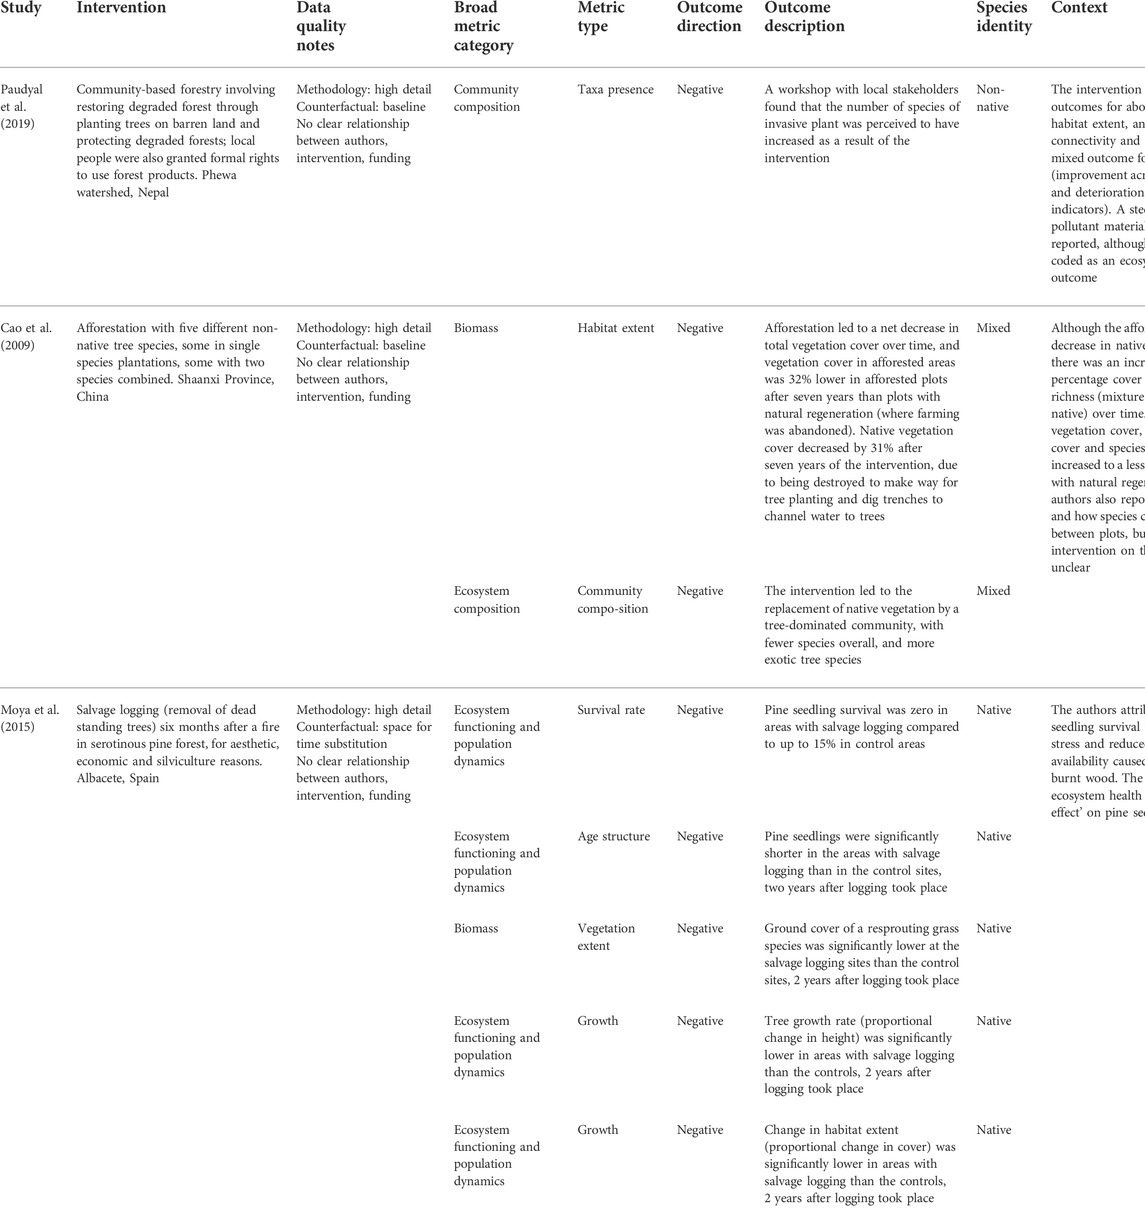
TABLE 4. Examples of negative outcomes from interventions, and the context in which these negative outcomes were found including other outcomes from the intervention and authors’ comments on the reason for negative outcomes.
3.3.1.2 Effects on species richness
We identified 34 interventions (across 24 papers) that reported effects on species richness; 25 of these (across 19 papers) had sufficient data for inclusion in the simple meta-analysis. The interventions in this subset were primarily in terrestrial habitats most commonly involving restoration or a combination of approaches; the majority (90%) of species richness measures were for plants (Supplementary Table S3). The mean change in species richness was a 1.67-fold increase between the treatment and control or baseline (95% confidence interval: 1.05–2.65) (Figure 3). This is a conservative estimate which is not weighted, and excludes non-native species and effect sizes with zero values for the control/baseline. Our sensitivity analysis showed that weighting by study design and sample size, adjusting for zero values, and excluding response ratios for non-native species, did not change the direction of the mean effect size (Supplementary Section S1.5.2).
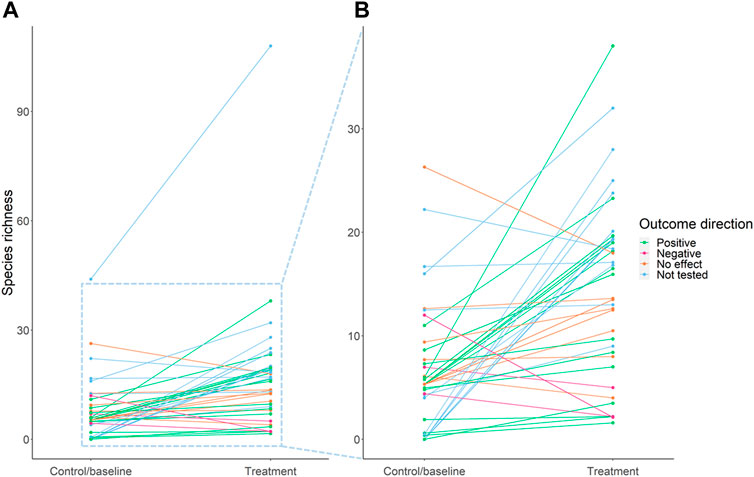
FIGURE 3. Change in species richness between control/baseline and treatment for 40 species richness outcomes, across 24 interventions. A larger scale view of the majority of the data from (A) is provided in (B) for clarity. Green lines represent statistically significant positive changes, pink lines are significant negative changes, orange lines are non-significant changes, and blue lines are changes which were not statistically tested. The change in species richness from Biel et al. (2017) is not included in the figure because the number of species was not given, only percentage changes in species richness.
Log response ratio was not significantly related to the time for which the intervention had been in place (Rho = −0.12, p = 0.51). The median LnR was highest for interventions involving at least some creation of novel habitat (median LnR = 2.74, n = 9), followed by restoration interventions (median LnR = 1.22, n = 18) and those involving a combination of restoration, protection and/or management (median LnR = 0.71, n = 10). Only one intervention involved solely protection (LnR = 0.08), and management interventions had a median negative effect size (median = −0.36, n = 4). Interventions which had low diversity (degraded) pre-intervention states resulted in larger species richness effect sizes; the six greatest effect sizes all reported none or very few species present in the control or baseline state. The greatest reported proportional increase was a 56-fold increase (from a mean of 0.5–28) in freshwater benthic macroinvertebrate species richness from the rehabilitation of a creek in China through installation of check dams, guiding dikes and reforestation with non-native species (Yu et al., 2012). The next five highest response ratios were for different types of erosion barriers designed to restore degraded rangeland in Kenya, which each led to an increase in plant species richness from zero to 19–25 (Kimiti et al., 2017). There were eight negative effects on species richness reported (across six interventions).
3.3.2 Do outcomes vary with the method used to measure ecosystem health? (RQ4)
For broad metric categories where at least ten outcomes were recorded across interventions (a threshold set to avoid drawing false conclusions from small sample sizes), the category with the highest proportion of positive outcomes was habitat quality, followed by biomass, then diversity (Figure 4). The highest proportions of negative or mixed outcomes were jointly from diversity and ecosystem functioning/population dynamics outcomes, followed by habitat quality and ecosystem composition. Measures of diversity had by far the highest proportion of outcomes with no effect; this included four interventions where there was a positive effect on a biomass metric but no change for the diversity metric.
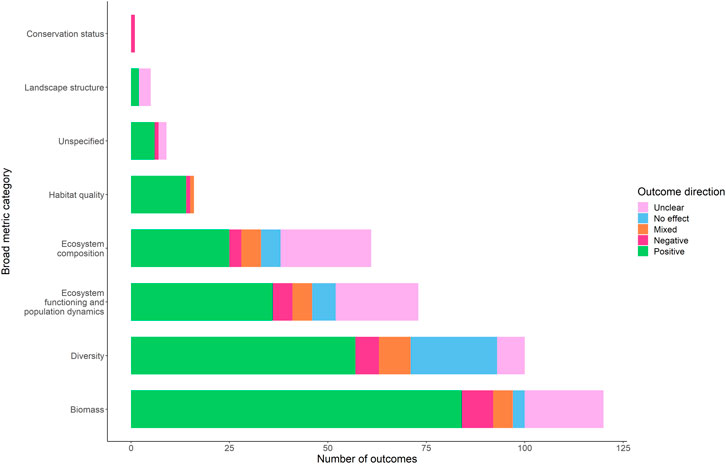
FIGURE 4. Outcomes nature-based interventions, across each of the eight broad categories of ecosystem health metrics. Outcome direction is colour coded.
Overall ecosystem health assessments using a greater number of broad metric categories were significantly more likely to be negative or mixed, than positive or no effect (W = 964, p = 0.01; Supplementary Figure S1A). This trend weakened when looking at the number of unique metrics rather than broad categories per intervention (W = 888.5, p = 0.07; Supplementary Figure S1B). Binary outcome direction at the intervention level also varied significantly with the taxonomic group studied (χ2 = 11.9, p = 0.018). Interventions reporting outcomes for both plants and animals had significantly more negative or mixed effects (residual = −3.37, p = 0.007) than those that reported on only plants, only animals, or a combination of plants, animals and other living or non-living components of the ecosystem.
3.3.3 Do outcomes vary with the type of the nature-based intervention? (RQ5)
Binary outcome direction (the presence/absence of at least one negative outcome) did not vary significantly with habitat type (χ2 = 0.92, p = 0.82), broad intervention type (χ2 = 1.71, p = 0.79), or the native or non-native/invasive composition of the species studied (χ2 = 4.41, p = 0.11). However, closer inspection of the data revealed some trends (Figure 5). The highest proportions of positive outcomes were reported for interventions that were a combination of created and non-created ecosystems (although the sample size was small), followed by interventions that were a combination of protection, restoration and/or management. Negative outcomes at the intervention level were restricted to created habitats and management interventions (Figure 5A), and the highest proportion of mixed or negative outcomes was for created habitats. In terms of habitat type, negative outcomes at the intervention level were restricted to forests, and the highest proportion of mixed or negative outcomes was also for forests (Figure 5B). With respect to taxonomic group, negative outcomes were restricted to interventions that had assessments of the effects on just plants, or on animals, plants and other (Figure 5C). The highest proportion of intervention level outcomes that were negative or mixed, however, was for assessments of both animals and plants. Finally, although the native or non-native identity of species was only clearly reported for 15% of relevant outcomes, the greatest proportion of negative or mixed outcomes was for interventions reporting on at least some non-native/invasive species (Figure 5D).
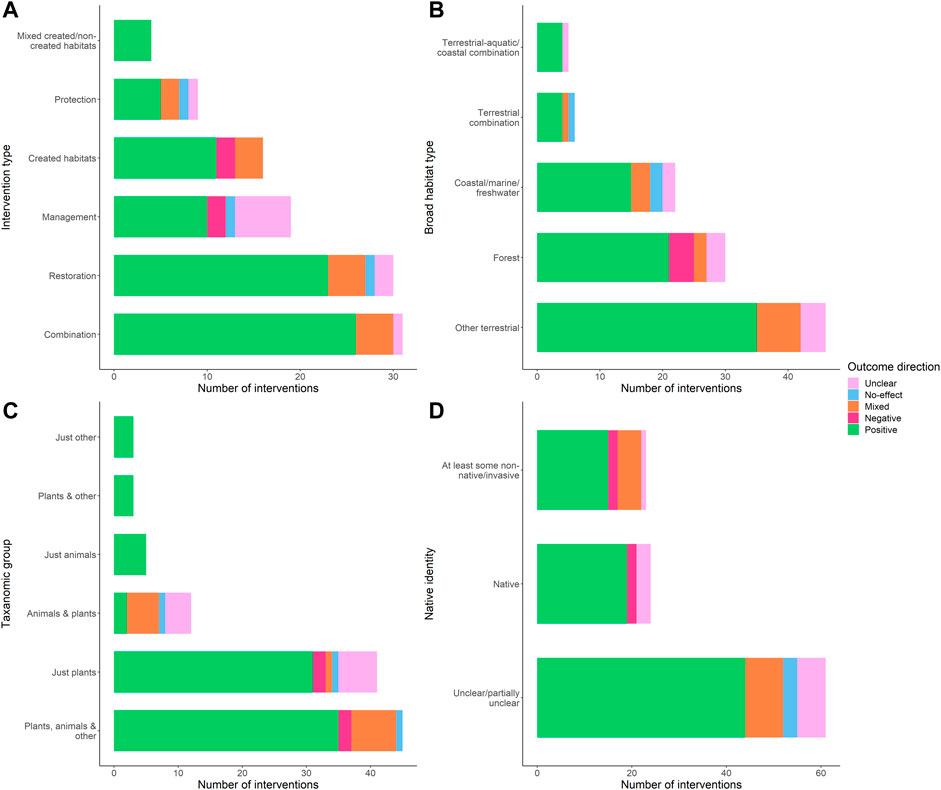
FIGURE 5. Ecosystem health outcomes of interventions split by intervention type (A), habitat type (B), taxonomic group (C), and native identity (D). Native identity refers to whether the species studied in an ecosystem health outcome were all native, included at least some non-native or invasive species, or whether this was unclear.
Overall, 16% of the 224 positive ecosystem health outcomes included at least some non-native or invasive species. For interventions involving creation of novel habitats this was higher at 25% (out of 59), compared to 13% (out of 165) for interventions not involving created habitats. Positive outcomes were more common, however, when native species were assessed: of the 55 outcomes that included only native species, 73% were positive and 11% were negative/mixed, compared to 51% positive and 14% negative/mixed across the remaining 277 ecosystem health outcomes for which species native/non-native identity is relevant, and 25% positive and 25% negative/mixed across the eight outcomes for which species were non-native/invasive.
3.4 Can nature-based interventions support both ecosystem health and address climate change, and how does that vary with ecological context? (RQ6)
3.4.1 Climate change adaptation
Of the 79 interventions for which positive ecosystem health outcomes were reported, 59 (75%) also reported positive outcomes for climate change adaptation, across 19 different climate impacts (Figure 6). Meanwhile, 88% of interventions for which positive adaptation outcomes were reported also reported positive outcomes for ecosystem health. Overall, we found that 54% of interventions were reported to have positive outcomes for both ecosystem health and adaptation. For example, the diversity of endemic flowering plants doubled following natural regeneration of degraded pasture in Algeria, when overgrazing stopped (Benaradj et al., 2011).
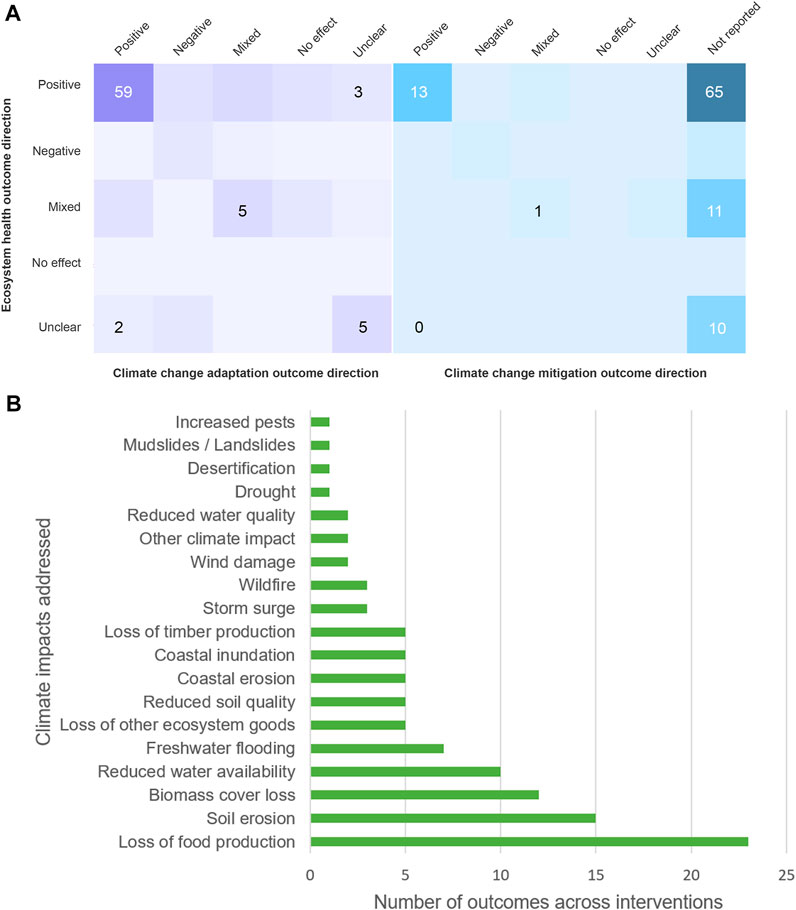
FIGURE 6. Associations between ecosystem health and climate change adaptation and mitigation outcomes across interventions (A); climate impacts addressed by interventions with positive outcomes for both ecosystem health and climate change adaptation (108 climate change adaptation outcomes across 79 interventions) (B).
However, potential trade-offs were also present, with six (8%) of the interventions with positive ecosystem health outcomes overall having mixed adaptation outcomes, and four (5%) having negative outcomes. There were 11 interventions with at least one positive ecosystem health outcome (so with a positive or mixed intervention-level outcome) that were coupled with negative adaptation outcomes, and five of these were for water availability. Three of the four interventions with negative ecosystem health outcomes overall also had negative adaptation outcomes. Of these three, there were six negative climate impact outcomes overall with two being for timber production and two being for water availability. For example, plantations of non-native tree species in China established to protect towns from dust storms resulted in loss of native shrubland and over-abstraction of water for irrigation, leading to the loss of 8,000 ha of native forest downstream (Missall et al., 2018). Supplementary Table S4 provides further specific examples of associations between ecosystem health and adaptation outcomes; Supplementary Table S5 gives more details on the types and directions of adaptation outcomes for interventions in this study.
Interventions that enhanced ecosystem functioning and population dynamics reported the highest proportion of positive adaptation outcomes (96% of 25) (Supplementary Figure S2). Meanwhile, interventions that increased diversity reported the lowest proportion of positive (53% of 30), and the highest proportion of negative or mixed adaptation outcomes (33% of 30). Interventions with positive outcomes for biomass reported a similarly high proportion of outcomes with negative or mixed adaptation outcomes (21% of 52).
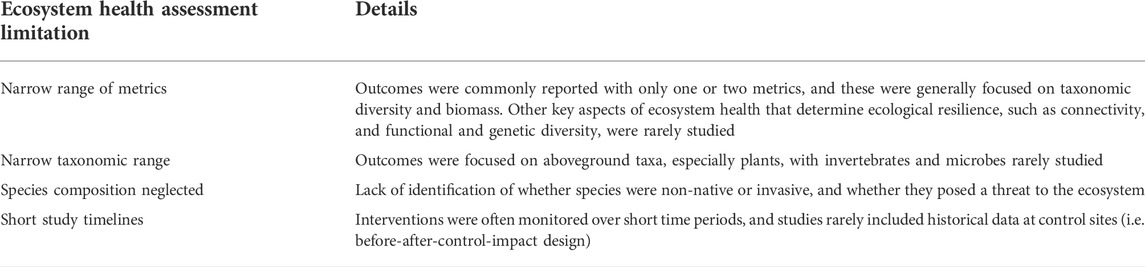
TABLE 5. Summary of limitations to ecosystem health assessments in this review.
3.4.2 Three-way associations between ecosystem health, climate change adaptation and mitigation
Seventeen (16%) of the interventions in this review reported outcomes for climate change mitigation as well as adaptation. We found that 13 of these interventions had positive ecosystem health outcomes alongside positive reported mitigation outcomes and one had positive ecosystem health and mixed mitigation (Figure 6A). Of the three remaining interventions with negative or mixed ecosystem health outcomes, one of these reported negative mitigation outcomes, one reported mixed and the last was unclear.
Looking at the potential for a triple-win, ten (59%) of these 17 interventions that had reported outcomes for all three of ecosystem health, climate change adaptation and mitigation had positive outcomes for all three; two had positive ecosystem health and mitigation outcomes but negative adaptation outcomes; and the remaining five had different combinations of positive, negative, mixed and unclear outcomes (Supplementary Table S6). All of the eight interventions that reported both mitigation and adaptation benefits also had reported positive outcomes for ecosystem health.
4 Discussion
We conducted the first global, systematic review of the ecosystem health outcomes of nature-based interventions that address the adverse impacts of climate change on people. Our main finding is that, overall, such interventions were reported to deliver positive outcomes for ecosystem health, including through increased species richness, and that most of these interventions also brought climate change adaptation and/or mitigation benefits. However, this broad finding comes with important caveats, in particular, results vary in relation to the aspects of ecosystem health under study and the types of intervention involved. Here, we discuss the main findings of the review and the strength of the evidence available, before identifying ways in which ecosystem health outcomes can be better assessed, and opportunities for policies to support NbS that can help address both the biodiversity and climate crises. For a summary of the limitations of this review see Supplementary Section S1.6.
4.1 Synopsis of synergies and trade-offs between outcomes for climate change adaptation and ecosystem health
Most (72%) of the 109 interventions in this review were reported to have improved ecosystem health, though this fell to 51% when we excluded all but the most robust scientific studies. Positive outcomes were reported across all broad types of nature-based intervention and habitat, and most commonly involved an increase in some aspect of biomass, diversity or ecosystem functioning and population dynamics. On average, interventions were associated with a large (67%) increase in plant or animal species richness. There was evidence that nature-based interventions can enhance multiple aspects of ecosystem health, although few studies assessed several different aspects simultaneously.
Similarly, most (75%) interventions with positive ecosystem health outcomes were also reported to have positive outcomes for climate change adaptation, most often by increasing food availability or reducing soil erosion, while studies that reported negative outcomes for ecosystem health also reported negative outcomes for adaptation. We did not investigate the extent to which these outcomes were causally linked. However, these findings align with scientific understanding that healthy ecosystems are necessary for the flow of ecosystem services to be sustained (Cardinale et al., 2012). Interventions that enhanced aspects of ecosystem functioning and population dynamics were most commonly associated with positive climate change adaptation outcomes, which is in line with the principle that ecosystem functioning supports the provision of ecosystem services (Sekercioglu 2010). However, we also found examples of negative and mixed outcomes for ecosystem health, especially for interventions involving management of forests, such as a decrease in plant species richness after prescribed burning to limit fire risk (Fuentes et al., 2018) and creation of novel forest ecosystems, such loss of biodiversity after conversion of Paramo grassland to pine plantations (Balthazar et al., 2015). Similarly, trade-offs between ecosystem health and climate change adaptation outcomes often involved non-native tree plantations leading to decreases in water availability (reviewed in Chausson et al., 2020). However, trade-offs were found for other intervention types as well. For example, community-based forestry in Nepal had positive outcomes in terms of mitigation and adaptation (increased carbon stocks, water quality and availability, and reduced erosion and landslide risk) and most aspects of ecosystem health (biomass, habitat extent, habitat connectivity and intactness); but the authors also reported an increase in the number of invasive plant species (Paudyal et al., 2019). These examples highlight that interventions must be carefully designed to deliver synergies and reduce or avoid trade-offs, and that multiple aspects of ecosystem health should be considered, as increases in some indicators can mask negative effects in others.
4.2 Strength of the evidence
Our dataset of studies encompassed a wide variety of habitats and intervention types, and differed widely in the methodologies used, and in metrics and taxa studied. Here we discuss the implications of these differences for the overall findings of the review, and identify ways in which the study of ecosystem health outcomes of NbS may be improved.
4.2.1 Metrics of ecosystem health
Most of the studies in this review only included one or two components of ecosystem health, with 36% of interventions having metrics from a single broad metric category (e.g., biomass, diversity, ecosystem composition) and 35% covering just two. No study assessed more than five out of the eight broad categories. This means that some of the interventions that were reported to have entirely positive outcomes for ecosystem health may actually have had mixed outcomes overall, but the negative effects were missed due to the failure to assess a representative suite of aspects of ecosystem health. This is illustrated by our finding that ecosystem health assessments using a greater number of broad metric categories were significantly more likely to have an overall assessment of negative or mixed. In addition, excluding interventions with fewer broad metric categories led to a higher proportion of ecosystem health outcomes being mixed. Moreover, some broad metric categories, such as biomass and habitat quality, were more likely to be positive, so focusing only on those categories could give a misleading picture of ecosystem health. For a summary of the limitations to ecosystem health assessments in this review, see Table 5.
Within the broad ecosystem health categories used across studies, certain elements of ecosystem health gained more attention. Measures of diversity were primarily focused on taxonomic diversity, with fewer considering diversity of species functional traits or habitat diversity metrics, and no genetic diversity metrics. This supports previous findings such as by Naeem et al. (2016) who found that 70%–80% of studies in their review of biodiversity assessments looked at only one type of diversity (from taxonomic, functional, phylogenetic or other diversity), with under 10% using three or more dimensions. We found a general underrepresentation of ecosystem function metrics, which may be due to these types of data being in some cases more difficult to collect (e.g., trait diversity), or requiring repeat measurements over time (e.g., primary productivity). No genetic metrics were used, and landscape scale metrics rarely were used, including metrics of function (e.g., nutrient cycling), structure (e.g., connectivity) and composition (e.g., proportions of different habitats). Direct measures of resistance to and recovery time from stress were also rarely considered (although we note that many of the other metrics listed here could be important indirect measures or proxies of resilience, see Turner et al. 2022). We encourage practitioners and scientists to consider including such underrepresented metrics in their assessments, in line with their relevance to the intervention, habitat and aims.
The most common metric category was biomass (33% of outcomes). While biomass can be a informative indicator of ecosystem health (e.g., Poorter et al., 2021), when it is used as the only indicator of ecosystem health it could be misleading because it does not distinguish between different species functions or genotypes. For example, an increase in biomass could arise from planting a single species of non-native tree that replaced the native vegetation on biodiverse open habitats such as grasslands and shrubland, which would generally be expected to have a detrimental impact on overall ecosystem health and biodiversity conservation (Bremer et al., 2010; Balthazar et al., 2015; Bond 2016). Moreover, our study found that biomass is not necessarily associated with an increase in other ecosystem health metrics. For example, 15 of the 51 interventions with a positive effect on biomass reported negative, mixed or no effect on other ecosystem health indicators, and four of the 22 interventions with no effect on diversity reported a positive effect on biomass. We therefore recommend that measures of biomass are used in combination with other metrics.
Species richness is also a widely used indicator for ecosystem health in our review. Experimental and observational studies in a range of contexts have shown positive effects of species richness on the productivity and stability of ecosystems in variable environmental conditions (Gamfeldt et al., 2013; Isbell et al., 2015; Liang et al., 2016). However, species richness only provides a minimum estimate of diversity, since it is not necessarily linearly correlated with functional, taxonomic or structural diversity (Lyashevska and Farnsworth 2012). Moreover, an increase in species richness is not always desirable, for example because some ecosystems are naturally less diverse than others, and because non-native or invasive species can increase species richness. Changes in species composition may in some cases be a better indicator of ecosystem health than species richness. For example, in Fuentes et al. (2018) prescribed burning of Mediterranean shrub led to short-term decreases in plant species richness, but also changed the functional composition of the community, increasing the ratio of resprouter to seeder shrubs. This in turn can increase the recovery rate after fires and may therefore increase ecosystem health in the long term. Therefore, context is crucial for understanding the relevance of species richness to the long-term health of an ecosystem.
4.2.2 Taxonomic coverage and recognition of native species
In addition to the choice of which metrics to use, evidence strength is also affected by the way in which the metrics are applied, including which and how many types of taxa were studied and whether native species were distinguished from non-native species. There was a skew towards assessing ecosystem health outcomes for plants. This may be because plants can be easier to measure (compared to time-consuming surveys of mobile or microscopic fauna), and/or because of interest in the role of vegetation in delivering ecosystem services that reduce climate impacts, such as flood and erosion protection. This contrasts with global conservation monitoring programmes, which are biased towards birds (Moussy et al., 2021). We found that when both plants and animals were monitored, negative and mixed ecosystem health outcomes were more likely to be found. This could be explained by the fact that population trends in one taxonomic group are often not indicative of similar trends across other taxonomic groups (Prendergast et al., 1993; Carignan and Villard 2002); so positive outcomes for plants, for example, do not imply that there are necessarily increases in animal species (Cristescu et al., 2013; Marshall et al., 2020, 2021). For example, metrics may indicate a high quality plant community but the successful establishment of associated faunal communities depends on other factors such as the ability of fauna to disperse into the area from elsewhere (Gilbert-Norton et al., 2010; Baur 2014). Also, some vegetation management techniques that benefit certain plant communities (such as thinning, mowing, burning or spraying) may have adverse impacts on fauna (Humbert et al., 2009; Prowse et al., 2017; Bennion et al., 2020). There was also a strong bias towards taxa that reside aboveground, rather than soil or aquatic habitats. All these ecosystem components interact to allow ecosystems to function, produce ecosystem services, and respond and adapt to change. For example, soil quality and microbial communities within the soil affect which plant species can thrive, which will affect which animals can survive, which will in turn affect the delivery of ecosystem services such as pollination (Ebeling et al., 2008; Cardoza et al., 2012; David et al., 2019). Therefore, studying soil, water and terrestrial habitats in combination may allow identification of limiting factors on overall ecosystem health and ecosystem service provision.
In the majority of cases, it was unclear whether the species studied were native or non-native. This is in line with Ruaro et al.’s (2020) finding that 66% of studies of multi-metric indices of ecosystem integrity either did not test or did not state whether they tested metrics on native or non-native species. This limits our understanding of the potential links between changes in metric values and the overall health of the ecosystem for a number of reasons. If for example, non-native species are being promoted, they can become invasive and pose a great threat to native species and the functioning of ecosystems (Paolucci et al., 2013; USEPA 2016). On the other hand, the presence of non-native species is not necessarily bad. It is now widely recognised that in some cases, for ecosystems to adapt to new conditions brought on by climate change, novel species combinations will need to be embraced, including assisted migration, where species are actively moved to regions outside their current range (Graham et al., 2014; Lavorel et al., 2015; Peterson St-Laurent et al., 2021). However, any conscious introduction or promotion of non-native species will have to be done through careful considerations of the positive and negative effects it may have on the ecosystem as a whole. Moreover, some of the positive ecosystem health outcomes reported by studies in this review were partially or entirely for non-native species. Although authors framed these outcomes as positive, in some cases this may not reflect the true impact on ecosystem health, such as when reporting an increase in forest cover or biomass due to afforestation with monocultures of non-native species. Consequently, identifying firstly whether non-native species are present, and secondly whether they may pose a health-threat to the ecosystem or can help ecosystems adapt to change, should be a priority in ecosystem health assessments of NbS.
4.2.3 Study timelines, baselines and controls
Positive or negative effects of an intervention on ecosystem health may take time to accrue. Despite this, we found no significant relationship between the time for which an intervention had been in place and the size of the effect on species richness (the only metric for which there was enough data to test this relationship). This might be due to the highly heterogeneous but small dataset, meaning the changes in species richness may have been more affected by the taxa, habitat and intervention studied. However, some short-term studies faced time constraints when trying to understand or predict longer-term intervention effects on biodiversity. For example, Biel et al. (2017) found large decreases in native plant species diversity 2 years after clearing and burning of invasive beach grass, but they speculated that more time was needed for seed dispersal and recovery of endemic plant species composition. Similarly Fuentes et al. (2018) found a decrease in plant species richness (from 34 to 25 species) 10 months after prescribed burning in a pine forest, but they hypothesized that there would be a longer-term benefit by reducing fire risk and increasing ecosystem resilience. Hence, monitoring the outcomes of projects over the long term is of great value for ecological understanding (Lindenmayer et al., 2012; Giron-Nava et al., 2017).
When comparing the size of ecosystem health benefits between interventions, it is crucial to consider the baseline before the intervention was initiated. Interventions involving restoration of degraded habitat or creation of novel habitat will likely start with lower baseline values for all aspects of ecosystem health than protection or management of existing ecosystems, meaning they may result in greater increases in outcome metrics (Bremer et al., 2010). In line with this, we found greater increases in species richness for restoration and creation interventions. However, this does not mean that restoration and creation interventions are more valuable for ecosystem health than other approaches, since the level of diversity of a protected or well-managed ecosystem may still be greater than that of a restored or created ecosystem (e.g., primary forests generally have higher biodiversity than secondary (restored) forests; Poorter et al., 2021) and actions to protect intact ecosystems are therefore essential for avoiding the loss of biodiversity and ecosystem services such as carbon storage (e.g., Watson et al., 2018). Indeed, our review found more evidence for mixed and negative ecosystem health effects from created habitats than other types of interventions. For example, Cao et al. (2009) found that an afforestation programme led to a net decrease in total vegetation cover, and replacement of native vegetation with a less species rich community including non-native tree species. Taken together, this indicates that particular caution should be taken when interpreting reported positive ecosystem health outcomes from created habitat interventions such as plantations.
4.3 Implications for research, practice and policy
Here we discuss how ecosystem health assessments of NbS may be improved and how researchers can support this. We then make policy recommendations to enable the upscaling of high quality NbS with measurable benefits for both biodiversity and climate.
4.3.1 Assessing ecosystem health outcomes
Our review has shown that assessments of ecosystem health outcomes of NbS could benefit from using a broader suite of metrics. This is especially important in revealing negative outcomes that may otherwise go unnoticed. There is a substantial body of research into indicators of the health, biodiversity or resilience of different ecosystems. For example, Teixeira et al. (2016) provide a catalogue of 600 marine biodiversity indicators. However, measuring multiple indicators can be time-consuming and expensive, so it is important to select those that are the most relevant for the type of intervention and habitat, the resources and budget available, and the specific goals of the NbS.
Many studies use Noss’ hierarchy of biodiversity (Noss 1990), which identifies indicators within a matrix of three axes of biodiversity (composition, structure and function) at four different spatial scales (genetic, species, community/ecosystem and landscape). Building on this, Knight et al. (2020) developed a Biodiversity Metrics Framework that records how many metrics are measured from each of the twelve Noss categories (three axes at four levels). Similarly, Lyashevska and Farnsworth (2012) found that carefully choosing one indicator from each of three key axes of biodiversity—structural, taxonomic and functional diversity—is sufficient to approximate biodiversity. Using three contrasting metrics in this way, when possible, serves as a useful rule of thumb for a minimum level of data collection when designing ecosystem health assessments. Some studies suggest particular indicators that reflect overall ecosystem health. For example Poorter et al. (2021) recommend using structural heterogeneity as a proxy for forest natural regeneration success within the first 25 years, and maximum tree diameter and species richness in the next 25 years, correlating well with the recovery of several other aspects of ecosystem health. It is also important to ensure coverage of a range of taxa.
The level of technical expertise needed to measure the different aspects of ecosystem health can be a constraint. NbS should be community-led, and there is therefore a need for indicators that can be monitored and assessed by communities with minimal technical capacity, including where community members can be readily trained in collecting the required data. For example Cosović et al. (2020) found that structural biodiversity indicators such as canopy openness and stand age were the most useful in management plans for European forests as these were easier for non-professionals to observe than compositional and functional indicators. The data generated should also be useable by and useful to local communities and policymakers. Engaging with stakeholders helps to identify the most important metrics to study. For example, fishers and non-fishers may have highly contrasting priorities for biodiversity targets when setting up a marine protected area, with protecting charismatic species being a top priority for non-fishers (Cárcamo et al., 2014; Brown et al., 2016). Local and indigenous knowledge should also be included in selecting suitable metrics because such place-based knowledge is essential for identifying which aspects of the ecosystem are most important for understanding its overall health (Sterling et al., 2017). Whilst citizen science is well developed for biodiversity monitoring (e.g., Mammal Mapper, Big Garden Birdwatch, and iNaturalist, and see a database of projects on zooniverse.org), similar initiatives could be used to monitor the ecosystem health outcomes of NbS and enable subsequent knowledge sharing.
Finally, to reduce the number of metrics needed, assessors can consider which are most relevant for each particular habitat or context. For example, intraspecific genetic diversity may be particularly relevant when studying an ecosystem with naturally low species diversity, such as temperate seagrass meadows which are commonly composed of just one plant species (Ehlers et al., 2008).
Standardisation of ecosystem health assessments across comparable interventions creates opportunities for comparing outcomes and improving intervention methods. While there are many substantial ecological assessment projects with standardised methods across globally-distributed sites (e.g., Smithsonian ForestGEO Network forestgeo.si.edu; Zostera Experimental Network zenscience.org; Atlantic and Gulf Rapid Reef Assessment agrra.org), this approach has not yet become commonplace for NbS. Standardisation should also include best practice in data collection. For example, we emphasise the importance of clarifying whether any non-native species are present (Rilov and Crooks, 2009) and, if so, investigating and recording whether or not their presence is a threat to the health of the ecosystem.
There is parallel need for further systematic investigation into the ecosystem health outcomes of NbS through rigorous scientific approaches such as Randomised Control Trials (as was done for Payment for Ecosystem Services (PES) in Latin America; Pynegar et al., 2018) and Before After Control Impact experiments, or applying Qualitative Comparative Analysis to existing NbS. The literature on nature-based solutions is expanding rapidly, and it would be useful to build on this review in future to cover a broader evidence base (Supplementary Section S1.6.1). Such research is key if we are to better understand the contexts (e.g., intervention methods, timeframes, spatial scales) which produce win-wins for biodiversity and climate goals in the long term.
There is a clear opportunity for creation of consistent guidance on how to monitor the ecosystem health outcomes of NbS. This could comprise a set of criteria to be considered when designing an ecosystem health assessment strategy, including (but not limited to): metric choice, study taxa choice, data collection methods, study design, data analysis methods and data sharing standards, as well as how these decisions should be made—namely through a locally-driven, bottom-up approach. This should be used alongside guidance or standards specific to particular ecosystems and types of intervention, which could also be gathered together in a central database. We recognize however that many indigenous and local communities already have rigorous methods for ecological monitoring based on their own knowledge systems (e.g., Thompson et al., 2019). These should continue to be prioritised and considered equally valid in assessing ecosystem health as any external methodology.
4.3.2 Research on cost-effective monitoring technologies for enhanced ecosystem health assessments
Researchers can support the creation of monitoring approaches that are appropriate for the people who will be conducting the monitoring. This can involve technological advances that make data gathering more efficient. For example, remote sensing using satellite, drone and LiDAR imagery can provide granular, non-invasive assessments of metrics such as vegetation type and structure, aboveground biomass and primary productivity (Reddy et al., 2021). Similarly, passive acoustic monitoring permits large temporal and spatial scopes for sampling certain taxonomic groups (Sugai et al., 2019), and environmental DNA (eDNA) can enable more species to be identified with reduced effort, can sample aquatic, belowground, and aboveground taxonomic richness (Ruppert et al., 2019), and can be used to explore genetic diversity (e.g., Iso-Touro et al., 2021). It could also include identifying improved indicators of ecosystem health, and finding ways to make data collection more accessible to people with limited equipment and no specialist knowledge, such as through smartphone apps. In all cases, tools for monitoring ecosystem health outcomes of NbS should be developed in partnership with people involved in NbS, including planners, evaluators and local communities, so they can be tailored to stakeholder needs. This might involve targeting research on relevant metrics or species, ensuring costs are appropriate, and equipment and software is user-friendly, in turn allowing them to become more powerful tools for evaluating NbS ecosystem health outcomes.
4.3.3 Policy
We have shown that NbS hold great potential as a means to deliver biodiversity conservation while tackling climate challenges, but for this potential to be fully realised reforms are required across local, subnational, national and international policy. Firstly, policies are needed to ensure that ecosystem health is prioritised in NbS design and implementation. For example, although 66% of signatories to the Paris Agreement included NbS in the adaptation and/or mitigation components of their first Nationally Determined Contributions (NDCs), most of these emphasised forest interventions, often in the context of afforestation rather than protection and restoration of a diverse range of native ecosystems (Seddon et al., 2020b). Preliminary analyses of the second iteration of NDCs indicate that while NbS are more commonly mentioned, the focus is still on forests and targets are primarily area-based (Bakhtary et al., 2021; see also www.nbspolicyplatform.org). Therefore, much more work is needed to ensure national climate ambition is enhanced with robust, sustainable NbS. Strong biodiversity targets and safeguards should be included in these policy documents and a wide range of ecosystem health metrics should be monitored during the implementation of such commitments, rather than using simplistic targets such as forest extent and measuring single benefits such as carbon storage. This reflects a wider need for impacts on biodiversity to be considered as a central component of climate change policy.
However, there can also be structural, institutional, political and financial barriers to the implementation of high quality NbS. It is vital to understand these barriers, and engage and incentivize all stakeholders and all relevant institutions in the design, delivery and stewardship of high quality NbS with benefits for ecosystem health and biodiversity. In the United Kingdom, for example, there are many opportunities for local and national policymakers to support communities and farmers in scaling up high quality NbS for climate change adaptation, such as through linking agri-environment funds with local nature recovery strategies, funding outreach and training services, and setting biodiversity standards for NbS such as green roofs (Smith and Chausson 2021). Such incentives should include funding for effective long-term monitoring of ecosystem health, including support in choosing appropriate metrics, both at the national level and for support flowing from high-income to low-income countries. Careful evidence-based co-design following the IUCN Global Standard for NbS (IUCN 2020) can help to ensure delivery of ecosystem health benefits and reduce trade-offs with other outcomes. Showing that quality standards have been followed and demonstrating verified benefits for both biodiversity and society can also help to mobilise new financing streams for NbS.
Equally, biodiversity conservation policies should consider the potential to deliver wider societal benefits including for climate change mitigation and adaptation, and recognise NbS as a powerful land use strategy that can reconcile competing demands for use of space and natural resources. There are signs that this is starting to happen at an international level. Although the first official draft of the post-2020 global biodiversity framework does not mention NbS explicitly, preferring the term “ecosystem approach” as defined in the Convention on Biological Diversity (2000), it does include one target on climate change: to ‘minimize the impact of climate change on biodiversity, contribute to mitigation and adaptation through ecosystem-based approaches, contributing at least 10 GtCO2e per year to global mitigation efforts, and ensure that all mitigation and adaptation efforts avoid negative impacts on biodiversity.’ Nonetheless, it is important to recognise that there remains a role for protection, restoration and management of land for the sole or primary purpose of biodiversity conservation, for example when protecting the habitat of an endangered species (Biel et al., 2017; López-Bao et al., 2018; IPBES-IPCC, 2021). Any benefits from NbS and conservation for biodiversity and the climate, however, may be undermined if they do not occur alongside transformational change across sectors to address the ultimate drivers of habitat loss, including poor governance, and unsustainable consumption patterns and production methods (IPCC, 2018b; Allwood et al., 2019; IPBES, 2019; Leclère et al., 2020).
5 Conclusion
Our systematic review has shown that there is strong evidence that NbS, when carefully designed and implemented, can enable adaptation to climate change whilst also addressing the biodiversity crisis. However, there is also evidence that there can be adverse impacts on ecosystem health from “nature-based” interventions involving forest management or the creation of novel ecosystems such as plantations of non-native tree species. In addition, evidence for the ecosystem health outcomes of NbS is currently limited in terms of the metrics and taxa assessed. Therefore, there is a need for further investigation across a broader suite of metrics and taxa, with opportunity for standardised assessments across similar NbS interventions at different sites. Such research would better enable the design of NbS which avoid trade-offs between outcomes, and which enhance multiple aspects of ecosystem health, thereby supporting resilient ecosystems that continue to provide benefits to people in the face of environmental change. NbS projects must be designed from the outset to provide measurable benefits for ecosystem health, spanning multiple dimensions of biodiversity, and metrics to assess these outcomes should be chosen to suit the ecological and social context. This process must be one of co-production, such that decisions prioritise the views of local communities, rather than simply reflecting those of external actors such as funders, policymakers and scientists. Policymakers can create an enabling environment for rigorous ecosystem monitoring, while also ensuring that nature-based climate policy always supports ecosystem health, and biodiversity conservation explores opportunities to deliver on climate goals. For NbS to realise their full potential, the research, practice, funding and policy communities need to work together to improve the design, monitoring and adaptive management of NbS so that they deliver benefits for biodiversity and ecosystem health alongside climate goals.
Data availability statement
The original contributions presented in the study are included in the article/Supplementary Material, further inquiries can be directed to the corresponding author.
Author contributions
IK, MM, NS, BT, and AC conceptualised and designed the study; IK and MM designed and conducted the systematic coding methodology; IK conducted the analysis and wrote the manuscript; NS supervised the study; All authors took part in the writing of the manuscript, with AS making particularly substantive contributions
Funding
This study was supported by a Natural Environmental Research Council Knowledge Exchange Fellowship to NS (NE/R002649/1), with additional funding from the Waterloo Foundation (2263-3954) and the University of Oxford (Oxford Martin School).
Acknowledgments
An earlier version of the manuscript is available on preprints.org: www.preprints.org/manuscript/202110.0336/v1. We also thank Dan Seddon for his help with the creation of Figures 1, 6A.
Conflict of interest
The authors declare that the research was conducted in the absence of any commercial or financial relationships that could be construed as a potential conflict of interest.
Publisher’s note
All claims expressed in this article are solely those of the authors and do not necessarily represent those of their affiliated organizations, or those of the publisher, the editors and the reviewers. Any product that may be evaluated in this article, or claim that may be made by its manufacturer, is not guaranteed or endorsed by the publisher.
Supplementary material
The Supplementary Material for this article can be found online at: https://www.frontiersin.org/articles/10.3389/fenvs.2022.905767/full#supplementary-material
References
Allwood, J., Azevedo, J., Clare, A., Cleaver, C., Cullen, J., Dunant, C. F., et al. (2019). Absolute zero: Delivering the UK’s climate change commitment with incremental changes to today’s technologies. doi:10.17863/CAM.46075
Austin, W., Cohen, F., Coomes, D., Hanley, N., Lewis, S., Luque-Lora, R., et al. (2021). Nature-based solutions for climate change, people and biodiversity. Stirling: University of Stirling. Available at: https://www.stir.ac.uk/media/stirling/services/research/documents/policy-briefings/COP26-network-briefing---Nature-Based-Solutions.pdf.
Avolio, M. L., Beaulieu, J. M., Lo, E. Y. Y., and Smith, M. D. (2012). Measuring genetic diversity in ecological studies. Plant Ecol. 213, 1105–1115. doi:10.1007/S11258-012-0069-6
Bakhtary, H., Haupt, F., and Elbrecht, J. (2021). NDCs - a force for nature? WWF-UK Available at: https://wwfint.awsassets.panda.org/downloads/wwf_uk_ndcs_a_force_for_nature_3rd_edition.pdf.
Balthazar, V., Vanacker, V., Molina, A., and Lambin, E. F. (2015). Impacts of forest cover change on ecosystem services in high Andean mountains. Ecol. Indic. 48, 63–75. doi:10.1016/j.ecolind.2014.07.043
Baur, B. (2014). Dispersal-limited species – a challenge for ecological restoration. Basic Appl. Ecol. 15, 559–564. doi:10.1016/J.BAAE.2014.06.004
Benaradj, A., Boucherit, H., and Baghdadi, D. (2011). Effect the exclosure on plant diversity of the Hammada scoparia steppe in the Naama steppe courses (Algeria). J. Mater. Environ. Sci. 2, 564–571.
Bennion, L. D., Ferguson, J. A., New, L. F., and Schultz, C. B. (2020). Community-level effects of herbicide-based restoration treatments: Structural benefits but at what cost? Restor. Ecol. 28, 553–563. doi:10.1111/REC.13118
Biel, R. G., Hacker, S. D., Ruggiero, P., Cohn, N., and Seabloom, E. W. (2017). Coastal protection and conservation on sandy beaches and dunes: Context-dependent tradeoffs in ecosystem service supply. Ecosphere 8. doi:10.1002/ecs2.1791
Bremer, L. L., Farley, K. A., Bremer, L. L., and Farley, K. A. (2010). Does plantation forestry restore biodiversity or create green deserts? A synthesis of the effects of land-use transitions on plant species richness. Biodivers. Conserv. 19, 3893–3915. doi:10.1007/s10531-010-9936-4
Brown, G., Strickland-Munro, J., Kobryn, H., and Moore, S. A. (2016). Stakeholder analysis for marine conservation planning using public participation GIS. Appl. Geogr. 67, 77–93. doi:10.1016/j.apgeog.2015.12.004
Caillon, S., Cullman, G., Verschuuren, B., and Sterling, E. J. (2017). Moving beyond the human‐nature dichotomy through biocultural approaches: Including ecological well-being in resilience indicators. Ecol. Soc. 22 (4), art27. doi:10.5751/es-09746-220427
Cao, S., Chen, L., and Yu, X. (2009). Impact of China’s grain for green project on the landscape of vulnerable arid and semi-arid agricultural regions: A case study in northern shaanxi province. J. Appl. Ecol. 46, 536–543. doi:10.1111/j.1365-2664.2008.01605.x
Cárcamo, P. F., Garay-Flühmann, R., Squeo, F. A., and Gaymer, C. F. (2014). Using stakeholders’ perspective of ecosystem services and biodiversity features to plan a marine protected area. Environ. Sci. Policy 40, 116–131. doi:10.1016/j.envsci.2014.03.003
Cardinale, B. J., Duffy, J. E., Gonzalez, A., Hooper, D. U., Perrings, C., Venail, P., et al. (2012). Biodiversity loss and its impact on humanity Nature 486 (7401), 59–61. doi:10.1038/nature11148
Cardoza, Y. J., Harris, G. K., and Grozinger, C. M. (2012). Effects of soil quality enhancement on pollinator-plant interactions. Psyche (London) 2012, 581458. doi:10.1155/2012/581458
Carignan, V., and Villard, M.-A. (2002). Selecting indicator species to monitor ecological integrity: A review. Environ. Monit. Assess. 78, 45–61. doi:10.1023/A:1016136723584
Chan, K. M., Balvanera, P., Benessaiah, K., Chapman, M., Díaz, S., Gómez-Baggethun, E., et al. (2016). Why protect nature? Rethinking values and the environment. Proc. Natl. Acad. Sci. 113 (6), 1462–1465. doi:10.1073/pnas.152500211
Chausson, A., Turner, B., Seddon, D., Chabaneix, N., Girardin, C. A. J., Kapos, V., et al. (2020). Mapping the effectiveness of nature-based solutions for climate change adaptation. Glob. Change Biol. 26, 6134–6155. doi:10.1111/gcb.15310
Chazdon, R. L. (2020). Creating a culture of caretaking through restoring ecosystems and landscapes. One Earth 3, 653–656. doi:10.1016/J.ONEEAR.2020.11.010
Cochran, J. K., Bokuniewicz, H. J., and Yager, P. L. (2019). Encyclopedia of ocean sciences. Volume 1. Amsterdam, Netherlands: Elsevier Science. Marine biogeochemisty.
Cohen-Shacham, E., Andrade, A., Dalton, J., Dudley, N., Jones, M., Kumar, C., et al. (2019). Core principles for successfully implementing and upscaling Nature-based Solutions. Environ. Sci. Policy 98, 20–29. doi:10.1016/J.ENVSCI.2019.04.014
Comberti, C., Thornton, T. F., de Echeverria, V. W., and Patterson, T. (2015). Ecosystem services or services to ecosystems? Valuing cultivation and reciprocal relationships between humans and ecosystems. Glob. Environ. Change 34, 247–262. doi:10.1016/j.gloenvcha.2015.07.007
Convention on Biological Diversity (2000). COP 5 decision V/6 ecosystem approach. COP 5. Available at: https://www.cbd.int/decision/cop/?id=7148 (Accessed October 13, 2021).
Cosović, M. C., Bugalho, M. N., Thom, D., and Borges, J. G. (2020). Stand structural characteristics are the most practical biodiversity indicators for forest management planning in Europe. Forests 11, 343. doi:10.3390/f11030343
Cristescu, R. H., Rhodes, J., Frére, C., and Banks, P. B. (2013). Is restoring flora the same as restoring fauna? Lessons learned from koalas and mining rehabilitation. J. Appl. Ecol. 50, 423–431. doi:10.1111/1365-2664.12046
David, T. I., Storkey, J., and Stevens, C. J. (2019). Understanding how changing soil nitrogen affects plant–pollinator interactions. Arthropod-Plant Interact. 13, 671–684. doi:10.1007/S11829-019-09714-Y
De Lamo, X., Jung, M., Visconti, P., Schmidt-Traub, G., Miles, L., and Kapos, V. (2020). Strengthening synergies. Available at: http://hdl.handle.net/20.500.11822/34342.
Ebeling, A., Klein, A.-M., Schumacher, J., Weisser, W. W., and Tscharntke, T. (2008). How does plant richness affect pollinator richness and temporal stability of flower visits? Oikos 117, 1808–1815. doi:10.1111/J.1600-0706.2008.16819.X
Ehlers, A., Worm, B., and Reusch, T. B. H. (2008). Importance of genetic diversity in eelgrass Zostera marina for its resilience to global warming. Mar. Ecol. Prog. Ser. 355, 1–7. doi:10.3354/meps07369
Fischer, J., Riechers, M., Loos, J., Martin-Lopez, B., and Temperton, V. M. (2021). Making the UN decade on ecosystem restoration a social-ecological endeavour. Trends Ecol. Evol. 36, 20–28. doi:10.1016/J.TREE.2020.08.018
Fleishman, E., Noss, R. F., and Noon, B. R. (2006). Utility and limitations of species richness metrics for conservation planning. Ecol. Indic. 6, 543–553. doi:10.1016/j.ecolind.2005.07.005
Fuentes, L., Duguy, B., and Nadal-Sala, D. (2018). Short-term effects of spring prescribed burning on the understory vegetation of a Pinus halepensis forest in Northeastern Spain. Sci. Total Environ. 611, 720–731. doi:10.1016/j.scitotenv.2017.08.050
Gamfeldt, L., Snäll, T., Bagchi, R., Jonsson, M., Gustafsson, L., Kjellander, P., et al. (2013). Higher levels of multiple ecosystem services are found in forests with more tree species. Nat. Commun. 4, 1340–1348. doi:10.1038/ncomms2328
Geldmann, J., Coad, L., Barnes, M. D., Craigie, I. D., Woodley, S., Balmford, A., et al. (2018). A global analysis of management capacity and ecological outcomes in terrestrial protected areas. Conserv. Lett. 11, 14. doi:10.1111/conl.12434
Gilbert-Norton, L., Wilson, R., Stevens, J. R., and Beard, K. H. (2010). A meta-analytic review of corridor effectiveness. Conserv. Biol. 24, 660–668. doi:10.1111/J.1523-1739.2010.01450.X
Girardin, C. A. J., Jenkins, S., Seddon, N., Allen, M., Lewis, S. L., Wheeler, C. E., et al. (2021). Nature-based solutions can help cool the planet — If we act now. Nature 593, 191–194. doi:10.1038/d41586-021-01241-2
Giron-Nava, A., James, C. C., Johnson, A. F., Dannecker, D., Kolody, B., Lee, A., et al. (2017). Quantitative argument for long-term ecological monitoring. Mar. Ecol. Prog. Ser. 572, 269–274. doi:10.3354/meps12149
Graham, N. A. J., Cinner, J. E., Norström, A. v., and Nyström, M. (2014). Coral reefs as novel ecosystems: EMBRACING new futures. Curr. Opin. Environ. Sustain. 7, 9–14. doi:10.1016/j.cosust.2013.11.023
Gray, C. L., Hill, S. L. L., Newbold, T., Hudson, L. N., Boïrger, L., Contu, S., et al. (2016). Local biodiversity is higher inside than outside terrestrial protected areas worldwide. Nat. Commun. 7, 12306–12307. doi:10.1038/ncomms12306
Hedges, L. V., Gurevitch, J., and Curtis, P. S. (1999). The meta-analysis of response ratios in experimental ecology. Ecology 80, 1150–1156. doi:10.1890/0012-9658(1999)080[1150:tmaorr]2.0.co;2
Heilmayr, R., Echeverría, C., and Lambin, E. F. (20202020). Impacts of Chilean forest subsidies on forest cover, carbon and biodiversity. Nat. Sustain. 3, 701–709. doi:10.1038/s41893-020-0547-0
Hesterberg, T. (2015). Package “resample.”. Available at: https://cran.r-project.org/web/packages/resample/index.html (Accessed October 1, 2021).
Himes, A., and Muraca, B. (2018). Relational values: The key to pluralistic valuation of ecosystem services. Curr. Opin. Environ. Sustain. 35, 1–7. doi:10.1016/j.cosust.2018.09.005
Humbert, J. Y., Ghazoul, J., and Walter, T. (2009). Meadow harvesting techniques and their impacts on field fauna. Agric. Ecosyst. Environ. 130, 1–8. doi:10.1016/J.AGEE.2008.11.014
IPBES (2021a). Biodiversity | IPBES secretariat. IPBES Glossary. Available at: https://ipbes.net/glossary/biodiversity (Accessed October 1, 2021).
IPBES (2021b). Ecosystem health. IPBES Glossary. Available at: https://ipbes.net/glossary/ecosystem-health (Accessed October 1, 2021).
IPBES-IPCC (2021). IPBES-IPCC Co-sponsored workshop report on biodiversity and climate change workshop report. doi:10.5281/zenodo.4782538
IPBES (2019). Summary for policymakers of the global assessment report on biodiversity and ecosystem services of the intergovernmental science-policy platform on biodiversity and ecosystem services. Editors S. Díaz, J. Settele, E. S. Brondízio, H. T. Ngo, M. Guèze, J. Agardet al. (Bonn, Germany: IPBES secretariat), 56. doi:10.5281/zenodo.3553579
IPCC (2012). Managing the risks of extreme events and disasters to advance climate change. A special report of working groups I and II of the IPCC. Intergovernmental Panel on Climate Change. Cambridge: Cambridge University Press.
Isbell, F., Craven, D., Connolly, J., Loreau, M., Schmid, B., Beierkuhnlein, C., et al. (2015). Biodiversity increases the resistance of ecosystem productivity to climate extremes. Nature 526 (7574), 574–577. doi:10.1038/nature15374
Iso-Touru, T., Tabell, J., Virta, A., and Kauhala, K. (2021). A non-invasive, DNA-based method for beaver species identification in Finland. Wildl. Biol. 2021, wlb.00808. doi:10.2981/wlb.00808
IUCN (2021). IUCN definitions. Available at: https://www.iucn.org/sites/dev/files/iucn-glossary-of-definitions_en_2021.05.pdf (Accessed October 1, 2021).
IUCN (2020). IUCN global standard for nature-based solutions : A user-friendly framework for the verification, design and scaling up of NbS. first edition. Gland: IUCN. doi:10.2305/IUCN.CH.2020.09.en
IUCN (2012). The IUCN programme 2013-2016. Available at: https://portals.iucn.org/library/node/10320 (Accessed September 30, 2021).
Kimiti, D. W., Riginos, C., and Belnap, J. (2017). Low-cost grass restoration using erosion barriers in a degraded African rangeland. Restor. Ecol. 25, 376–384. doi:10.1111/rec.12426
Knight, K. B., Seddon, E. S., and Toombs, T. P. (2020). A framework for evaluating biodiversity mitigation metrics. Ambio 49, 1232–1240. doi:10.1007/s13280-019-01266-y
Lavorel, S., Colloff, M. J., Mcintyre, S., Doherty, M. D., Murphy, H. T., Metcalfe, D. J., et al. (2015). Ecological mechanisms underpinning climate adaptation services. Glob. Chang. Biol. 21, 12–31. doi:10.1111/gcb.12689
Leclère, D., Obersteiner, M., Barrett, M., Butchart, S. H. M., Chaudhary, A., De Palma, A., et al. (2020). Bending the curve of terrestrial biodiversity needs an integrated strategy. Nature 585, 551–556. doi:10.1038/s41586-020-2705-y
Lewis, S. L., Wheeler, C. E., Mitchard, E. T. A., and Koch, A. (2019). Restoring natural forests is the best way to remove atmospheric carbon. Nature 568, 25–28. doi:10.1038/d41586-019-01026-8
Liang, J., Crowther, T. W., Picard, N., Wiser, S., Zhou, M., Alberti, G., et al. (2016). Positive biodiversity-productivity relationship predominant in global forests. Science 354, aaf8957. doi:10.1126/SCIENCE.AAF8957
Lindemann-Matthies, P., Junge, X., and Matthies, D. (2010). The influence of plant diversity on people’s perception and aesthetic appreciation of grassland vegetation. Biol. Conserv. 143, 195–202. doi:10.1016/j.biocon.2009.10.003
Lindenmayer, D. B., Likens, G. E., Andersen, A., Bowman, D., Bull, C. M., Burns, E., et al. (2012). Value of long-term ecological studies. Austral Ecol. 37, 745–757. doi:10.1111/j.1442-9993.2011.02351.x
López-Bao, J. V., Fleurke, F., Chapron, G., and Trouwborst, A. (2018). Legal obligations regarding populations on the verge of extinction in Europe: Conservation, restoration, recolonization, reintroduction. Biol. Conserv. 227, 319–325. doi:10.1016/J.BIOCON.2018.09.027
Lyashevska, O., and Farnsworth, K. D. (2012). How many dimensions of biodiversity do we need? Ecol. Indic. 18, 485–492. doi:10.1016/j.ecolind.2011.12.016
Marshall, E., Valavi, R., Connor, L. O., Cadenhead, N., Southwell, D., Wintle, B. A., et al. (2021). Quantifying the impact of vegetation-based metrics on species persistence when choosing offsets for habitat destruction. Conserv. Biol. 35, 567–577. doi:10.1111/COBI.13600
Marshall, E., Wintle, B. A., Southwell, D., and Kujala, H. (2020). What are we measuring? A review of metrics used to describe biodiversity in offsets exchanges. Biol. Conserv. 241, 108250. doi:10.1016/J.BIOCON.2019.108250
IPCC (2018b). Global Warming of 1.5°C. An IPCC Special Report on the impacts of global warming of 1.5°C above pre-industrial levels and related global greenhouse gas emission pathways, in the context of strengthening the global response to the threat of climate change, sustainable development, and efforts to eradicate poverty
IPCC (2018a). “Annex I: Glossary,” in Global Warming of 1.5°C. An IPCC Special Report on the impacts of global warming of 1.5°C above pre-industrial levels and related global greenhouse gas emission pathways, in the context of strengthening the global response to the threat of climate change, sustainable development, and efforts to eradicate poverty. Editors V. Masson-Delmotte, P. Zhai, H.-O. Pörtner, D. Roberts, J. Skea, P. R. Shuklaet al. (Cambridge: Cambridge University Press).
Miller, J. T., Jolley-Rogers, G., Mishler, B. D., and Thornhill, A. H. (2018). Phylogenetic diversity is a better measure of biodiversity than taxon counting. J. Syst. Evol. 56, 663–667. doi:10.1111/JSE.12436
Missall, S., Abliz, A., Halik, Ü., Thevs, N., and Welp, M. (2018). Trading natural riparian forests for urban shelterbelt plantations—a sustainability assessment of the kökyar protection forest in NW China. Water 10, 343. doi:10.3390/w10030343
Mori, A. S. (2020). Advancing nature-based approaches to address the biodiversity and climate emergency. Ecol. Lett. 23, 1729–1732. doi:10.1111/ele.13594
Mori, A. S., Dee, L. E., Gonzalez, A., Ohashi, H., Cowles, J., Wright, A. J., et al. (2021). Biodiversity–productivity relationships are key to nature-based climate solutions. Nat. Clim. Chang. 11, 543–550. doi:10.1038/s41558-021-01062-1
Moussy, C., Burfield, I. J., Stephenson, P. J., Newton, A. F. E., Butchart, S. H. M., Sutherland, W. J., et al. (2021). A quantitative global review of species population monitoring. Conserv. Biol. 36, e13721. doi:10.1111/COBI.13721
Moya, D., de las Heras, J., López-Serrano, F. R., and Ferrandis, P. (2015). Post-Fire seedling recruitment and morpho-ecophysiological responses to induced drought and salvage logging in Pinus halepensis Mill. Stands. Forests 6, 1858–1877. doi:10.3390/f6061858
Mukul, S. A., Herbohn, J., and Firn, J. (2016). Co-Benefits of biodiversity and carbon sequestration from regenerating secondary forests in the philippine uplands: Implications for forest landscape restoration. Biotropica 48, 882–889. doi:10.1111/btp.12389
Naeem, S., Prager, C., Weeks, B., Varga, A., Flynn, D. F. B., Griffin, K., et al. (2016). Biodiversity as a multidimensional construct: A review, framework and case study of herbivory’s impact on plant biodiversity. Proc. R. Soc. B 283, 20153005. doi:10.1098/rspb.2015.3005
Noss, R. F. (1990). Indicators for monitoring biodiversity: A hierarchical approach. Conserv. Biol. 4 (4), 355–364. doi:10.1111/j.1523-1739.1990.tb00309.x
Oliver, T. H., Heard, M. S., Isaac, N. J. B., Roy, D. B., Procter, D., Eigenbrod, F., et al. (2015a). Biodiversity and resilience of ecosystem functions. Trends Ecol. Evol. 30, 673–684. doi:10.1016/J.TREE.2015.08.009
Oliver, T. H., Isaac, N. J. B., August, T. A., Woodcock, B. A., Roy, D. B., and Bullock, J. M. (2015b). Declining resilience of ecosystem functions under biodiversity loss. Nat. Commun. 6, 10122–10128. doi:10.1038/ncomms10122
Operandum (2019). What are hydrometeorological hazards? Available at: https://www.operandum-project.eu/news/what-are-hydrometeorological-hazards/ (Accessed October 14, 2021).
Osuri, A. M., Gopal, A., Raman, T. R. S., Defries, R., Cook-Patton, S. C., and Naeem, S. (2020). Greater stability of carbon capture in species-rich natural forests compared to species-poor plantations. Environ. Res. Lett. 15, 034011. doi:10.1088/1748-9326/ab5f75
Peterson St-Laurent, G., Oakes, L. E., Cross, M., and Hagerman, S. (2021). R–R–T (resistance–resilience–transformation) typology reveals differential conservation approaches across ecosystems and time. Commun. Biol. 4, 39. doi:10.1038/s42003-020-01556-2
Paolucci, E. M., MacIsaac, H. J., and Ricciardi, A. (2013). Origin matters: Alien consumers inflict greater damage on prey populations than do native consumers. Divers. Distrib. 19, 988–995. doi:10.1111/DDI.12073
Paudyal, K., Baral, H., Bhandari, S. P., Bhandari, A., and Keenan, R. J. (2019). Spatial assessment of the impact of land use and land cover change on supply of ecosystem services in Phewa watershed, Nepal. Ecosyst. Serv. 36, 100895. doi:10.1016/j.ecoser.2019.100895
Poorter, L., Craven, D., Jakovac, C. C., van der Sande, M. T., Amissah, L., Bongers, F., et al. (2021). Multidimensional tropical forest recovery. Science 374 (6573), 1370–1376. doi:10.1126/science.abh3629
Prendergast, J. R., Quinn, R. M., Lawton, J. H., Eversham, B. C., and Gibbons, D. W. (1993). Rare species, the coincidence of diversity hotspots and conservation strategies. Nature 365 (6444), 335–337. doi:10.1038/365335a0
Prowse, T. A. A., Collard, S. J., Blackwood, A., O’Connor, P. J., Delean, S., Barnes, M., et al. (2017). Prescribed burning impacts avian diversity and disadvantages woodland-specialist birds unless long-unburnt habitat is retained. Biol. Conserv. 215, 268–276. doi:10.1016/J.BIOCON.2017.09.005
Pynegar, E. L., Jones, J. P. G., Gibbons, J. M., and Asquith, N. M. (2018). The effectiveness of payments for ecosystem services at delivering improvements in water quality: Lessons for experiments at the landscape scale. PeerJ 6, e5753. doi:10.7717/peerj.5753
Qiu, J., and Cardinale, B. J. (2020). Scaling up biodiversity–ecosystem function relationships across space and over time. Ecology 101, e03166. doi:10.1002/ecy.3166
Rana, E., Thwaites, R., and Luck, G. (2017). Trade-offs and synergies between carbon, forest diversity and forest products in Nepal community forests. Environ. Conserv. 44, 5–13. doi:10.1017/S0376892916000448
R Core Team (2021). R: A language and environment for statistical computingVienna, Austria: R Foundation for Statistical Computing. Available at: https://www.R-project.org/.
Reddy, C. S., Kurian, A., Srivastava, G., Singhal, J., Varghese, A. O., Padalia, H., et al. (2021). Remote sensing enabled essential biodiversity variables for biodiversity assessment and monitoring: Technological advancement and potentials. Biodivers. Conserv. 30, 1–14. doi:10.1007/s10531-020-02073-8
Rilov, G., and Crooks, J. A. (2009). Biological invasions in marine ecosystems. Berlin: Springer-Verlag.
Roe, D., Turner, B., Chausson, A., Hemmerle, E., and Seddon, N. (2021). Investing in nature for development: Do nature-based interventions deliver local development outcomes? London: IIED. Available at: https://pubs.iied.org/20206iied.
Ruaro, R., Gubiani, É. A., Thomaz, S. M., and Mormul, R. P. (2020). Nonnative invasive species are overlooked in biological integrity assessments. Biol. Invasions 23, 83–94. doi:10.1007/S10530-020-02357-8
Ruppert, K. M., Kline, R. J., and Rahman, M. S. (2019). Past, present, and future perspectives of environmental DNA (eDNA) metabarcoding: A systematic review in methods, monitoring, and applications of global eDNA. Glob. Ecol. Conservation 17, e00547. doi:10.1016/j.gecco.2019.e00547
Sala, E., and Giakoumi, S. (2018). No-take marine reserves are the most effective protected areas in the ocean. ICES J. Mar. Sci. 75, 1166–1168. doi:10.1093/icesjms/fsx059
Sala, E., Mayorga, J., Bradley, D., Cabral, R. B., Atwood, T. B., Auber, A., et al. (2021). Protecting the global ocean for biodiversity, food and climate. Nature 592 (7854), 397–402. doi:10.1038/s41586-021-03371-z
Scheidel, A., and Work, C. (2018). Forest plantations and climate change discourses: New powers of ‘green’ grabbing in Cambodia. Land Use Policy 77, 9–18. doi:10.1016/J.LANDUSEPOL.2018.04.057
Schwarz, N., Moretti, M., Bugalho, M. N., Davies, Z. G., Haase, D., Hack, J., et al. (2017). Understanding biodiversity-ecosystem service relationships in urban areas: A comprehensive literature review. Ecosyst. Serv. 27, 161–171. doi:10.1016/J.ECOSER.2017.08.014
Scyphers, S. B., Powers, S. P., Heck, K. L., and Byron, D. (2011). Oyster reefs as natural breakwaters mitigate shoreline loss and facilitate fisheries. PLoS ONE 6, e22396. doi:10.1371/journal.pone.0022396
Seddon, N., Chausson, A., Berry, P., Girardin, C. A. J., Smith, A., and Turner, B. (2020a). Understanding the value and limits of nature-based solutions to climate change and other global challenges. Phil. Trans. R. Soc. B 375, 20190120. doi:10.1098/rstb.2019.0120
Seddon, N., Daniels, E., Davis, R., Chausson, A., Harris, R., Hou-Jones, X., et al. (2020b). Global recognition of the importance of nature-based solutions to the impacts of climate change. Glob. Sustain. 3, e15. doi:10.1017/SUS.2020.8
Seddon, N. (2022). Harnessing the potential of nature-based solutions for mitigating and adapting to climate change. Science 376 (6600), 1410–1416. doi:10.1126/science.abn9668
Seddon, N., Smith, A., Smith, P., Key, I., Chausson, A., Girardin, C., et al. (2021). Getting the message right on nature-based solutions to climate change. Glob. Chang. Biol. 27, 1518–1546. doi:10.1111/GCB.15513
Sekercioglu, C. H. (2010). “Ecosystem functions and services,” in Conservation biology for all (Oxford: Oxford University Press), 45–72. doi:10.1093/acprof:oso/9780199554232.003.0004
Silliman, B. R., Schrack, E., He, Q., Cope, R., Santoni, A., Van Der Heide, T., et al. (2015). Facilitation shifts paradigms and can amplify coastal Restoration efforts. Proc. Natl. Acad. Sci. U. S. A. 112, 14295–14300. doi:10.1073/pnas.1515297112
Smith, A. C., Harrison, P. A., Pérez Soba, M., Archaux, F., Blicharska, M., Egoh, B. N., et al. (2017). How natural capital delivers ecosystem services: A typology derived from a systematic review. Ecosyst. Serv. 26, 111–126. doi:10.1016/J.ECOSER.2017.06.006
Smith, A., and Chausson, A. (2021). Nature-based solutions in UK climate adaptation policy. A report prepared by the nature-based solutions initiative at the university of Oxford for WWF-UK and RSPB. Available at: https://www.rspb.org.uk/globalassets/downloads/policy-briefings/nature-based-solutions-adaption-report.pdf.
Society for Ecological Restoration International Science & Policy Working Group (2004). The SER international primer on ecological restoration. : Society for Ecological Restoration International. Available at: https://cdn.ymaws.com/www.ser.org/resource/resmgr/custompages/publications/ser_publications/ser_primer.pdf.
Spake, R., and Doncaster, C. P. (2017). Use of meta-analysis in forest biodiversity research: Key challenges and considerations. For. Ecol. Manag. 400, 429–437. doi:10.1016/j.foreco.2017.05.059
Sterling, E. J., Filardi, C., Toomey, A., Sigouin, A., Betley, E., Gazit, N., et al. (2017). Biocultural approaches to well-being and sustainability indicators across scales. Nat. Ecol. Evol. 1 (12), 1798–1806. doi:10.1038/s41559-017-0349-6
Strassburg, B. B. N., Iribarrem, A., Beyer, H. L., Cordeiro, C. L., Crouzeilles, R., Jakovac, C. C., et al. (2020). Global priority areas for ecosystem restoration. Nature 586 (7831), 724–729. doi:10.1038/s41586-020-2784-9
Sugai, L. S. M., Silva, T. S. F., Ribeiro, J. W., and Llusia, D. (2019). Terrestrial passive acoustic monitoring: Review and perspectives. BioScience 69, 15–25. doi:10.1093/biosci/biy147
Teixeira, H., Berg, T., Uusitalo, L., Fürhaupter, K., Heiskanen, A. S., Mazik, K., et al. (2016). A catalogue of marine biodiversity indicators. Front. Mar. Sci. 3. doi:10.3389/fmars.2016.00207
Thompson, K. L., Reece, N., Robinson, N., Fisher, H. J., Ban, N. C., and Picard, C. R. (2019). “We monitor by living here”: community-driven actualization of a social-ecological monitoring program based in the knowledge of Indigenous harvesters. Facets 4 (1), 293–314. doi:10.1139/facets-2019-0006
Tomitaka, M., Uchihara, S., Goto, A., and Sasaki, T. (2021). Species richness and flower color diversity determine aesthetic preferences of natural-park and urban-park visitors for plant communities. Environ. Sustain. Indic. 11, 100130. doi:10.1016/j.indic.2021.100130
Turner, B., Devisscher, T., Chabaneix, N., Woroniecki, S., Messier, C., and Seddon, N. (2022). The role of nature-based solutions in supporting social-ecological resilience for climate change adaptation. Annu. Rev. Environ. Resour. 46. In press. doi:10.1146/annurev-environ-012220-010017
Uebel, K., Wilson, K. A., and Shoo, L. P. (2017). Assisted natural regeneration accelerates recovery of highly disturbed rainforest. Ecol. Manag. Restor. 18, 231–238. doi:10.1111/EMR.12277
USEPA (2016). A practitioner’s guide to the biological condition gradient: A framework to describe incremental change in aquatic ecosystems. Washington, DC: U.S. Environmental Protection Agency. Available at: https://www.epa.gov/sites/default/files/2016-02/documents/bcg-practioners-guide-report.pdf.
Wang, C. T., Wang, G. X., Liu, W., Wang, Y., Hu, L., and Ma, L. (2013). Effects of establishing an artificial grassland on vegetation characteristics and soil quality in a degraded meadow. Isr. J. Ecol. Evol. 59, 141–153. doi:10.1080/15659801.2013.863669
Watson, J. E. M., Evans, T., Venter, O., Williams, B., Tulloch, A., Stewart, C., et al. (2018). The exceptional value of intact forest ecosystems. Nat. Ecol. Evol. 2, 599–610. doi:10.1038/s41559-018-0490-x
Welden, E. A., Chausson, A., and Melanidis, M. S. (2021). Leveraging nature-based solutions for transformation: Reconnecting people and nature. People Nat. 00, 966–977. doi:10.1002/PAN3.10212
Williams, J. E., Neville, H. M., Haak, A. L., Colyer, W. T., Wenger, S. J., and Bradshaw, S. (2015). Climate change adaptation and restoration of western trout streams: Opportunities and strategies. Fisheries 40, 304–317. doi:10.1080/03632415.2015.1049692
Woroniecki, S., Spiegelenberg, F. A., Chausson, A., Turner, B., Key, I., Irfanullah, H., et al. (2021). Contributions of nature-based solutions to reduce peoples’ vulnerabilities to climate change across the rural global south. Preprints 2021, 2021100403. doi:10.20944/preprints202110.0403.v1
Keywords: nature-based solutions, ecosystem-based adaptation, ecosystem health, climate change adaptation, biodiversity, biodiversity conservation, metrics
Citation: Key IB, Smith AC, Turner B, Chausson A, Girardin CAJ, Macgillivray M and Seddon N (2022) Biodiversity outcomes of nature-based solutions for climate change adaptation: Characterising the evidence base. Front. Environ. Sci. 10:905767. doi: 10.3389/fenvs.2022.905767
Received: 27 March 2022; Accepted: 26 August 2022;
Published: 11 October 2022.
Edited by:
David Jack Coates, Department of Biodiversity, Conservation and Attractions (DBCA), AustraliaReviewed by:
Joanne M. Bennett, University of Canberra, AustraliaAdam Peter Hejnowicz, Newcastle University, United Kingdom
Copyright © 2022 Key, Smith, Turner, Chausson, Girardin, Macgillivray and Seddon. This is an open-access article distributed under the terms of the Creative Commons Attribution License (CC BY). The use, distribution or reproduction in other forums is permitted, provided the original author(s) and the copyright owner(s) are credited and that the original publication in this journal is cited, in accordance with accepted academic practice. No use, distribution or reproduction is permitted which does not comply with these terms.
*Correspondence: Nathalie Seddon, bmF0aGFsaWUuc2VkZG9uQGJpb2xvZ3kub3guYWMudWs=