- 1College of Geoscience and Surveying Engineering, China University of Mining and Technology, Beijing, China
- 2Key Laboratory of City Cluster Environmental Safety and Green Development, Ministry of Education, Institute of Environmental and Ecological Engineering, Guangdong University of Technology, Guangzhou, China
- 3State Key Laboratory of Resources and Environmental Information System, Institute of Geographical Sciences and Natural Resources Research, Beijing, China
Environmental pollution caused by energy consumption is a global problem. Optimization of the energy system will contribute to the sustainable development of city, especially of the industrial cities. Based on the Long-term Energy Alternative Planning System (LEAP) model, the LEAP-Suzhou model was established to explore the energy system optimization and emission reduction path of Suzhou to 2050. By accounting for current energy consumption and carbon emissions, the baseline scenario (BAU) was established. According to the different methods and intensities of energy transformation, an industrial structure optimization scenario (ISO), an energy structure optimization scenario (ESO), and an energy transformation optimization scenario (ETD) were created. Combined with the energy flow diagram, the energy structure and the direction of optimization were analyzed. The results showed that the baseline scenario will consume 259.954 million tons of standard coal by 2050, and the carbon emission will be 677.6 Mt. Compared with BAU, the ISO, ESO, and ETD scenarios will reduce energy consumption by 37.9%, 37.4%, and 74.8%, respectively, by 2050. ETD had the best carbon dioxide reduction, followed by ESO, and finally ISO. Among them, the carbon emission of ETD will reach its peak around 2030 and decrease to 73.8 Mt in 2050, resulting in the best emission reduction effect. This scenario is the best path for Suzhou to achieve the goal of “carbon peak and neutrality” and sustainable development. The LEAP-Suzhou model successfully explores the low carbon path of Suzhou, provides policy guidance for the optimization of energy transition and carbon neutrality of industrial cities, In the future, the energy structure should be further optimized in Suzhou, and advanced energy technologies should be introduced to improve energy efficiency, especially for the power generation sector, and the proportion of clean energy such as gas should be further expanded.
1 Introduction
Controlling carbon dioxide is the key to coping with climate change and reducing greenhouse gas emissions (Watts et al., 2015; Le et al., 2018). To this end, nearly 200 parties to the United Nations Framework Convention on Climate Change signed the Paris Agreement on Climate Change in 2015. The agreement, which harmonizes global action on climate change after 2020, sets a goal of achieving net zero emissions in the second half of the century. In order to implement the Paris Agreement (Liu et al., 2016), China included climate change targets in the outline of its 14th Five-Year Plan in 2020 (Chai et al., 2020). In September of the same year, the United Nations General Assembly pledged again to “strive for carbon peak by 2030 and carbon neutral by 2060" (Liu, 2021a). In addition, the roadmap for China’s carbon peak and carbon neutral work was laid out after this assembly, which included accelerating the low-carbon and clean transformation of the energy system as an important step (Chu and Majumdar, 2012; He, 2014; Liu et al., 2022).
As we know, the consumption of fossil energy is only one factor causing greenhouse gas emissions such as carbon dioxide and affecting climate change and regional environmental quality (Li N. et al., 2021; Ponce and Khan, 2021). Urban areas account for only about 3% of the earth’s land mass but consume more than 70% of global energy and contribute 75% of the global carbon emissions (Wu, 2019). Fossil energy consumption in Chinese cities accounts for 85% of the country’s total energy consumption, and coal remained the most consumed among them at about 57.7% in 2020 (Zhang, 2021). Especially in industrial cities, economic development is mainly supported by industrial production, and fossil energy runs through the industrial chain of the entire city (Yang, 2021), consuming a lot of energy (Wang S. H. et al., 2021). As a result, typical energy balance and ecological pollution problems arise, resulting in the yearly increase in urban carbon emissions. Industrial cities are big energy consumers and carbon emission producers. Optimizing their energy systems is the key to exploring the path of energy innovation and emission reduction at the urban scale, and this plays a crucial role in the national and global response to climate change and carbon emission reduction (Liu et al., 2015). At present, countries and regions in the world are actively seeking effective ways of energy reform, and many studies on urban scale energy consumption at home and abroad have investigated the role of multi-factor energy consumption and carbon emissions in regional differences (Wang et al., 2020; Li Q. et al., 2021; Nuta et al., 2021). The input–output method is widely used in energy system research. For example, Xu et al. (2019) used multi-scale input–output analysis (MSIO) to analyze the carbon emissions of Tianjin in 2012 and estimate the carbon emissions caused by imported products. The results showed that carbon emissions in 2012 were 1.67 times those of 2007, and 6% of carbon emissions in 2012 came from imports. Structural decomposition analysis (SDA) is the most commonly used quantitative analysis method of energy consumption at present and is often combined with input–output analysis (IO). For example, based on the top-down IO-SDA model, Wang et al. (2013) analyzed the driving forces of carbon dioxide emission increment in Beijing from 1997 to 2010 from the perspectives of production and end demand. The results showed that the increase in carbon emissions in Beijing is mainly driven by the change in production structure and population growth. Stochastic Impacts by Regression on Population, Affluence, and Technology (STIRPAT) is an extendable stochastic environmental impact assessment model that evaluates the impact of different elements on carbon emissions. Based on the ICE-STIRPAT model, Shao et al. (2011) estimated the industrial carbon dioxide emissions in Shanghai from 1994 to 2009, summarized the characteristics of industrial carbon dioxide emissions, and proved that coal consumption is the largest source of carbon emissions in Shanghai. In addition, the LEAP model covers accounting and forecasting of energy systems, as well as accounting for air pollutants and carbon emissions. Hu et al. (2019) combined sustainable energy planning with economic analysis and took Shenzhen, China, as an example; they defined four scenarios to analyze the future forecast of energy production and consumption from 2015 to 2030 based on LEAP. Their work showed that the policy of energy efficiency improvement and energy structure upgrading in Shenzhen had a significant impact on its energy system.
The above studies on energy planning and carbon emissions at the city level mostly focused on a certain energy sector and lacked a detailed accounting and emission reduction path analysis of the whole energy system. From the perspective of time span, the forecast time was short, which cannot reflect the impact of emission reduction policies over a long period. From the perspective of research, input–output methods and their deformation and the STIRPAT model are often used, which are unable to produce detailed accounting and long-term energy system optimization prediction for the whole energy consumption sector. However, the Long-range Energy Alternatives Planning System (LEAP) is a bottom-up accounting tool for energy consumption and production. This model simulates the energy consumption system and has been widely used in industrial structure, carbon emission reduction, and carbon emission scenario prediction (Wang, 2016; Deng and Li, 2017). The LEAP model can effectively enable energy accounting and prediction from the country to the city and even smaller scales. It can cover whole consumption sectors of the energy system or study specific industry sectors. On a national scale, Nieves et al. (2019) studied energy consumption and GHG emissions in Colombia’s multiple industries based on the LEAP model. Two scenarios were set up to demonstrate that energy consumption in Colombia will be concentrated in the transportation sector and carbon emissions will increase significantly in 2050. At the urban scale, Li et al. (2013) used the LEAP model to study the coordinated emission reduction of air pollutants and greenhouse gases in Beijing. The results showed that increasing energy conservation constraints and optimizing energy consumption structures can reduce the generation of pollutants and greenhouse gases under different emission reduction policies. LEAP can also facilitate research into specific industry sectors. Based on the LEAP model Hong et al. (2016) examined the effectiveness of the policies implemented by the South Korean government in the transportation sector and analyzed the ripple effects of the policies to 2050 from the energy and environmental aspects. The emission reduction effect of the transportation sector in this study was predicted by setting five emission scenarios, and policy suggestions were proposed for the transportation sector to achieve national emission reduction targets. In this paper, LEAP model is applied to analyze and study the current status of energy consumption, energy conversion and flow, and the multi-scenario long-term energy planning path of the whole consumption sectors in the city-scale energy system.
Suzhou is a megalopolis with a strong industrial character, and it is a central city in the Yangtze River Delta, playing an important role in the economic development of not only the Yangtze River Delta but the entire country (Liu et al., 2019; Sun et al., 2019; Xie and Sun, 2021). However, Suzhou is an energy-dependent city. Because of its geographical location, the local renewable energy resource endowment is limited, and its energy resource self-sufficiency rate is low. Raw coal and crude oil are required by other cities and provinces, which is significantly different from the energy structure of resource-based cities. Therefore, the structural contradiction of energy has become increasingly prominent (Liu et al., 2021b). Understanding the growth trend of energy consumption in Suzhou is an important path to controlling total energy consumption, reducing energy consumption intensity, and achieving green, low-carbon and sustainable development. In 2016, the “Report on Building Suzhou into a Model City of International Energy Reform and Development” was released, offering a solution for solving energy bottlenecks and other problems. This was China’s first construction report in international energy reform and model city development. At present, research on the direction of Suzhou’s energy system has made some progress. Wang Y. Z. et al. (2021) proposed a comprehensive evaluation system for industrial city energy transformation based on the interpretive structural model and analytic hierarchy process, analyzed the development process of urban energy transformation in Suzhou from 2013 to 2018, and offered suggestions for the subsequent development of energy transformation in Suzhou. Using the Wuzhong District of Suzhou as an example, Zhu et al. (2020) analyzed its urbanization characteristics from the viewpoints of historical geography, population development, economic industry, and so on, and explored the development path of energy reform under the new urbanization trend from multiple perspectives. Liao and Wu. (2013) analyzed carbon emissions from the energy consumption of industrial enterprises above scale in Suzhou and put forward suggestions for further adjustment of the industrial structure and improvement of energy conservation and emission reduction policies. At present, research on Suzhou’s energy system is not comprehensive enough for the Research Department of Energy Transition and Low-carbon Development, which has failed to identify the connection among the various departments of the energy system and to offer an energy system development forecast. This research cannot establish a feasible optimization path for Suzhou energy system.
Thus, the LEAP-Suzhou model was established based on the LEAP model to explore the low-carbon optimization path of Suzhou’s energy system, and a systematic and comprehensive accounting was conducted of the energy department and energy types in Suzhou. The high-consumption and high-pollution sectors were confirmed. Combined with the energy flow diagram, the energy flow situation of each department was considered to analyze the energy innovation and emission reduction potential of each department. In addition to the baseline scenario, this paper sets up three scenarios for different optimization methods and emission reduction intensity, so as to clarify the advantages of energy structure optimization on urban carbon emission reduction. A scenario analysis of the factors influencing energy consumption of city-scale was carried out. This paper explores the path of urban energy reform and low-carbon development. It provides guidance for the transformation of Suzhou industrial energy system. This study has important theoretical support for promoting urban low-carbon transformation and achieving carbon neutrality, and has practical significance for the global response to climate change.
2 Study Area
Suzhou is an energy-dependent city, the main features are as follows: The main energy consumption sector is industry, the energy consumption structure is still dominated by coal, and electricity occupies an important position in the total energy. The problems of energy structural are becoming more serious. Coal accounts for a high proportion of energy consumption by enterprises above designated size, while oil and gas and other clean energy sources account for a low proportion. With the continuous and steady development of economy and society, the continuous improvement of people’s living standard and the acceleration of urbanization, the energy consumption of construction, transportation and living will increase rapidly. The total energy consumption in Suzhou will keep a rapid growth momentum, which will bring great pressure to energy supply and economic development. Therefore, it is urgent for Suzhou to transform its industrial structure, optimize its energy structure and improve its technological level.
The total energy consumption in Suzhou shows an overall growth trend (Figure 1). The period from 2006 to 2011 saw rapid growth. Total energy consumption increased rapidly from 50.10 million tons of standard coal in 2006 to 76.84 million tons in 2011, with an average annual growth rate of 8.93%. The period from 2012 to 2016 was the period of adjustment growth. The total energy consumption in Suzhou increased slowly from 79.58 million tons of standard coal in 2012 to 84.27 million tons in 2016. In terms of energy types, the energy structure of Suzhou is characterized by coal as the main energy type, with natural gas, oil, electricity, and other as complementary types. The proportion of raw coal and coal in Suzhou’s total energy consumption in has decreased yearly. In terms of the energy consumption sector, energy consumption in Suzhou is mainly concentrated in industry, which accounted for 80.57% in 2016. Although the industrial energy consumption continued to increase, the proportion of the total amount of the city decreased. The tracked sectors were the resident and transport sectors. Between them, the total resident energy consumption showed a growing trend, rising rapidly from 5.28% in 2006 to 6.76% in 2016. The share of energy consumption in the transportation sector increased from 3.91% in 2006 to 5.22% in 2016.
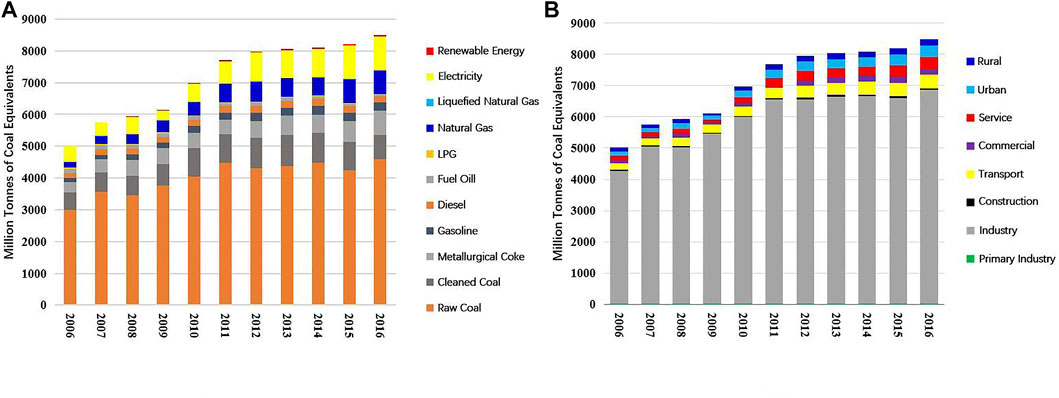
FIGURE 1. Total energy consumption of (A) different energy types in Suzhou and (B) energy consumption sectors in Suzhou.
3 Methodology and Scenario Development
3.1 Method
The LEAP model is a static energy economic and environmental model developed by the Stockholm Environment Institute in Sweden. It takes energy demand, cost analysis, and environmental impact as the research objects, predicts the energy demand, economic cost, and environmental impacts of various sectors through a mathematical model, and conducts detailed economic benefit analyses of various energy schemes.
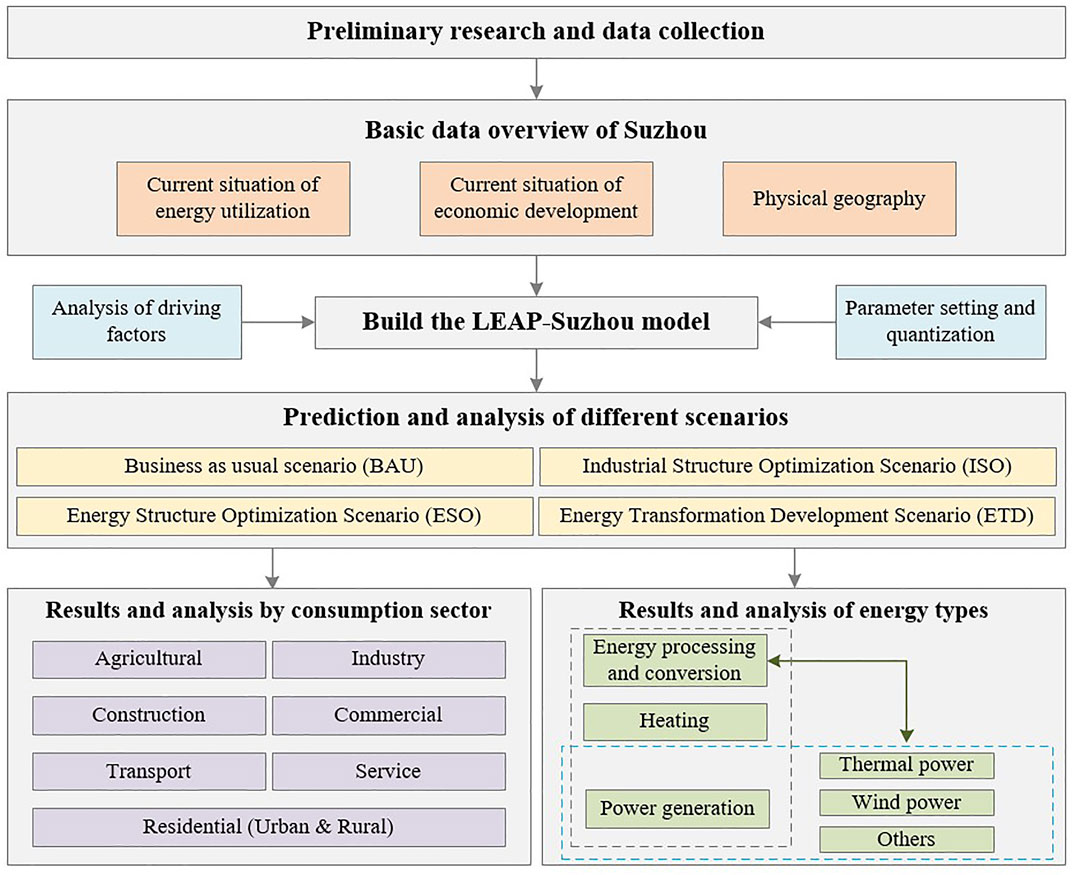
Taking Suzhou as the research object, this paper studied various types of energy consumption at the urban scale and the optimization path according to the pace of social and economic development. The energy demand of each department in Suzhou was analyzed from bottom to top by the energy supply side. Considering the actual energy resource situation in Suzhou under the constraints of the energy consumption revolution and emission reduction policies, different scenarios for adjusting the industrial structure and optimizing the energy structure were devised. At the same time, considering the development trends of various kinds of energy consumption in Suzhou under various scenarios, long-term energy consumption simulations in Suzhou for 2030, 2040, and 2050 were set up in order to achieve the goals of energy conservation, emission reduction, and consumption reduction. The overall framework is shown in Figure 2.
Relating to Suzhou’s overall situation, the statistical data of GDP, population, urbanization, energy, and electricity were collected. The current environmental carrying capacity and energy consumption of Suzhou were analyzed, and existing characteristics and potential problems in the development were analyzed to lay a foundation for the establishment of the model. The LEAP-Suzhou model was constructed using the bottom-up method, and relevant studies and policy specifications were consulted to determine the sub-links covered by each stage of the energy industry chain. Based on the present situation and development of Suzhou, the structure and main modules of the model were constructed, and Suzhou industry was divided into primary, secondary, and tertiary industry. The demand sector was divided into seven sectors: agriculture, industry, construction, transportation, commercial, services, and residential. The industrial added value and energy consumption of each sector were counted, and energy intensity was calculated. Based on the relevant state policies of Jiangsu Province and Suzhou City, we set up four different scenarios for medium and long-term simulations of energy consumption. Taking 2015 as the base year, we analyzed the respective energy consumption situations of Suzhou in 2030, 2040 and 2050. According to the settings of the different scenarios, Suzhou’s energy consumption situation from 2015 to 2050 was obtained. The appropriate scenario was then selected by comparing it with the constraint target. The scenario that was most conducive to the sustainable development of Suzhou was selected by comparing the results of each scenario, and the countermeasures suitable for the transformation of Suzhou’s energy system were proposed.
3.2 Key Assumptions and Scenario Setting
3.2.1 Input Key Assumptions
The assessment model of each scenario in LEAP included four modules: setting of key parameters; energy demand module; energy transmission–distribution loss and energy processing–conversion process; and resource module (import and export analysis of primary and secondary energy). In LEAP, key assumptions, including population development scale data, GDP development status data, and urbanization rate, are described at the initial stage (Table 1).
3.2.2 Design of Scenarios
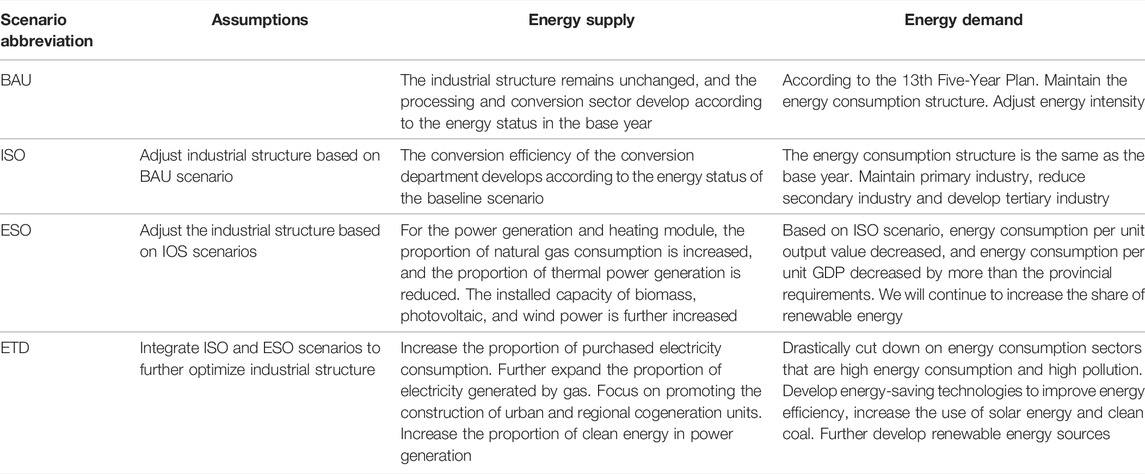
This study analyzed the long-term energy consumption of Suzhou under different scenarios based on the LEAP-Suzhou model. There were many factors that needed to be considered in the selection and design of scenarios, such as GDP growth potential, population growth potential, energy technology status, energy policy, and urban development planning of Suzhou. Based on a reasonable conception of the future development of Suzhou and by setting the above related parameters and quantifying them individually, four future development scenarios of Suzhou were set (Table 2). All scenarios, namely, the Business As Usual scenario (BAU), Industrial Structure Optimization Scenario (ISO), Energy Structure Optimization Scenario (ESO), and Energy Transformation Development Scenario (ETD), needed to meet the economic and social development needs of Suzhou (GDP, population and urban development to ensure normal development).
1) Business as usual scenario
This study set the BAU scenario as the basis of the other three scenarios, that is, not interfering with the economic development of Suzhou, meeting the current economic needs and the development objectives of the planning outline. The other three scenarios were based on the BAU scenario, in which the optimization of industrial structure and energy consumption structure and the implementation of low-carbon technologies are carried out. The specific parameters were set as follows: Under the development conditions of the key parameters of population, GDP, and urbanization rate, the industrial structure will remain unchanged during 2021–2050. We used the same power and heat production structure as in the base year. The sectoral energy consumption structure will remain unchanged, and the energy intensity of all energy consumption sectors will be adjusted in accordance with the development requirements of the 13th Five-Year Plan. The reduction of energy intensity per unit GDP will meet provincial requirements, and the energy utilization efficiency and conversion efficiency of thermal power generation, heating and other processing and conversion sectors will be developed in accordance with the energy status in the base year.
2) Industrial structure optimization scenario
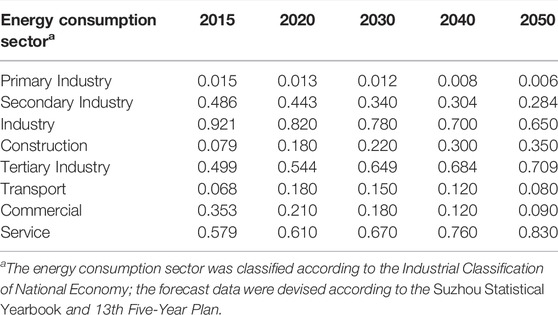
Based on the BAU scenario, the energy consumption structure in the ISO scenario will maintain the base year level. Using the same electricity and heat production structure for the base year, the sectoral energy consumption structure will remain unchanged. Energy intensity and energy efficiency in all energy consumption sectors remain the same. The conversion efficiency of thermal power generation, heat supply, and other processing and conversion departments develop according to the baseline scenario energy status. This scenario focuses on developing the tertiary industry and constantly reducing the secondary industry. Industrial structure adjustment parameters are shown in Table 3.
3) Energy structure optimization scenario
Based on the ISO scenario, to achieve energy conservation and emission reduction goals, clean coal will be developed through the renewal and transformation of energy with new equipment, scientific and technological advances, the development of renewable energy technology, and reductions in the energy consumption per unit output value and per unit GDP of various industries. In this scenario, the power generation and heating module will increase the proportion of natural gas consumption and reduce the proportion of thermal power generation, and the installed capacity of biomass, photovoltaic, and wind power is further increased. With the future power supply requirements of Jiangsu province, the scale of thermal power generation will be stable, and gas power generation will gradually establish its dominant position in power generation, and the proportion will increase to 37% in 2050. The structure of terminal energy use will change. For example, alternative energy such as natural gas will be installed in the transport sector, and the proportion will increase by 10% every 10 years. In combination with Suzhou’s energy resources, the proportion of renewable energy consumption will continue to increase. Details of parameter settings are recorded in Supplementary Table S1.
4) Energy transformation development scenario
The ETD scenario was based on the ISO and ESO scenarios to reduce the sectors with high energy consumption and high pollution. In it, advanced technologies will continue to improve energy efficiency, further develop renewable energy, and give industrial cities space to adjust their energy development. Especially in the power generation module, the share of coal-fired power generation will drop to 35% by 2050. The proportion of gas-fired power will be further increased to 48% by 2050. This scenario will promote key technologies for high-parameter supercritical (ultra-supercritical) power generation, integrated coal gasification combined cycle technology, and clean coal combustion technology, and develop distributed natural gas energy supply technology. At the same time, measures such as improving the utilization of solar energy, developing distributed photovoltaic power generation, and increasing the proportion of clean energy in power generation structures will be carried out. In this scenario, energy consumption declines the most. Details of the parameter settings are recorded in Supplementary Material.
3.3 Data Resource
The economic data of the base year were collected from the Suzhou Statistical Yearbook (2010–2016), including industrial output value and total GDP of each sector. The data of future scenarios were predicted according to the 13th Five-Year Plan of Suzhou Economic and Social Development. The population data came from the Suzhou Statistical Yearbook and the 13th Five-Year Plan for the Development of Population and Social Undertakings in Suzhou. Estimation of future population was based on historical growth trends (Ehrlich and Holdren, 1971). Among them, population growth considered the Chinese government’s two-child policy. The year 2015, the most complete year for statistical data collection, was chosen as the base year. The period from 2021 to 2050 was the time range for scenario prediction. The energy price and technology cost referred to the National Key Energy-saving and Low-carbon Technology Promotion Catalogue and the National Key Industries Cleaner Production Technical Guidance Catalogue issued by China’s Energy Statistics Bureau. The emission factors used in model construction came from the default IPCC fossil fuel emission factors of the LEAP model.
4 Result and Analysis
4.1 Energy Demand of Suzhou
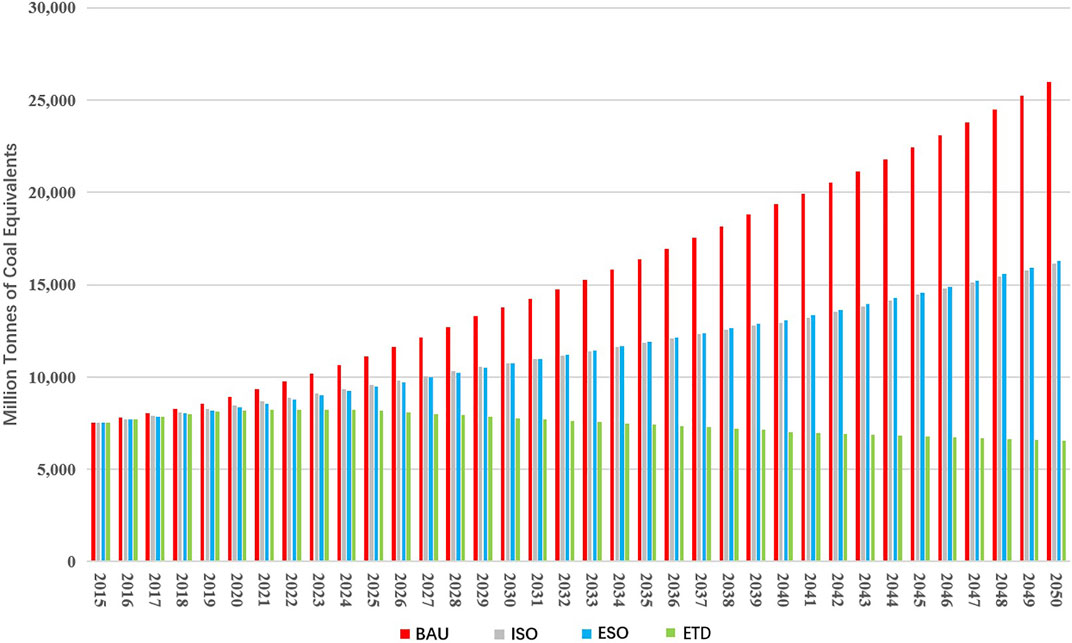
As shown in Figure 3, under the BAU scenario, ISO scenario, and ESO scenario, Suzhou’s total energy consumption rose continuously over time. The ETD scenario of energy transformation reached its peak around 2028 and then slowly declined, with the peak energy consumption of 82.31 million tons of standard coal.
The total energy demand in the BAU scenario increased from 75.40 million tons of standard coal in 2015 to 259.95 million tons in 2050, with an annual growth rate of 3.60%. The total energy demand in the ISO scenario increased from 75.40 million tons of standard coal in 2015 to 161.47 million tons in 2050, 98.48 million tons less than the BAU scenario, with an average annual growth rate of 2.25%. The total energy demand in the ESO scenario increased from 75.40 million tons of standard coal in 2015 to 162.74 million tons in 2050, with a decrease of 97.21 million tons compared with the BAU scenario and an annual growth rate of 2.22%. The total energy demand in the ETD scenario decreased from 75.40 million tons of standard coal in 2015 to 65.52 million tons in 2050, which was 194.44 million tons less than the BAU scenario. The ETD scenario was the only one of the four scenarios in which energy consumption decreased.
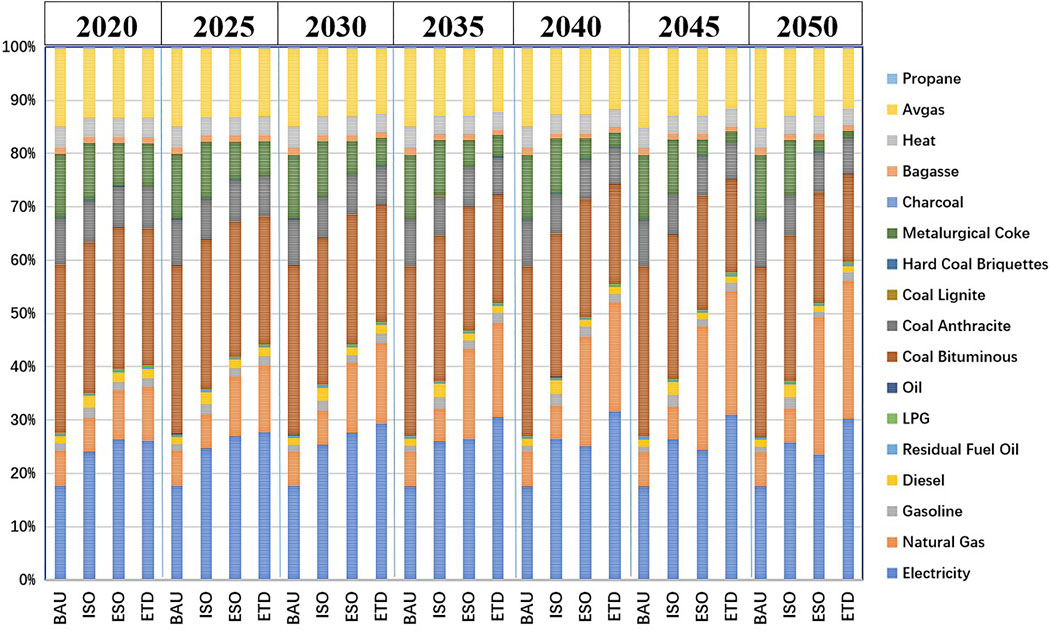
The energy use structure of the BAU scenario was basically unchanged from 2015. The consumption of coal accounted for the highest proportion, at 76.12% of the total energy consumption, natural gas was 10.57%, and electricity 5.34%. Under the policy change, the ratios of various fuel types in the four scenarios changed significantly (Figure 4). In the ISO scenario, coal dropped to 64.18% and electricity increased to 6.77%. In the ESO scenario, coal declined to 40.48%, electricity increased to 5.97%, and natural gas increased to 38.34% by 2050. In the ETD scenario, coal declined to 18.18%, electricity increased to 22.34%, and natural gas increased to 40.23% by 2050. It can be seen that, driven by various energy management policies, the proportions of raw coal and coke consumption continued decreasing, while those of electricity and natural gas continued rising (Zhu, 2006; Su et al., 2013; Zhang, 2018). Through the comparative analysis of the four scenarios, the total energy consumption under the BAU scenario, ISO scenario, and ESO scenario showed sharp yearly upward trends, which did not allow Suzhou to take the path of sustainable energy development and was not conducive to the construction of a green, low-carbon, environmental protection and energy-saving society in Suzhou. The ETD scenario reached its peak and appeared at an inflection point, which was suitable for Suzhou’s path of energy transformation development.
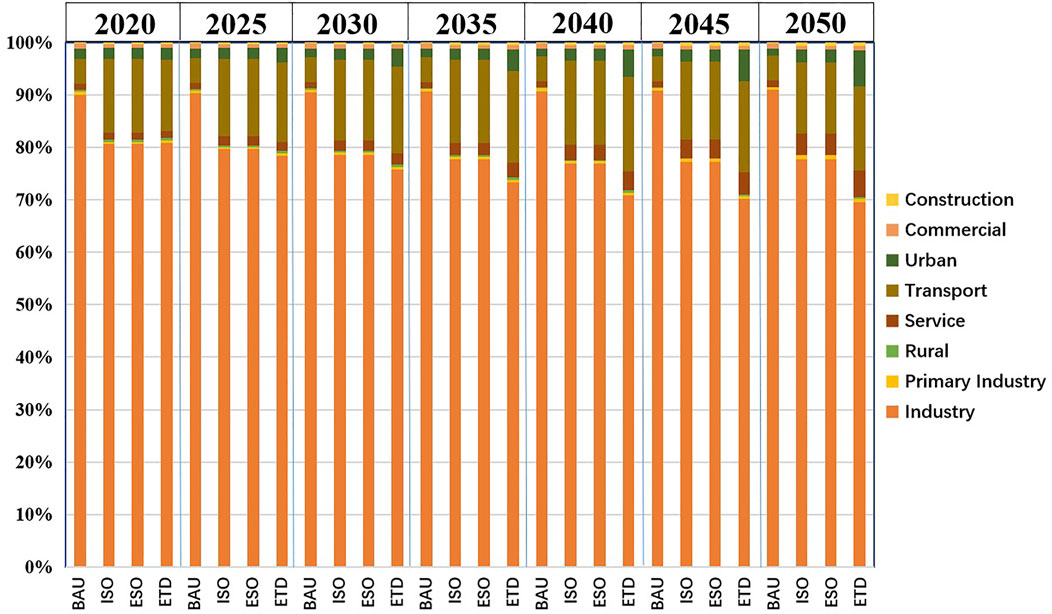
As can be seen from the consumption levels of various sectors (Figure 5), in the BAU scenario, the secondary industry consumed the most energy, followed by the tertiary industry. With the development of the scenario, the energy consumption proportion of the industrial sector gradually rose, indicating that industry will always play a leading role in energy consumption. Under the BAU scenario, by 2050 the industrial energy consumption of Suzhou reached 22.996 million tons of standard coal, nearly four times that of 2015, and the industrial energy consumption accounted for 88.62%. In the ISO scenario, the tertiary industry developed rapidly and its proportion increased yearly, but the secondary industry still accounted for a large proportion of energy consumption, and the industrial sector still played a leading role. By 2050, the industrial sector consumption was 109.47 million tons of standard coal, accounting for 69.54% of the total energy consumption of all sectors. In the ESO scenario, industrial energy consumption still comprised the largest proportion, at 68.08% by 2050. The other services sector showed a clear upward trend, with an increase of 3.9919 million tons of standard coal compared to the BAU scenario. The transport sector was on the rise, from 4.06 million tons of standard coal in 2015 to 33.15 million tons in 2050. Under the ESO scenario, Suzhou’s energy use structure gradually became environmental and clean energy grew rapidly, which provided positive policy suggestions for low-carbon development in Suzhou, but its total energy consumption still showed a long-term growth trend. Under the ETD scenario, the proportion of energy consumption in the industrial sector continued to decline by 2050, with the industrial sector accounting for 53.05%, down 23.07% compared with the base year. The proportion of energy consumption in the residential and service sectors continued to rise, while in the construction and commercial sectors it rose slowly and in agriculture declined slightly. In the ETD scenario, clean energy in Suzhou grew rapidly and energy use gradually became environmental, which provided positive policy suggestions for low-carbon development. This scenario was suitable for the low-carbon and environmentally friendly development of Suzhou.
4.2 Energy Supply of Suzhou
The energy demand of Suzhou’s energy processing and conversion sectors under each scenario is shown in Figure 6. It can be seen that the long-term energy demand trend of the processing and conversion sectors was basically the same as the trend of energy demand. In BAU, ISO, and ESO scenarios, the transmission and distribution losses and the conversion rates of energy processing basically maintained long-term stability, and the energy consumption of the energy processing and conversion sectors increased yearly. However, the energy consumption in the ESO scenario was higher than that in the ISO scenario in the processing and conversion process. This was mainly due to energy consumption in the ESO scenario needing more power because of the limited technology level, and more initial fuel needed to be invested in the process of processing and conversion. In the ETD scenario, Suzhou adopted a series of positive policies and measures, adopted advanced technologies, reduced the loss rate of transmission and distribution, improved the conversion rate of processing, and significantly reduced the energy consumption compared with the other three scenarios. No policy changes were made in the BAU scenario. By 2050, coal-fired power accounted for 91.53% of thermal power generation, and gas-fired power accounted for 8.47%, with coal at 81.41% of total power generation energy consumption. The policy adjustment of the ISO scenario was basically consistent with BAU. In the ESO scenario, the purchase of natural gas and electricity increased from adjusting the energy structure. In the power generation module, the proportion of gas power generation was further improved, and gas power generation accounted for 28% of the total power generation by 2030 and 37% by 2050. In the ETD scenario, high energy consumption and high-pollution fuels were further reduced, and the ratio of gas-fired power generation further increased compared with the ESO scenario, with the proportion of gas-fired power generation reaching 35% by 2030 and 48% by 2050.
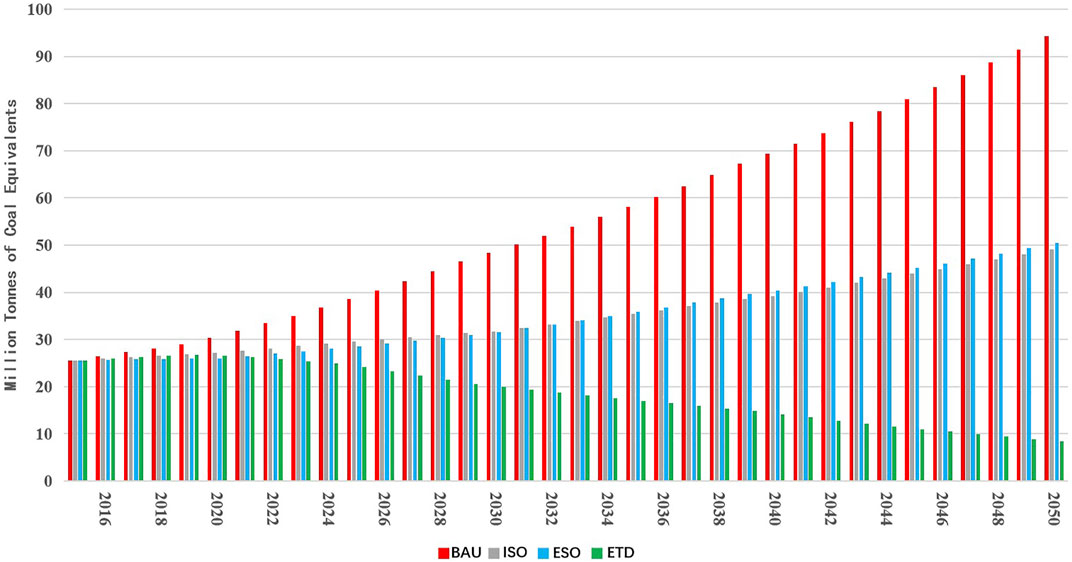
FIGURE 6. Energy consumption in the different scenarios during the process of processing and conversion.
4.3 Energy Flows
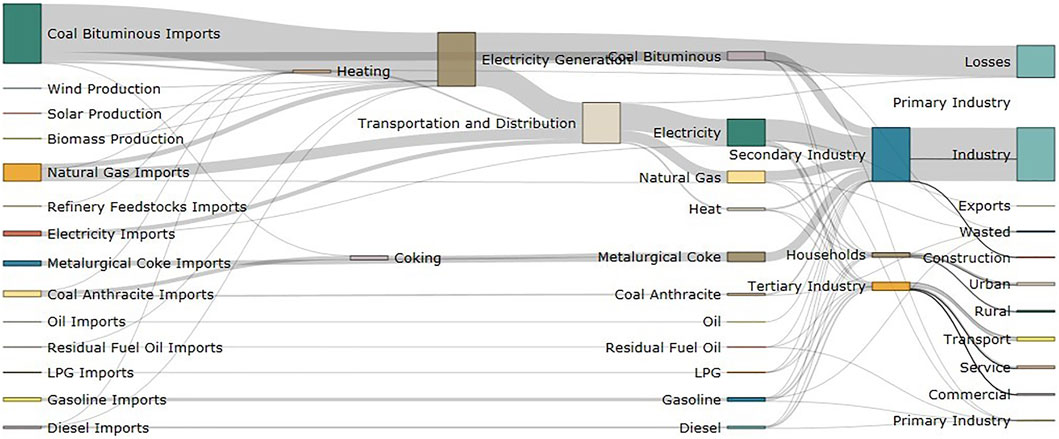
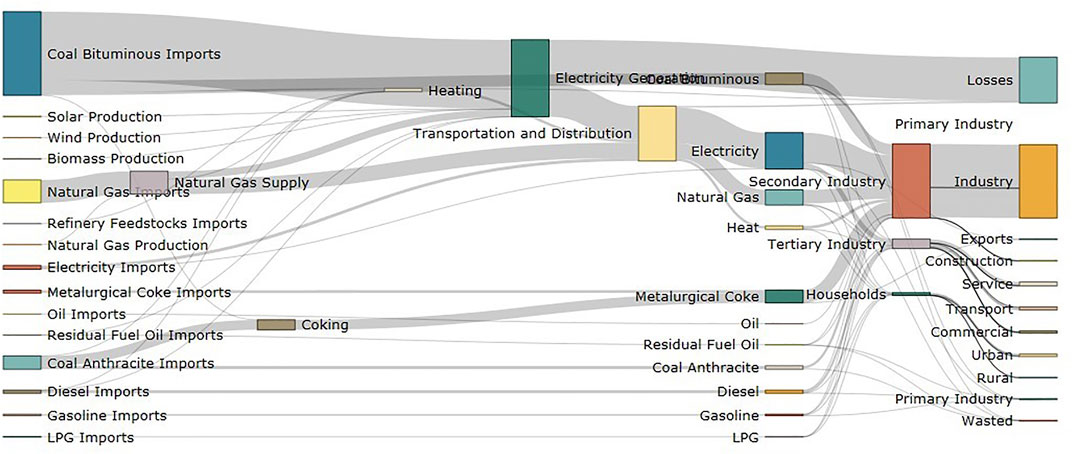
According to the energy flow in 2015 (Figure 7), in the base year the consumption of coal accounted for 76.12% of the total energy consumption of the whole society, natural gas accounted for 10.57%, and electricity accounted for 5.34%. In the energy processing and conversion sector, coal-fired power generation was the main type. In terms of energy consumption by sector, industry, transport, and urban living accounted for 86.97, 5.38, and 2.69% of the total energy consumption.
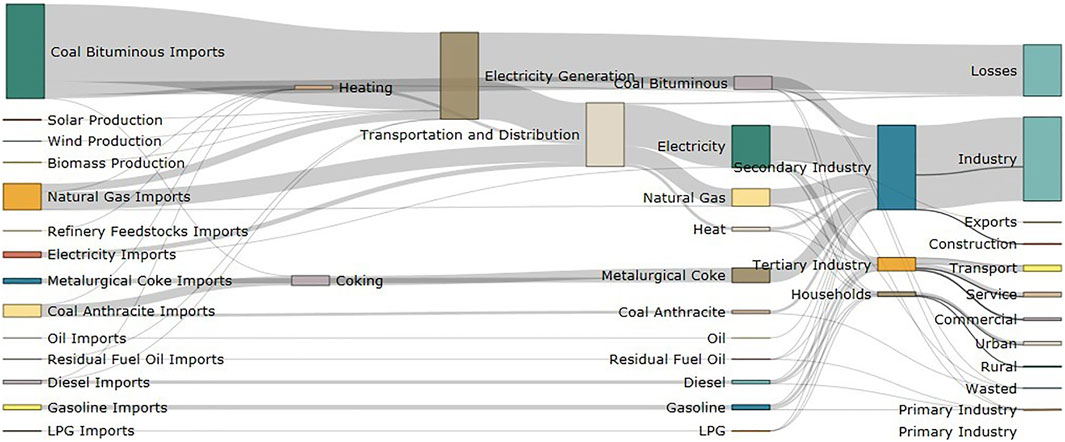
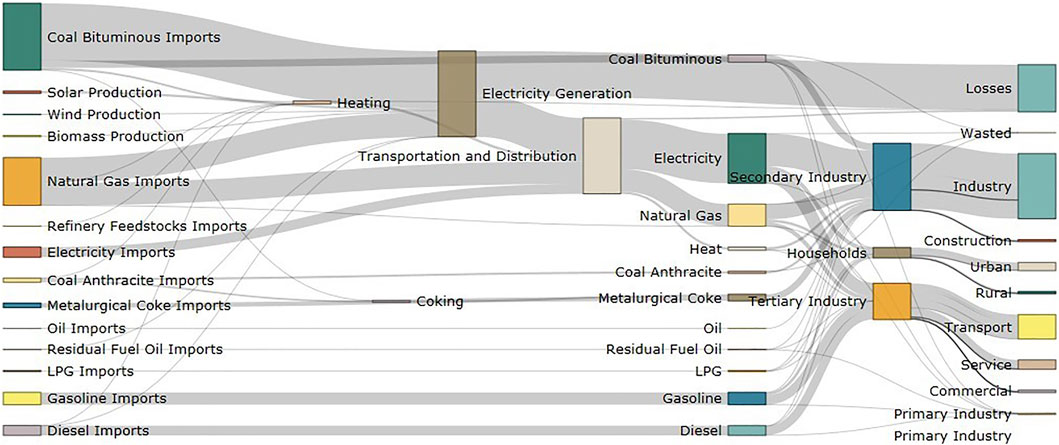
The BAU scenario was planned in accordance with existing policies and development trends, and the future energy consumption of all sectors and the composition of all types of energy were basically similar to that of the base year (Figures 8, 9). In the BAU scenario, coal still comprised the highest proportion of energy consumed in the future, and thermal power generation was still the main power generation component, and its future energy flow composition was similar to that of 2015.
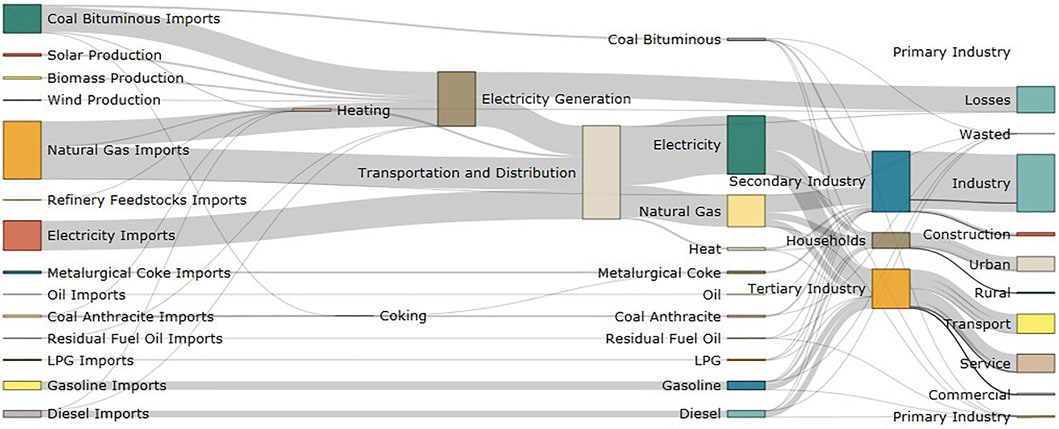
After the adjustment of industrial structure, the total future energy consumption in the ISO scenario was significantly reduced. Although the proportion of coal was still the highest, it was reduced more significantly than that in the BAU scenario. The share of non-fossil energy consumption did not increase significantly. Of the various sectors, the energy consumption of the industrial sector decreased significantly. Based on the ISO scenario, the ESO scenario focused on the energy structure adjustment of the energy sectors. In this scenario, clean coal was implemented, the proportion of natural gas increased, and renewable energy was gradually developed. The import of natural gas increased, the proportion of renewable energy increased, the non-fossil proportion of the total energy consumption increased yearly, and the proportion of industrial energy consumption decreased. Based on the above scenarios, the ETD scenario continued increasing the use of natural gas to replace coal consumption, and the proportion of coal consumption further decreased. There was also a greater use of electricity and natural gas in energy consumption sectors, and the proportion of energy consumption in the industrial sector also showed a downward trend. Energy flow changes in the ETD scenario were the most complex, and energy flow diagrams for the ETD scenario are presented in Figures 10, 11.
4.4 Carbon Emission
According to the direct and indirect carbon dioxide emissions generated by various sectors in Suzhou from 2020 to 2050 (Figure 12), it can be seen that the carbon emissions of various scenarios varied greatly. In the BAU scenario, carbon dioxide emissions were on the rise, with no inflection point, from 198.1 Mt in 2015 to 677.6 Mt in 2050. This indicated that environmental problems become serious when no measures are taken to reduce emissions. The carbon dioxide emission of the ISO scenario still showed an increasing trend, but the growth trend slowed down. Compared with the BAU scenario, carbon emission in 2050 decreased by 341 Mt, which failed to reach the final goal of carbon emission reduction in Suzhou. In the ESO scenario, the growth trend of carbon dioxide emissions showed an inflection point around 2030 and then declined. Carbon emissions in 2050 were similar to those in 2015 without a significant decrease, indicating that reasonable adjustment of the consumption structure can reduce carbon emissions. In the ETD scenario, carbon dioxide emissions showed a trend of first increasing and then decreasing, reaching the peak of carbon emissions during 2025–2030, and then showing a significant downward trend. Carbon emissions in 2050 were only 58.5 Mt, indicating that energy system optimization can effectively control carbon emissions caused by energy consumption. This was the best scenario for achieving a reduction in carbon dioxide emissions. In all scenarios, the sector that produced the most carbon emissions was the industry sector, followed by the transport sector. In terms of energy types, heavy consumption of hard coal was the main source of carbon emissions. This showed that while optimizing and upgrading the industrial structure, we should consider the technological upgrading and the use of clean energy in the process transformation industry and further expand the use of renewable energy, so as to jointly reduce carbon dioxide emissions and achieve the construction of carbon emission reduction targets in Suzhou.
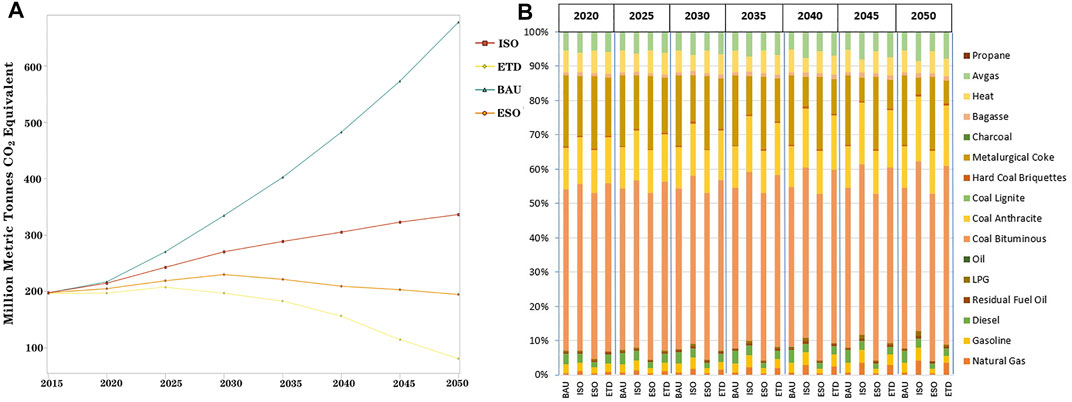
FIGURE 12. (A) CO2 emission of all scenarios in Suzhou and (B) share of carbon emissions by energy types and consumption sectors.
5 Discussion
This paper established the LEAP-Suzhou model under the constraint of carbon emissions. Four scenarios were set to study the important factors affecting urban energy system. The ISO scenario focused on the tertiary, secondary, and primary industrial structure optimization, led by the tertiary industry. The ESO scenario focused on the energy structure optimization that replaced coal with gas and renewable energy. In the ETD scenario, based on the optimization of the industrial and energy structures, the proportions of purchased clean electricity, purchased natural gas, and local renewable consumption continued to increase, and the energy utilization efficiency further improved. Specifically:
Most carbon emissions and energy consumption come from the industry sector. With the improvement of people’s living standards and the development of tertiary industry, energy consumption in areas such as electricity production and supply, transportation, and households is expected to increase further. The average annual growth rates of total energy demand in the BAU, IOS and ESO scenarios were 3.6, 2.25, and 2.22%, respectively, and the total energy consumption in these three scenarios showed a sharp yearly upward trend, which did not allow Suzhou to take the path of sustainable energy development. In the ETD scenario, the total energy demand decreased from 75.40 million tons of standard coal in 2015 to 65.52 million tons in 2050, 194.44 million tons less than the BAU scenario. This scenario appeared to be at an inflection point around 2028, followed by a decline in energy consumption, which was a suitable path for Suzhou’s energy transformation development. At the same time, in the ETD scenario, the proportion of high-energy-consuming industries gradually decreased, the proportion of renewable energy consumption continued to rise, the proportion of natural gas and outsourced electricity consumption increased substantially, and the industrial and energy structures gradually moved from medium-high level to high level. The carbon emission reduction effect of energy reform in Suzhou was remarkable. From the perspective of carbon emissions, both the BAU scenario and the ISO scenario showed an increasing trend of emissions, which was not conducive to the future development of Suzhou. The optimal scenario of energy consumption structure peaked around 2030 and then declined. This scenario achieved the effect of emission reduction, but the emission reduction degree in 2050 was not high. The ETD scenario reached the peak of emissions from 2025 to 2030, followed by an obvious downward trend. This scenario effectively realized the optimization of energy system emission reduction and was the most suitable for the long-term development of Suzhou.
There are several limitations to this study. First, 2015 was the base year. The data were not currently up-to-date, but they were the most complete and detailed data we could obtain. Most of the key parameters were based on existing planning or trend extrapolation, which cannot accurately predict future changes. So, the prediction result was uncertain. The actual energy consumption and carbon emission coefficients of ferrous metal smelting, iron and steel, coking, and other specific types of equipment were insufficient. The energy consumption and carbon emissions of each device could not be accounted for. The LEAP model was based on data but could not capture the spatial distribution of specific sectors. This study referred to previous studies but focused on the benchmark scenario of energy-saving and emission reduction benefit analysis under the comprehensive scenario of industrial structure optimization, energy structure optimization, and low-carbon technology. It did not measure absolute numbers but looked at relative trends across sectors. In future work, field investigations of specific sectors and equipment are needed.
6 Conclusion and Policy Implications
6.1 Conclusion
Taking Suzhou as an example, this paper established the LEAP-Suzhou model under the constraint of carbon emissions to research the important factors affecting future urban energy policies. Four scenarios were set. In addition to the BAU scenario, reference scenarios with 2015 as the base year were set. The ISO scenario was dominated by the optimization of the industrial structure, the ESO scenario was dominated by the optimization of the energy structure, and the ETD scenario was dominated by energy reform. The results indicated that most carbon emissions and energy consumption come from the industry sector, and the industrial structure policies, energy structure upgrading policies, energy efficiency improvement policies, and key technologies implemented by the LEAP-Suzhou model will significantly affect energy consumption and carbon emissions. Among them, the total energy demand of the ETD scenario decreased from 75.40 million tons of standard coal in 2015 to 65.52 million tons in 2050, 194.44 million tons less than the BAU scenario. This scenario effectively realizes the emission reduction optimization of the energy system and is most suitable for the long-term development of energy transformation development path of Suzhou. The research results successfully explore the path of energy and carbon emission optimization in Suzhou city, which can provide reference for the energy transformation of industrial cities and the realization of carbon peak and carbon neutrality, and provide strong support for the realization of regional sustainable development.
6.2 Policy Implications
Based on the LEAP-Suzhou model, this paper studied the trend in energy carbon emissions from energy production and consumption in Suzhou. The description of the energy flow path and key nodes is of guiding and theoretical significance to medium and long-term urban energy planning (Zhang and Lin, 2012; Al-mulali et al., 2013). Through a comparative analysis, the total energy consumption under the BAU, ISO and ESO scenarios showed a trend of sharp yearly increases, which was not conducive to Suzhou taking the road of sustainable energy development and to the construction of a green, low-carbon, environmental protection and energy-saving Suzhou. The ETD scenario reached its peak and appeared at an inflection point, which was suitable for Suzhou’s energy transformation development path.
Therefore, in order to realize the low-carbon development of Suzhou, specific policies and measures are proposed for various sectors:
The supply and application of clean energy should be gradually improved, which will conform to the development direction of the future city energy system (Lin, 2018). Currently, biomass power generation continues to grow rapidly, with solar and wind energy entering the energy consumption system in 2011 and 2014, respectively. The proportion of renewable energy (photovoltaic, biomass, wind power) continues to rise, and the outsourcing of electricity continues to grow. In the ETD scenario, the proportion of renewable energy consumption continued to rise, and the proportion of natural gas and outsourced electricity consumption increased significantly. The industrial and energy structures gradually moved from medium-high to high level. The carbon emission reduction effect of energy reform in Suzhou has been remarkable, and the city has entered a new stage of high-quality development. The gradual improvement in the clean energy supply and application should be a main direction of Suzhou’s energy system reform in the future (Bi et al., 2011).
At present, this is one of the best paths for Suzhou’s energy transformation, which is mainly based on cross-regional optimal allocation and supplemented by local development and utilization (Zhang et al., 2015). Suzhou is extremely short of local conventional primary energy and renewable resource endowment. The energy system of Suzhou has gradually changed from the previous “local thermal power generation (coal and fuel oil) + local coking” to the cross-regional optimal allocation mode of “trans-regional purchased power generation + local thermal power generation (coal, natural gas, and fuel oil) + purchased coke + renewable energy generation.” However, there remains a large gap between Suzhou’s trans-regional energy allocation capacity and that of first-tier cities such as Beijing, Shanghai, Guangzhou, and Shenzhen. In the future, Suzhou energy transformation should focus on cross-regional optimal allocation and improve the ability of the city’s high-quality resource allocation.
Product structure adjustment based on industrial structure optimization is one of the best paths for Suzhou’s energy system transformation (Zu and Wang, 2019). Suzhou is currently in the critical period of industrial structure transformation (Jiang and Lin, 2012), with tertiary industry and secondary industry leading together. Computers, electrical machinery, steel, general equipment, chemical industry, and transportation equipment were the six new leading industries in Suzhou from 2015 to 2017. Suzhou should actively adjust the production and trade structure of energy-consuming industries and products, so as to promote industrial products to the upper reaches of the whole industrial chain, increase their added value, and reduce their energy consumption (Lang and Chen, 2019). At the same time, the industrial structure in Suzhou should be actively promoted; the industry of Suzhou should develop to the upstream and improve the level of technology and value-added rate.
The new normal economy, new forms of energy, and efficient energy management have moved the urban energy system to the stage of multi-objective and high-quality development. Suzhou’s energy system has undergone three stages of ensuring supply, ensuring supply and controlling safety, and ensuring supply and improving efficiency, and has stepped onto the stage of multi-objective and high-quality development. Under the new normal economy, Suzhou, as a large energy consumption market with scarce resources, faces the pressure of double control of total energy consumption and consumption intensity. In the absence of new external energy channels, strict control of coal consumption, and unstable supply of natural gas, energy consumption efficiency, a clean energy supply, and optimal operation of the energy system are required to meet the higher requirements for efficient energy management (Kennedy et al., 2014). The urban energy Internet is a platform for the interconnection, comprehensive utilization, optimization, and sharing of all kinds of energy in the city, centering on electricity. Through the cross-border integration of talents, technologies, services and policies, new technologies and business models will be stimulated to foster new businesses, new forms of business, and a new economy in the field of urban energy (Zheng et al., 2010). First, the urban energy Internet promotes the development of power generation enterprises, equipment suppliers, electricity companies, and other upstream and downstream enterprises. Second, the urban energy Internet also greatly promotes the integration of the communication industry, Internet industry, law, finance, capital, and other fields in the city, and drives the innovation and development of relevant manufacturing and production-oriented services.
Data Availability Statement
The original contributions presented in the study are included in the article/Supplementary Material, further inquiries can be directed to the corresponding author.
Author Contributions
WS and YZ contributed to all aspects of this work; ZL and WS conducted data analysis, YZ and ZL wrote the main manuscript text; YY and CC gave some useful comments and suggestions to this work. All authors reviewed the manuscript.
Funding
This work was supported by State Key Laboratory of Resources and Environmental Information System, Guangdong Introducing Innovative and Entrepreneurial Teams (2019ZT08L213) and Guangdong Basic and Applied Basic Research Foundation (2020A1515011230).
Conflict of Interest
The authors declare that the research was conducted in the absence of any commercial or financial relationships that could be construed as a potential conflict of interest.
Publisher’s Note
All claims expressed in this article are solely those of the authors and do not necessarily represent those of their affiliated organizations, or those of the publisher, the editors and the reviewers. Any product that may be evaluated in this article, or claim that may be made by its manufacturer, is not guaranteed or endorsed by the publisher.
Acknowledgments
We like to thank the editors and reviewers for their helpful remarks.
Supplementary Material
The Supplementary Material for this article can be found online at: https://www.frontiersin.org/articles/10.3389/fenvs.2022.905471/full#supplementary-material
References
Al-mulali, U., Fereidouni, H. G., Lee, J. Y. M., and Sab, C. N. B. C. (2013). Exploring the Relationship between Urbanization, Energy Consumption, and CO2 Emission in MENA Countries. Renew. Sustain. Energy Rev. 23, 107–112. doi:10.1016/j.rser.2013.02.041
Bi, J., Zhang, R., Wang, H., Liu, M., and Wu, Y. (2011). The Benchmarks of Carbon Emissions and Policy Implications for China's Cities: Case of Nanjing. Energy Policy 39, 4785–4794. doi:10.1016/j.enpol.2011.06.045
Chai, Q. M., Guo, H. Y., Liu, C. Y., Dong, L., Ju, L. X., Liu, C. S., et al. (2020). Global Climate Change and China's Action Scheme: Climate Governance of China in the 14th Five-Year Plan Period from 2021 to 2025(Conversation by Writing). Yuejiang Acad. J. 12, 36–58. doi:10.13878/j.cnki.yjxk.20210107.001
Chu, S., and Majumdar, A. (2012). Opportunities and Challenges for a Sustainable Energy Future. Nature 488, 294–303. doi:10.1038/nature11475
Deng, M. X., and Li, W. (2017). Scenario Analysis of the Supply-Side Structural Reform Influences on Industrial Carbon Emissions Based on LEAP Model in Yunnan Province. China Environ. Sci. 37, 786–794. doi:10.3969/j.issn.1000-6923.2017.02.053
Ehrlich, P. R., and Holdren, J. P. (1971). Impact of Population Growth. Science 171, 1212–1217. doi:10.1126/science.171.3977.1212
He, J. K. (2014). Situation and Countermeasures of Energy Development and Climate Change in China. Econ. Rev. J. 5, 16–20. doi:10.16528/j.cnki.22-1054/f.2014.05.001
Hong, S., Chung, Y., Kim, J., and Chun, D. (2016). Analysis on the Level of Contribution to the National Greenhouse Gas Reduction Target in Korean Transportation Sector Using LEAP Model. Renew. Sustain. Energy Rev. 60, 549–559. doi:10.1016/j.rser.2015.12.164
Hu, G., Ma, X., and Ji, J. (2019). Scenarios and Policies for Sustainable Urban Energy Development Based on LEAP Model - A Case Study of a Postindustrial City: Shenzhen China. Appl. Energy 238, 876–886. doi:10.1016/j.apenergy.2019.01.162
Jiang, Z., and Lin, B. (2012). China's Energy Demand and its Characteristics in the Industrialization and Urbanization Process. Energy Policy 49, 608–615. doi:10.1016/j.enpol.2013.04.059
Kennedy, C. A., Ibrahim, N., and Hoornweg, D. (2014). Low-carbon Infrastructure Strategies for Cities. Nat. Clim. Change 4, 343–346. doi:10.1038/nclimate2160
Lang, W., and Chen, Y. Z. (2019). Empirical Analysis of Energy Consumption Structure of China's High Energy Consumption Industry. Econ. Rev. J. 4, 95–102. doi:10.16528/j.cnki.22-1054/f.201904095
Le, Q. C., Andrew, R. M., Friedlingstein, P., Sitch, S., and Zhu, D. (2018). Global Carbon Budget 2017. Earth Syst. Sci. Data. 10, 405–448. doi:10.5194/essd-10-405-2018
Li, N., Yang, J. S., and Chen, J. R. (2021a). Opportunities and Challenges of Energy Industry under the Background of "Carbon Emission Peak" and "Carbon Neutrality. Nat. Resour. Econ. China 34, 63–69. doi:10.19676/j.cnki.1672-6995.000688
Li, Q., Hu, J., and Yu, B. (2021b). Spatiotemporal Patterns and Influencing Mechanism of Urban Residential Energy Consumption in China. Energies 14, 3864. doi:10.3390/en14133864
Liao, Y., and Wu, G. (2013). Carbon Emission Analysis of Energy Consumption of Industrial Enterprises above Designated Size in Suzhou. China J. Commer. 14, 176–178. doi:10.1007/s11069-019-03607-2
Lin, B. Q. (2018). The Period of Carrying Out Energy Revolution to Promote Low Carbon Clean Development in China. China Ind. Econ. 6, 15–23. doi:10.19581/j.cnki.ciejournal.2018.06.002
Liu, H., Lu, W. H., and Wei, J. (2019). Research on Innovation and Development Status and Promotion Countermeasures of Industrial Enterprises in Suzhou. North. Econ. Trade 4, 117–119. doi:10.1155/2021/8473021
Liu, J. B. (2021a). Carbon Neutralization: Building a Community of Human and Natural Life Together. Fujian For. 4, 1. doi:10.3969/j.issn.1003-4382.2021.04.002
Liu, Q., Wang, Q., and Wang, Y. (2016). Climate Financing in the Era of Paris Agreement: Global Progress, Governance Challenges and China's Countermeasures China Population. Resour. Environ. 26, 14–21. doi:10.3969/j.issn.1002-2104.2016.12.003
Liu, T., Wang, R., and Sun, B. J. (2015). Analysis on Peaking of Carbon Emission in Typical Coastal Lndustrial Cities of China. China Popul. Resour. Environ. 25, 25–28. doi:10.1371/journal.pone.0258147
Liu, Y. M., Timothy, O. R., and Li, J. Y. (2021b). Exploring the Relationship between Urbanization and Resource-Environment from the Decoupling Perspective: A Case Study of Suzhou. J. Suzhou Univ. Sci. Technol. Sci. Ed. 38, 71–78. doi:10.1007/s11356-021-15161-1
Liu, Z. F., Huang, H. H., Li, L., and Liu, Y. (2022). Green Manufacturing: the Inevitable Choice of Manufacturing Industry under the Goal of Carbon Peak and Carbon Neutralization. Metal. Work. Metal. Cut. 1, 15–19. doi:10.3969/j.issn.1674-1641.2022.01.014
Nieves, J. A., Aristizábal, A. J., Dyner, I., Báez, O., and Ospina, D. H. (2019). Energy Demand and Greenhouse Gas Emissions Analysis in Colombia: A LEAP Model Application. Energy 169, 380–397. doi:10.1016/j.energy.2018.12.051
Nuta, F. M., Nuta, A. C., Zamfir, C. G., Petrea, S. M., Munteanu, D., and Cristea, D. S. (2021). National Carbon Accounting—Analyzing the Impact of Urbanization and Energy-Related Factors upon CO2 Emissions in Central–Eastern European Countries by Using Machine Learning Algorithms and Panel Data Analysis. Energies 14, 2775. doi:10.3390/en14102775
Pan, L. J., Xie, Y. B., and Li, W. (2013). An Analysis of Emission Reduction of Chief Air Pollutants and Greenhouse Gases in Beijing Based on the LEAP Model. Procedia Environ. Sci. 18, 347–352. doi:10.1016/j.proenv.2013.04.045
Ponce, P., and Khan, S. A. R. (2021). A Causal Link between Renewable Energy, Energy Efficiency, Property Rights, and CO2 Emissions in Developed Countries: A Road Map for Environmental Sustainability. Environ. Sci. Pollut. Res. 28, 37804–37817. doi:10.1007/s11356-021-12465-0
Shao, S., Yang, L., Yu, M., and Yu, M. (2011). Estimation, Characteristics, and Determinants of Energy-Related Industrial CO2 Emissions in Shanghai (China), 1994-2009. Energy Policy 39, 6476–6494. doi:10.1016/j.enpol.2011.07.049
Su, Y. J., Zheng, Z. B., Liu, B., and Bao, Y. (2013). Study on Influencing Factors and Countermeasures of Industrial Carbon Emission in Suzhou. China J. Commer. 17, 188–190. doi:10.3969/j.issn.1005-5800.2013.17.088
Sun, H., Hu, X. Y., and Nie, F. F. (2019). Spatio-temporal Evolution and Socio-Economic Drivers of Primary Air Pollutants from Energy Consumption in the Yangtze River Delta. Chin. J. Environ. Manag. 11, 71–78. doi:10.16868/j.cnki.1674-6252.2019.04.071
Wang, H. Z. (2016). Scenario Prediction of Tianjin Transportation Energy Consumption and Carbon Emission. J. Arid Land Resour. Environ. 30, 37–41. doi:10.13448/j.cnki.jalre.2016.212
Wang, S. H., He, M. X., Zhang, W., and Liu, X. N. (2021a). Research on Industrial Energy Intensity and Lts Influencing Factors in Beijing-Tianjin-Hebei Urban Agglomeration from the Perspective of Supply-Side Reform. Geogr. Geo-Information Sci. 37, 110–116. doi:10.1016/j.egyr.2022.02.283
Wang, Y., Tan, D. M., Zhang, J. T., Meng, N., Han, B. L., and Ouyang, Z. Y. (2020). The Impact of Urbanization on Carbon Emissions: Analysis of Panel Data from 158 Cities in China. Acta Eco Sin. 40, 7897–7907. doi:10.5846/stxb201911292591
Wang, Y., Zhao, H., Li, L., Liu, Z., and Liang, S. (2013). Carbon Dioxide Emission Drivers for a Typical Metropolis Using Input-Output Structural Decomposition Analysis. Energy Policy 58, 312–318. doi:10.1016/j.enpol.2013.03.022
Wang, Y. Z., Lin, W., Li, C. Y., Zhu, Y. L., Zhang, J., and Gao, F. (2021b). Comprehensive Evaluation of Energy Transition in Industrial Cities: A Case Study of Suzhou. J. Glob. Energy Interconnect. 4, 188–196. doi:10.3390/su8080746
Watts, N., Adger, W. N., Agnolucci, P., Blackstock, J., Byass, P., Cai, W., et al. (2015). Health and Climate Change: Policy Responses to Protect Public Health. Lancet 386 (10006), 1861–1914. doi:10.1016/S0140-6736(15)60854-6
Wu, X. P. (2019). Practice and Enlightenment of Development of Lnternational Low-Carbon City. Res. Dev. 5, 44–52. doi:10.13483/j.cnki.kfyj.2019.05.007
Xie, L. L., and Sun, H. X. (2021). The Evolution of Coordinated Development Mechanisms of Urban Agglomeration in Yangtze River Delta. Shanghai Econ. 5, 39–61. doi:10.3969/j.issn.1000-4211.2021.05.004
Xu, P., Shao, L., Geng, Z., Guo, M., Wei, Z., and Wu, Z. (2019). Consumption-Based Carbon Emissions of Tianjin Based on Multi-Scale Input-Output Analysis. Sustainability 11, 6270. doi:10.3390/su11226270
Yang, Y. M. (2021). The Source Apportionment of VoCs and Countermeasures and Suggestions for Emission Reduction in an Industrial City in Western China. Thesis. Lanzhou: Lanzhou University. doi:10.27204/d.cnki.glzhu.2021.000917
Zhang, C., and Lin, Y. (2012). Panel Estimation for Urbanization, Energy Consumption and CO2 Emissions: A Regional Analysis in China. Energy Policy 49, 488–498. doi:10.1016/j.enpol.2012.06.048
Zhang, H. (2018). Challenges Faced by Jiangsu in Developing "green Energy Substitution. Real. Only 12, 71–72. doi:10.3969/j.issn.1004-1605.2018.12.019
Zhang, L. H., Xiong, J., Ju, L. W., Wu, H. L., and Tan, Z. F. (2015). An Optimization Model for Inter-regional Energy Allocation under Consideration of Clean Energy. J. Hunan Univ. Nat. Sci. 42, 71–77. doi:10.16339/j.cnki.hdxbzkb.2015.04.011
Zhang, T. Z. (2021). Discussion on the Current Situation and Development Trend of Energy Utilization in China. Territ. Nat. Resour. Study 5, 76–78. doi:10.16202/j.cnki.tnrs.2021.05.019
Zheng, Y. F., Li, H. T., Wu, R. J., and Wang, L. X. (2010). The Impact of Technological Progress on China's CO2 Impact of Emission Reduction. Chin. Sci. Bull. 55, 1555–1564. doi:10.1007/s11434-010-3241-1
Zhu, C. J. (2006). Analysis of Energy Consumption and Sustainable Development Strategy in Suzhou. Energy China 12, 34–37. doi:10.3969/j.issn.1003-2355.2006.12.009
Zhu, C. X., Xi, W. M., Sun, Q., Chen, J. J., Xie, D., Chen, Q., et al. (2020). Energy Transition Path for Urban Areas under New-type Urbanization: A Case Study on Suzhou City Wuzhong District. Electr. Power 53, 232–240. doi:10.11930/j.issn.1004-9649.201911057
Keywords: energy planning, industrial city, LEAP model, carbon emission, scenario analysis
Citation: Sun W, Zhao Y, Li Z, Yin Y and Cao C (2022) Carbon Emission Peak Paths Under Different Scenarios Based on the LEAP Model—A Case Study of Suzhou, China. Front. Environ. Sci. 10:905471. doi: 10.3389/fenvs.2022.905471
Received: 27 March 2022; Accepted: 27 April 2022;
Published: 10 May 2022.
Edited by:
Jingying Fu, Institute of Geographic Sciences and Natural Resources Research (CAS), ChinaReviewed by:
Xun Zhang, Beijing Technology and Business University, ChinaYonghui Huang, China University of Petroleum, China
Copyright © 2022 Sun, Zhao, Li, Yin and Cao. This is an open-access article distributed under the terms of the Creative Commons Attribution License (CC BY). The use, distribution or reproduction in other forums is permitted, provided the original author(s) and the copyright owner(s) are credited and that the original publication in this journal is cited, in accordance with accepted academic practice. No use, distribution or reproduction is permitted which does not comply with these terms.
*Correspondence: Zeng Li, bGl6ZW5nNDAwMDQyM0BnZHV0LmVkdS5jbg==
†These authors have contributed equally to this work
 Wenjie Sun
 Yi Zhao
 Zeng Li
 Yitong Yin
 Chenglong Cao