 Xuecheng Wang
 Yalin Zhou
95% of researchers rate our articles as excellent or good
Learn more about the work of our research integrity team to safeguard the quality of each article we publish.
Find out more
ORIGINAL RESEARCH article
Front. Environ. Sci. , 22 July 2022
Sec. Environmental Economics and Management
Volume 10 - 2022 | https://doi.org/10.3389/fenvs.2022.905037
This article is part of the Research Topic Managing Climate Risk in the Global Economic System in the Post-COVID-19 Era View all 11 articles
Chinese government has proposed ambitious targets to combat climate change. As carbon emissions of China’s transportation have been rapidly increasing in past decades, massive efforts for carbon reduction need to be taken by transportation sector. Research on practical action paths for transportation sector’s low-carbon development are critical to achieving the Paris Agreement goals and China’s “Dual-Carbon” Target. Based on the transportation’s historical carbon emissions and the new possible trends in the future, this paper uses a forecast model to predict transportation’s carbon emission. Then we adopt a scenario analysis to analyze the total transportation demand in the transportation sector from 2021 to 2060. We quantitatively simulated the emission reduction effects of different policy measures under different scenarios, such as optimization of transportation structure, application of energy-saving and emission-reduction technologies, and new energy vehicles. The results provide paths and measures for the low-carbon development of transportation, and provides policy suggestion for the scientific formulation of the low-carbon development.
Global efforts against climate change are currently being strengthened. Numerous nations, including China, have realized that a fair and sustainable development system needs to be established to meet future generations’ needs and further contribute to current social and economic developments. With the rapid development of the transportation sector in the world, the proportion of transportation’s carbon emissions continued to grow, which has exceeded 25% of the world’s total carbon emissions (Liu et al., 2021). In 2020, President Xi Jinping announced that China aimed to peak carbon emissions by 2030 and achieved carbon neutrality by 2060 (so-called “Dual-Carbon” target). The transportation sector, accounting for above 10% of China’s total carbon emissions, is estimated to be the hardest sector to reach the peak (He, 2020). According to predictions by the International Energy Agency (IEA), all other sectors in China will peak carbon emission before 2028, while the transportation sector is predicted to reach its peak after 2040 (IEA, 2017). In order to contribute to “Dual-Carbon” target, the efforts to decarbonize the transportation sector need to be strengthened.
With the rapid development of China’s economy and society, the turnover of transportation goods has increased significantly. The carbon emissions of transportation increased from 372 million tons in 2005 to 983 million tons in 2020, increased 264%, and the average annual growth rate reached 6.2%. The carbon emissions’ proportion of transportation sector in total China’s carbon emission has increased steadily, from 6.4% in 2005 to 9.9% in 2020, as shown in Figure 1.
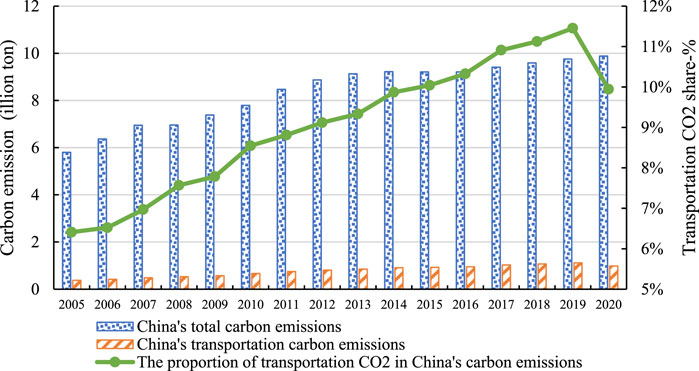
FIGURE 1. China’s transportation carbon emissions.
In nowadays, China’s transportation sector is still powered by fossil fuel consumption, and the proportion of clean energy use is very low. Transportation sector will face increasingly fierce challenges to meet “Dual-Carbon” target. Firstly, the total demand of transportation will continue to grow, and the whole society will have higher requirements for transportation timeliness, personalization, comfort, which will lead to increasing difficulty in controlling total carbon emissions and carbon intensity of transportation. Secondly, clean energy has not yet formed a large-scale application in the transportation sector, which highly relying on the breakthrough of new energy equipment technology. Thirdly, the emergence of technologies such as autonomous driving, electric vehicles, the application of shared travel will significantly affect and re-shape the transport sector development and emission reduction pathway. The emission growth rate of the transportation sector may will continue to increase, and become the largest contributor to CO2 emissions in China (Tang et al., 2019). As the transportation sector is a fundamental industry for China’s economic and social development, reducing emissions is crucial for its long-term decarbonization pathway. However, Therefore, it is necessary to carry out research and implementable policy recommendations on the low-carbon development path of the transportation sector.
Many scholars pay close attention to low-carbon development of transportation research and they mainly focus on two aspects. On one hand, some scholars have studied and identified the influencing factors of China’s transportation carbon emissions. Guo and Meng (2019) adopted the LMDI model to analyze the driving factors of carbon emissions from the transportation sector in Beijing-Tianjin-Hebei region. Lv et al. (2019) analyzed the driving factors of China’s freight carbon emissions and the impact of urbanization on freight carbon emissions. Xu and Lin (2018) used an econometric model to analyze the driving factors of transportation sector’s carbon emissions. The result showed that the main influencing factors included population size, per capita GDP, transportation energy intensity, urbanization level, freight turnover and passenger turnover. Lo et al. (2020) used an econometric model to study the influencing factors of aviation carbon emissions and concluded that aviation fuel prices, flight distance and aircraft type were the main influencing factors. To sum up, most studies at this stage mainly explain the influencing factors of transportation carbon emissions, including the level of economic development, population size, total transportation turnover, urbanization rate, urban space and distribution (Lim et al., 2019), land use (Fei et al., 2009), transportation structure (Hao et al., 2011), transportation efficiency (Talbi, 2017), industrial structure (Wang et al., 2017), scale of private car ownership and fuel prices (Wu et al., 2016), etc., On the other hand, some studies focus on how to achieve carbon emission reduction goal in transportation sector. For example, Acar and Dincer (2020) believed that one of the most effective way to achieve green transportation was replacing traditional fuel vehicles with new energy vehicles. Yang et al. (2017) simulated the carbon emissions of daily travel in Beijing based on the micro-simulation model to evaluate the key low-carbon transportation policies, including public transport improvement, public bicycle policy, energy efficiency improvement policy and electric vehicle promotion policy. The results showed that when the four policies were used together, Beijing’s daily travel carbon emissions could be reduced by 43%. Based on the CIAM/NET-Transport model, Tang et al. (2019) simulated China’s future carbon emissions path. The results showed that by adopting joint measures, including optimizing transportation structure, improving energy efficiency, promoting alternative fuels can reduce 8447 Mt CO2 from 2015 to 2050. In general, the existing researches on low-carbon development mainly focus on the influencing factors of transportation carbon emissions and the forecast of future carbon emissions. Few studies have been able to clarify the low-carbon development path of the transportation sector and evaluate the emission reduction effects of different policy measures.
In this paper, we aim to propose a suitable low-carbon development path for China’s transportation sector and simulate the effects of diverse policy measures. Overall, three questions are explored in this study: 1) What is the future trend of transportation carbon emissions and when will the China’s transportation carbon emissions peak? 2) What will the core indicators associated with energy efficiency and low-carbon transportation (such as electrification rate, green travel ratio, etc.) be at key nodes (peak period, rapid decline period)? 3) How will China’s transportation sector achieve more sustainable development and how to develop implementable policy measures? Under the background of national “Dual-Carbon” policies and technologies, we design an Energy and Carbon emission Assessment Scenario model of China’s transportation sector to project the carbon emissions to 2060 under different scenarios and provide a roadmap of sustainable low-carbon transport.
The rest of the paper is structured as follows: In Section 2, we present the model used in this paper. Section 3 analyzes future trends and key factors that influence the carbon emissions of China’s transportation sector. Then based on these factors, three different emission scenarios for China’s transport sector are examined. In Section 4, we obtain the carbon emissions of the transportation sector under different scenarios. Section 5 shows the conclusions and policy recommendations.
Carbon emissions of transportation sector are mainly mobile source emissions. According to the IPCC Guidelines for National Greenhouse Gas Inventories (Hayama, 2006), mobile source emission accounting methods can be divided into two categories: “top-down” method and “bottom-up” method. The “top-down” model bases on vehicle energy consumption and energy carbon emission conversion factors. The approach has been used in different studies worldwide. Salvatore and Daniela. (2002) applied it to the estimation of carbon emissions from road transport in Italy. Xie and Wang (2011) used the “top-down” model to calculate the carbon emissions of various modes of transportation in China and the carbon emission intensity of major transportation vehicles. The results showed that there was a general downward trend of carbon intensity, and the civil aviation had the largest carbon intensity, while the waterway had the smallest carbon intensity. Cai. (2011a) calculated the carbon emissions of national and regional road transport in 2007 based on the “top-down” model. The results showed that China’s road transport carbon emissions in 2007 was 377 million tons, accounting for 86.32% of the carbon emissions in the transportation sector. Chi (2012) calculated the carbon emissions of China’s transportation sector from 1991 to 2009 and compared the carbon emissions of various modes of transportation, concluding that the waterway was the transportation mode with the highest carbon emission efficiency from the top-down model.
The “bottom-up”model, first applied in transportation field by Schipper et al. (2000), use the data of different transportation modes’ ownership, mileage, and fuel consumption per unit of mileage to calculate transportation’s carbon emissions. Li et al. (2018) used the “bottom-up” model to calculate and compare the carbon emissions of four types of public transport (bus, rail transit, taxi and private passenger cars) in urban city and concluded that the annual carbon emissions and carbon intensity of rail transit were the smallest. Chen et al. (2010) calculated the total carbon emissions of transportation sector in Shanghai and compared the carbon emissions of different transportation modes. Cai. (2011b) adopted the “bottom-up” model and calculated carbon emissions of road, railway, air and water transportation of the whole country and each province, the results showed that the road emissions were the largest both in national level and regional level.
Overview, the “top-down” model can well reflect the interrelationship between the transportation system, the energy system, and the economic system. The “bottom-up” model, on the other hand, can describe in detail the energy consumption and carbon emissions of various transport models. Considering that China’s transportation demand will grow rapidly, and different policies and technological advances will be used for transportation energy consumption intensity decrease and energy consumption structure improvement, it is difficult to only use top-down or bottom-up models, which needs detailed data. Therefore, in this paper, we apply comprehensive model and scenario design, which simulates the future technological development and analyzes the carbon emissions of different fields of transportation sector in the future. Specifically, we first apply traffic demand model by fully considering the factors that affect the carbon emissions of transportation, to get the traffic activity data. Considering that the passenger transport and freight transport have distinct growth trends, we analyze passenger transport and freight transport separately. Then, according to different modes of transportation we build emission model to calculate transportation’s carbon emissions. Detailed classification could be seen in Figure 2. Energy application of different modes of transport could be seen in Supplementary Appendix A1.
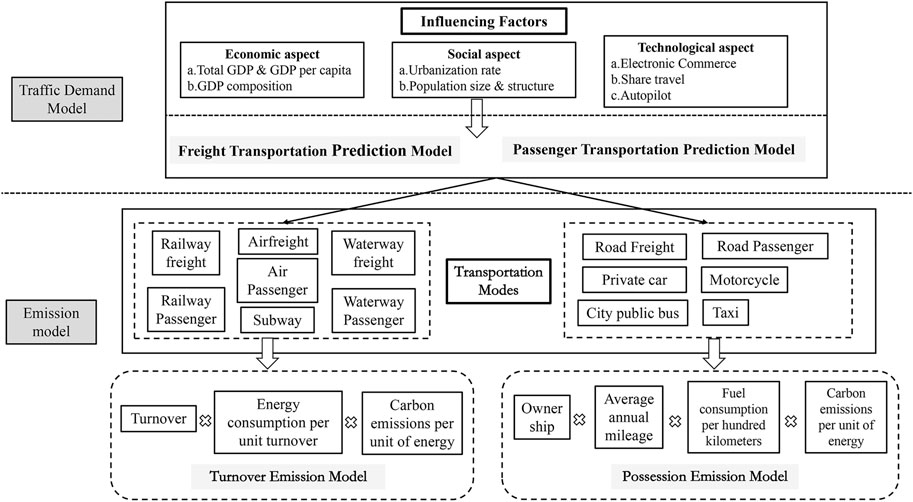
FIGURE 2. Transport-related carbon emissions calculating model.
1) Passenger turnover prediction model
The first sub model simulation is the prediction of total China’s passenger turnover. The detailed method is that identifying the major drivers of travel demand and modeling the mathematical relationship between travel demand and these factors.
We used the cumulative Weibull function to simulate the growth trend of km traveled per capita in China, as Eq. 1 shows.
Where,
Different passenger transport modes bear different proportions of passenger turnover. Therefore, we apply Kaya model to calculate the passenger turnover of railway, road, aviation and waterway.
Where,
Where,
The calculation of
2) Freight turnover prediction model
The freight turnover prediction model can be expressed as:
Where,
Different freight transport modes have different proportions of freight turnover. Therefore, we applied Kaya model to calculate the freight turnover of railway, road, aviation and waterway.
Where,
Where
The calculation of
According to the 2006 IPCC Guidelines for National Greenhouse Gas Inventories, carbon dioxide emissions from transportation are mobile source emissions. Based on data availability, two methods are used.
1) Turnover emission model
The formula for calculating the carbon emission of the turnover method is as follows:
where,
2) Ownership emission model
In this study, City public bus (CBs), Private car (PCs), Motorcycle (Mos), Taxi (Tas), road passenger (Bus), Road freight, which includes: heavy trucks (HTs), medium trucks (MTs), light trucks (LTs), mini vans (MVs), uses the ownership emission model. This bottom-up model is an aggregate time-series model with prediction step of 1 year (Hao et al., 2011). The structure of the model is presented by Figure 1.
As shown in Figure 3, the numbers of newly registered all the types of vehicles are estimated by using vehicle production, import and export, as Eq. 10 shows.
Where,
Where,
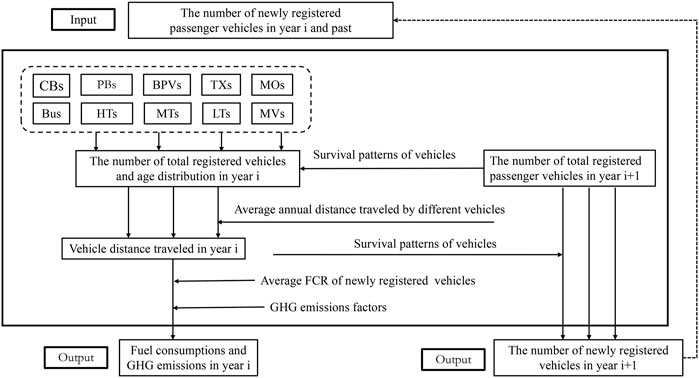
FIGURE 3. Diagram of ownership model structure.
The research scope includes railway, highway and water transport, aviation, pipelines, urban transportation and civil vehicles, etc., mainly the energy consumption of the transportation operation department, excluding the energy consumption of self-provided vehicles of enterprises and institutions.
The turnover data and unit consumption data are mainly from statistical bulletins, including the Statistical Yearbook of the Transportation Industry, the Statistical Bulletin of the Development of the Transportation Industry, the Railway Statistics Bulletin and the Civil Aviation Statistics Bulletin. In addition, the car ownership data is derived from the China City Statistical Yearbook and the China Urban Construction Statistical Yearbook and related research reports.
The energy used by vehicles typically includes gasoline, diesel, kerosene, fuel oil, natural gas, liquefied natural gas, and electricity. According to the General Principles of Comprehensive Energy Consumption (GB/T5892008), China Energy Statistical Yearbook 2016, 2005 China Greenhouse Gas Inventory Research, Provincial Greenhouse Gas Inventory Guidelines (Trial), 2006 IPCC National Greenhouse. We calculate the average low calorific value, carbon content per unit calorific value and carbon oxidation rate given in the Gas Inventory Guide and the Guide to the Calculation of Greenhouse Gas Emissions from Source Consumption (version 2.1). The emission factors of diesel, kerosene, fuel oil, natural gas and liquefied natural gas are then obtained according to the standard coal index.
In this study, we set up a baseline scenario, a dual-carbon policy scenario and a radical scenario. We compare the characteristics of the transportation sector at different stages of urbanization at home and abroad, consider the evolution of new technologies in the transportation sector and the implementation of policies, and combine the future social and economic trends of China with the development status of China’s transportation system. Combined with China’s “Dual-Carbon” target and typical near-zero carbon emission development paths of transportation, the scenarios’ parameters are determined.
1) Baseline Scenario
Based on the existing policy measures and technical level, we assume that there will be no major changes or major technological breakthroughs in China’s industrial layout, passenger and freight structure, energy efficiency improvements in different transportation modes, and the development of alternative fuel technologies.
2) Dual-carbon policy scenario
Under this scenario, we review the recently issued “dual-carbon” policies and the related China’s 14th Five-Year Plan in transportation. The main “dual-carbon” policies include: optimizing the transportation structure, continuous application of energy-saving and emission-reduction technologies, increasing the proportion of green travel, and increasing the penetration rate of new energy vehicles and ships. By summing up these low-carbon policies and measures before 2035, we quantify policy measures into model parameters. In addition, with reference to the results and predictions of some research institutions, the relevant parameters are deduced to 2060.
3) Radical scenario
Based on the dual-carbon policy scenario, we assume that t the application of accelerated emission reduction measures is emphasized, with rapid emission reduction as the primary goal. Specific measures include: intensifying the policies of “transfer from road to railway” and “transfer from road to water”, to encourage residents to adopt greener travel modes; to improve the energy consumption efficiency by strengthen the application of “Internet + transportation” and the construction of intelligent transportation; to; to improve the fuel structure by speeding up the elimination of existing and old vehicles and adopting more aggressive measures to improve the penetration rate of new energy vehicles.
Transportation demand is closely related to macroeconomic and social development indicators such as industrialization, industrial structure and population income levels. According to many studies, there are mainly 13 factors in 4 aspects that affect the transportation demand, including macroeconomic demand factors such as GDP (GDP per capita), industrial structure, urbanization and population; structural factors such as transportation structure adjustment and green travel; energy efficiency improvement factors brought by the application of low-carbon technologies promotion; factors of new energy transportation equipment application (see Figure 4). Detailed scenario parameters could be seen in Supplementary Appendix A2.
1) Macro factors
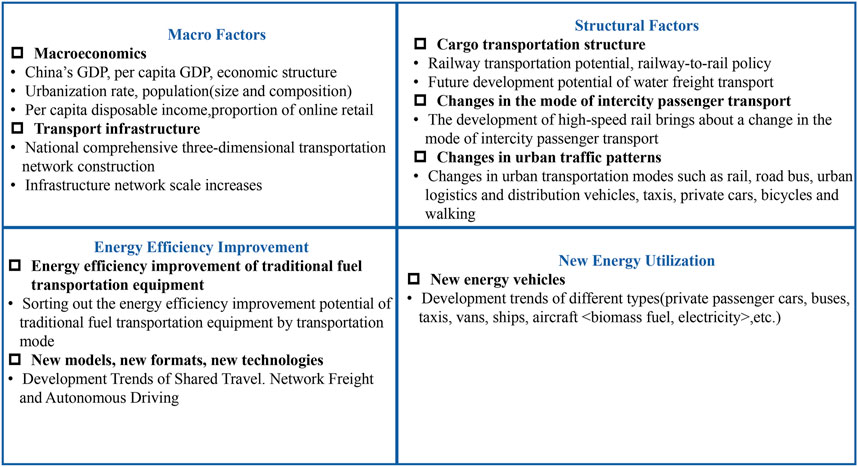
FIGURE 4. The 13 factors affecting the transportation demand.
According to the “Outline of the 14th Five-Year Plan (2021–2025) for National Economic and Social Development and Vision 2035 of China” and the World Bank CGE team’s forecast of China’s economy, China’s economy will continue to grow and will basically achieve socialist modernization by 2035. China’s economic aggregate and per capita income of urban and rural residents will reach a new level. From 2022 to 2025, it will grow at an average annual rate of 5.2%, and the average annual rate will be 4.4% from 2026 to 2035. By 2035, the per capita GDP of China will reach the level of moderately developed countries, and the middle-income group will expand significantly. China’s urbanization rate will increase from 63.89% in 2020 to 65% in 2025 and to around 72% in 2035. According to research forecasts such as the National Population Development Plan (2016–2030) issued by the State Council, China will gradually enter an aging stage by 2030. China’s total population was 1.41 billion in 2020 and will peak around 2028, reaching 1.44 billion, and then will drop to 1.401 billion by 2035.
2) Structural factors
The energy consumption intensity of railway freight and waterway freight is 1/7 and 1/9 of that of road freight respectively. Promoting the transfer of bulk cargo and medium and long-distance road freight transport to railway and water transport will be an important measure for green and high-quality development of transportation for a long time in the future. According to the government’s requirements on cargo transport structures, it is expected that railway freight volume will increase by 700 million tons and 1.4 billion tons in 2025 and 2030 compared with 2020; inland water freight volume will increase by 500 million tons and 1 billion tons respectively; coastal freight volume will increase by 200 million tons and 500 million tons.
3) Energy efficiency improvement
Advances in energy-saving technologies will further improve the fuel economy of conventional fuel vehicles. There is still room for improvement in the efficiency of gasoline and diesel engines. According to reports such as “Energy-saving and New Energy Vehicle Technology Roadmap 2.0”, with the application of lightweight and engine fuel-saving technologies, engine energy efficiency can reach up to 45–50%. With the technical applications such as large-scale ship technology and ship type standardization, the energy efficiency improvement potential of waterway transportation is about 20% as shown in Table 1.
Technological advances, such as autonomous driving, can also improve energy efficiency. It is widely believed that the use of autonomous driving technology in public transportation and in specific locations will prevail in the personal passenger vehicle market. According to China’s “Technology Roadmap for Energy Saving and New Energy Vehicles”, the market share of driver assistance/partially autonomous vehicles will reach 50% by 2030. The market share of fully self-driving vehicles will be nearly 10% by 2035 and will exceed 50% by 2060.
4) New energy Utilization
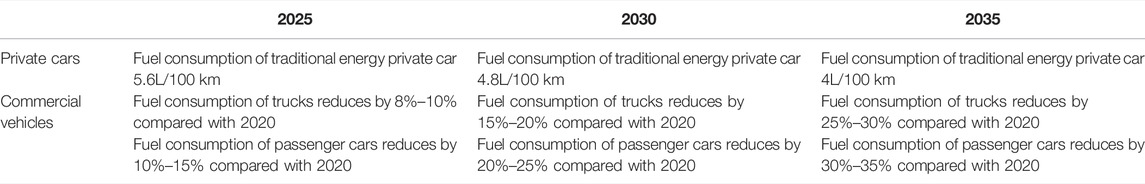
TABLE 1. Goals of vehicles on energy saving.
In 2021, the number of new energy vehicles has reached 7.84 million, accounting for 2.6% of the total vehicles. The annual sales of new energy vehicles have reached 3.4 million, with a penetration rate of 12.7%. Developing new energy vehicles will still be a key national strategy in the future.
As the new energy vehicles industry enters a period of rapid growth, terminal sales and penetration rates will continue to rise. In accordance with the “New Energy Vehicle Industry Development Plan (2021–2035)”, “Carbon Peak Action Plan before 2030”, “Energy Saving and New Energy Vehicle Technology Roadmap 2.0”, other policy documents and research reports, the sales of new energy vehicles will reach about 20% of the total sales of new vehicles by 2025, reach 40% by 2030, and will reach 100% in 2045. Based on the vehicle Sale-Ownership prediction model, we obtain the detailed number and proportion of new energy vehicles in China from 2020 to 2060, which are shown in Figure 5.
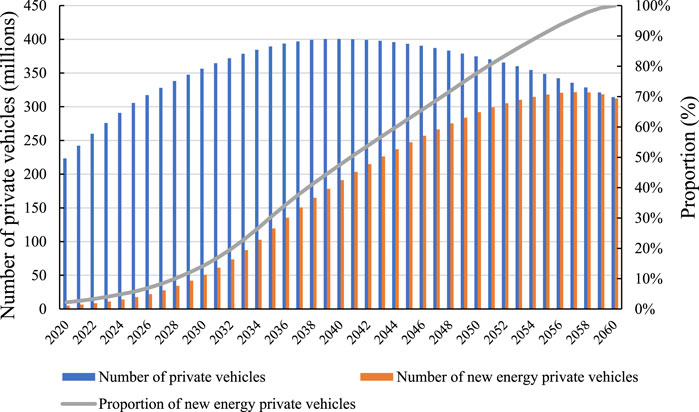
FIGURE 5. The number and proportion of new energy private vehicles in the future.
Under the baseline scenario, the penetration rate of new energy vehicles is low, especially in the field of freight transportation, where the proportion of new energy vehicles is only 50% in 2060; the adjustment of the transportation structure is small and the improvement of energy efficiency is limited, resulting in a continuous increase in the total carbon emissions of transportation. The carbon emissions will reach 1.45 billion tons in 2030, peak at 1.62 billion tons in 2045, and drop to 1.13 billion tons in 2060. Road transportation is the most important source of carbon emissions, and the proportion of carbon emissions in the transportation sector will drop from 87% in 2020 to 82.2% in the peak year in 2040, and continue to decline to 77.4% in 2060. The proportion of carbon emissions from aviation transportation will continue to rise, from 7.1% in 2020 to 16.9% in 2060, with an increase of 138%, as shown in Figure 6.
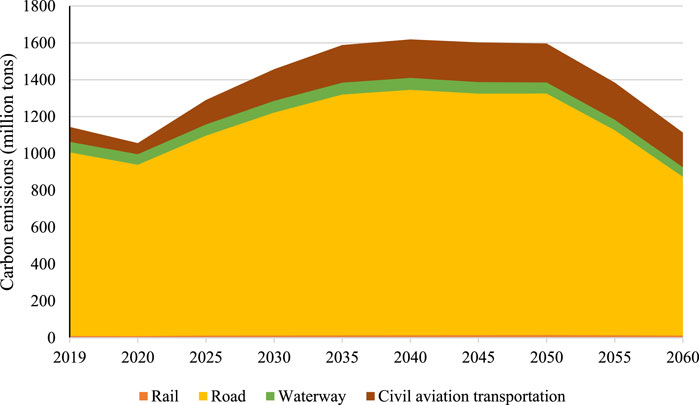
FIGURE 6. The carbon emissions of transportation under Baseline Scenario.
In the baseline scenario, traditional fossil fuels are still the main energy sources. By 2040, gasoline, diesel and aviation kerosene will account for 16.1%, 41.9%, and 13.6% of the total transportation energy, respectively. Clean energy such as electricity will only account for 24.1%. By 2060, electricity will become the most important transportation energy, accounting for 39.5%, while diesel, aviation kerosene and gasoline will account for 34.1%, 12.2% and 4.3%. Hydrogen will be used to a certain extent, accounting for 3.3% (Figure 7).
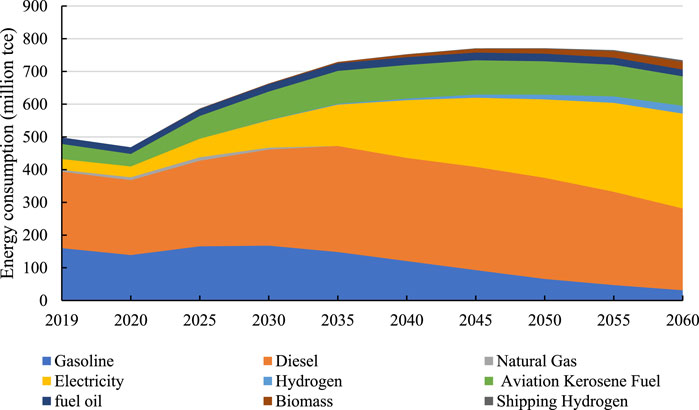
FIGURE 7. Different fuel consumption trends under the baseline scenario.
In general, under the baseline scenario, if effective low-carbon measures are not taken in the transportation sector, it will result in insignificant effects of transferring from road to railway and water transportation and “green travel”, and limited improvement of energy efficiency. The penetration rate of new energy vehicles will not be high, which will lead to the carbon emissions of transportation to be maintained at a high level.
Under this scenario, the total carbon emissions from transportation will show a trend of first increasing and then decreasing, reaching a peak around 2035, with a peak carbon emission of 1.33 billion tons. In 2050 and 2060, carbon emissions will drop to 680 million tons and 1.8 billion tons respectively, a decrease of 57.3% and 83.4% respectively compared with the baseline scenario (Figure 8).
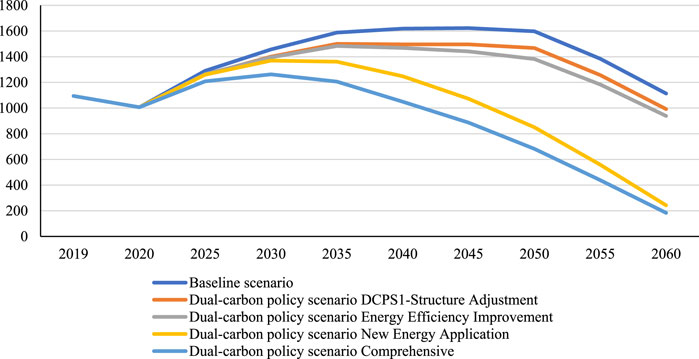
FIGURE 8. Trends of carbon emissions using different policies and measures under the dual carbon policy scenario.
By 2035, when different policy measures are adopted, as shown in Figure 9, the emission reduction effects of the three types of measures, namely, the adjustment of transportation structure, the improvement of energy efficiency, and the application of new energy, will enhance in turn. The emission reductions are 55, 66 and 142 million tons, respectively and will reduce the total emissions by 21%, 25%, and 54% when implementing three different types of measures separately.
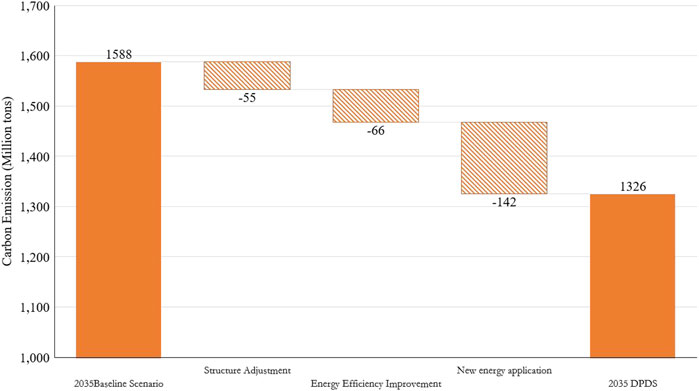
FIGURE 9. Deconstruction of carbon emissions under the dual carbon policy scenario in 2035.
As shown in Figure 10, by 2060, the reduction effect of transportation structure adjustment and energy efficiency improvement will be further weakened, while the reduction effect of new energy application will be the most prominent. The emission reduction contribution of these three policies accounted for 10%, 15% and 75% respectively when implementing three different types of measures separately.
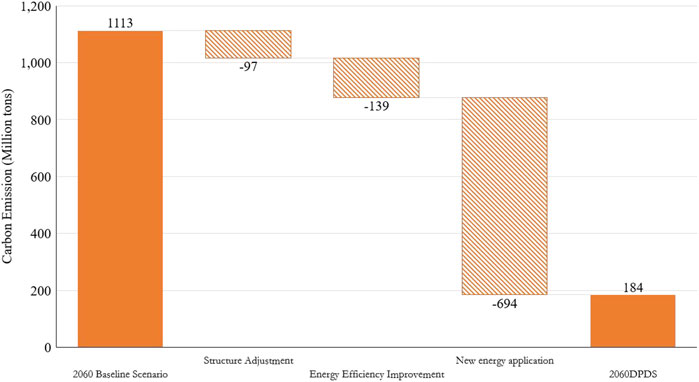
FIGURE 10. Deconstruction of carbon emissions under the dual carbon policy scenario in 2060.
Under the dual-carbon policy scenario, electricity will gradually become the most important energy source. By 2035, the proportion of gasoline, diesel and aviation kerosene will be 16.6%, 35.2% and 13.1% respectively, and the proportion of clean energy such as electricity will increase to 34.2%. By 2040, electricity will become the main transportation energy, accounting for 41.5% and will continue to increase. By 2060, it will account for 72.8% and the proportion of hydrogen energy and biomass fuel will increase to 5.9% and 6.8% As shown in the Figure 11.
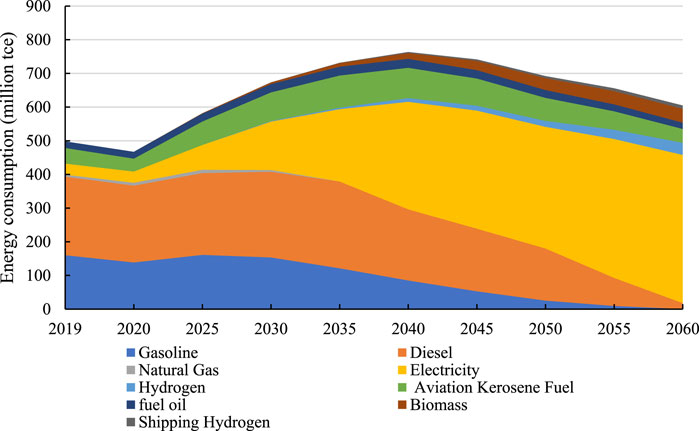
FIGURE 11. Different fuel consumption trends under the dual carbon policy scenario.
Under the radical scenario, the total carbon emissions from transportation are expected to peak around 2030, with peak carbon emissions of 1.26 billion tons, a 22.2% decrease from the peak in the baseline scenario. In 2050, 2055, and 2060, carbon emissions will drop to 350, 190 and 66 million tons, respectively, an 81.3% decline from 2050 to 2060 As shown in Figure 12.
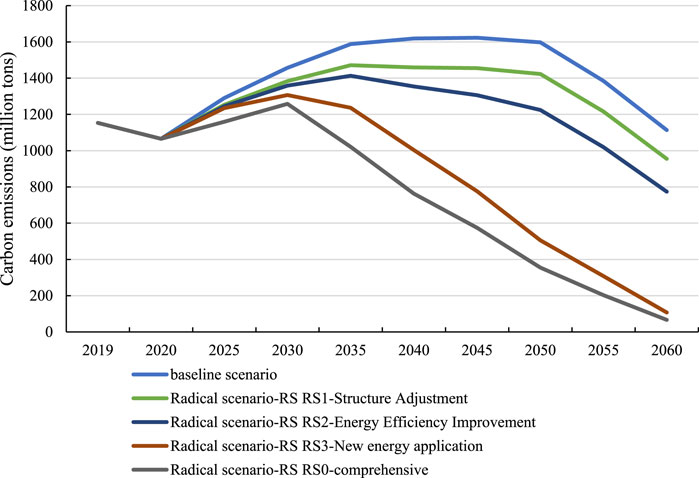
FIGURE 12. Trends of carbon emissions with different policy measures under the radical scenario.
In the radical scenario, by 2030, when different policy measures are adopted, as shown in Figure 13, it can be seen that the emission reduction effect of the three types of measures, will increase sequentially compared with the baseline, specially, will contribute 0.46, 0.61, and 93 million tons of emission reductions, and the emission reduction contribution ratios are 23%, 31%, and 47%, respectively. Compared with the dual-carbon policy scenario, in the peak emission year of the radical scenario, the contribution rate of new energy applications is slightly smaller. The main reason is that in 2030, the technology of some new energy delivery vehicles is immature and the penetration rate is relatively low.
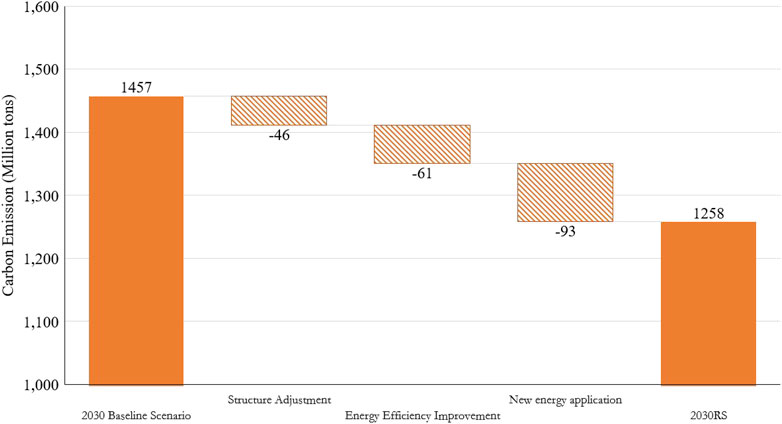
FIGURE 13. Deconstruction of carbon emissions under the Radical scenario in 2030.
By 2060, as shown in Figure 14, the reduction effect of policies such as transportation structure adjustment and energy efficiency improvement will be further weakened, and the emission reduction effect of new energy application will be the most prominent. The emission reductions are 110, 236, and 700 million tons, accounting for 11%, 23%, and 67% of the emission reduction contribution respectively. Compared with the dual-carbon policy scenario, the contribution of new energy applications in the radical scenario is slightly smaller, and the emission reduction from energy efficiency improvement is larger. The main reason is that in this scenario, in order to speed up the peak emission time of the transportation sector, the application of energy-saving and emission-reduction technologies for traditional fuel vehicles has been accelerated. Compared with the dual-carbon policy scenario, the emission reduction effect of the energy efficiency policy increases by 41.3%.
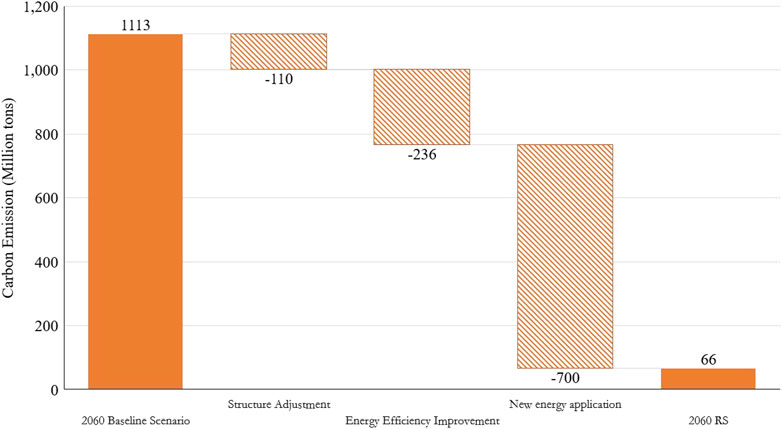
FIGURE 14. Deconstruction of carbon emissions under the Radical scenario in 2060.
In the radical scenario, electricity will quickly become the dominant energy source. By 2030, the proportion of gasoline, diesel and aviation kerosene will be 21%, 34.7%, and 11.3%, respectively. The proportion of clean energy such as electricity will increase to 28.6%, and will reach 36.8% in 2035, becoming the most important source of energy consumption. By 2060, the proportion of clean energy will reach 75.4%, and hydrogen energy and biomass fuel will increase to 9.4% and 8.5%, while the traditional fuel will only account for 6.7% as shown in the Figure 15.
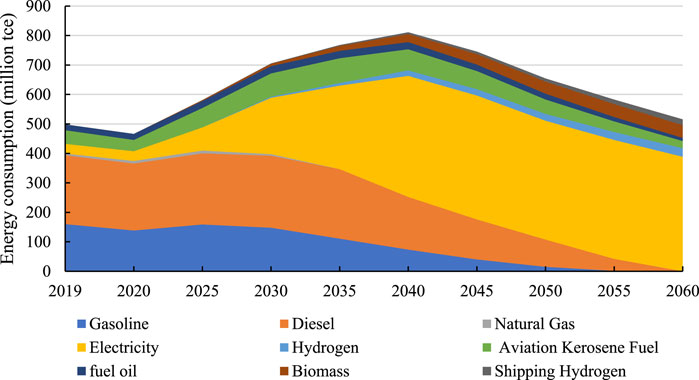
FIGURE 15. Different fuel consumption trends under the radical scenario.
Based on a scenario analysis of the total transportation demand in the transportation sector from 2020 to 2060, this paper quantitatively simulates the carbon emission reduction effects in the transportation of different policy measures under different scenarios, such as optimization of transportation structure, application of energy-saving and emission-reduction technologies, and new energy applications. The results show that the application of new energy applications and increase in freight efficiency pose the highest potential in reducing emissions in transport sector.
Based on the scenario analysis and results, we put forward several policy recommendations that may contribute to the “Dual-Carbon” target:
First of all, promote the cleanliness and low carbonization of transportation energy systems. Transportation vehicles account for a relatively high proportion of carbon emissions, especially for trucks, which account for more than 50% of carbon emissions in transportation sector. Therefore, it is necessary to promote clean energy vehicles, and take the lead in promoting the realization of fully electrification of urban public transport, and set a timetable for the withdrawal of traditional fossil energy vehicles. The government should continue to support breakthroughs in the research and development of key technologies for low carbonization of transportation equipment, and create a favorable market environment for the application of clean energy equipment through the improvement of systems, standards and norms. The government should also adopt a combination of finance and market policies to reduce new energy application costs and improve electric charging (replacement), hydrogen refueling and maintenance services.
Secondly, encourage green travel. The government and relevant institutions should carry out green transportation missions, strengthen citizens’ environmental awareness, and let the residents participate in the construction of green transportation, encourage the public transportation to achieve green and environmental protection. Besides, create a high-quality, fast and diversified urban passenger transportation service system. To make public transport more attractive, it is necessary to promote quality public transportation, further increase the proportion of public transport vehicles in barrier-free cities and improve the passenger comfort, convenience and speed of transportation equipment. The introduction of commercial bus, travel bus, customized bus and other vehicle types will be necessary complements to adapt to increasingly diverse travel needs, making public transport a priority for people to travel, and constantly improve the share of public transport travel. In addition, the incentive of market measures, such as national green travel carbon credit system, should also be implemented. Specially, if residents adopt green travel, they can earn carbon credits, which can obtain corresponding economic benefits in the carbon emissions trading system.
Thirdly, increase the energy efficiency of freight. The government should improve the energy consumption limit standard for transportation vehicles and establish a vehicle carbon emission standard system. Accelerating the elimination of high-consumption and low-efficiency vehicles by economic compensation, strict supervision of excessive emissions, vehicle inspection and maintenance systems. Promoting vehicle energy-saving driving technology and publish best operating practices are also essential. The local government should incorporate energy-saving driving and energy-saving sailing as independent modules into driver (crew) training and examinations. Besides, the government should accelerate the application of smart transportation technologies. Cost-effective and intelligent transportation are key to modern freight logistics. The government and businesses need to improve the organization and intensification level of freight logistics so as to effectively reduce the empty driving rate by promoting the freight network platform and integrating of logistics resources. At the same time, the government could gradually popularize automatic vehicle driving technology and promote intelligent ship driving technology in pilot areas.
The raw data supporting the conclusion of this article will be made available by the authors, without undue reservation.
XW: conceptualized the study, analyzed the data and led drafting the manuscript. YZ: contributed to the drafting of the manuscript. QB: contributed to the data processing and analysis. ZC: contributed to the drafting and editing of the manuscript. BW: contributed to the drafting and reviewing of the manuscript.
This work was supported by the Central Public-interest Scientific Institution Basal Research Funds “Transportation Infrastructure (Near) Zero-Carbon Pilot Program Mode and Mechanism Research (Double-Carbon Topics)” (20220120), “Research on Carbon Neutral Technology Path and Policy in Transportation” (20210106), “Analysis and Research on China’s Transportation Emission” and “Research on Carbon Emission Trading Mechanism in the Field of Transportation” (20210111). The research was also supported by the Transport Strategic Planning Policy Project “Study on China’s Transport Participation in Carbon Trading Scheme (2022-19-6)”.
The authors declare that the research was conducted in the absence of any commercial or financial relationships that could be construed as a potential conflict of interest.
All claims expressed in this article are solely those of the authors and do not necessarily represent those of their affiliated organizations, or those of the publisher, the editors and the reviewers. Any product that may be evaluated in this article, or claim that may be made by its manufacturer, is not guaranteed or endorsed by the publisher.
The Supplementary Material for this article can be found online at: https://www.frontiersin.org/articles/10.3389/fenvs.2022.905037/full#supplementary-material
Acar, C., and Dincer, I. (2020). The Potential Role of Hydrogen as a Sustainable Transportation Fuel to Combat Global Warming[J]. Int. J. Hydrogen Energy 45 (5), 3396–3406.
Cai, B.-F. (2011b). Study on Carbon Dioxide Emissions from China's Transportation. Adv. in Climate Change 7 (3), 197–203. doi:10.3969/j.issn.1673-1719.2011.03.007
Cai, B.-F. (2011a). Study on Carbon Dioxide Emissions from Road Traffic in China. China Energy 33 (4), 26–30. doi:10.3969/j.issn.1003-2355.2011.04.006
Chen, X., Xia, X., Zhao, Y., and Zhang, P. (2010). Heavy Metal Concentrations in Roadside Soils and Correlation with Urban Traffic in Beijing, China. J. Hazard Mater 181 (1-3), 640–646. doi:10.1016/j.jhazmat.2010.05.060
Fei, C., et al. (2009). The Model of Urban Low-Carbon Transportation Development, Status Quo and Target Strategy Taking Shanghai Empirical Analysis as an Example. Urban Plan. J.
Guo, M., and Meng, J. (2019). Exploring the Driving Factors of Carbon Dioxide Emission From Transport Sector in Beijing-Tianjin-Hebei Region. J. Clean. Prod. 226, 692–705. doi:10.1016/j.jclepro.2019.04.095
Hao, H., Wang, H., and Ouyang, M. (2011). Fuel Conservation and GHG (Greenhouse Gas) Emissions Mitigation Scenarios for China's Passenger Vehicle Fleet. Energy 36 (11), 6520–6528. doi:10.1016/j.energy.2011.09.014
Hayama, (2006). IPCC Guidelines for National Greenhouse Gas Inventories. Japan: Institute for Global Environmental Strategies, 2006.
He, J.-K. (2020). Low Carbon Transformation of Energy and Economy under the Goal of Carbon Peaking and Carbon Neutrality (In Chinese). Environmental Economic Research 30 (11), 1–25. doi:10.12062/cpre.20201025
Li, P., Zhao, P., and Brand, C. (2018). Future Energy use and CO2 Emissions of Urban Passenger Transport in China: A Travel Behavior and Urban Form Based Approach[J]. Applied Energy 211, 820–842.
Lim, J., Kang, M., and Jung, C. (2019). Effect of National-Level Spatial Distribution of Cities on National Transport CO2 Emissions. Environ. Impact Assess. Rev. 77, 162–173. doi:10.1016/j.eiar.2019.04.006
Liu, M., Zhang, X., Zhang, M., Feng, Y., Liu, Y., Wen, J., et al. (2021). Influencing Factors of Carbon Emissions in Transportation Industry Based on CD Function and LMDI Decomposition Model: China as an Example. Environ. Impact Assess. Rev. 90, 106623. doi:10.1016/j.eiar.2021.106623
Lo, P. L., Martini, G., Porta, F., and Scotti, D. (2020). The Determinants of CO2 Emissions of Air Transport Passenger Traffic: an Analysis of Lombardy (Italy). Transp. Policy 91, 108–119. doi:10.1016/j.tranpol.2018.11.010
Lv, Q., Liu, H., Yang, D., and Liu, H. (2019). Effects of Urbanization on Freight Transport Carbon Emissions in China: Common Characteristics and Regional Disparity. J. Clean. Prod. 211, 481–489. doi:10.1016/j.jclepro.2018.11.182
Salvatore, S., and Daniela, R. (2002). A Methodology for the Estimation of Road Transport Air Emissions in Urban Areas of Italy. Atmospheric Environment.
Schipper, L., Marie-Lilliu, C., and Gohram, R. (2000). Flexing the Link between Urban Transport and CO2 Emissions: A Path for the World Bank. International Energy Agency.
Talbi, B. (2017). CO2 Emissions Reduction in Road Transport Sector in Tunisia. Renew. Sustain. Energy Rev. 69, 232–238. doi:10.1016/j.rser.2016.11.208
Tang, B.-J., Li, X.-Y., Yu, B., and Wei, Y.-M. (2019). Sustainable Development Pathway for Intercity Passenger Transport: A Case Study of China. Appl. Energy 254, 113632. doi:10.1016/j.apenergy.2019.113632
Wang, H., Ou, X., and Zhang, X. (2017). Mode, Technology, Energy Consumption, and Resulting CO2 Emissions in China's Transport Sector up to 2050. Energy Policy 109, 719–733. doi:10.1016/j.enpol.2017.07.010
Wu, N., Zhao, S., and Zhang, Q. (2016). A Study on the Determinants of Private Car Ownership in China: Findings From the Panel Data. Transp. Res. Part A Policy Pract. 85, 186–195. doi:10.1016/j.tra.2016.01.012
Xie, T.-R., and Wang, J. (2011). Comparative Study on Carbon Emissions in Transportation Industry. Comprehensive Transportation 2011 (8) 5.
Xu, B., and Lin, B. (2018). Investigating the Differences in CO2 Emissions in the Transport Sector Across Chinese Provinces: Evidence From a Quantile Regression Model. J. Clean. Prod. 175, 109–122. doi:10.1016/j.jclepro.2017.12.022
Keywords: low carbon transportation, green transportation, development path, scenario analysis, carbon emissions
Citation: Wang X, Zhou Y, Bi Q, Cao Z and Wang B (2022) Research on the Low-Carbon Development Path and Policy Options of China’s Transportation Under the Background of Dual Carbon Goals. Front. Environ. Sci. 10:905037. doi: 10.3389/fenvs.2022.905037
Received: 26 March 2022; Accepted: 20 June 2022;
Published: 22 July 2022.
Edited by:
Yan Xia, Chinese Academy of Sciences (CAS), ChinaReviewed by:
Jingyu Liu, Shanghai Jiao Tong University, ChinaCopyright © 2022 Wang, Zhou, Bi, Cao and Wang. This is an open-access article distributed under the terms of the Creative Commons Attribution License (CC BY). The use, distribution or reproduction in other forums is permitted, provided the original author(s) and the copyright owner(s) are credited and that the original publication in this journal is cited, in accordance with accepted academic practice. No use, distribution or reproduction is permitted which does not comply with these terms.
*Correspondence: Qinghua Bi, cWluZ2h1YV9iaUAxMjYuY29t
Disclaimer: All claims expressed in this article are solely those of the authors and do not necessarily represent those of their affiliated organizations, or those of the publisher, the editors and the reviewers. Any product that may be evaluated in this article or claim that may be made by its manufacturer is not guaranteed or endorsed by the publisher.
Research integrity at Frontiers
Learn more about the work of our research integrity team to safeguard the quality of each article we publish.