 Alexander Kokhanovsky
 Biagio Di Mauro
 Roberto Colombo
94% of researchers rate our articles as excellent or good
Learn more about the work of our research integrity team to safeguard the quality of each article we publish.
Find out more
ORIGINAL RESEARCH article
Front. Environ. Sci., 07 September 2022
Sec. Environmental Informatics and Remote Sensing
Volume 10 - 2022 | https://doi.org/10.3389/fenvs.2022.904585
This article is part of the Research TopicRemote Sensing of the CryosphereView all 10 articles
In this paper, we made use of PRISMA imaging spectroscopy data for retrieving surface snow properties in the Nansen Ice Shelf (East Antarctica). PRISMA satellite mission has been launched in 2019 and it features 239 spectral bands covering the 400-2500 nm interval. These data are promising for cryospheric applications, since several snow and ice parameters can be derived from reflectance in the Visible Near InfraRed - Short Wave InfraRed (VNIR-SWIR) wavelength interval. Here we analyze, for the first time, PRISMA data collected in Antarctica. Our scene was acquired on December 2020 over the Nansen Ice Shelf (NIS). Using PRISMA data we estimated various snow parameters (effective grain diameter, snow specific surface area, snow spectral and broadband albedo, bottom of atmosphere snow reflectance, type of impurities in snow and their concentration), and we compared them with data presented in the scientific literature.
Satellite observations of visible and near infrared reflectance represent crucial information for estimating different surface properties of snow and ice, such as snow albedo, snow grain effective diameter, concentration of impurities and liquid water content (Negi and Kokhanovsky 2011; Di Mauro et al., 2017, Haq et al., 2021). In particular, imaging spectroscopy is a powerful tool for mapping surface properties of the cryosphere from space (König et al., 2001; Guanter et al., 2019; Kokhanovsky et al., 2021a; Bohn et al., 2022). With the launch of the PRISMA (PRecursore IperSpettrale della Missione Applicativa) space imaging spectroscopy mission in March 2019, new opportunities for cryosphere monitoring were opened (Di Mauro et al., 2020; Bohn et al., 2022). This mission is promoted by the Italian Space Agency (ASI) (Loizzo et al., 2018; Coppo et al., 2020) and it features a nominal spatial resolution of 30 m in the VNIR-SWIR (Visible Near InfraRed - Short Wave InfraRed) spectral channels. The measurements are performed in 239 spectral bands covering the 400–2500 nm interval with two instruments. The VNIR spectrometer operates in the 400–1010 nm range with a nominal spectral sampling interval lower than 11 nm and a bandwidth lower than 15 nm, while the SWIR spectrometer operates between 920 and 2500 nm. The two spectrometers share the same entrance telescope. PRISMA radiance data proved to be consistent with field data for agricultural, water and snow surfaces (Giardino et al., 2020; Di Mauro et al., 2020; Cogliati et al., 2021) and already successfully exploited for monitoring water (O’Shea et al., 2021), vegetation (Verrelstl et al., 2021) and soils characteristics (Mzid et al., 2022).
The acquisition of optical data in polar areas is challenging. PRISMA, for example, covers areas slightly above ±70° of latitude with relook capability of 7 days, so the observations are not routinely conducted and large areas are missed. Moreover, large solar zenith angles and polar night make the continuous remote observation of snow properties more difficult in these areas (Warren et al., 1998; Pirazzini 2004). Furthermore, few field observations are available (Zibordi and Maracci, 1993; Zibordi et al., 1996; Casacchia et al., 2002; Casacchia et al., 2011; Picard et al., 2016a; Picard et al., 2016b; Di Franco et al., 2022), and mainly used for comparison with satellite estimates (Lupi et al., 2001; Pirazzini 2009).
While most of the surface snow in the interior of the Antarctic Ice Sheet is uncontaminated, on the margins of the continent several processes occur and they can deposit or resurface light-absorbing particles, as observed in different studies (Dadic et al., 2013; Casey et al., 2017; Warren, 2019a; 2019b; Kavan et al., 2020; Di Mauro et al., 2021; Gray et al., 2021; Cordero et al., 2022). Recent observation from the Antarctic Peninsula showed that surface snow may contain cryospheric algae (Gray et al., 2020, 2021) and black carbon (Cordero et al., 2022). Also mineral debris and volcanic tephra can be present on the surface and can produce an overall decrease of spectral albedo of the snow - covered area (Casacchia et al., 2001; Dadic et al., 2013).
The monitoring of the Antarctic Ice Sheet by using hyperspectral data is a Frontier in remote sensing, since potentially it allows to infer snow parameters (e.g. surface impurities) that are not fully investigated until now and can exert a strong role in the future dynamics of the Ice Sheet.
In this context, the objective of this study is to derive, for the first time, snow properties over Nansen Ice Sheet (East Antarctica) using space imaging spectroscopy data. In particular, we exploit PRISMA data with the aim at estimating the effective grain diameter, snow specific surface area, snow spectral and broadband albedo, and bottom of atmosphere snow reflectance. Also we estimate the type of impurities in snow and also their concentration. The spatial resolution of spectral PRISMA measurements is 30 m (the swath width is 30 km). This makes it possible to evaluate snow properties with a spatial detail not accessible for most of modern optical instrumentation orbiting our planet. In particular, the Ocean and Land Colour Instrument (OLCI) on board Sentinel—3 has 10 times coarser resolution (100 PRISMA pixels within one OLCI pixel). This makes it possible to study the intra-pixel snow property variation for the OLCI and other moderate spatial resolution sensors using PRISMA measurements. Also small scale scene inhomogeneities (say, separate patches of snow containing impurities) can not be detected by the instruments with moderate spatial resolution (e.g., MODIS, S-GLI, OLCI). However, they are clearly observed with the use of high spatial resolution observations such as performed by PRISMA.
In this section we introduce the spectral behavior of clean snow reflectance, with the aim of providing the theoretical basis for the retrieval of snow properties using satellite data. The proposed theory is then applied to PRISMA data and a comparison with the L2d bottom-of-atmosphere reflectance (BOAR) standard product, which includes atmospheric correction, geolocation, and orthorectification (Vangi et al., 2021), performed to evaluate the robustness of the proposed approach.
The snow spectral reflectance R in the VNIR can be presented in the framework of the asymptotic radiative transfer theory as follows (Zege et al., 1991; Kokhanovsky et al., 2019):
where
is the directional function, which is determined by the function
where
One can derive for the absolutely white Lambertian surfaces:
which is a valid approximation also at small values of
Eqs. 1, 6 are valid for the bottom-of-atmosphere snow reflectance. The reflectance R as measured on a satellite is influenced also by atmospheric scattering and absorption effects, which must be accounted for. To avoid the necessity of account for generally unknown atmospheric effects, the simplified retrieval approach as discussed below is proposed.
Let us take into account that the snow spherical albedo of clean snow can be presented for weakly absorbing snowpack as (Kokhanovsky et al., 2019):
where
Therefore, we can write for the measured reflectance at the pair of near infrared PRISMA channels only weakly affected by the atmospheric scattering and absorption effects in clean polar atmospheres:
where indices signify the wavelengths used. In this work, we used the PRISMA channels located at
It follows from Eq. 8 neglecting light scattering and absorption effects in clean polar air at selected wavelengths (Kokhanovsky et al., 2019):
where
One can see that PRISMA measurements at two near infrared channels make it possible to determine the parameters
and plane (black sky) snow albedo (Kokhanovsky et al., 2019)
or
at any wavelength in the visible and near infrared. An important point is that atmospheric scattering and absorption (say, by water vapor, oxygen, and ozone molecules) effects, which are of importance in the visible, are accounted for automatically in our atmospheric correction scheme. Also multi-view remote sensing instruments and observations generally used to determine albedo are not required. The technique described above has been already applied to MSI/S-2 and OLCI/S-3 measurements and close correspondence to ground measurements have been found for clean snow cases common for remote polar areas (Kokhanovsky et al., 2019, 2020; 2021b).
The value of EAL can be used to estimate other snow parameters such as the effective grain diameter (EGD, mm) d, the snow specific surface area (SSA) σ, and snow broadband albedo (BBA)
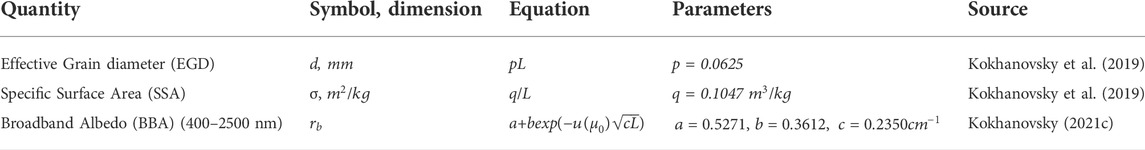
TABLE 1. The relationships of various snow parameters with the value of the effective absorption length L for the case of clean snow (case 1 snow).
In the case of snow containing light-absorbing impurities, the technique described above must be modified. In particular, we assume that the spectral snow reflectance can be presented in the following form (Kokhanovsky et al., 2018; Kokhanovsky et al., 2021a):
where
where
The absorption of light by ice grains is weak (term
Therefore, we can derive from Eq. 15:
where
Kokhanovsky et al. (2021b) has proposed the following equation for the value of
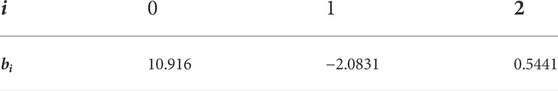
TABLE 2. Values of the constants used in Eq. 18.
The retrieved values of m, L,
Equation 7 follows from Eq. 19 at c = 0. The plane albedo is derived using Eqs 12, 19. The values of EGD and SSA are derived as specified in Table 2. The broadband albedo (0.4–2.5 μm spectral range) of snow at the cosine of the solar zenith angle
where
We have applied the theory described above to the PRISMA atmospherically corrected and orthorectified BOAR (L2d product) for the Nansen Ice Shelf (NIS) region in Antarctica (Figure 1) (Frezzotti, 1993) and only snow–covered areas under clear sky conditions have been processed (green rectangle). PRISMA acquisition occurred on 4 December 2020 (21:35 UTC) during the austral summer. The solar zenith angle was 58° and the observation has been performed in the direction close to nadir. The cloud screening has been performed using visual inspection of PRISMA imagery.
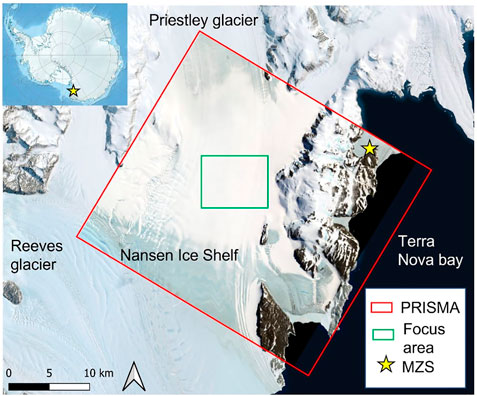
FIGURE 1. Browse image of the study area in the Nansen Ice Shelf (East Antarctica). PRISMA image (red rectangle) was acquired on 4 December 2020; 21:35UTC. The focus area where we applied the retrieval method is also represented (green rectangle). The yellow star marks the location of the Italian Antarctic base Mario Zucchelli Station (MZS). The coordinates of the green box are: lower - right corner: 74° 45′ 25.81″S 163° 39′ 9.54″E, upper - left corner: 74° 42′ 4.6″S 163°24′46.51″ E.
The results of retrievals for the randomly selected eight PRISMA pixels over snow are given in Table 3. The relative mass concentration (RMC) given in Table 3 is calculated as follows:
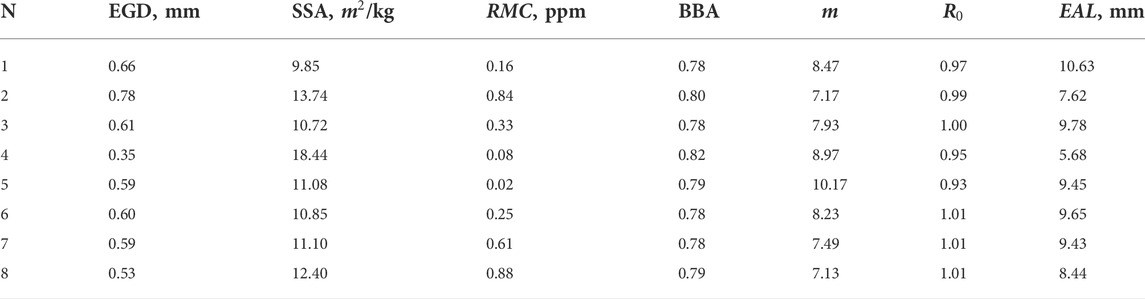
TABLE 3. Retrieved parameters for the selected cases.
The comparison of PRISMA L2d BOAR product with the spectral reflectance computed using Eq. 13 and parameters presented in Table 3 in the spectral range 400–1030 nm (used in the retrievals) is given in Figure 2. The spectral ice refractive index tabulated by Picard et al. (2016a) (at the wavelengths <600 nm) and Warren and Brand, (2008) (for the longer wavelengths) has been used. It follows from Figure 2 that Eq. 13 describes spectral PRISMA reflectance over snow in Antarctica for the spectral region 400–1030 nm in correct way. The decrease of measured spectral reflectance towards UV seen in Figure 2 is a clear indication of the snow containing light-absorbing impurities (under assumption that the atmospheric correction of PRISMA data used by us (L2d product) has been performed in correct way).
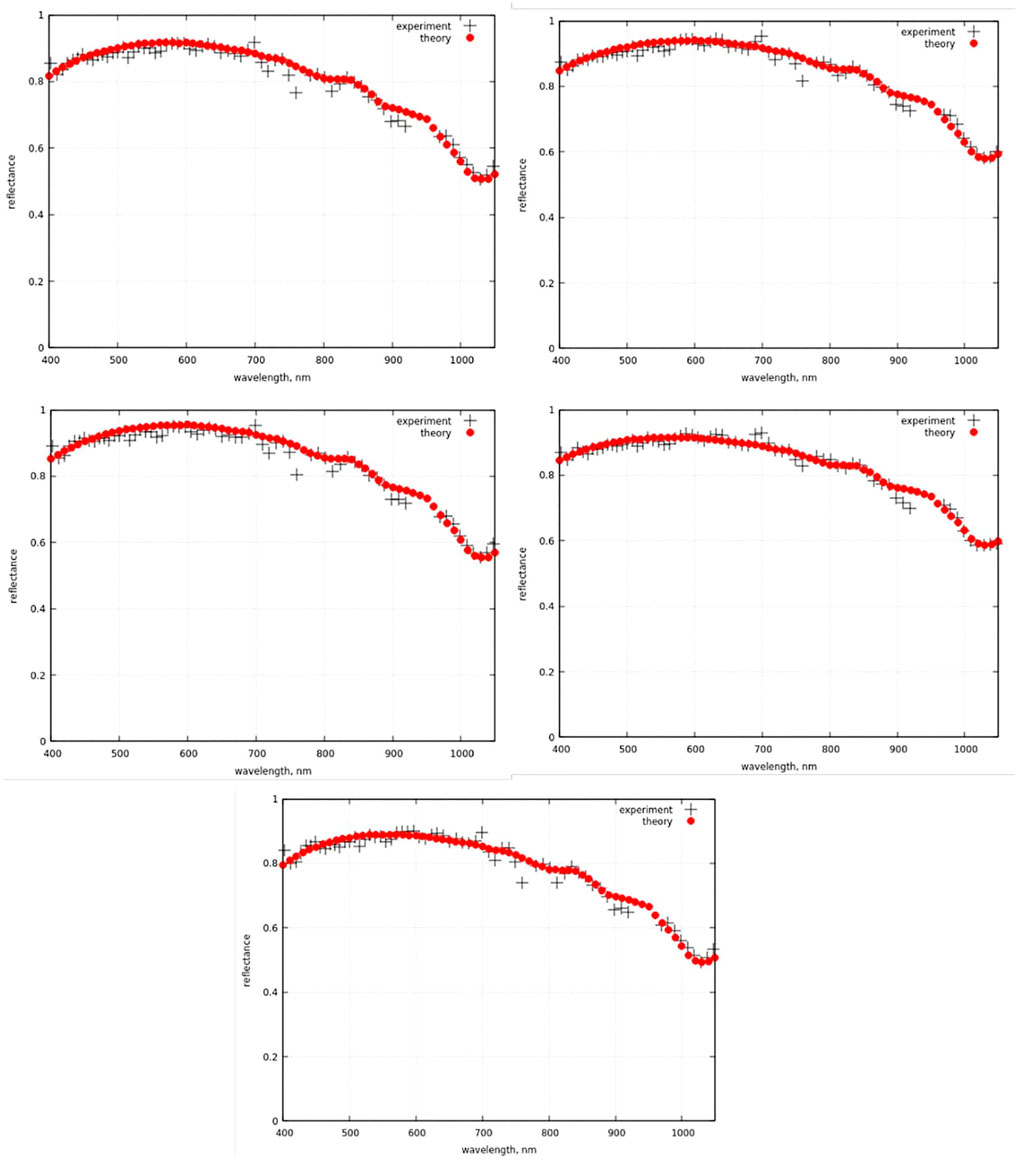
FIGURE 2. Comparison of simulated reflectance with satellite measurements for the first five cases shown in Table 4. The sequence of plots coincides with the sequence of lines in Table 3.
We show the spectral vertical optical density (VOD) of water vapor at the assumption that the vertical water vapor column is 1.301
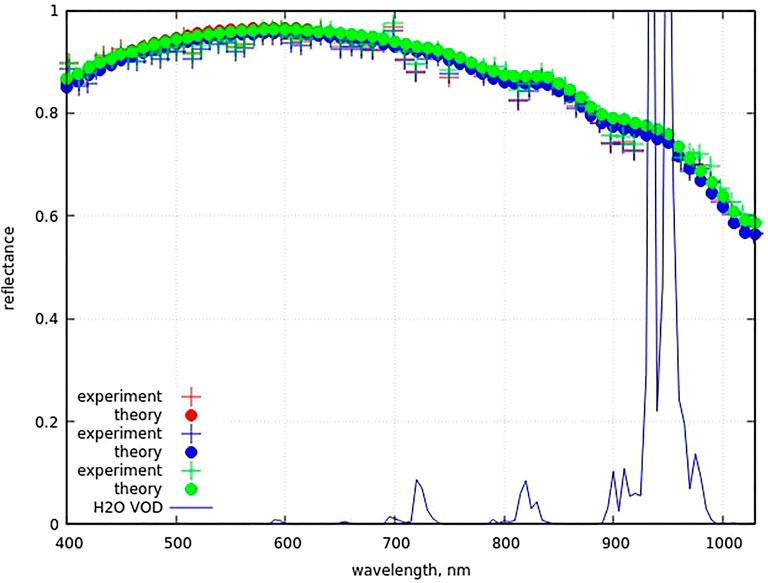
FIGURE 3. Comparison of theory and satellite measurements for the last cases shown in Table 3. The sequence of data coincides with the sequence of lines in Table 3. We also show the vertical optical density of water vapor at the assumption that the vertical water vapor column is 1.301
The comparison of the model and measurements for the case 1 in Table 3 at the whole PRISMA spectral range is given in Figure 4. The general decrease of reflectance with the wavelength is well captured by the theory, and resembles field spectroscopy observation collected in this area (Zibordi et al., 1996; Casacchia et al., 2001). However, there are deviations of the theory and experiment around 1080 nm and 1250nm, which could be due to snow vertical inhomogeneity not captured by the model or by surface heterogeneity included in PRISMA pixels. The discrepancy around 1150 nm is related to the strong absorption by water vapor. The discrepancy above 1500 nm are due to limitations of the model, which is valid only for weakly absorbing bulk ice absorption bands for vertically homogeneous snow and also due to different light penetration depths in vertically inhomogeneous snow by radiation with different wavelengths (Zhou et al., 2003). These discrepancies deserve further investigation, such as the direct comparison of PRISMA products with synchronous field spectroscopy data.
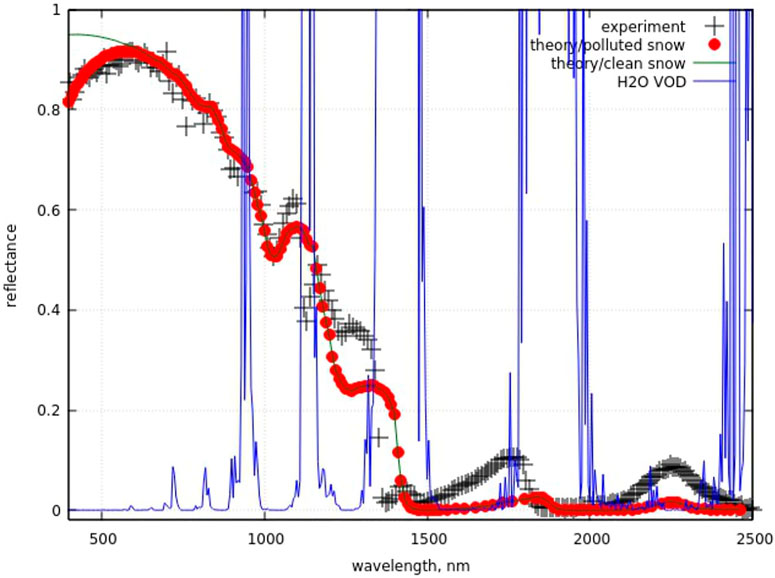
FIGURE 4. Comparison of theory and experimental data for the whole measured spectral range (for the case 1 in Table 3). We also show the vertical optical depth of water vapor (courtesy of L. Lelli). The solid line corresponds to the calculation in the absence of snow impurities (pure snow).
We also show the theoretical spectral reflectance for pure snow (case -1 snow) in absence of impurities in Figure 4. One can see that impurities play a role for the wavelengths smaller than approximately 550nm, where the maximum of the incident solar radiation is located. The intercomparison of the theory and experiment for the last three cases shown in Table 3 is shown in Figure 5. We can see that the spectral differences of theory and experiment in Figures 4, 5 are similar. It follows from Figure 6 that the difference between theory and experiment in the vicinity of ice absorption band around 2250nm, where water vapor absorption can be neglected, is reduced if the effective grain diameter equal to 0.24 mm is used. This is generally true also for all wavelengths larger than 1500 nm as illustrated in Figure 6. The discrepancy around 1800 nm is due to strong absorption by water vapor, probably not well captured by the PRISMA atmospheric correction scheme during the generation of the BOAR L2d product. The same is true for the region close to 1400 nm. The discrepancy around 1250 nm can be removed, if the effective grain diameter equal to 0.38 mm is used (see Figure 7). However, in this case the differences between model and PRISMA data in the spectral ranges around 1030 and 2250 nm (almost free of gaseous absorption) increase. This points out to the fact that the Nansen Ice Sheet is characterized by the vertical inhomogeneity of snow properties and the PRISMA channels are sensitive to the vertical structure of snow layers. Our model has been developed specifically for the case of vertically homogeneous snow layers. Therefore, it cannot capture the spectral effects, which are due to different penetration depths of radiation in snowpack (Kokhanovsky, 2022). As a matter of fact the effective grain diameter derived from 1030 nm measurements correspond to the averaging over the larger snow volume in comparison with the measurements at 2250nm, which give the effective grain diameter close to the surface. We may conclude that the effective grain diameter (for the case 7 shown in Table 3) is 2.5 times smaller at the surface as compared to that retrieved from measurements at 1030 nm corresponding to the larger penetration depth. This means that the size of crystals increases with the depth in the Nansen Ice Sheet. This feature has already been reported (Grenfell et al., 1994) for the central Antarctica and can be explained by the snow metamorphism processes. In particular, Grenfell et al. (1994) has assumed in their two-layer snow model that the top EGD is about 3.3 times smaller as compared to that in deeper layers sensed by the wavelength around 1030 nm. Also Grenfell et al. (1994) has measured snow grain vertical diameter as function of snow depth. They have found that the effective grain size can change in three times at the depth 0.5–5 cm as compared to the size of grains at the very top of snow layer. This is close to the estimations derived by us (2.5) and also that (3.3) proposed by Grenfell et al. (1994).
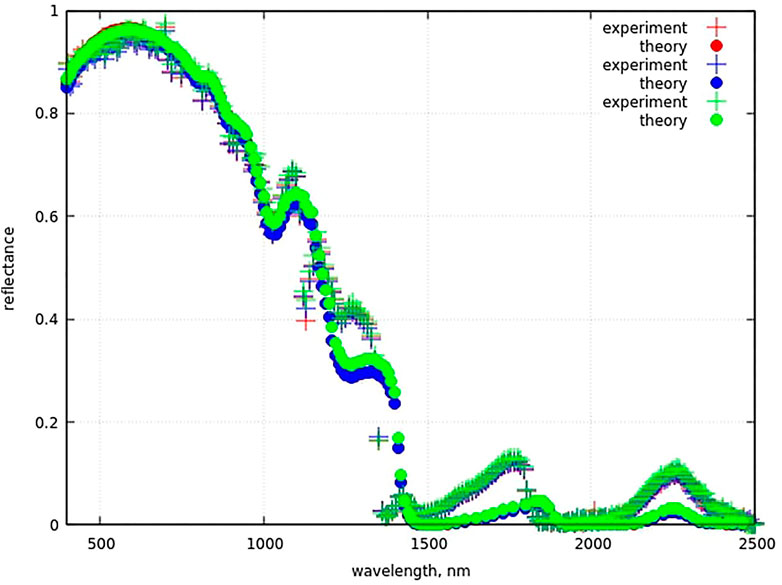
FIGURE 5. The intercomparison of theory and experimental data for the whole measured spectral range (for the cases 6–8 in Table 3).
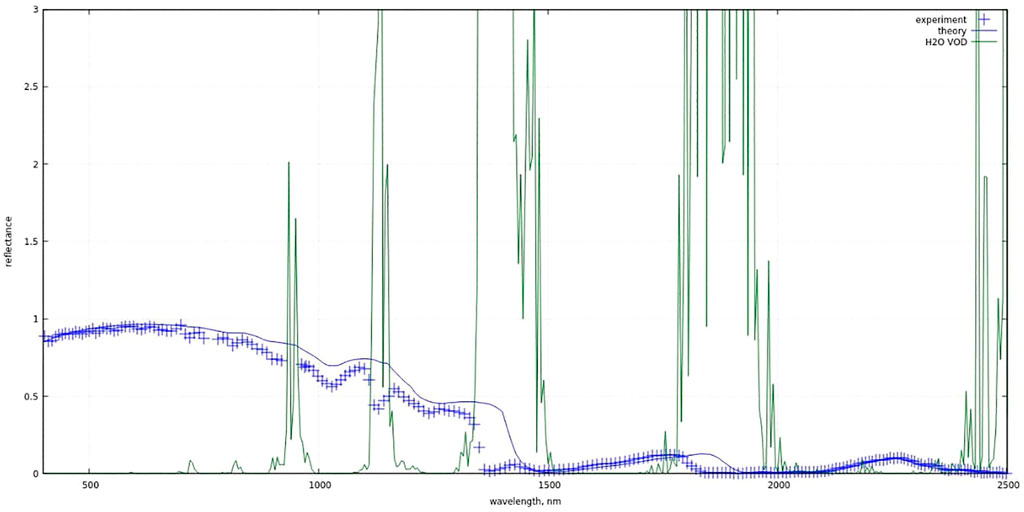
FIGURE 6. The intercomparison of theory and experimental data for the whole measured spectral range for the case 7 in Table 3 except assuming that EGD is equal to 0.24 mm. Also water vapor optical density is shown (courtesy of L. Lelli).
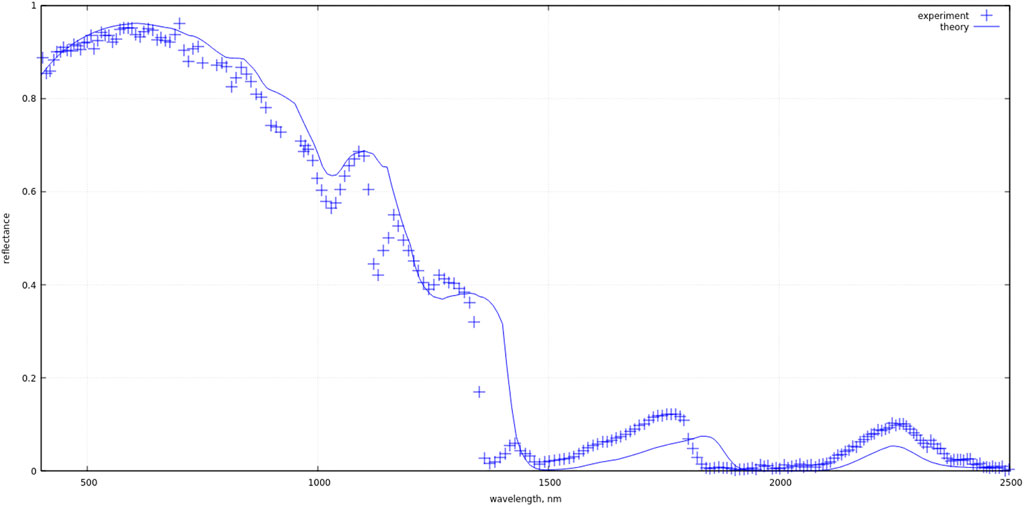
FIGURE 7. The intercomparison of theory and experimental data for the whole measured spectral range for the case 7 in Table 3 except assuming that EGD is equal to 0.38 mm.
After testing the robustness of the proposed method, we have applied the technique to the central part of the Nansen Ice Sheet covered by snow on the green box depicted in Figure 1. The reflectance at 411 and 1029 nm for the studied area are given in Figure 8, as example. One can see that the spatial distribution of reflectance at 1029 nm is quite smooth. This is not the case for the measurements at 411nm, where some stripes can be seen. These stripes propagate also to the retrieved parameters (see Figure 8), and they can be due to the presence of sastrugi (Warren et al., 1998) or other horizontal inhomogeneities of Nansen Ice Shelf. Various structures on snow surfaces are in fact well known for their impact on snow and ice albedo (Lhermitte et al., 2014). The average values of the retrieved parameters and coefficients of variations of various parameters for the 6 kmx6km scene studied are given in Table 4. Unfortunately, the validation data for the site at the moment of measurements are not available.
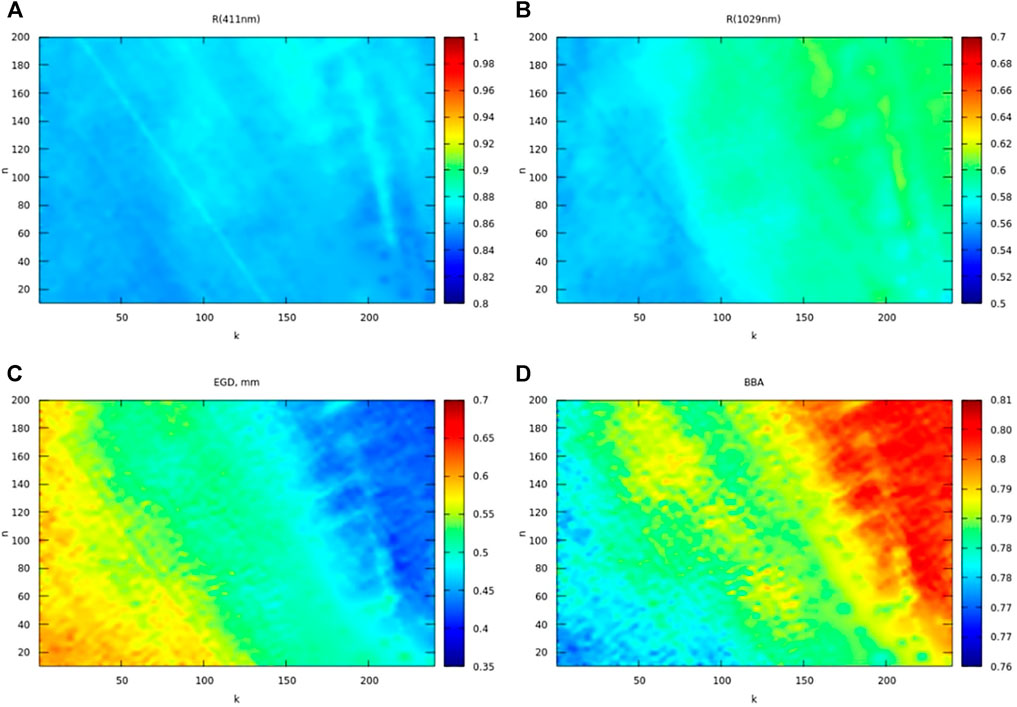
FIGURE 8. (A,B): PRISMA reflectance at 411 and 1029 nm within the green box depicted in Figure 1. (C,D): retrieved EGD and BBA from PRISMA images.
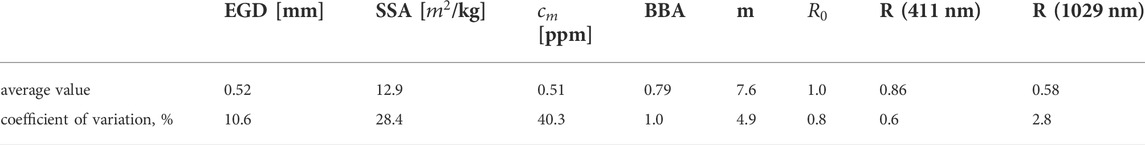
TABLE 4. Average values of retrieved parameters and reflectance at R (411 nm) and R (1029 nm) for the focus area.
One can see that the average grain diameter is close to 0.51 mm. The results obtained from the 42 sites in Antarctica show that near the surface the mean convex diameter is spatially homogeneous and on the order 0.2–0.4 mm (Gay et al., 2002). However, the cases with diameters in the range 0.4–1 mm have been found as well. Therefore, our estimation is plausible. The specific snow surface area found by us is 12
We also have found that snow in the area may contain dust particles due to weathering of nearby rocks (see Figure 1). The average concentration of dust particles as derived from satellite imagery is 0.5ppm. Unfortunately, we have no information on the measurements of dust load in snow of Nansen Ice Shelf. However, Lim et al. (2014) has reported the values of dust concentration in the range 0.1–10 ppm (0.23–2.3 ppm for Himalaya) in remote mountainous regions around the globe. Our results are closer to the lower boundary of this variability. Also atmospheric correction can induce uncertainties in wavelengths lower than 550 nm, where the impact of dust is marked. Furthermore, dust concentration <1 ppm are often considered as “clean snow” in alpine and remote areas (Di Mauro et al., 2015). Nevertheless, we cannot exclude that mineral dust has been deposited from the erosion of the surrounding moraines and nunataks (Casacchia et al., 2002). Zege et al. (2011) have suggested that the accuracy of snow impurity retrieval decreases with decrease of impurity load being about 10% for their algorithm at 1ppm of soot. It should be pointed out that impurity content is usually in the range 0.003–0.03ppm in Arctic and subarctic snow (Warren, 2013) and even lower in Antarctic snow (Warren and Clarke, 1990). Such low impurities load values can not be detected using spaceborne observations (Zege et al., 2011; Warren, 2013).
In this study, we have optimized a snow retrieval approach to PRISMA data and we provide satellite estimates of different snow properties in the Nansen Ice Sheet. The proposed approach made it possible both to derive snow properties and to model PRISMA spectral reflectance over snow covered areas. We have found some discrepancies between the standard L2d PRISMA BOAR product and the reflectance at selected spectral bands simulated with the proposed model. Further investigations are still needed to better understand these differences and we believe that the atmospheric correction of PRISMA imagery over snow should be improved in future (in particular, regarding the complex scattering processes that may occur over snow-covered complex terrains).
The derived average effective snow grain radius for the selected area is close to 0.25 mm, which is similar to the average grain sizes commonly measured in situ in Antarctica area (Gay at al. 2002). Also the average specific snow surface area was close to 13
The average value of impurities load is around 0.5ppm. Due to the relatively high absorption Angström parameter m (see Table 4), this value can be attributed to dust from neighbouring rocks and not to soot. It is expected that the contamination of snow by soot is very low in Antarctica (below 0.0003 ppm (Warren and Clarke, 1990)) and cannot be detected using spaceborne observations. In this context, it should be pointed out that inaccuracy in atmospheric correction, presence of mixed pixels, surface melting water, and blue ice can lead to the wrong detection of dust load in pristine snow on the surface of the Nansen Ice Shelf. Therefore, our retrievals of dust load shall be treated with some precaution. Future field campaigns are needed in order to perform ground measurements of impurities load and type at the site. In summary, this study demonstrates the potential of PRISMA imaging spectroscopy for detecting snow surface properties in the Antarctic Ice Sheet. The method presented in this paper can be directly applied to determine the spatial and temporal evolution of snow surface properties using PRISMA standard products in remote areas.
The raw data supporting the conclusions of this article will be made available by the authors, without undue reservation.
AK: theory, conceptualization. BM and RC: experimental measurements. AK, BM, and RC: writing of the paper. All authors reviewed and approved the final version.
Part of this research has been supported by the “BioGeoAlbedo” project (grant no. PNRA18_00222), funded by Programma Nazionale di Ricerca in Antartide (PNRA) and by the “PRISCAV” project (grant no. 2019-5-HH.0) funded by the Agenzia Spaziale Italiana (ASI). The work of AK has been supported by the European Space Agency (the EO Science for Society ESRIN CCN 4000125043/18/I-NB).
Massimo Frezzotti (UniRoma3) and Carlo Baroni (Unipi) are acknowledged for discussions on the optical properties of the Nansen Ice Shelf. The authors are grateful to L. Lelli for providing calculations of water vapor vertical optical density shown in Figures 3, 4, 6.
Author AK was employed by company Brockmann Consult GmbH.
The remaining authors declare that the research was conducted in the absence of any commercial or financial relationships that could be construed as a potential conflict of interest.
All claims expressed in this article are solely those of the authors and do not necessarily represent those of their affiliated organizations, or those of the publisher, the editors and the reviewers. Any product that may be evaluated in this article, or claim that may be made by its manufacturer, is not guaranteed or endorsed by the publisher.
Bohn, N., Di Mauro, B., Colombo, R., Thompson, D. R., Susiluoto, J., Carmon, N., et al. (2022). Glacier ice surface properties in South-West Greenland Ice Sheet: First estimates from PRISMA imaging spectroscopy data. JGR. Biogeosciences 127, e2021JG006718. doi:10.1029/2021JG006718
Casacchia, R., Lauta, F., Salvatori, R., Cagnati, A., Valt, M., and Ørbæk, J. B. (2001). Radiometric investigation of different snow covers in Svalbard. Polar Res. 20 (1), 13–22. doi:10.1111/j.1751-8369.2001.tb00035.x
Casacchia, R., Salvatori, R., Cagnati, A., Valt, M., and Ghergo, S. (2002). Field reflectance of snow/ice covers at Terra Nova Bay, Antarctica. Int. J. Remote Sens. 23 (21), 4653–4667. doi:10.1080/01431160110113863
Casey, K. A., Kaspari, S. D., Skiles, S. M., Kreutz, K., and Handley, M. J. (2017). The spectral and chemical measurement of pollutants on snow near South Pole, Antarctica. J. Geophys. Res. Atmos. 122, 6592–6610. doi:10.1002/2016JD026418
Cogliati, S., Sarti, F., Chiarantini, L., Cosi, M., Lorusso, R., Lopinto, E., et al. (2021). The PRISMA imaging spectroscopy mission: Overview and first performance analysis. Remote Sens. Environ. 262, 112499. doi:10.1016/j.rse.2021.112499
Coppo, P., Brandani, F., Faraci, M., Sarti, F., Dami, M., Chiarantini, L., et al. (2020). Leonardo spaceborne infrared payloads for Earth observation: SLSTRs for copernicus Sentinel- 3 and PRISMA hyperspectral camera for PRISMA satellite. Appl. Opt. 59, 6888. doi:10.1364/AO.389485
Cordero, R. R., Sepúlveda, E., Feron, S., Damiani, A., Fernandoy, F., Neshyba, S., et al. (2022). Black carbon footprint of human presence in Antarctica. Nat. Commun. 13, 984. doi:10.1038/s41467-022-28560-w
Dadic, R., Mullen, P. C., Schneebeli, M., Brandt, R. E., and Warren, S. G. (2013). Effects of bubbles, cracks, and volcanic tephra on the spectral albedo of bare ice near the Transantarctic Mountains: Implications for sea glaciers on Snowball Earth. J. Geophys. Res. Earth Surf. 118, 1658–1676. doi:10.1002/jgrf.20098
Di Franco, S., Salzano, R., Boldrini, E., and Salvatori, R. (2022). Increasing the interoperability of snow/ice hyperspectral observations. Comput. Geosci. 162, 105076. doi:10.1016/J.CAGEO.2022.105076
Di Mauro, B., Baccolo, G., Garzonio, R., Giardino, C., Massabò, D., Piazzalunga, A., et al. (2017). Impact of impurities and cryoconite on the optical properties of the Morteratsch Glacier (Swiss Alps). Cryosphere 11, 2393–2409. doi:10.5194/tc-11-2393-2017
Di Mauro, B., Fava, F., Ferrero, L., Garzonio, R., Baccolo, G., Delmonte, B., et al. (2015). Mineral dust impact on snow radiative properties in the European Alps combining ground, UAV, and satellite observations. J. Geophys. Res. Atmos. 120, 6080–6097. doi:10.1002/2015JD023287
Di Mauro, B., Garzonio, R., Baccolo, G., Gilardoni, S., Rossini, M., and Colombo, R. (2021). “Light-absorbing particles in snow and ice: A brief journey across latitudes,” in Springer series in light scattering. Springer series in light scattering. Editor A. Kokhanovsky (Cham: Springer). doi:10.1007/978-3-030-87683-8_1
Di Mauro, B., Garzonio, R., Bramati, G., Cogliati, S., Cremonese, E., Julitta, T., et al. (2020). PRISMA hyperspectral satellite mission: First data on snow in the alps. EGU General Assem. 4–8 May 2020, EGU2020–19825. Online,. doi:10.5194/egusphere-egu2020-19825
Frezzotti, M. (1993). Glaciological study in Terra Nova Bay, Antarctica, inferred from remote sensing analysis. Ann. Glaciol. 17, 63–71. doi:10.3189/S0260305500012623
Gay, M., Fily, M., Genthon, C., Frezzotti, M., Oerter, H., and Winther, J.-G. (2002). Snow grain-size measurements in Antarctica. J. Glaciol. 48, 527–535. doi:10.3189/172756502781831016
Giardino, C., Bresciani, M., Braga, F., Fabbretto, A., Ghirardi, N., Pepe, M., et al. (2020). First evaluation of PRISMA level 1 data for water applications. Sensors 20 (16), 4553. doi:10.3390/s20164553
Gray, A., Krolikowski, M., Fretwell, P., Convey, P., Peck, L. S., Mendelova, M., et al. (2021). Remote sensing phenology of antarctic green and red snow algae using WorldView satellites. Front. Plant Sci. 12, 671981. doi:10.3389/fpls.2021.671981
Gray, A., Krolikowski, M., Fretwell, P., Convey, P., Peck, L. S., Mendelova, M., et al. (2020). Remote sensing reveals Antarctic green snow algae as important terrestrial carbon sink. Nat. Commun. 11 (1), 2527. doi:10.1038/s41467-020-16018-w
Grenfell, T. C., Warren, S. G., and Mullen, P. C. (1994). Reflection of solar radiation by the Antarctic snow surface at ultraviolet, visible, and near-infrared wavelengths. J. Geophys. Res. 99, 18669–18684. doi:10.1029/94jd01484
Guanter, L., Brell, M., Chan, J. C. W., Giardino, C., Gomez-Dans, J., Mielke, C., et al. (2019). Synergies of spaceborne imaging spectroscopy with other remote sensing approaches. Surv. Geophys. 40, 657–687. doi:10.1007/s10712-018-9485-z
Haq, M. A., Alshehri, M., Rahaman, G., Ghosh, A., Baral, P., and Shekhar, C. (2021). Snow and glacial feature identification using Hyperion dataset and machine learning algorithms. Arab. J. Geosci. 14, 1525. doi:10.1007/s12517-021-07434-3
Kavan, J., Nývlt, D., Láska, K., Engel, Z., and Kňažková, M. (2020). High-latitude dust deposition in snow on the glaciers of James Ross Island, Antarctica. Earth Surf. Process. Landforms 45, 1569–1578. doi:10.1002/esp.4831
Kokhanovsky, A., Di Mauro, B., Garzonio, R., and Colombo, R. (2021a). Retrieval of dust properties from spectral snow reflectance measurements. Front. Environ. Sci. 9, 644551. doi:10.3389/fenvs.2021.644551
Kokhanovsky, A. A. (2022). Light penetration in snow layers. J. Quant. Spectrosc. Radiat. Transf., 108040. doi:10.1016/j.jqsrt.2021.108040
Kokhanovsky, A. A. (2021c). The broadband Albedo of snow. Front. Environ. Sci. 9. doi:10.3389/fenvs.2021.757575
Kokhanovsky, A., Box, J. E., Vandecrux, B., Mankoff, K. D., Lamare, M., Smirnov, A., et al. (2020). The determination of snow albedo from satellite measurements using fast atmospheric correction technique. Remote Sens. 12, 234. doi:10.3390/rs12020234
Kokhanovsky, A., Gascoin, S., Arnaud, L., and Picard, G. (2021b). Retrieval of snow albedo and total ozone column from single-view MSI/S-2 Spectral reflectance measurements over Antarctica. Remote Sens. 13, 4404. doi:10.3390/rs13214404
Kokhanovsky, A., Lamare, M., Danne, O., Brockmann, C., Dumont, M., Picard, G., et al. (2019). Retrieval of snow properties from the sentinel-3 ocean and Land Colour instrument. Remote Sens. 11, 2280. doi:10.3390/rs11192280
König, M., Winther, J.-G., and Isaksson, E. (2001). Measuring snow and glacier ice properties from satellite. Rev. Geophys. 39 (1), 1–27. doi:10.1029/1999RG000076
Lhermitte, S., Abermann, J., and Kinnard, C. (2014). Albedo over rough snow and ice surfaces. Cryosphere 8, 1069–1086. doi:10.5194/tc-8-1069-2014
Libois, Q., Picard, G., Arnaud, L., Dumont, M., Lafaysse, M., Morin, S., et al. (2015). Summertime evolution of snow specific surface area close to the surface on the Antarctic Plateau. Cryosphere 9, 2383–2398. doi:10.5194/tc-9-2383-2015
Libois, Q., Picard, G., Dumont, M., Arnaud, L., Sergent, C., Pougatch, E., et al. (2014). Experimental determination of the absorption enhancement parameter of snow. J. Glaciol. 60 (222), 714–724. doi:10.3189/2014JoG14J015
Lim, S., Faïn, X., Zanatta, M., Cozic, J., Jaffrezo, J.-L., Ginot, P., et al. (2014). Refractory black carbon mass concentrations in snow and ice: Method evaluation and inter-comparison with elemental carbon measurement. Atmos. Meas. Tech. 7, 3307–3324. doi:10.5194/amt-7-3307-2014
Linow, S., Hörhhold, M. W., and Freitag, J. (2012). Grain size evolution of polar firn: A new empirical grain growth parameterization based on X-ray microcomputer tomography measurements. J. Glaciol. 58 (212), 1245–1252. doi:10.3189/2012jog11j256
Loizzo, R., Guarini, R., Longo, F., Scopa, T., Formaro, R., Facchinetti, C., et al. (2018). “Prisma: The Italian hyperspectral mission,” in IGARSS 2018 - 2018 IEEE International Geoscience and Remote Sensing Symposium, 175–178. doi:10.1109/IGARSS.2018.8518512
Lupi, A., Tomasi, C., Orsini, A., Cacciari, A., Vitale, V., Georgiadis, T., et al. (2001). Spectral curves of surface reflectance in some Antarctic regions. Nuovo Cimento 24C, 313–327.
Mzid, N., Castaldi, F., Tolomio, M., Pascucci, S., Casa, R., and Pignatti, S. (2022). Evaluation of agricultural bare soil properties retrieval from landsat 8, sentinel-2 and PRISMA satellite data. Remote Sens. (Basel). 14, 714. doi:10.3390/rs14030714
Negi, H. S., and Kokhanovsky, A. (2011). Retrieval of snow grain size and albedo of Western Himalayan snow cover using satellite data. Cryosphere 5, 831–847. doi:10.5194/tc-5-831-2011
O’Shea, R. E., Pahlevan, N., Smith, B., Bresciani, M., Egerton, T., Giardino, C., et al. (2021). Advancing cyanobacteria biomass estimation from hyperspectral observations: Demonstrations with HICO and PRISMA imagery. Remote Sens. Environ. 266, 112693. doi:10.1016/j.rse.2021.112693
Picard, G., Libois, Q., and Arnaud, L. (2016a). Refinement of the ice absorption spectrum in the visible using radiance profile measurements in Antarctic snow. Cryosphere 10, 2655–2672. doi:10.5194/tc-10-2655-2016
Picard, G., Libois, Q., Arnaud, L., Verin, G., and Dumont, M. (2016b). Development and calibration of an automatic spectral albedometer to estimate near-surface snow SSA time series. Cryosphere 10, 1297–1316. doi:10.5194/tc-10-1297-2016
Pirazzini, R. (2009). Challenges in snow and ice albedo parameterizations. Geophysica 45 (1–2), 41–62.
Pirazzini, R. (2004). Surface albedo measurements over Antarctic sites in summer. J. Geophys. Res. 109 (D20), 20118. doi:10.1029/2004JD004617
Six, D., Fily, M., Blarel, L., and Goloub, P. (2005). First aerosol optical thickness measurements at Dome C (east Antarctica), summer season 2003–2004. Atmos. Environ. X. 39, 5041–5050. doi:10.1016/j.atmosenv.2005.05.010
Tomasi, C., and Petkov, B. H. (2015). Spectral calculations of Rayleigh – scattering optical depth at Arctic and Antarctic sites using a two – term algorithm. J. Geophys. Res. Atmos. 120, 9514–9538. doi:10.1002/2015JD023575
Traversa, G., Fugazza, D., Senese, A., and Diolaiuti, G. A. (2019). Preliminary results on Antarctic albedo from remote sensing observations, Geogr. Fis. Din. Quat. doi:10.4461/GFDQ.2019.42.14
Traversa, G., Fugazza, D., Senese, A., and Frezzotti, M. (2021). Landsat 8 OLI broadband Albedo validation in Antarctica and Greenland. Remote Sens. 13, 799. doi:10.3390/rs13040799
Vangi, E., D’Amico, G., Francini, S., Giannetti, F., Lasserre, B., Marchetti, M., et al. (2021). The new hyperspectral satellite PRISMA: Imagery for forest types discrimination. Sensors. 21, 1182. doi:10.3390/s21041182
Verrelst, J., Rivera-Caicedo, J. P., Reyes-Muñoz, P., Morata, M., Amin, E., Tagliabue, G., et al. (2021). Mapping landscape canopy nitrogen content from space using PRISMA data. ISPRS J. Photogramm. Remote Sens. 178, 382–395. doi:10.1016/j.isprsjprs.2021.06.017
Warren, S., and Brand, R. E. (2008). Optical constants of ice from the ultraviolet to the microwave: A revised compilation. J. Geophys. Res., D14220–D14. doi:10.1029/2007JD009744
Warren, S. G. (2019b). Light-absorbing impurities in snow: A personal and historical account. Front. Earth Sci. 6, 250. doi:10.3389/feart.2018.00250
Warren, S. G., Brandt, R. E., and Hinton, P. O. R. (1998). Effect of surface roughness on bidirectional reflectance of Antarctic snow. J. Geophys. Res. 103 (E11), 25789–25807. doi:10.1029/98JE01898
Warren, S. G. (2013). Can black carbon in snow be detected by remote sensing. J. Geophys. Res. Atmos. 118, 779–786. doi:10.1029/2012jd018476
Warren, S. G., and Clarke, A. D. (1990). Soot in the atmosphere and snow surface of Antarctica. J. Geophys. Res. 95 (D2), 1811–1816. doi:10.1029/jd095id02p01811
Warren, S. G. (2019a). Optical properties of ice and snow. Phil. Trans. R. Soc. A 377 (2146), 20180161. doi:10.1098/RSTA.2018.0161
Zege, E. P., Ivanov, A. P., and Katsev, I. L. (1991). Image transfer through light scattering media. Berlin: Springer.
Zege, E. P., Katsev, I. L., Malinka, A. V., Prikhach, A. S., Heygster, G., and Wiebe, H. (2011). Algorithm for retrieval of the effective snow grain size and pollution amount from satellite measurements. Remote Sens. Environ. 115, 2674–2685. doi:10.1016/j.rse.2011.06.001
Zhou, X., Li, S., and Stamnes, K. (2003). Effects of vertical inhomogeneity on snow spectral albedo and its implication for optical remote sensing of snow. J. Geophys. Res.Journal Geophys. Res. 108 (D23), 4738. doi:10.1029/2003JD003859
Zibordi, G., and Maracci, G. (1993). Reflectance of Antarctic surfaces from multispectral radiometers: The correction of atmospheric effects. Remote Sens. Environ. 43 (1), 11–21. doi:10.1016/0034-4257(93)90060-B
Keywords: remote sensing, albedo, pollution, snow, grain size
Citation: Kokhanovsky A, Di Mauro B and Colombo R (2022) Snow surface properties derived from PRISMA satellite data over the Nansen Ice Shelf (East Antarctica). Front. Environ. Sci. 10:904585. doi: 10.3389/fenvs.2022.904585
Received: 25 March 2022; Accepted: 28 July 2022;
Published: 07 September 2022.
Edited by:
Tianjie Zhao, Aerospace Information Research Institute (CAS), ChinaReviewed by:
Tingting Liu, Wuhan University, ChinaCopyright © 2022 Kokhanovsky, Di Mauro and Colombo. This is an open-access article distributed under the terms of the Creative Commons Attribution License (CC BY). The use, distribution or reproduction in other forums is permitted, provided the original author(s) and the copyright owner(s) are credited and that the original publication in this journal is cited, in accordance with accepted academic practice. No use, distribution or reproduction is permitted which does not comply with these terms.
*Correspondence: Alexander Kokhanovsky, YS5hLmtva2hhbm92c2t5QGdtYWlsLmNvbQ==
Disclaimer: All claims expressed in this article are solely those of the authors and do not necessarily represent those of their affiliated organizations, or those of the publisher, the editors and the reviewers. Any product that may be evaluated in this article or claim that may be made by its manufacturer is not guaranteed or endorsed by the publisher.
Research integrity at Frontiers
Learn more about the work of our research integrity team to safeguard the quality of each article we publish.