
94% of researchers rate our articles as excellent or good
Learn more about the work of our research integrity team to safeguard the quality of each article we publish.
Find out more
ORIGINAL RESEARCH article
Front. Environ. Sci. , 13 June 2022
Sec. Atmosphere and Climate
Volume 10 - 2022 | https://doi.org/10.3389/fenvs.2022.903013
 Chenjing Wang1,2,3
 Xiujuan Li1
 Tianle Zhang2
 Aohan Tang1*Min Cui2,4
 Xuejun Liu1Xin Ma1Yangyang Zhang1Xiaomeng Liu2
 Mei Zheng2*
Atmospheric ammonia (NH3) is the key precursor in secondary particle formation, which is identified as the most abundant components of haze in Beijing in most cases. It is critical to understand the characteristics of NH3 from various emission sources and quantify each source contribution to NH3 in ambient atmosphere. Stable nitrogen (N) isotope composition (δ15N) is an effective tool to study NH3 source. However, this tool cannot be effectively applied in Beijing due to the lack of comprehensive N nitrogen isotope source profiles. Reliable source profiles are the basis of source apportionment of NH3 using the isotope mixing model. In this study, multiple NH3 source samples were collected at sites, representing six major NH3 source types in Beijing from 2017 to 2018 in four seasons. The δ15N values of 212 NH3 source samples were determined to build a local source profiles database of δ15N. NH3 from traffic source presents significantly higher δ15N values (−14.0 ± 5.4‰), distinguished from other sources. The δ15N values of other sources besides traffic were more depleted and did not clear differences (solid waste, sewage, human feces, fertilizer, and livestock for −33.6 ± 4.5‰, −34.1 ± 4.8‰, −32.2 ± 3.8‰, −35.0 ± 3.9‰, and −34.9 ± 4.4‰, respectively). These sources were classified into non-traffic source in this study. From March 2018 to March 2019, ambient NH3 samples were collected at an urban site in Beijing. With the newly developed source profiles in this study, the contribution of traffic and non-traffic sources to ambient NH3 in an urban site in Beijing was calculated using 15N isotope mass balance equations. Traffic and non-traffic sources contributed 8% and 92% to ambient NH3 in urban Beijing, respectively. The highest seasonal average contribution of traffic to ambient NH3 was found in winter (22%). Our results reveal the importance of traffic source and provide evidence for the need to control NH3 emission from traffic in urban Beijing in winter.
Due to the intensive human activities of past decades, severe fine particle (PM2.5) pollution occurred frequently in China, especially in the North China Plain (NCP). PM2.5 pollution has known impacts on climate, visibility, radiation budget, and human health (Sun et al., 2006). It has been reported by previous studies that secondary inorganic aerosol (sulfate, nitrate, and ammonium) is a major contributor to PM2.5 during haze periods (Huang et al., 2014; Tian et al., 2014). As the only alkaline gaseous precursor of PM2.5 in the atmosphere, NH3 plays an important role in PM2.5 formation. NH3 can neutralize acid species, such as nitric acid and sulfuric acid, forming secondary aerosols (Ansari and Pandis, 1998; Kirkby et al., 2011; Behera et al., 2013). Studies showed that NH3 emissions have been increased since 1980 (Liu et al., 2013; Warner et al., 2017; Zhang et al., 2017), and the NCP was a hotspot area with high NH3 concentration in China (Xu et al., 2015; Pan et al., 2018b). It has been proposed that reducing NH3 could be a more effective method for haze mitigation in the NCP (Pan et al., 2016). Quantifying NH3 emission sources and estimating the contribution from each key source in Beijing is not only urgent but also challenging.
NH3 in the atmosphere is mainly emitted from anthropogenic sources, such as agricultural activities (fertilizer application and livestock manure), traffic, coal combustion, urban waste (like solid waste, sewage, and human feces), and biomass burning (Sutton et al., 2000; Behera et al., 2013; Chang, 2014; Li et al., 2017). It is widely accepted that livestock manure and fertilizer application are the most important sources of NH3, accounting for approximately 60–80% to global NH3 emission budget (Bouwman et al., 1997; Holland et al., 1999; Paulot et al., 2014; Liu et al., 2022). NH3 emission source inventory over China suggested that agricultural source was the dominated source (Huang et al., 2012; Paulot et al., 2014; Kang et al., 2016; Zhang et al., 2017). Nevertheless, some studies argued that non-agricultural source could be underestimated in the urban area, which received increasing attention in recent years (Chang et al., 2016; Pan et al., 2016; Chang et al., 2019). There is still controversy over the source contribution of NH3 in cities.
Stable nitrogen isotope composition (δ15N) here refers to the ratio of 15N/14N in NH3 relative to atmospheric N2 calculated in parts per thousand, which has been applied as an effective tool to identify NH3 sources. Since NH3 emitted from different sources have different δ15N values (Chang et al., 2016), sources of NH3 at a site can be identified through the analysis of δ15N of ambient NH3 and quantified further with the help of an isotope mixing model. According to published data, δ15N-NH3 source signatures of coal combustions (−25.5 to −11.3‰) and urban traffic (−14.9 to 6.3‰) were found to be significantly different from agricultural sources, such as fertilizer application (−52.0 to −26.4‰) and livestock (−38.3 to −10.5‰) (Felix et al., 2013; Chang et al., 2016; Savard et al., 2017; Ti et al., 2018; Stratton et al., 2019; Bhattarai et al., 2020; Walters et al., 2020; Song et al., 2021). δ15N-NH3 source signatures of urban waste, like solid waste (−36.6 to 7.8‰), sewage (−41.3 to −35.7‰), and human feces (−38.4 to −38.6‰) were reported to be similar to δ15N-NH3 of agricultural sources (Chang et al., 2016; Liu et al., 2016).
Previous studies in some regions have reported the δ15N value of ambient NH3 (Moore, 1977; Hayasaka et al., 2011; Buzek et al., 2017; Felix et al., 2017) and quantified the source of NH3 or NH4+ in particle using the isotope mixing model (Chang et al., 2016, 2019; Pan et al., 2016, 2018a; Ti et al., 2018). Since 2016, some reports on the source apportionment of NH3 using δ15N-NH3 have been published (Chang et al., 2016; Pan et al., 2016, 2018a; Bhattarai et al., 2020; Zhang et al., 2020; Gu et al., 2022), which helped researchers in reassessing the contribution of non-agricultural sources to NH3 in urban Beijing. The accuracy of such estimation heavily relies on well-established source profiles of δ15N-NH3. Localized source profiles, containing the δ15N-NH3 signatures of traffic, urban waste, fertilizer application, and livestock have been reported in Shanghai, China (Chang et al., 2016), and Colorado, United States (Stratton, et al., 2019). Several studies published their results of δ15N-NH3 values of traffic in Shenyang, China (6.3‰, Song et al., 2021), Albert, Canada (−14.9‰, n = 4, Savard et al., 2017), Providence, United States (6.6 ± 2.1‰, Walters et al., 2020), and Pittsburgh, United States (−4.6‰ and −2.2‰, Felix et al., 2013). For agricultural sources, δ15N-NH3 values of fertilizer application in cropland was also measured in the Taihu area, China (−30.8 to −3.3‰), Maryland, United States (−48.0 to −36.3‰), and Alberta, Canada (−31.3‰). NH3 emitted from livestock manure in the pig farm (−30.1 to −10.5‰), dairy farm (−28.5 to −11.3‰), cattle farm (−38.3%), and the turkey farm (−36.0 to −56.1‰) were reported in the Taihu area, China (Ti et al., 2018), Alberta, Canada (Savard et al., 2017), and Maryland, Kansas, and western Pennsylvania in the United States (Felix et al., 2013). There were not too many published data on δ15N-NH3 values of urban waste. The δ15N-NH3 values of agricultural sources like fertilizer application (−40.4 ± 5.3‰, Bhattarai et al., 2020) and livestock (−29.78 to −14.05‰, Liu et al., 2016), urban waste sources like landfill (−19.14 to 7.82‰, Liu et al., 2016) were measured in Beijing as well. The δ15N-NH3 signatures, especially for urban waste were still relatively limited in Beijing.
The main goal of this research is to establish local δ15N-NH3 source profiles in urban Beijing to carry out source apportionment of NH3 in ambient air. The δ15N values of six NH3 emission sources (traffic, solid waste disposal, sewage treatment, human feces disposal, fertilizer, and livestock) are reported in urban Beijing based on 212 NH3 source samples. With the help of newly established source profiles, sources of ambient NH3 were also identified and quantified at an urban site in Beijing.
Except for the well-known NH3 sources like fertilizer and livestock (Kang et al., 2016), non-agricultural NH3 source samples (traffic, solid waste disposal, sewage treatment, and human feces disposal) were also sampled in urban Beijing in this study. For traffic source, some studies have shown the importance of traffic for NH3 in the urban area (Sun et al., 2017). The emission inventory also suggests that urban waste (solid waste disposal, sewage treatment, and human feces disposal) could be important in cities with high-population density (Chang, 2014). Therefore, these sources were also included in this study.
NH3 source samples were collected in four seasons from March 2017 to October 2018 at six sampling sites, including; 1) a crop site, located in the Shangzhuang experiment station, growing wheat in winter and corn in summer, and sampling was conducted at an acer of field where synthetic fertilizer was applied (120 kg N ha−1) (Sha et al., 2020); 2) a livestock site, located in the Fengning experiment station, maintained about 4,000 pigs in average during the sampling period, and NH3 samples were collected in three types of pig house (sow house, nursery house, and fattening house); 3) a traffic site, located in a 1,085 m-long Badaling tunnel, which is an ideal place to collect NH3 emitted from vehicle exhaust, and emissions were from both gasoline cars and diesel vehicles including various personal and commercial vehicles; 4) two solid waste disposal sites, one site located in the Liulitun landfill, with the daily landfill volume as 887 tons in 2017 (NH3 samples were collected at both the leachate treatment room and the landfill area), and the other was located in a solid waste transfer station in China Agricultural University; 5) a sewage treatment site, located in the Yongfeng sewage treatment plant, had a daily throughput of 1.98 × 10⁴ m3, and NH3 samples were collected in a secondary sedimentation tank, oxidation ditch, and fine grid room; and 6) a human feces disposal site, located in the Sanxingzhuang human feces disposal station, had a daily fecal fluid throughput of 400 t, and NH3 samples were collected in the fecal wastewater treatment tank and the fecal residue storage room. The locations of sampling sites are shown in Figure 1. More detailed information of sampling sites can be found in Supplementary Table S1.
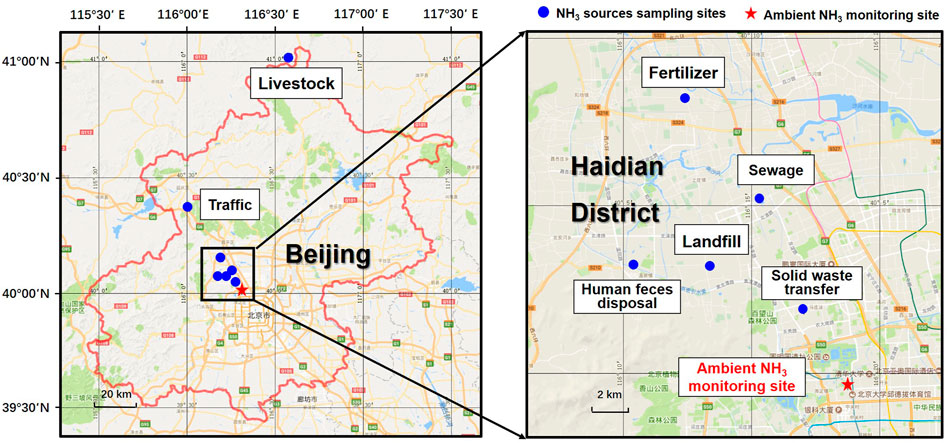
FIGURE 1. The sampling locations of the NH3 emission sources samples and ambient samples. The blue point indicates sites for collecting NH3 source samples and the red pentagram shows the ambient air monitoring site.
In addition to source samples, ambient NH3 samples were collected from March 2018 to March 2019. The monitoring site was set in the campus of Peking University (39°59′N, 116°18′E, PKU). It is a typical urban site in northwest of Beijing city, surrounded by residential buildings, teaching buildings, and parks, with dense population and traffic. There are no significant industrial emission sources near the site.
In this study, the ALPHA passive sampler was used to collect NH3 source samples and ambient NH3 samples (Adapted Low-cost Passive High Absorption, CEH, Center for Ecology and Hydrology), which has been applied in many studies to measure NH3 concentration and δ15N values (Tang et al., 2001; Skinner et al., 2004; Felix et al., 2013; Chang et al., 2016; Felix et al., 2017; Xu et al., 2017). The ALPHA sampler is a circular polyethylene vial (26 mm height, 27 mm diameter) with one open end, containing a 24 mm citric acid impregnated filter and a PTFE (Teflon) membrane for gaseous NH3 diffusion (Supplementary Figure S1). The typical sampling duration for most NH3 sources and ambient NH3 was usually about 1 week. For livestock, NH3 source sampling duration was 1 day. The sampling duration of the third sample of ambient NH3 in June and the first ambient NH3 samples in February 2019 were more than 2 weeks. The detection limit of ALPHA is 0.02 μg/m3.
At each site, the ALPHA sampling system (consisting of three ALPHA samplers) was placed at about 1.5 m above ground (ambient NH3 samples were collected at 20 m above ground in the roof of a teaching building), and under a PVC shelter to prevent sampler from rain and sunlight (Supplementary Figure S1). A total of 212 NH3 source samples and 45 ambient NH3 samples were collected and analyzed in this study. To avoid contamination, the NH3 absorbent was freshly prepared on the day of sampling. Collected NH3 samples were stored at 4°C until analysis. Three field blanks were prepared for each batch of samples (about 50 samples). These field blanks were brought to each sampling site without installing on the sampler and then transported back to the laboratory. Along with NH3 source samples and ambient NH3 samples, NH3 concentrations of field blanks were analyzed to assess potential contamination during laboratory preparation and sample transport between the field and the laboratory. All the concentration data reported in the following text were subtracted with blank.
Before sampling, the filter was impregnated in the absorbent, which was made by citric acid dissolved in methanol. After sampling, NH3 collected in the filter was extracted with ultrapure water (18.2 MΩ cm, Milli-Q system), and then analyzed as NH4+ by using a continuous-flow analyzer (Seal AA3, Germany). The detection limit was 0.1 mgN/L. The analysis of NH4+ concentration was conducted at the Key Laboratory of Plant–Soil Interactions, Chinese Ministry of Education, China Agricultural University.
The δ15N analysis was performed at the Stable Isotope Ecology Laboratory of Institute of Applied Ecology, Chinese Academy of Sciences, by following the method of Liu et al. (2014). First, NH4+ in leaching liquor was oxidized to NO2− by BrO−, and then, NO2− was quantitatively converted into N2O by reductant under strong acid condition. The performance of the reduction of NO2− to N2O was evaluated by measuring the laboratory standard (NaNO2, −11.7‰, determined by EA-IRMS). The produced N2O was finally collected by a purge and cryogenic trap system (Gilson GX-271, IsoPrime Ltd., Cheadle Hulme, United Kingdom) and the δ15N values were determined on an IRMS (PT–IRMS) (IsoPrime 100, IsoPrime Ltd., Cheadle Hulme, United Kingdom). In this study, the first 119 source samples (collected from March 2017 to January 2018) were analyzed using hydroxylamine (NH2OH) as the reductant. In order to shorten the conversion time of NO2− to NO2 (from 16 h to 4 h), sodium azide (NaN3) was used as reductant when the last 93 source samples (collected from March to October in 2018) and ambient samples were analyzed in the laboratory (Supplementary Table S1). There was no significant influence of isotopic fraction on isotope analysis for changing reductant because NO2− was fully quantitatively converted into N2O by checking the measured δ15N value of laboratory NaNO2 standards. Three international reference standards (IAEAN1, USGS25, and USGS26 with δ15N values of +0.4, −30.4, and +53.7‰, respectively) were used for calibration. The details of analytical procedures are also given elsewhere (Liu et al., 2014).
The concentration of NH3 (C, μg/m3) was calculated as follows:
where me and mb represent the amount of NH3 (μg) collected on sample and blank sample, respectively; V is the effective sampled air volume (V, m3) by the ALPHA sampler, which is determined by the sampling time and the sampling rate of the sampler. V is calculated by the following equation:
where t represents the time of filter exposure to collect NH3 gas (h); D is the diffusion parameter, D = 2.09 × 10⁻⁵ m2/s at 10°C; A represents the sampling area (m2) of the filter, A = 3.4636 × 10⁻⁴ m2; L is the diffusion length (m) from the membrane to the filter, L = 0.006 m.
The N isotope composition (δ15N) is reported in parts per thousand relative to atmospheric N2 as follows:
where 15N and 14N are the atomic mass of 15 and 14, respectively; 15N/14N represents the ratio of nitrogen isotope.
The calibration equation of δ15N is as follows:
where δ15Ncorrected is the corrected values of NH3 sample; δ15Nmeasured is the measured values of NH3 sample; the intercept and slope are from the linear regression of the measured δ15N values of standards and the assigned δ15N values of standards (Liu et al., 2014).
Only traffic source was significantly distinguished from other sources in the δ15N-NH3 value, while sewage, solid waste, human feces, fertilizer, and livestock did not significantly differ from each other. Therefore, those sources that could not be significantly distinguished in δ15N-NH3 values were lumped together as one category (non-traffic source). The contribution of traffic source and non-traffic source to ambient NH3 can be calculated as follows:
where δ15Nambient is the observed values of ambient NH3; δ15Ntraffic, and δ15Nnon-traffic are the measured values of NH3 from traffic and non-traffic source; ftraffic and fnon-traffic are the contribution fraction of traffic and non-traffic source to ambient NH3.
To evaluate the differences in mean δ15N signatures and concentrations among NH3 sources, one-way ANOVA followed by the Student–Newman–Keuls test (S–N–K) was carried out for post hoc multiple comparison at a 5% level of significance. One-way ANOVA was also used to determine any seasonal difference in mean δ15N-NH3 signatures and concentrations among NH3 sources and ambient NH3. For traffic and fertilizer application, Kruskal–Wallis test was conducted to evaluate whether or not there is statistically significant difference between the medium values of δ15N values and NH3 concentrations. The statistical analyses were performed using SPSS Version 25.0.
It can be seen that there is a wide range in NH3 concentration among sources from 3.4 to over 8,000 μg/m3 (Figure 2). The highest average NH3 concentration was found in the livestock farm (3,317.0 ± 2,316.0 μg/m3, n = 34), about 20 times and 70 times higher than human feces (102.3 ± 88.5 μg/m3, n = 50) and fertilizer (31.1 ± 50.3 μg/m3, n = 17), respectively. The mean concentration of NH3 emitted from livestock was significantly different from other five sources (p < 0.05). Larger amount of urea, a kind of volatile nitrogen compound, in livestock and human feces could be responsible for high NH3 concentration (Sha et al., 2020). In addition, NH3 samples for livestock and fecal residue were collected indoor in this study, so the enclosed space resulted in high NH3 accumulation. Large emission of NH3 from urea fertilizer was also detected in this study. NH3 concentration could reach up to 212.3 μg/m3 in the first 3 days after fertilizer application in corn field in summer. For solid waste disposal and sewage treatment (32.0 μg/m3 and 18.8 μg/m3, respectively), the mean concentration was lower than that in other sources. The average NH3 concentration in traffic source was the third highest (47.2 μg/m3, n = 12), as the result of the large traffic volume and the semi-enclosed space in the tunnel. It also provides evidence that traffic could be an important source of NH3.
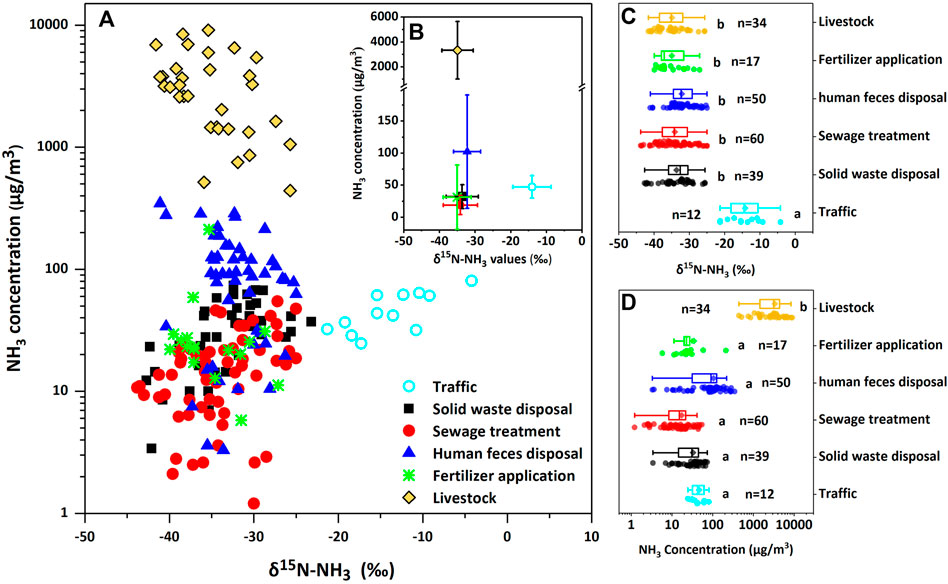
FIGURE 2. The relationship between NH3 concentration and δ15N-NH3 values of each source samples in Beijing. (A) shows the δ15N-NH3 values plotted against NH3 concentration of each source samples. (B) shows the mean δ15N-NH3 values and mean concentration of each sources, error bars indicate standard deviation of each mean. (C,D) are box-plots of δ15N‐ values and concentration of each sources respectively, the square and line within the box represent the mean and median values of δ15N‐NH3 values and concentration, the left and right edges of the box represent the 25th and 75th percentiles of δ15N-NH3 values and concentration, the left and right bars represent the min and max values, different letters adjacent the bars indicate difference among NH3 sources (p < 0.05).
NH3 concentration measured at pig barns in this study was similar to the results of other observations in China (2,369 μg/m3, n = 27, Beijing, Liu et al., 2016; 1,329.6 μg/m3, n = 4, Shanghai, Chang et al., 2016). It was about 20 times higher than that observed for cow and turkey (51.6–165.6 μg/m3, n = 7, Felix et al., 2013), since the ventilation of the pig farm in our sampling site is poor. For human feces disposal, NH3 concentration was about 40 times lower than that determined in the septic tank (over 4,000 μg/m3, n = 8, Chang et al., 2016). In the study of Chang et al. (2016), large amounts of NH3 accumulated in the enclosed septic tank results in higher NH3 concentration, in contrast to less nitrogen compound after treatment in fecal residue and fecal wastewater in this study. In the perspective of fertilizer application, the average concentration of NH3 collected in cropland for fertilizer application was close to that determined in the wheat field (27.5 μg/m3) but much lower than the rice field (99.3 μg/m3) (Ti et al., 2018). It is due to significantly higher NH3 volatilization for rice paddy than wheat land (Huang et al., 2016).
NH3 concentrations exhibited distinct seasonal variations for six sources (Supplementary Figure S2). In most sources, the concentration was higher in spring and summer than other seasons, especially winter. For solid waste disposal and sewage treatment, NH3 concentration in spring and summer was statistically significantly different from fall and winter (p < 0.05). Significant difference was also found in fertilizer application. The mean concentration was significantly higher in summer than in spring (p < 0.05). The temperature could be a major influencing factor. Higher temperature in summer could enhance the NH3 volatilization from emission source. However, livestock source exhibits different seasonal variation. The highest NH3 concentration was found in winter (7,341.5 ± 1,689.7 μg/m3, n = 4) about seven times higher than the lowest concentration in summer (p < 0.05). In winter, all the windows were closed to maintain indoor temperature high and save energy. Since ambient temperature was high in summer, ventilation of pig houses was increased to help cooling, which favors NH3 dispersion. It suggests that the ventilation could be an important influence factor for NH3 concentration in the livestock site. Moreover, human activities might also affect NH3 emission for some source type. For example, the residential water consumption would increase in summer, and the sewage treatment plant took on heavier treatment task. The monthly processing capacity of the Yongfeng sewage treatment plant was increased from about 450,000 m3 in June 2017 to 700,000 m3 in July 2017, which could also contribute to enhance NH3 emission from sewage treatment source in summer.
Figure 2 presents the range of δ15N-NH3 values from NH3 emission source samples (from −43.8 to −4.2‰). All these NH3 source samples were depleted in 15N, exhibited with negative δ15N-NH3 values. In general, there were no statistically significant differences among four seasons in δ15N-NH3 values for all these six sources (Supplementary Figure S2). The NH3 collected from traffic source has the highest δ15N-NH3 values ranged from −21.3 to −4.2‰ with an average of −14.0 ± 4.9‰ (n = 12). It is significantly distinguished from other sources (p < 0.05) due to its relative abundance of 15N. NH3 from fertilizer, livestock, solid waste, sewage, and human feces were more depleted in 15N and represented similar δ15N-NH3 values (−35.0 ± 3.9‰, −34.9 ± 4.4‰, −33.6 ± 4.5‰, −34.1 ± 4.8‰, and −32.0 ± 4.6‰, respectively, see Table 1). These sources were most likely dominated by the process of NH3 volatilization and appearing in similar and depleted δ15N-NH3 values. It was also mentioned by Chang et al. (2016) and Stratton et al. (2019) before. Because of the kinetic isotopic fractionation associated with volatilization, lighter isotope (14NH3) tends to volatilize more easily than heavier isotope (15NH3). According to Melander and Saunders (1980), it almost always leads to the 15N enrichment in substrate and 15N depletion in product. So the NH3 from volatile sources represented negative δ15N values.
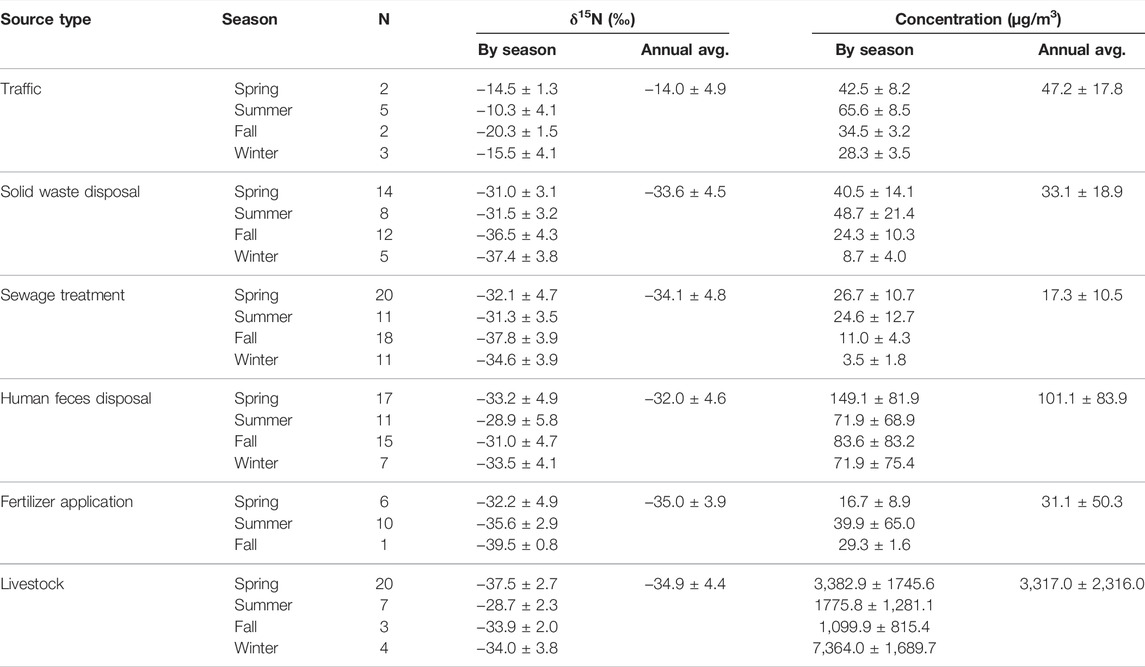
TABLE 1. δ15N values and NH3 concentration of six NH3 emission sources in Beijing.
The comparison between this study and previous reports are shown in Figure 3. The results in traffic source were similar to the tunnel observation in Shanghai and downwind monitoring in Albert (−14.2 ± 2.8‰, n = 8, Chang et al., 2016; −14.9‰, n = 4, Savard et al., 2017). Comparing with the observation in Colorado (−4.6‰ and 2.2‰, n = 2, Felix et al., 2013), the average δ15N-NH3 values was lower in this study. Moreover, there is no significant difference in urban waste sources between this study and the observation conducted by Chang et al. (2016). Both Beijing and Shanghai are highly developed megacities with dense population and captured with relatively advanced waste treatment facilities. It could be responsible for the similar δ15N-NH3 values.
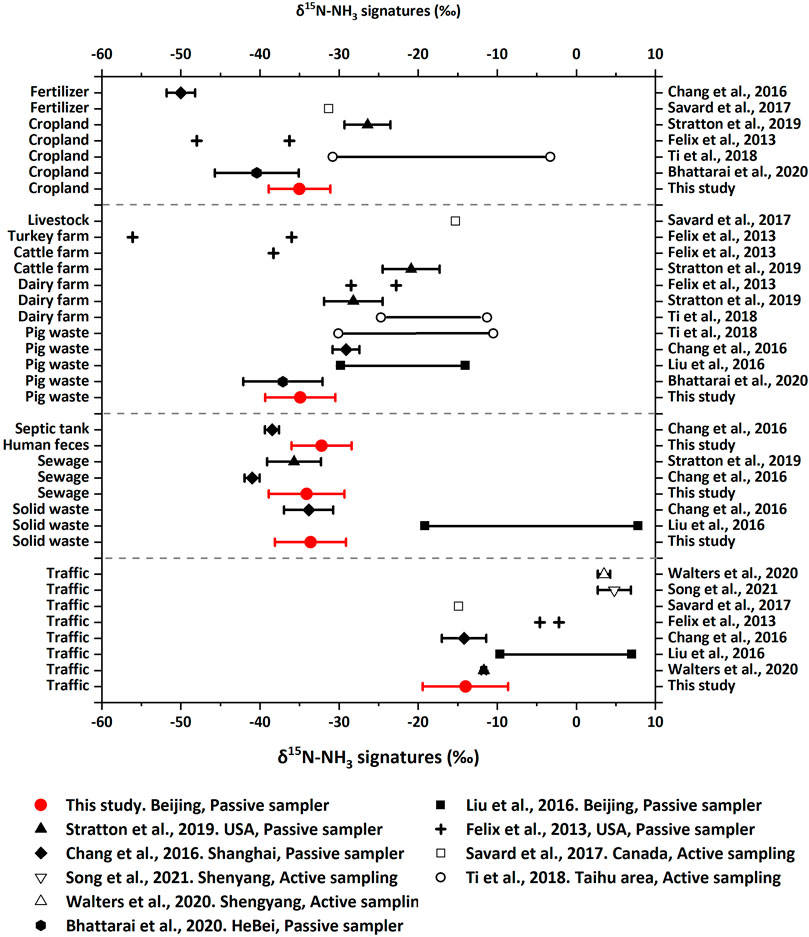
FIGURE 3. Comparison of δ15N values for major NH3 emission sources in this study to other studies.
However, livestock and fertilizer show different results from other studies. Overall, the δ15N-NH3 values of livestock sampled in pig houses, ranging from −41.1 to −25.7‰ (n = 34) were relatively lower than other observations (Figure 3). For NH3 volatilized from fertilizer application, results in this study (−39.5 to −27.1‰, n = 17) are similar to that reported in Canada (Savard et al., 2017). The observation in cropland is much higher than that conducted by Chang et al. (2016), since the results in this study represent the NH3 emission in cropland while Chang et al. (2016) reported laboratory results. In addition, the difference could also be due to the difference in the NH3 sampling method. It could be found from Figure 3 that NH3 collected by passive samplers present lower δ15N values than active sampling systems. Passive samplers trap gaseous NH3 through diffusion, and lighter 14NH3 is more easily diffused and adsorbed by acid coating filters. It could lead to the lower δ15N-NH3 values detected by the ALPHA sampler in this study. Skinner et al. (2006) reported similar results.
From 26 March 2018 to 17 March 2019, the temporal variations of average concentration of ambient NH3 are shown in Figure 4A. During the sampling period, the average concentration of NH3 was 12.9 ± 6.0 μg/m3 (ranged from 3.6 to 25.1 μg/m3). The highest NH3 concentration was found in 18-Jul-W2 (July 9 to 23, 2018), which was about eight times higher than the lowest determined in 18-Dec-W4 (December 24 to 31, 2018). Monthly trend of ambient NH3 concentration is shown in Figure 4B. The average concentration of NH3 increased month by month from March 2018 and reached the maximum in July 2018 (21.8 ± 4.9 μg/m3). Then it began to decrease and fell to the lowest in winter (6.1 ± 1.9 μg/m3, February 2019). Significant seasonal variation of NH3 concentration could be found in Figure 4C. The average concentration of NH3 in summer, spring, fall, and winter were 19.0 ± 4.5 μg/m3, 16.1 ± 5.4 μg/m3, 10.5 ± 2.2 μg/m3, and 6.6 ± 1.8 μg/m3, respectively. NH3 concentration was relatively high in summer and spring and low in fall and winter. NH3 emission from agricultural sources was enhanced in spring and summer, which had been reported in emission inventory (Huang et al., 2012; Kang et al., 2016). It could contribute to the higher NH3 concentration. Ambient temperature had good correlation with NH3 concentration (R = 0.768, p < 0.001), which could be an important meteorological factor for the seasonal variation of NH3. Higher temperature could promote the NH3 volatilization from soil, water, and emission sources like fertilizer and livestock (Ianniello et al., 2010).
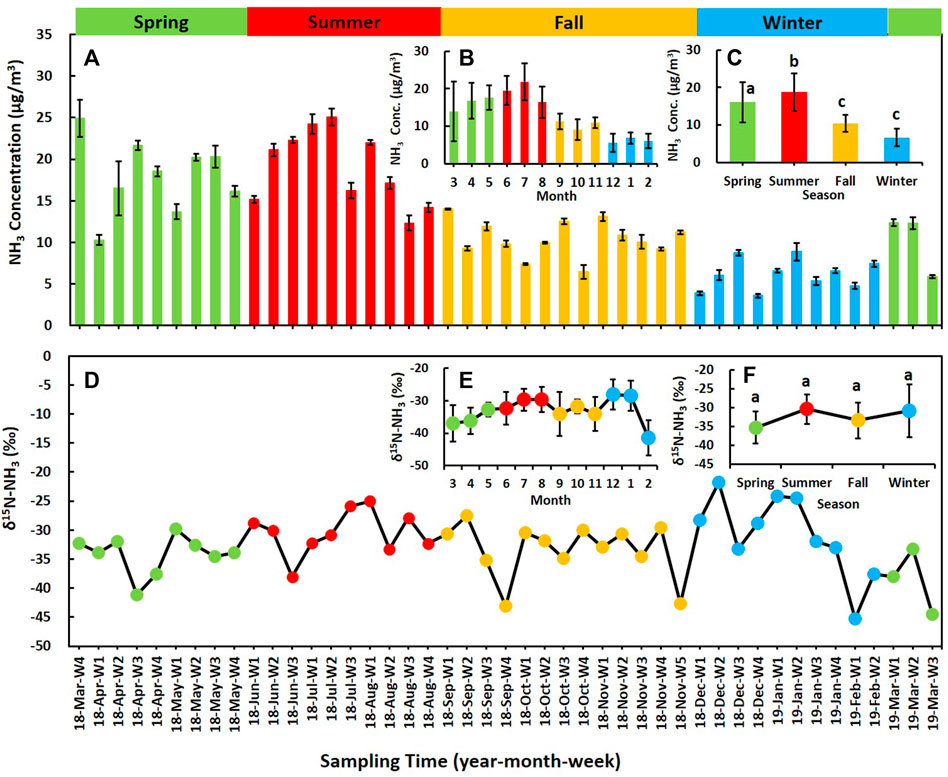
FIGURE 4. Time series of ambient NH3 concentration and δ15N values. (A) shows the concentration of weekly NH3 samples. (B) shows the monthly average NH3 concentration. (C) shows the average concentration of NH3 in four seasons. (D) shows δ15N value and concentration of weekly NH3 samples. (E) shows the monthly average of δ15N-NH3 value. (F) shows the average δ15N-NH3 value in four seasons. Different letters on the top of the error bars on (C) and (F) indicate significant difference in mean NH3 concentration and insignificant difference in mean δ15N values among four seasons (p < 0.05).
Table 2 shows the comparison of concentration of ambient NH3 between this study and previous observation. The NH3 concentration in urban Beijing has no significant rise in recent years. The annual average concentration of NH3 was close to previous reports using passive samplers (13.3 μg/m3, Zhang et al., 2018; 13.7 μg/m3, Pan et al., 2018b). The result in winter (18.2 μg/m3) reported by Zhao et al. (2016) was about three times higher than this study. Compared with the generally higher NH3 concentrations in Chinese cities, there were relatively lower NH3 concentrations in some developed regions (Table 2). NH3 concentration in urban Beijing was higher than the urban sites in Spain (4.7 ± 2.1 μg/m3, Madruga et al., 2018; 3.9 ± 2.1 μg/m3, Reche et al., 2012) and the United States (1.8 μg/m3, nine sites in the United States, Felix et al., 2017). It suggests that NH3 emission intensity in Beijing could be higher than these developed countries. In the three developing sites in Table 2, NH3 concentration in Beijing was close to India and lower than Egypt. It also suggests that developing areas with more serious fine particle pollution and a higher NH3 level should pay more attention to NH3 reduction.
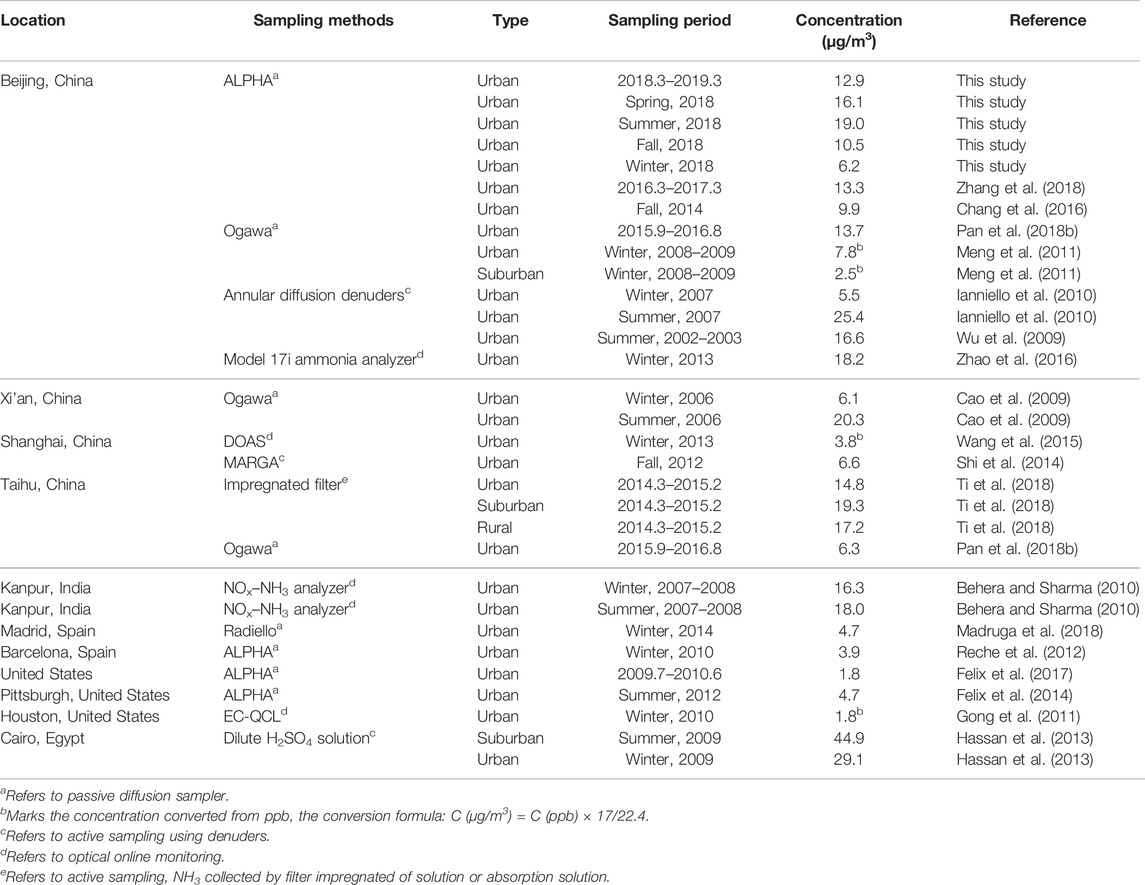
TABLE 2. Comparison of concentration and δ15N values of ambient NH3 concentration.
From 26 March 2018 to 17 March 2019, the time series of the δ15N value of ambient NH3 are shown in Figure 4D. In general, most of the data fell within the range of δ15N-NH3 values of non-traffic sources. Ranging from −44.5 to −21.8‰, the mean δ15N values of ambient NH3 was −32.7 ± 5.3‰. The mean δ15N-NH3 values in summer (−30.4 ± 3.8‰) and winter (−30.9 ± 7.0‰) were slightly higher than spring (−35.3 ± 4.2‰) and fall (−33.4 ± 4.8‰). The δ15N-NH3 values had no significant correlation with NH3 concentration (R = 0.042, p = 0.782). It was also not correlated with ambient temperature in urban Beijing (R = −0.028, p = 0.855). In contrast to NH3 concentration, no significant seasonal variation was found in δ15N-NH3 values (Figure 4F).
In some weeks, the δ15N-NH3 values was very deplete, and it even more depleted than the lowest δ15N-NH3 values in the source profile (−43.8‰, in oxidation ditch, sewage treatment). N isotope fractionation could happen during the aerosol formation process, the collected NH3 was not initial NH3 mixing from sources. According to the previous study, aerosol formation could result in lower δ15N values of collected NH3, compared to initial gaseous NH3. The δ15N-NH3 values could decrease from −5 to −20‰ in gaseous NH3 and increase from +5 to +20‰ in aerosol through the process of aerosol formation (Heaton et al., 1997; Pan et al., 2018a). It could also be influenced by the volatilization from unstable ammonium particles (such as NH4NO3 and NH4Cl). Another reason is that possible N isotope fractionation could also occur during long-range transport of air mass (Bhattarai et al., 2021). δ15N-NH3 was also dependent on the fraction (f) of the total initial gaseous NH3 converted to NH4+ ion (NH4+/(NH4++NH3)) (Heaton et al., 1997). It confirmed that δ15N-NH4+ increases with f value increases, and logically the δ15N value of unconverted NH3 would be lower. In addition, potential source contribution function analysis (PSCF) was performed to explore the possible source region and transport distance of air mass in PKU site. The principle and calculation formulas of PSCF are shown in the Supplementary Text S1. The whole study period was divided into two groups for PSCF analysis: δ15N-NH3 values lower than −33.7‰ (the mean value of non-traffic sources) and δ15N-NH3 values higher than −33.7‰. According to the results of PSCF analysis, in both of two groups, most of the air masses were arriving from the southeast areas at the PKU site. For the weeks with more depleted δ15N-NH3 values, weighted PSCF values in Beijing city and its surrounding areas (Supplementary Figure S3A) were much lower than other weeks (Supplementary Figure S3B). It suggested that local emission and short-range transport of air mass may contribute less to ambient NH3 in the PKU site, while the long-range transport of air mass from further areas may has an influence on that during these weeks. N isotope fractionation happened with the long-range transport of air mass, resulting in more depleted δ15N-NH3 values.
Table 3 shows the comparison of δ15N-NH3 values between this study and previous reports. Compared with earlier studies using passive samplers, the determined δ15N-NH3 values in this study are close to that conducted in urban Beijing (−35.0 ± 5.4‰, fall, Chang et al., 2016) and urban Shanghai (−31.7 ± 3.4‰, summer, Chang et al., 2019). However, it is lower than that reported from other foreign regions like the United States (−8.5 ± 7.2‰, Pittsburgh, Felix et al., 2014; −15.2‰, mean value in nine sites, Felix et al., 2017), Japan (−14.5 to −1.0‰, Hayasaka et al., 2011), and Czech Republic (−24.8 and −10.3‰, Buzek et al., 2017). It suggested that the source of NH3 could be different in urban Beijing and foreign areas. Lower δ15N-NH3 values in Beijing show NH3 could more likely originate from non-traffic sources, while NH3 in the United States could be more come from combustion-related source (like traffic). By the way, δ15N-NH3 values in the urban site in Taihu areas (−23.0‰ to −5.1‰) were higher than this study in Beijing, even for the rural area (−24.2 to −3.0‰). One possible reason is the distinguished sampling methods between our studies. δ15N values of NH3 collected by active sampling systems could be higher than the passive sampler (Pan et al., 2020). It could also result from the difference of meteorological condition between Beijing and Taihu areas. The annual temperature in Taihu areas is higher than that in Beijing, which was always higher than zero in winter (Ti et al., 2018).
TABLE 3. Comparison of concentration and δ15N values of ambient NH3 concentration and δ15N-NH3 values.
To further quantify the contribution of sources to the NH3 in ambient air in urban Beijing using newly developed pool of δ15N-NH3 signature, isotope mixing equations was applied. The δ15N-NH3 source profile shows that only traffic source was significantly distinguished with other sources in δ15N-NH3 value. Others sources (sewage, solid waste, human feces, fertilizer, and livestock) did not significantly differ from each other. When the δ15N-NH3 values of some sources could not be significantly distinguished, they could be pooled together to reduce the number of sources (Phillips and Gregg, 2003). Therefore, these sources with close δ15N-NH3 values were pooled together as the non-traffic source in calculation. The average δ15N-NH3 values for traffic source and non-traffic sources (−14.0‰, and −33.7‰) were served as the baseline input to the isotope mixing equation because the δ15N-NH3 values of emission source shows no significant seasonal variation in this study.
The contribution of traffic source and non-traffic source to ambient NH3 in each week during the monitoring campaign (from 26 March 2018 to 17 March 2019) is shown in Figure 5. In general, the annual average contribution of traffic and non-traffic source was 8 and 92%, respectively. It suggests that NH3 mainly comes from non-traffic source during the whole monitoring campaign in the PKU site. Considering that in some weeks the δ15N-NH3 values were lower than the average of non-traffic sources and without feasible solution, the mean source proportion was figured out by putting the annual average δ15N values into isotope mixing equation rather than calculating the average of weekly contribution. The weeks (19-Feb-W1 and 19-Mar-W3) in which δ15N-NH3 values lower than lowest value (−43.8‰, in oxidation ditch, sewage treatment) were not included in calculation to minimize the influence of isotope fraction. The uncertainty was also assessed in this study. The standard error of source proportion was 4% for calculated source proportion of traffic and non-traffic sources. The uncertainty assessment in source apportionment was conducted by ISOERROR (v1.04), which takes the isotope values variability of both NH3 sources and ambient NH3 into consideration. The principle and calculation formulas of ISOERROR are shown in the Supplementary Text S2, more detailed information could be found in Phillips and Gregg (2001).
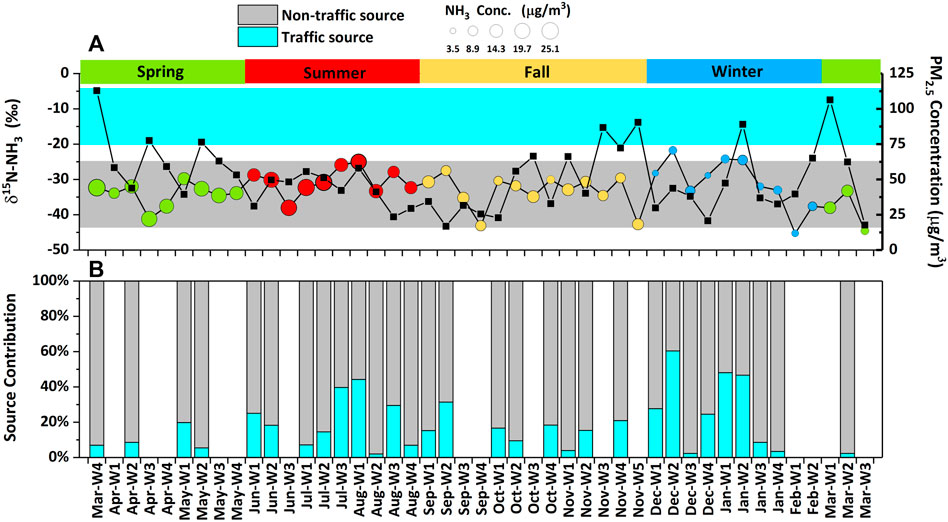
FIGURE 5. The contribution proportion of traffic source and non-traffic sources to ambient NH3. (A) shows the δ15N-NH3 value, NH3 concentration, and PM2.5 concentration. (B) shows the contribution of traffic source and non-traffic sources to ambient NH3.
The traffic source proportion to ambient NH3 in summer, fall, and winter was 17, 2, and 22%, respectively (the stand error was 9, 8, and 14%, respectively). Although the mean δ15N-NH3 in spring had no satisfactory solution and then was removed, the comparison of the mean δ15N-NH3 value could also help to evaluate NH3 sources between spring and winter qualitatively. The mean δ15N-NH3 value in spring (−35.3 ± 4.2‰, ranging from −29.8 to −44.5‰) was lower than that in winter (−30.9 ± 7.0‰, ranging from −21.8 to −45.3‰), suggesting that non-traffic source may contribute more to NH3 at sampling site. Furthermore, part of samples in spring was still available to compare the contributions of traffic emissions to NH3 between winter and spring (Figure 5B), in spite that the removal of data in spring might lead to an underestimate in the contribution of non-traffic NH3 emission sources with low δ15N-NH3. It shows that traffic contributed more to ambient NH3 in winter and summer than other seasons at the PKU site. Due to agricultural timing, NH3 emitted from agricultural sources was reduced in winter and enhanced in spring. Low temperature was also not conducive to the volatilization of NH3 from sources in winter. So the calculated contribution proportion of traffic was increased in winter compared with spring. Specially in winter, NH3 reduction should be paid more attention for haze mitigation,considering that haze happened more frequently in this season.
The results of sources apportionment in this study were evaluated against the online monitoring of NH3. From March 2018 to March 2019, continuous online monitoring (hourly temporal resolution) of ambient NH3 was conducted by the In situ gas and aerosol composition monitoring system (IGAC, Model S-611, Fortelice International Co., Ltd.) at the PKU site at the same time. More detailed information of IGAC could be found in Young et al. (2016). Comparison of IGAC and ALPHA in NH3 concentration was conducted. The hourly NH3 concentration determined by IGAC was averaged to match the time resolution of ALPHA for comparison. The NH3 concentration monitored by IGAC was close to ALPHA passive samplers, and good correlation was found between these two methods (Supplementary Figures S4, S5). The results of NH3 concentration determined by ALPHA and IGAC in this study were credible. It also suggested that NH3 samples collected by ALPHA were effective for further isotope analysis.
Previous studies showed that the diurnal NH3 in the different source region had a distinct daily pattern (Wang et al., 2015). The diurnal NH3 showed a bimodal cycle in the urban area and a single peak in the rural area. It suggests that NH3 diurnal variation could help to distinguish the major source of NH3. By calculating the mean NH3 concentration observed by IGAC in each hour in a day, the NH3 diurnal variations in four seasons during monitoring campaign are displayed in Supplementary Figure S6. To make sure the NH3 diurnal drawn in this study could reveal the true trend of ambient NH3 at the PKU site, only the days with more than 20 h effective hourly NH3 concentration data were included in calculation. Distinct difference could be found between winter and other seasons. The single peak pattern (at 09:00–10:00) of NH3 diurnal was found in spring, summer, and fall. Ambient temperature also shows similar diurnal trends to NH3 concentration. It suggests NH3 from volatile sources could play an important role in these seasons. In contrast, the NH3 diurnal shows two peaks at 08:00–09:00 in the morning and 23:00–01:00 at the night in winter. It was consistent with traffic emission in Beijing. The NH3 concentration peak at 23:00–01:00 could be caused by diesel trucks, because diesel trucks are only allowed to enter the fifth ring road from 23:00 at night to 6:00 the next day in Beijing. The significant difference of NH3 diurnal between winter and other seasons suggests that the contribution of traffic to ambient NH3 could increase in winter. It is consistent with the results by the isotope method.
Comparison between the calculated traffic contribution in this study and the results using NH3 emission inventory was also conducted in this study. From November 2016 to March 2017, the monthly NH3 emissions were compiled at a 1× 1 km grid by five sources (traffic, coal combustion, urban waste, fertilizer, and livestock) in the Beijing–Tianjin–Hebei region. To achieve reliable NH3 emission calculation, native experiments results were considered and emission factors were parameterized by meteorological and other factors. More details of emission inventory could be found in previous studies (Huang et al., 2012; Kang et al., 2016). Considering that NH3 is transported on a regional scale, the source analysis of NH3 was based on the emission inventory in the Beijing–Tianjin–Hebei region. The emission inventory showed that the contribution of traffic, coal combustion, urban waste, fertilizer, and livestock were 15, 12, 5, 27, and 41%, respectively. From November 2018 to March 2019, the average δ15N values of NH3 were −31.6‰, the calculated contribution of traffic and non-traffic source was 11 and 89%. In general, source apportionment results of two methods in traffic were close, suggesting that the results in this study were relatively reliable.
Our study reported the δ15N source profiles of NH3 in urban Beijing for the first time, and the overall δ15N values of NH3 sources were −14.0 ± 4.9, −35.0 ± 3.9, −34.9 ± 4.4, −33.6 ± 4.5, −34.1 ± 4.8, and −32.0 ± 4.6‰, for traffic, fertilizer, livestock, solid waste, sewage, and human feces, respectively. No significant seasonal variation of the δ15N signature of NH3 from sources was found. The δ15N-NH3 values of solid waste, sewage, human feces, fertilizer, and livestock (NH3 volatilized from volatile nitrogen compound directly) were more depleted and overlapped, significantly different from that emitted from traffic. The mechanism of NH3 formation could be a key influence factor of δ15N-NH3 values.
In addition, the contribution of traffic and non-traffic sources to ambient NH3 was quantified by using isotope mixing equation in urban Beijing from March 2018 to March 2019. The average contribution proportion of traffic and non-traffic sources was 8 and 92%, respectively. The contribution of traffic was increased in winter, with an average of 22%. The weekly contribution of traffic could reach to over 50%. The increased contribution of traffic to the ambient NH3 during winter time indicating that control the NH3 emitted from a vehicle exhaust could be meaningful to NH3 reduction in urban Beijing.
There still exists uncertainty of source apportionment using δ15N. First, the δ15N-NH3 values could not be significantly distinguished among fertilizer, livestock, sewage, solid waste, and human feces. Only the contribution of traffic and non-traffic sources could be figured out to a relatively reliable degree. Second, some potential sources (such as biomass burning, coal, and soil) were not involved in the source profile so far. δ15N of NH3 emitted from the volatilization of ammonium particles was hard to determine. Thus, it is still important to make the current source profile more complete. Last, the isotope fraction could happen during aerosol formation and other process. How to determine the initial δ15N of mixed NH3 from sources in ambient air is still an important task. Combining multiple methods could help to achieve more reliable source apportionment of NH3 in the future.
The observed data of NH3 source profile are available on Supplementary Material at https://www.frontiersin.org/articles/10.3389/fenvs.2022.903013/full#supplementary-material. Publicly available datasets were analyzed in this study. These data can be found here: http://data.cma.cn/data/detail/dataCode/A.0012.0001.html.
AT conceived and designed the project; MZ guided data analyses and manuscript writing; CW and XJL handled the field observation and laboratory experiments; CW and AT performed the data analyses and prepared the original draft; TZ and MC took part in the original draft writing; XM, YZ, XML, AT, MZ, and XJL reviewed and edited the manuscript; AT, MZ, and XJL were responsible for project administration and funding acquisition, and all authors joined result discussion and commented on the manuscript.
This work was financially supported by the National Natural Science Foundation of China (41730855, 42030708), the National Key R&D program of China (2016YFC0207906-1, 2017YFC0210101), and the High-level Innovative Talent Project of China Agricultural University.
The authors declare that the research was conducted in the absence of any commercial or financial relationships that could be construed as a potential conflict of interest.
All claims expressed in this article are solely those of the authors and do not necessarily represent those of their affiliated organizations, or those of the publisher, the editors, and the reviewers. Any product that may be evaluated in this article, or claim that may be made by its manufacturer, is not guaranteed or endorsed by the publisher.
Special thanks go to Yu Song for providing the results of NH3 emission inventory for the estimation of source apportionment results. The authors thank Zhipeng Sha and Tiantian Lv for their kind assistance in NH3 source sampling and Yali Jin and Junyi Liu for their kind help in NH3 online monitoring.
The Supplementary Material for this article can be found online at: https://www.frontiersin.org/articles/10.3389/fenvs.2022.903013/full#supplementary-material
Ansari, A. S., and Pandis, S. N. (1998). Response of Inorganic PM to Precursor Concentrations. Environ. Sci. Technol. 32 (18), 2706–2714. doi:10.1021/es971130j
Behera, S. N., and Sharma, M. (2010). Investigating the Potential Role of Ammonia in Ion Chemistry of Fine Particulate Matter Formation for an Urban Environment. Sci. Total Environ. 408 (17), 3569–3575. doi:10.1016/j.scitotenv.2010.04.017
Behera, S. N., Sharma, M., Aneja, V. P., and Balasubramanian, R. (2013). Ammonia in the Atmosphere: a Review on Emission Sources, Atmospheric Chemistry and Deposition on Terrestrial Bodies. Environ. Sci. Pollut. Res. 20 (11), 8092–8131. doi:10.1007/s11356-013-2051-9
Bhattarai, N., Wang, S., Xu, Q., Dong, Z., Chang, X., Jiang, Y., et al. (2020). Sources of Gaseous NH3 in Urban Beijing from Parallel Sampling of NH3 and NH4+, Their Nitrogen Isotope Measurement and Modeling. Sci. Total Environ. 747, 141361. doi:10.1016/j.scitotenv.2020.141361
Bhattarai, N., Wang, S., Pan, Y., Xu, Q., Zhang, Y., Chang, Y., et al. (2021). δ15N-stable Isotope Analysis of NHx: An Overview on Analytical Measurements, Source Sampling and its Source Apportionment. Front. Environ. Sci. Eng. 15 (6), 126. doi:10.1007/s11783-021-1414-6
Bouwman, A. F., Lee, D. S., Asman, W. A. H., Dentener, F. J., Van Der Hoek, K. W., and Olivier, J. G. J. (1997). A Global High-Resolution Emission Inventory for Ammonia. Glob. Biogeochem. Cycles 11 (4), 561–587. doi:10.1029/97GB02266
Buzek, F., Cejkova, B., Hellebrandova, L., Jackova, I., Lollek, V., Lnenickova, Z., et al. (2017). Isotope Composition of NH3, NOx and SO2 Air Pollution in the Moravia-Silesian Region, Czech Republic. Atmos. Pollut. Res. 8 (2), 221–232. doi:10.1016/j.apr.2016.08.011
Cao, J.-J., Zhang, T., Chow, J. C., Watson, J. G., Wu, F., and Li, H. (2009). Characterization of Atmospheric Ammonia over Xi'an, China. Aerosol Air Qual. Res. 9 (2), 277–289. doi:10.4209/aaqr.2008.10.0043
Chang, Y., Liu, X., Deng, C., Dore, A. J., and Zhuang, G. (2016). Source Apportionment of Atmospheric Ammonia before, during, and after the 2014 APEC Summit in Beijing Using Stable Nitrogen Isotope Signatures. Atmos. Chem. Phys. 16 (18), 11635–11647. doi:10.5194/acp-16-11635-2016
Chang, Y., Zou, Z., Zhang, Y., Deng, C., Hu, J., Shi, Z., et al. (2019). Assessing Contributions of Agricultural and Nonagricultural Emissions to Atmospheric Ammonia in a Chinese Megacity. Environ. Sci. Technol. 53 (4), 1822–1833. doi:10.1021/acs.est.8b05984
Chang, Y. H. (2014). Non-Agricultural Ammonia Emissions in Urban China. Atmos. Chem. Phys. Discuss. 14 (6), 8495–8531. doi:10.5194/acpd-14-8495-2014
Felix, J. D., Elliott, E. M., Gish, T. J., McConnell, L. L., and Shaw, S. L. (2013). Characterizing the Isotopic Composition of Atmospheric Ammonia Emission Sources Using Passive Samplers and a Combined Oxidation-Bacterial Denitrifier Approach. Rapid Commun. Mass Spectrom. 27 (20), 2239–2246. doi:10.1002/rcm.6679
Felix, J. D., Elliott, E. M., Gish, T., Maghirang, R., Cambal, L., and Clougherty, J. (2014). Examining the Transport of Ammonia Emissions across Landscapes Using Nitrogen Isotope Ratios. Atmos. Environ. 95, 563–570. doi:10.1016/j.atmosenv.2014.06.061
Felix, J. D., Elliott, E. M., and Gay, D. A. (2017). Spatial and Temporal Patterns of Nitrogen Isotopic Composition of Ammonia at U.S. Ammonia Monitoring Network Sites. Atmos. Environ. 150, 434–442. doi:10.1016/j.atmosenv.2016.11.039
Gong, L., Lewicki, R., Griffin, R. J., Flynn, J. H., Lefer, B. L., and Tittel, F. K. (2011). Atmospheric Ammonia Measurements in Houston, TX Using an External-Cavity Quantum Cascade Laser-Based Sensor. Atmos. Chem. Phys. 11 (18), 9721–9733. doi:10.5194/acp-11-9721-2011
Gu, M., Pan, Y., Walters, W. W., Sun, Q., Song, L., and Wang, Y. (2022). Vehicular Emissions Enhanced Ammonia Concentrations in Winter Mornings: Insights From Diurnal Nitrogen Isotopic Signatures. Environ. Sci. Technol. 56, 1578–1585. doi:10.1021/acs.est.1c05884
Hassan, S. K., El–Abssawy, A. A., and Khoder, M. I. (2013). Characteristics of Gas-phase Nitric Acid and Ammonium-Nitrate- Sulfate Aerosol, and Their Gas-phase Precursors in a Suburban Area in Cairo, Egypt. Atmos. Pollut. Res. 4 (1), 117–129. doi:10.5094/APR.2013.012
Hayasaka, H., Fukuzaki, N., Kondo, S., Ishizuka, T., and Totsuka, T. (2011). Nitrogen Isotopic Ratios of Gaseous Ammonia and Ammonium Aerosols in the Atmosphere. J. Jpn. Soc. Atmos. Environ. 39 (6), 272–279. (in Japanese). doi:10.11298/taiki1995.39.6_272
Heaton, T. H. E., Spiro, B., Robertson, S. M. C., and Robertson, C. (1997). Potential Canopy Influences on the Isotopic Composition of Nitrogen and Sulphur in Atmospheric Deposition. Oecologia 109 (4), 600–607. doi:10.1007/s004420050122
Holland, E. A., Dentener, F. J., Braswell, B. H., and Sulzman, J. M. (1999). Contemporary and Pre-industrial Global Reactive Nitrogen Budgets. Biogeochemistry 46 (1), 7–43. doi:10.1007/BF01007572
Huang, X., Song, Y., Li, M., Li, J., Huo, Q., Cai, X., et al. (2012). A High-Resolution Ammonia Emission Inventory in China. Glob. Biogeochem. Cycles 26 (1). doi:10.1029/2011GB004161
Huang, R.-J., Zhang, Y., Bozzetti, C., Ho, K.-F., Cao, J.-J., Han, Y., et al. (2014). High Secondary Aerosol Contribution to Particulate Pollution during Haze Events in China. Nature 514 (7521), 218–222. doi:10.1038/nature13774
Huang, S., Lv, W., Bloszies, S., Shi, Q., Pan, X., and Zeng, Y. (2016). Effects of Fertilizer Management Practices on Yield-Scaled Ammonia Emissions from Croplands in China: a Meta-Analysis. Field Crops Res. 192, 118–125. doi:10.1016/j.fcr.2016.04.023
Ianniello, A., Spataro, F., Esposito, G., Allegrini, I., Rantica, E., Ancora, M. P., et al. (2010). Occurrence of Gas Phase Ammonia in the Area of Beijing (China). Atmos. Chem. Phys. 10 (19), 9487–9503. doi:10.5194/acp-10-9487-2010
Kang, Y., Liu, M., Song, Y., Huang, X., Yao, H., Cai, X., et al. (2016). High-resolution Ammonia Emissions Inventories in China from 1980 to 2012. Atmos. Chem. Phys. 16 (4), 2043–2058. doi:10.5194/acp-16-2043-2016
Kirkby, J., Curtius, J., Almeida, J., Dunne, E., Duplissy, J., Ehrhart, S., et al. (2011). Role of Sulphuric Acid, Ammonia and Galactic Cosmic Rays in Atmospheric Aerosol Nucleation. Nature 476 (7361), 429–433. doi:10.1038/nature10343
Li, M., Liu, H., Geng, G., Hong, C., Liu, F., Song, Y., et al. (2017). Anthropogenic Emission Inventories in China: a Review. Natl. Sci. Rev. 4 (6), 834–866. doi:10.1093/nsr/nwx150
Liu, X., Zhang, Y., Han, W., Tang, A., Shen, J., Cui, Z., et al. (2013). Enhanced Nitrogen Deposition over China. Nature 494 (7438), 459–462. doi:10.1038/nature11917
Liu, D., Fang, Y., Tu, Y., and Pan, Y. (2014). Chemical Method for Nitrogen Isotopic Analysis of Ammonium at Natural Abundance. Anal. Chem. 86 (8), 3787–3792. doi:10.1021/ac403756u
Liu, J., Zhang, Y., Liu, X., Tang, A., Qiu, H., and Zhang, F. (2016). Concentrations and Isotopic Characteristics of Atmospheric Reactive Nitrogen Around Typical Sources in Beijing, China. J. Arid. Land 8 (6), 910–920. doi:10.1007/s40333-016-0020-0
Liu, L., Xu, W., Lu, X., Zhong, B., Guo, Y., Lu, X., et al. (2022). Exploring Global Changes in Agricultural Ammonia Emissions and Their Contribution to Nitrogen Deposition since 1980. Proc. Natl. Acad. Sci. U.S.A. 119 (14), e2121998119. doi:10.1073/pnas.2121998119
Madruga, D. G., Patier, R. F., Puertas, M. A. S., García, M. D. R., and López, A. C. (2018). Characterization and Local Emission Sources for Ammonia in an Urban Environment. Bull. Environ. Contam. Toxicol. 100 (4), 593–599. doi:10.1007/s00128-018-2296-6
Melander, L., and Saunders, W. H. (1980). Reaction Rates of Isotopic Molecules. Chicheste, New York, USA: Wiley-Interscience, 12–16.
Meng, Z. Y., Lin, W. L., Jiang, X. M., Yan, P., Wang, Y., Zhang, Y. M., et al. (2011). Characteristics of Atmospheric Ammonia over Beijing, China. Atmos. Chem. Phys. 11 (12), 6139–6151. doi:10.5194/acp-11-6139-2011
Moore, H. (1974). Isotopic Measurement of Atmospheric Nitrogen Compounds. Tellus 26 (1–2), 169–174. doi:10.1111/j.2153-3490.1974.tb01963.x
Moore, H. (1977). The Isotopic Composition of Ammonia, Nitrogen Dioxide and Nitrate in the Atmosphere. Atmos. Environ. (1967) 11 (12), 1239–1243. doi:10.1016/0004-6981(77)90102-0
Pan, Y., Tian, S., Liu, D., Fang, Y., Zhu, X., Zhang, Q., et al. (2016). Fossil Fuel Combustion-Related Emissions Dominate Atmospheric Ammonia Sources during Severe Haze Episodes: Evidence from 15N-Stable Isotope in Size-Resolved Aerosol Ammonium. Environ. Sci. Technol. 50 (15), 8049–8056. doi:10.1021/acs.est.6b00634
Pan, Y., Tian, S., Liu, D., Fang, Y., Zhu, X., Gao, M., et al. (2018a). Isotopic Evidence for Enhanced Fossil Fuel Sources of Aerosol Ammonium in the Urban Atmosphere. Environ. Pollut. 238, 942–947. doi:10.1016/j.envpol.2018.03.038
Pan, Y., Tian, S., Zhao, Y., Zhang, L., Zhu, X., Gao, J., et al. (2018b). Identifying Ammonia Hotspots in China Using a National Observation Network. Environ. Sci. Technol. 52 (7), 3926–3934. doi:10.1021/acs.est.7b05235
Pan, Y., Gu, M., Song, L., Tian, S., Wu, D., Walters, W. W., et al. (2020). Systematic Low Bias of Passive Samplers in Characterizing Nitrogen Isotopic Composition of Atmospheric Ammonia. Atmos. Res. 243, 105018. doi:10.1016/j.atmosres.2020.105018
Paulot, F., Jacob, D. J., Pinder, R. W., Bash, J. O., Travis, K., and Henze, D. K. (2014). Ammonia Emissions in the United States, European Union, and China Derived by High‐resolution Inversion of Ammonium Wet Deposition Data: Interpretation with a New Agricultural Emissions Inventory (MASAGE_NH3). J. Geophys. Res. Atmos. 119 (7), 4343–4364. doi:10.1002/2013JD021130
Phillips, D. L., and Gregg, J. W. (2001). Uncertainty in Source Partitioning Using Stable Isotopes. Oecologia 127 (2), 171–179. doi:10.1007/s004420000578
Phillips, D. L., and Gregg, J. W. (2003). Source Partitioning Using Stable Isotopes: Coping with Too Many Sources. Oecologia 136 (2), 261–269. doi:10.1007/s00442-003-1218-3
Reche, C., Viana, M., Pandolfi, M., Alastuey, A., Moreno, T., Amato, F., et al. (2012). Urban NH3 Levels and Sources in a Mediterranean Environmentt. Atmos. Environ. 57, 153–164. doi:10.1016/j.atmosenv.2012.04.021
Savard, M. M., Cole, A., Smirnoff, A., and Vet, R. (2017). δ15N Values of Atmospheric N Species Simultaneously Collected Using Sector-Based Samplers Distant from Sources–Isotopic Inheritance and Fractionation. Atmos. Environ. 162, 11–22. doi:10.1016/j.atmosenv.2017.05.010
Sha, Z., Ma, X., Loick, N., Lv, T., Cardenas, L. M., Ma, Y., et al. (2020). Nitrogen Stabilizers Mitigate Reactive N and Greenhouse Gas Emissions from an Arable Soil in North China Plain: Field and Laboratory Investigation. J. Clean. Prod. 258, 121025. doi:10.1016/j.jclepro.2020.121025
Shi, Y., Chen, J., Hu, D., Wang, L., Yang, X., and Wang, X. (2014). Airborne Submicron Particulate (PM1) Pollution in Shanghai, China: Chemical Variability, Formation/dissociation of Associated Semi-volatile Components and the Impacts on Visibility. Sci. Total Environ. 473-474, 199–206. doi:10.1016/j.scitotenv.2013.12.024
Skinner, R., Ineson, P., Hicks, W. K., Jones, H. E., Sleep, D., Leith, I. D., et al. (2004). Correlating the Spatial Distribution of Atmospheric Ammonia with δ15N Values at an Ammonia Release Site. Water Air Soil Pollut. Focus 4 (6), 219–228. doi:10.1007/s11267-004-3032-2
Skinner, R., Ineson, P., Jones, H., Sleep, D., and Theobald, M. (2006). Sampling Systems for Isotope-Ratio Mass Spectrometry of Atmospheric Ammonia. Rapid Commun. Mass Spectrom. 20 (2), 81–88. doi:10.1002/rcm.2279
Song, L., Walters, W. W., Pan, Y., Li, Z., Gu, M., Duan, Y., et al. (2021). 15N Natural Abundance of Vehicular Exhaust Ammonia, Quantified by Active Sampling Techniquess. Atmos. Environ. 255, 118430. doi:10.1016/j.atmosenv.2021.118430
Stratton, J. J., Ham, J., Collett, J. L., Benedict, K., and Borch, T. (2019). Assessing the Efficacy of Nitrogen Isotopes to Distinguish Colorado Front Range Ammonia Sources Affecting Rocky Mountain National Park. Atmos. Environ. 215, 116881. doi:10.1016/j.atmosenv.2019.116881
Sun, Y., Zhuang, G., Tang, A., Wang, Y., and An, Z. (2006). Chemical Characteristics of PM2.5 and PM10 in Haze-Fog Episodes in Beijing. Environ. Sci. Technol. 40 (10), 3148–3155. doi:10.1021/es051533g
Sun, K., Tao, L., Miller, D. J., Pan, D., Golston, L. M., Zondlo, M. A., et al. (2017). Vehicle Emissions as an Important Urban Ammonia Source in the United States and China. Environ. Sci. Technol. 51 (4), 2472–2481. doi:10.1021/acs.est.6b02805
Sutton, M. A., Dragosits, U., Tang, Y. S., and Fowler, D. (2000). Ammonia Emissions from Non-agricultural Sources in the UK. Atmos. Environ. 34 (6), 855–869. doi:10.1016/S1352-2310(99)00362-3
Tang, Y. S., Cape, J. N., and Sutton, M. A. (2001). Development and Types of Passive Samplers for Monitoring Atmospheric NO2 and NH3 Concentrations. Sci. World J. 1, 513–529. doi:10.1100/tsw.2001.82
Ti, C., Gao, B., Luo, Y., Wang, X., Wang, S., and Yan, X. (2018). Isotopic Characterization of NHx-N in Deposition and Major Emission Sources. Biogeochemistry 138 (1), 85–102. doi:10.1007/s10533-018-0432-3
Tian, S., Pan, Y., Liu, Z., Wen, T., and Wang, Y. (2014). Size-Resolved Aerosol Chemical Analysis of Extreme Haze Pollution Events during Early 2013 in Urban Beijing, China. J. Hazard. Mater. 279, 452–460. doi:10.1016/j.jhazmat.2014.07.023
Walters, W. W., Song, L., Chai, J., Fang, Y., Colombi, N., and Hastings, M. G. (2020). Characterizing the Spatiotemporal Nitrogen Stable Isotopic Composition of Ammonia in Vehicle Plumes. Atmos. Chem. Phys. 20 (19), 11551–11567. doi:10.5194/acp-20-11551-2020
Wang, S., Nan, J., Shi, C., Fu, Q., Gao, S., Wang, D., et al. (2015). Atmospheric Ammonia and its Impacts on Regional Air Quality over the Megacity of Shanghai, China. Sci. Rep. 5 (1), 15842. doi:10.1038/srep15842
Warner, J. X., Dickerson, R. R., Wei, Z., Strow, L. L., Wang, Y., and Liang, Q. (2017). Increased Atmospheric Ammonia over the World's Major Agricultural Areas Detected from Space. Geophys. Res. Lett. 44 (6), 2875–2884. doi:10.1002/2016GL072305
Wu, Z., Hu, M., Shao, K., and Slanina, J. (2009). Acidic Gases, NH3 and Secondary Inorganic Ions in PM10 during Summertime in Beijing, China and Their Relation to Air Mass History. Chemosphere 76 (8), 1028–1035. doi:10.1016/j.chemosphere.2009.04.066
Xu, W., Luo, X. S., Pan, Y. P., Zhang, L., Tang, A. H., Shen, J. L., et al. (2015). Quantifying Atmospheric Nitrogen Deposition through a Nationwide Monitoring Network across China. Atmos. Chem. Phys. 15 (21), 12345–12360. doi:10.5194/acp-15-12345-2015
Xu, W., Song, W., Zhang, Y., Liu, X., Zhang, L., Zhao, Y., et al. (2017). Air Quality Improvement in a Megacity: Implications from 2015 Beijing Parade Blue Pollution Control Actions. Atmos. Chem. Phys. 17 (1), 31–46. doi:10.5194/acp-17-31-2017
Young, L.-H., Li, C.-H., Lin, M.-Y., Hwang, B.-F., Hsu, H.-T., Chen, Y.-C., et al. (2016). Field Performance of a Semi-continuous Monitor for Ambient PM2.5 Water-Soluble Inorganic Ions and Gases at a Suburban Site. Atmos. Environ. 144, 376–388. doi:10.1016/j.atmosenv.2016.08.062
Zhang, X., Wu, Y., Liu, X., Reis, S., Jin, J., Dragosits, U., et al. (2017). Ammonia Emissions May Be Substantially Underestimated in China. Environ. Sci. Technol. 51 (21), 12089–12096. doi:10.1021/acs.est.7b02171
Zhang, L., Chen, Y., Zhao, Y., Henze, D. K., Zhu, L., Song, Y., et al. (2018). Agricultural Ammonia Emissions in China: Reconciling Bottom-Up and Top-Down Estimates. Atmos. Chem. Phys. 18 (1), 339–355. doi:10.5194/acp-18-339-2018
Zhang, Y., Benedict, K. B., Tang, A., Sun, Y., Fang, Y., and Liu, X. (2020). Persistent Nonagricultural and Periodic Agricultural Emissions Dominate Sources of Ammonia in Urban Beijing: Evidence from N-15 Stable Isotope in Vertical Profiles. Environ. Sci. Technol. 54 (1), 102–109. doi:10.1021/acs.est.9b05741
Keywords: ammonia, nitrogen isotope, source profile, source apportionment, Beijing
Citation: Wang C, Li X, Zhang T, Tang A, Cui M, Liu X, Ma X, Zhang Y, Liu X and Zheng M (2022) Developing Nitrogen Isotopic Source Profiles of Atmospheric Ammonia for Source Apportionment of Ammonia in Urban Beijing. Front. Environ. Sci. 10:903013. doi: 10.3389/fenvs.2022.903013
Received: 23 March 2022; Accepted: 29 April 2022;
Published: 13 June 2022.
Edited by:
Junwen Liu, Jinan University, ChinaReviewed by:
Woo-Jung Choi, Chonnam National University, South KoreaCopyright © 2022 Wang, Li, Zhang, Tang, Cui, Liu, Ma, Zhang, Liu and Zheng. This is an open-access article distributed under the terms of the Creative Commons Attribution License (CC BY). The use, distribution or reproduction in other forums is permitted, provided the original author(s) and the copyright owner(s) are credited and that the original publication in this journal is cited, in accordance with accepted academic practice. No use, distribution or reproduction is permitted which does not comply with these terms.
*Correspondence: Aohan Tang, YW9oYW50YW5nQGNhdS5lZHUuY24=; Mei Zheng, bXpoZW5nQHBrdS5lZHUuY24=
Disclaimer: All claims expressed in this article are solely those of the authors and do not necessarily represent those of their affiliated organizations, or those of the publisher, the editors and the reviewers. Any product that may be evaluated in this article or claim that may be made by its manufacturer is not guaranteed or endorsed by the publisher.
Research integrity at Frontiers
Learn more about the work of our research integrity team to safeguard the quality of each article we publish.