 Yubin Ma
 Haotian Chen
 Yating Zhao
 Zhengda Li
- 1School of Management, Xi’an University of Architecture and Technology, Xi’an, China
- 2School of Politics and Public Administration, Henan Normal University, Xinxiang, China
High-quality environmental governance (EG) is closely related to its governance mode. Nevertheless, few studies have examined the EG modes from the dual perspectives of quality and quantity. This article utilizes panel data of 30 Chinese provinces from 2003 to 2020 to research the influence of environmental governance efficiency (EGE) and investment (EGI) on EG through a fixed-effect mode. The outcomes show that China’s EG is driven mainly by quantitative EGI. EGE and EGI show significant geographic regions, economic development levels, resource endowments, and stage heterogeneity to EG. In light of these conclusions, this article argues that the future needs to reasonably allocate EGI based on consideration of the heterogeneity of geographical regions, economic development levels, and resource endowments to optimize EGI structure and increase EGE in each province to achieve high-quality EG.
1 Introduction
While China has made remarkable achievements in the process of industrialization and urbanization, it has also caused corresponding damage to natural resources and the ecological environment (Ai et al., 2020; Li et al., 2020). Faced with increasingly severe ecological and environmental problems, the Chinese government has taken a range of environmental governance (EG) steps. For example, the 18th National Congress of the Communist Party of China emphasized ecological civilization construction, and “The Thirteenth Five-Year Plan” clearly proposed promoting the comprehensive prevention and control of atmospheric, water, soil, and other multiple pollutants. China’s environmental governance investment (EGI) also rose from 162.77 billion yuan in 2003 to 1063.89 billion yuan. According to the statistics in the Bulletin of China’s Ecological Environment, the national atmospheric and water environment quality was further improved in 2020, but 135 of the 338 cities at the prefecture level and above still had ambient air quality exceeding the standards, and 77.3% of the monitoring points had poor or extremely poor groundwater quality. The structural, root, and trend pressures of ecological environmental protection have not been fundamentally relieved overall.
There remains much progress to be had in EG. Although large-scale EGI funds can control pollution emissions in the short term, as governance measures continue to make considerable progress, many of the remaining environmental problems are “hard bones” whose complexity and difficulty result in EG falling into the quagmire of “unlimited investment and limited effects” (Xie and Wang, 2019). Second, according to the law of diminishing marginal returns, the cost of EG will gradually increase. If EG does not focus on quality and efficiency, governance speed will not increase in the later stage, or pollution will return. Clearly, the level of EG benefits is inseparable from the EG mode. EG is an essential means and measure for high-quality economic development, and the transformation of its governance mode should be consistent with the transformation of the economic development mode based on the three great changes of quality change as the main body, efficiency change as the mainline and dynamic change as the basis. Such changes will advance environmental governance efficiency (EGE) realistically and continuously, thereby maintaining the stability and sustainability of EG.
In summary, analyzing the current EG mode in China and proposing optimization suggestions have important research value and practical significance for improving the quality of EG. The main contributions of this article are as follows: 1) Through empirical analysis, this article explores whether China’s current EG mode is driven by quality EGE or quantity EGI to provide relevant policy suggestions for realizing high EG. 2) The capital stock of the EG industry is measured for the first time and incorporated into the measurement of EGE as an input indicator. Furthermore, the super epsilon-based measure (Super-EBM) model, which considers the advantages of radial and nonradial data envelopment analysis (DEA) models, is used to accurately measure EGE. 3) This article uses econometric methods to further examine the differences in EG modes under the heterogeneity of geographical regions, economic development levels, and resource endowments to propose policy recommendations suitable for different regional EG modes.
The remaining sections are structured as follows: Section 2 provides the literature review. Section 3 introduces the research methods and data sources. Section 4 specifies the empirical results. Section 5 presents the discussion and limitations. Section 6 offers conclusions and policy implications.
2 Literature Review
Reasonable choice of EG mode is the key to effective improvement of environmental quality. With the modernization of the governance system, EG mode is gradually shifting from government regulation type to market regulation type, enterprise participation type, public participation type, and other multi-subject co-governance EG mode. The existing literature has less research on the EG mode, and mainly focuses on the qualitative analysis of the current situation and defects of the EG mode. Recently, scholars have preferred to explore the impact on EG from the three aspects of government, enterprises, and the public in order to find ways to improve environmental quality.
2.1 Study on the Impact of Government on EG
Due to the negative externalities of environmental pollution and the public goods nature of environmental governance, there is a risk of “market failure” in EG. As the subject of EG, the government is duty-bound to take responsibility for EG (Que et al., 2018). From the perspective of current environmental protection practices in China, local governments mainly formulate and implement EG policies (Pan and Tang, 2021; Wang et al., 2021), environmental audits (Patriarca et al., 2017; Cao et al., 2022) and EGI (Basoglu and Uzar, 2019; Li and Ramanathan, 2020) to improve environmental quality, and achieved certain effects (Xiong et al., 2020; Jiang et al., 2020). However, some scholars pointed out that due to imperfect legal systems (Moshiri and Daneshmand, 2020), the unreasonable allocation of fiscal environmental protection expenditures (López et al., 2011), the existence of corruption (Zhang et al., 2016; Zhao et al., 2022) and spatial spillover effect (He et al., 2018; Zhao et al., 2021), the EG measures implemented by local governments cannot effectively reduce pollution emissions.
2.2 Study on the Impact of Enterprise on EG
As the main source of pollution emissions, the adoption of EG measures by enterprises is the micro-foundation for improving and achieving EG goals (Chen et al., 2020). The innovative behavior of enterprises is considered to be an important way to solve environmental pollution and cope with climate change (Lin et al., 2021), which can increase the proportion of clean energy use while reducing the waste of resources (Feng et al., 2021; Dong et al., 2022; Lin and Ma, 2022). In addition, enterprises can also improve the effect of EG by means of green transformation (Zhu et al., 2021) and improving the efficiency of total factor productivity (Li et al., 2020; Chen and Huo, 2021).
2.3 Study on the Impact of Public on EG
Due to bureaucracy (Garcia and Burns, 2022), rent-seeking (Du et al., 2022), and the failure of multiple principal-agent constraints (Zhou, 2021), there are also “government failures” and “market failures” in EG (Yang et al., 2019). As an important stakeholder of environmental resources, the public has become the third force to improve EG together with local governments and enterprises (Guo and Bai, 2019). At present, the public mainly restricts the environmental behavior of enterprises and urges the government to govern the environment, through letters and visits (Li, 2021), network public opinion (Tang et al., 2018), and other forms, so as to improve the environmental quality. However, at the present, the public is primarily concerned about the impact of environmental problems that have already occurred in their daily lives and has not shown a positive willingness to participate regarding environmental threats that have not yet erupted (Guo and Bai, 2019). Nonetheless, the public, as a complementary force of EG outside the government and enterprises, has a limited degree and depth of participation (Chen et al., 2015; Chu et al., 2022). The public can only express its demands on the environment through specific modes or channels, and its impact on EG is relatively weak compared with the mode dominated by the government and enterprises.
2.4 Literature Gap
In summary, the existing literature mainly focuses on discussing the influencing factors of EG, and there are few studies on the EG mode. Since the rationality of the choice of EG mode is inseparable from the level of environmental effects, this article starts with the goal of high-quality EG and uses empirical analysis to explore whether China’s EG mode is driven by quality EGE or quantitative EGI, which is also the main contribution of this article. Second, the literature has primarily used radial or nonradial models to calculate EGE. However, the radial model ignores the problem of input–output relaxation. Although the nonradial model makes up for this deficiency, it loses the original proportion information of the projected value of the efficiency front, which eventually leads to the inaccurate calculation of the efficiency value. Moreover, a unified evaluation index system has not yet been formed for EGE. When selecting input indicators, most studies have used quantitative indicators such as the total number of industrial wastewater and waste gas treatment facilities or the total investment in fixed assets of the whole society as material input, ignoring the sustainability of capital in the production process and resulting in a calculated EGE that is inconsistent with reality. To compensate for the inadequacy of EGE measurement, this article adopts the perpetual inventory method to calculate the environmental industry capital stock, which is included in the calculation of EGE as an indicator of material capital investment, and the Super-EBM model is used to measure the EGE to obtain a more realistic efficiency value.
3 Methods and Data Sources
3.1 Model Building
Based on the existing research literature, the econometric equation is designed as follows:
where
3.2 Variable Selection
3.2.1 Environmental Governance
In this article, sulfur dioxide emissions per unit GDP (GDPSO2) is selected as the delegate variable for EG. There are two reasons for selecting this indicator. First, SO2 is an important factor in forming acid rain and air pollution. As one of the world’s largest SO2 emitters, China is facing substantial international pressure to reduce emissions (Kanada et al., 2013; Deng et al., 2019; Qian et al., 2020). Second, SO2 is the main pollutant monitored in the Chinese government’s five-year plan, and the data are easy to obtain. Moreover, changes in SO2 quantity reflect the EG situation to a certain extent (Huang, 2018; Zhang and Chen, 2018). In addition, this article standardizes SO2 emissions through regional GDP to eliminate the endogenous impact of the regional economic scale. Furthermore, carbon dioxide emissions per unit of GDP (GDPCO2) and soot and dust emissions per unit of GDP (GDPSD) are used as the robustness test indicators in this article. Since China has not yet collected CO2 emissions data from the relevant provinces, this article applies the “2006 IPCC Guidelines for National Greenhouse Gas Inventory” to estimate CO2 emissions. The calculation formula is:
where
3.2.2 Environmental Governance Efficiency
In this article, the Super-EBM model is used to calculate the EGE of 30 provinces. The input variables selected include the capital, labor, and financial resources invested in the pollution control process of each province, and the output variable is the energy consumption per unit of GDP output. The calculation method of each index is as follows:
1) Capital input. The article uses the perpetual inventory method to evaluate the capital stock of the EG industry. The calculation formula is:
where
The calculation of the capital depreciation rate is the main issue for measuring capital stock. At present, the main methods for calculating the depreciation rate include assuming the depreciation rate (Wu, 2000; Wang and Yao, 2003), estimating the depreciation rate by using the depreciation amount (Escribá-Pérez et al., 2018; Amir-ud-Din et al., 2019), econometric analysis (Hernández and Mauleón, 2005; Ning and Diewert, 2011) and the relative efficiency method (Zhang, 2008; Wu et al., 2014; Long and Herrera, 2016). However, the objectivity of assuming the depreciation rate method is poor, which can easily lead to “expected self-realization.” It is more accurate to estimate the depreciation rate by using the depreciation amount, but this approach does not consider the differences, utilization rate, and investment willingness of various types of capital goods. Due to the random deviation in the course of parameter estimation, the final result of the econometric model method has serious errors, and some assumptions of the production function are not sufficient and need to be discussed (Prucha, 1997). The relative efficiency model is relatively objective and accurate and conforms to the capital goods homogeneity principle of standard investment theory. Therefore, this method is used to calculate the depreciation rate in this article. Different from the simple “consistent” treatment of depreciation rates in various regions of the country by many scholars, this article fully considers the loss of capital goods in the EG industry in various years and areas and calculates the depreciation rate of fixed assets by year and region. The calculation formula is:
where
2) Labor input. The calculation of labor input must consider both the amount of labor input and the quality of labor. Therefore, this article uses the product of the actual year-end headcount of the environmental protection system and the average years of education to represent human capital input.
where EDU represents the average years of education, and
3) Financial input. This is shown by the total operation cost of industrial wastewater and waste gas treatment facilities.
3.2.3 Environmental Governance Investment
EGI refers to the total investment used to improve environmental quality and prevent ecological environmental deterioration, which is different from the previous use of government environmental expenditures indicators to measure EGI (Huang, 2018; Huang, 2021). In this article, the amount of investment in environmental pollution governance in each province is used to measure local environmental control by referring to Wu et al. (2020), Zhang et al. (2022), and Peng et al. (2022). The indicator covers three parts: environmental infrastructure construction investment, industrial pollution source governance investment, and “three simultaneities” environmental protection investment in construction projects. This indicator comprehensively reflects the total investment made by the region in EG and the efforts and determination of local governments, enterprises, and other governance subjects to engage in regional EG and pollution prevention.
3.2.4 Control Variables
This article includes the following control variables in the regression analysis: 1) Level of economic development (PERINC). At present, China still focuses on the extensive development of “emphasis on the economy, light on the environment.” Therefore, regional economic development will inevitably bring about more environmental and resource consumption, thereby increasing environmental pollution emissions. This article uses the ratio of the per capita disposable revenue of various places to the national per capita disposable revenue to characterize the level of economic development. 2) Industrial structure (IND). The higher the proportion of high-energy-consuming industries, the more serious pollution emissions are (Zhao et al., 2022). This article uses the proportion of the output value of the secondary industry in the gross regional product to calculate the industrial structure. 3) Trade openness (TR). There is no consensus on whether trade openness promotes or inhibits pollution emissions (Yin et al., 2015), but trade openness is expected to influence the environment in various provinces. The article measures the openness of regional trade by the proportion of total import and export trade in regional GDP. 4) Fiscal decentralization (FIN). The influence of fiscal decentralization on environmental pollution has two main viewpoints: “race to the bottom” (Que et al., 2018; Zang and Liu, 2020) and “race to the top” (Chen and Chang, 2020; Khan et al., 2021). This article uses the ratio of local per capita fiscal expenditures to central per capita fiscal expenditures to measure the level of regional fiscal decentralization. 5) Foreign direct investment (FDI). As the main method of foreign exchange capital accumulation, foreign direct investment not only fills the domestic funding gap but also exerts an impact on the environment of the host country (Tang and Tan, 2015; Zhang and Zhou, 2016). Therefore, the article uses the amount of actually utilized foreign investment to calculate FDI. 6) Population density (POPUDEN). Regions with higher population density have larger production scales, which result in a higher degree of damage to natural resources, leading to increased pollution emissions. This article uses the proportion of the population at the end of the year in each provincial area. 7) Ecological environment (EE). The ecological environment system has a certain self-cleaning ability (Li et al., 2022), so the environmental pollution degree in areas with a better ecological environment is lower (Deng et al., 2012). In this article, the regional forest area is used to represent the ecological environment.
3.3 Data Sources
The study uses panel data from 30 provinces in China (excluding Tibet) from 2003 to 2020. The data are mainly from the China Statistical Yearbook, China Financial Yearbook, China Environmental Statistics Yearbook, China Environment Yearbook, China Energy Statistical Yearbook, China Fixed Assets Investment Statistical Yearbook, and the National Bureau of Statistics website. In this article, all the price data are treated with the constant price based on 2003, and some missing data are filled by the average growth rate per annum method.
4 Empirical Results
4.1 Descriptive Statistics
Supplementary Table S1 lists the descriptive statistical results of 540 observations for 10 variables. The outcomes show a large standard deviation of GDPSO2, indicating that there are obvious regional differences in EG. There is also significant regional heterogeneity in the core explanatory variable EGI, the cause might be the environmental issues faced by different regions and different stages of economic development so the EGI varies greatly. For example, due to long-term extensive development, developed provinces such as Jiangsu and Zhejiang pay more attention to ecological and environmental protection, so their EGI is also higher, with average annual investments of 23.72 billion yuan and 17.60 billion yuan, respectively. In contrast, the EGI in the underdeveloped provinces, such as Hainan and Qinghai, is relatively smaller due to their good foundation, with average annual investments of 486 million yuan and 491 million yuan, respectively.
4.2 Baseline Regression Result
Before panel measurement estimation, the model needs to be selected. In this article, Hausman test values are used to judge the model. The results show that the fixed-effects model is better than the random-effects model, so this article adopts the fixed-effects model for regression. Supplementary Table S2 reports the regression results of the EGE and EGI impacts on GDPSO2 emissions. After controlling the selected control variables, EGE and EGI are gradually added in Columns (1) and (2). The results show that EGE has no significant effect on GDPSO2 emissions, while with every increase in EGI by 1 unit, GDPSO2 emissions will be reduced by 2.456 units Inputting the EGE and EGI into the regression model (Column 3) demonstrates that EGI, IND, TR, FIN, FDI, and EE can significantly inhibit GDPSO2 emissions at the levels of 1%. In comparison, PERINC can positively promote GDPSO2 emissions at the significance level of 1%. Although EGE and POPUDEN has an inhibitory effect on GDPSO2 emissions, it is not significant. According to the regression results, at present, China’s EG mode relies mainly on quantitative capital investment, and the effect of EGE on EG is not obvious.
4.3 Robustness Test
4.3.1 Replace the Dependent Variable
In this article, GDPCO2 and GDPSD are selected as indicators to measure EG in various provinces to eliminate the conclusion deviation caused by the selection of specific indicators. The regression results in Supplementary Table S3 (Columns 4 and 5) show that EGI has a remarkable inhibitory influence on GDPCO2 emissions and GDPSD emissions, while the effect of EGE is not significant, which is the same as the main results of the basic regression analysis.
4.3.2 Increase Control Variables
Previous studies have shown that provinces with higher public education will primarily focus on environmental problems and have active public participation in activities to improve the surrounding living area and environmental conditions (Li et al., 2022). Moreover, different provinces in China have great differences in ecological environment, economic development levels, and fiscal revenue, so there is room for “adjusting measures to local conditions” regarding the intensity of environmental regulation (Pu and Fu, 2018; Feng et al., 2020), which leads to differences in EGI and EGE of regional. Therefore, the regression results of this article may be affected by the low pollution emissions of provinces with high education levels and high environmental regulations. To eliminate the aforementioned factors, this article incorporates the education levels and environmental regulation intensity into the control variables for regression, in which the education levels (EDU) are being expressed by the number of years of education per capita and the environmental regulation intensity (ERS) is expressed by the number of environmental regulations issued by each province in that year. After the relevant variables are controlled (Columns 6 and 7), EGI still exerts a remarkable inhibitory influence on GDPSO2 emissions, while the effect of EGE is not significant, which further indicates that the results of this article are not affected by the above factors.
4.3.3 Endogenous Test
In the regression model of this article, explanatory variables and explained variables may be mutually causal. The main performance is as follows: on the one hand, EGI will promote the development of relevant EG industries so that they can improve the quality of EG equipment and pollution control technology, thereby reducing pollution emissions. On the other hand, areas with better environmental quality will bring positive externalities, provide opportunities for enterprise development, and attract enterprises to develop in the region to improve regional GDP. Therefore, areas with better environmental quality allow decision-makers to increase investment in EG. Second, for practical reasons, this article cannot list all the factors affecting EG in detail in the regression model, so the influence of missing variables will enter the error term. To control the impact of endogenous problems on the estimation results, this article refers to Xu et al. (2021) and He et al. (2022) and uses the data of the independent variable lagged for one period as its own instrumental variables for 2SLS regression. The reason for this approach is that the lagged period of the variable has a high correlation with the current term, thus effectively avoiding the endogeneity problems caused by the correlation between the current variable and the current residual term. This choice meets the selection criteria for instrumental variables, and its estimation results are credible. The Davison–MacKinnon test results for the endogeneity problem have a p value of 0.53, which cannot reject the assumption that endogeneity has no obvious impact on the estimation results. Moreover, this result shows that the regression results in this article do not have an endogeneity problem.
4.3.4 Collinearity, Heteroscedasticity, and Cross-Sectional Correlation Correction
To avoid the regression results from being affected by collinearity between variables, this article assigns a one-period lag value to all control variables and then performs a substitution regression (Column 8). In addition, this article modifies the heteroscedasticity and cross-section-related problems of panel data (Column 9) to obtain consistent and effective estimators. The regression results remain robust.
4.4 Further Analysis
4.4.1 Influence of Geographical Location, Economic Development Levels and Resource Endowments Difference
Considering the differences in geographical location, development stage, and resource endowments among different regions in China, the driving factors of EG in various provinces under heterogeneous geographical locations, economic development levels, and resource endowments are further discussed. This article primarily uses the following three methods to divide the provinces: first, in light of the geographical location, the national sample is divided into two, the eastern and central regions and the western regions1; second, the per capita disposable income of each province is compared with the national per capita disposable income, the provinces whose average is higher than the national average are classified as economically developed provinces, and those whose average is lower than the national average are classified as economically underdeveloped provinces2; third, referring to the method of Sun and Liu (2016), China is divided into resource-based provinces and nonresource-based provinces3 according to the number of the working population engaged in resource-based industries. More than 40% of the labor force is engaged in resource-based industries4, such as “resource development, production, and business activities”, and these provinces are categorized as resource-based, while the rest are classified as nonresource-based provinces. Supplementary Tables S4, S5 (Columns 10–15) show the regression results according to the above division criteria. The results show that in the eastern and central regions and economically underdeveloped provinces, EGI is the main driving factor for EG. In economically developed provinces and nonresource-based provinces, EG is driven by both EGI and EGE, while in the western regions and resource-based provinces, EGE and EGI have no significant effects on EG.
4.4.2 Time-Division Analysis and Test
In recent years, the central government has paid increasing attention to environmental protection and governance in various provinces. In 2001, the “Tenth Five-Year Plan” for the first time promoted environmental protection and pollution control as a national strategy. In December 2005, the State Council issued “The decision on implementing the scientific outlook on development and strengthening environmental protection,” which clearly pointed out that environmental conservation should be considered as important in the annual selection, appointment and turnover assessment of leading groups and cadres, weakened the strong incentive effect of the “promotion championship” by using the “forced” mechanism, and promoted leading cadres to establish the concept of ecological civilization by protecting nature, saving energy and reducing pollution. Accordingly, this article divides the research period into two periods, 2003–2005 and 2006–2020, to analyze deeply whether the driving factors of EG have changed after the strengthening of environmental policies. The time-segment regression results of Columns (16) and (17) in Supplementary Table S5 show that EGE and EGI from 2003 to 2005 did not play a significant role in EG. After the environmental protection indicators are included in the performance evaluation in 2006, EGI significantly reduces GDPSO2 emissions at the level of 1%, but the effect of EGE on the governance of GDPSO2 emissions is still unremarkable.
5 Discussion and Limitations
5.1 Discussion
The benchmark regression analysis in Supplementary Table S2 shows that EGI can effectively alleviate the problem of regional pollution emissions, which is similar to the conclusions drawn by Li and Ramanathan (2020), Zeraibi et al. (2021), and others. However, the effect of EGE on the EG is not significant. As indicated by the EGE in 2003 and 2020 (Figures 1), only 5 of the 30 provinces have improved their EGE, which is concentrated in the eastern and central provinces, while the EGE of other provinces shows a downward trend. Moreover, China’s EGE is at a low level (0.7) throughout the whole study period. Among the 30 provinces from 2003 to 2020, only Beijing, Tianjin, Shanghai, Hainan, and Qinghai have an EGE greater than 1, whereas the rest are ineffective. Furthermore, exploring the investment situation shows that the input variables of physical capital input, human capital input, wastewater, and waste gas treatment facilities in the provinces with environmental treatment efficiency greater than 1 are at the lower middle level among all the investigated objects. For example, the physical capital input of Hainan is 604 million yuan, the human capital investment is 2.21, the operation cost of wastewater and waste gas treatment facilities is 44 million yuan, and the efficiency value is 3.27. Among the noneffective provinces, such as Shandong, the three input indicators are 33.6 billion yuan, 13.96, and 4.75 billion yuan, and the efficiency value is only 0.4, indicating that the relevant input factors in most Chinese provinces are not reasonably converted into EG output, and there is resource waste and low efficiency, which is also the main reason why EGE cannot effectively control GDPSO2 emissions.
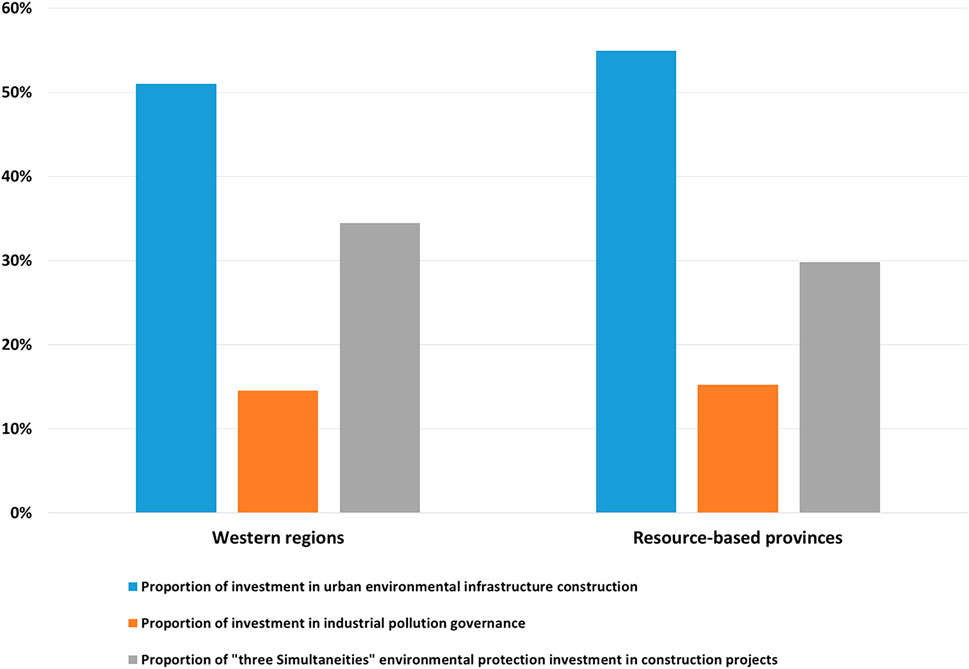
FIGURE 1. Proportion of three types of EGI in 2003‐2020.
Based on the consideration of geographical location, economic development levels, and resource endowment heterogeneity, this article further explores whether the above factors exert an impact on the EG mode. The results show that EGI in the eastern and central regions and economically underdeveloped provinces can significantly reduce GDPSO2 emissions and improve EG effects, while EGI and EGE exert a noticeable inhibitory impact on GDPSO2 emissions in economically developed provinces and nonresource-based provinces. The main reason is that economically developed provinces and nonresource-based provinces have the strong financial strength and technological innovation levels, which can not only deal with existing pollutants but also rely on green technology research and development and the reasonable allocation of pollution control elements to improve pollutant treatment efficiency from the source, thereby reducing pollution (Wang et al., 2020). In addition, in the western regions and resource-based provinces, the influence of EGE and EGI on EG is not significant. From the perspective of the EGI amount and pollution emissions, the average annual EGI in the western regions and resource-based provinces from 2003 to 2020 is 3.34 billion yuan and 3.76 billion yuan, respectively; the average annual GDPSO2 emissions are 17.07 (ton/billion yuan), and 16.42 (ton/billion yuan), respectively; the annual growth rate of EGI is 2.81 and 2.72%, respectively, and the annual reduction rate of GDPSO2 emissions are 17.13 and 17%, respectively. The reduction rate of pollution emissions was significantly higher than the investment growth rate. However, the EGI in the regression analysis does not have a remarkable impact on EG. The main reasons are as follows: according to the early EG experience of developed countries, the environmental deterioration trend can be generally controlled when the EGI accounts for 1–1.5% of GDP, and the environmental quality can be significantly improved when the proportion is 2–3%. However, the western regions and resource-based provinces primarily follow the economic development approach of “pollution first and governance later,” their environmental pollution situation is relatively serious, and the EGI as a share of GDP is only 0.78 and 0.67%, respectively. Such an approach can reduce some pollution emissions, but because of the large base of total pollution and historical debt, there is still a certain distance to controlling the trend of environmental degradation. In addition, 87% of China’s SO2 emissions come from industry. According to the current statistical caliber of EGI, EGI can be divided into three categories: environmental infrastructure construction investment, industrial pollution source governance investment, and “three simultaneities” environmental protection investment in construction projects. From the structure of EGI in 2003–2020 (Figure 1), the proportion of investment in environmental infrastructure construction in China’s western regions and resource-based provinces is 51 and 54.9%, respectively, but this portion of the investment is not closely relevant to pollution governance, whereas the proportion of investment in industrial pollution governance most directly related to pollution reduction is the lowest, with an average annual rate of only 14.52 and 15.24%, respectively. This distortion of the EGI structure further masks the severe reality of insufficient direct pollution control capital investment in the western provinces and resource-based provinces. Moreover, most of China’s western provinces and resource-based provinces belong to regions with better environmental and ecological systems and have a certain self-cleaning and self-purification capacity for environmental pollution. Therefore, the reduction rate of GDPSO2 emissions is partly derived from the self-purification of the regional environment, and EGI makes a small contribution to the rate of reduction in pollution emissions, which is also one of the main reasons that EGI has no significant effect on reducing GDPSO2 emissions. In terms of EGE, since the western regions and resource-based provinces mainly rely on the development of heavy industries based on natural resources, the abundance of their own natural resources has a crowding-out effect on R&D and innovation, resulting in the flow of funds from the R&D department to the primary product department, which eventually leads to relatively low levels of material, human and financial resources and decreasing overall EGE (0.57 and 0.30, respectively). Consequently, GDPSO2 emissions cannot be effectively controlled.
In addition, based on the event of green political performance assessment, this article explores the changes in the driving factors of the EG mode before and after the strengthening of EG policies. The relevant results show that from 2003 to 2005, the EGE and EGI did not remarkably inhibit GDPSO2 emissions. The reasons are as follows: before 2006, China mainly adopted the “GDP only” political performance assessment system, in which regional officials mainly concentrated on the economic development of the areas under their jurisdiction (Li et al., 2022) and paid only perfunctory attention to the environmental protection and governance requirements raised by the central government. Moreover, some officials withheld some EG costs and turned them into their own “head fees” (Moshiri and Daneshmand, 2020). Finally, the implementation of environmental protection policies and capital investment are greatly discounted, which is also the main reason why the EGE and EGI cannot substantially ameliorate the situation of environmental pollution. The EGI from 2006 to 2020 was notably negative at the 1% level, illustrating that the “pressure-based performance system” will produce the same “championship” effect, promoting local officials to “compete for harmony” to increase the scale of EGI and reduce environmental pollution (Xue et al., 2014; Kahn et al., 2015). However, the effect of EGE on GDPSO2 emissions is still not significant, which is mainly due to the long time period and energy required for the reasonable allocation of resources, technological improvement, R&D, and personnel training to improve EGE, while EG has the characteristics of “predecessors planting trees, descendants enjoying cool”. In addition, local officials have a relatively short term of office. Therefore, in the context of continuously strengthening environmental protection assessment, it is undoubtedly the best choice for local officials to pursue short-term pollution control capital investment with quick effects.
5.2 Limitations
In the empirical analysis, relevant factors affecting the environment are included in the model to the greatest extent possible. However, due to the unpredictability of some variables, the results of this study cannot completely exclude the impact of other factors on the environment, so there are certain deviations in the results. Moreover, this article only analyzes the current EG mode. The key factors that can promote the transformation of EG mode can be further discussed in future research. The in-depth analysis of the aforementioned content will provide more sufficient and reliable suggestions for the transformation of China’s EG mode and the improvement of EG quality.
6 Conclusion and Policy Implications
6.1 Conclusion
Using the data of 30 provinces in China from 2003 to 2020, this article explores the current EG mode in China and draws the following conclusions: 1) Overall, China’s current extensive governance mode focuses mainly on increasing EGI. 2) In terms of geographic location, economic development levels, and resource type, EGI in the eastern and central regions and economically underdeveloped provinces is the main driving factor for EG, while EGI and EGE in economically developed provinces and nonresource-based provinces can simultaneously decrease pollution emissions and improve the effect of EG. In the western regions and resource-based provinces, EGI and EGE have no significant effects on EG. 3) In the view of time, EGE and EGI had no significant impact on EG from 2003 to 2005. Until 2006, EGI significantly reduced environmental pollution. Furthermore, the effect of EGE before and after the policy change is not significant.
6.2 Policy Implications
According to the research conclusions, to reduce pollution emissions and improve the effect and quality of EG, this essay suggests the following policy implications: 1) Optimize the locality allocation of EGI and strengthen the pertinence of environmental pollution management. During the course of environmental cleanup, the development characteristics and actual situation of different regions should be considered. Due to their development mode, the western regions and resource-based provinces have serious environmental pollution and many historical debts. Therefore, in the short term, we should further increase EGI to reduce pollutant emissions and strive to repay the historical debts while not incurring new ones. In addition, the administration should optimize the EGI structure and increase the amount of investment related to industrial pollution governance. 2) In the EG process, we should not only focus on effective and timely quantitative capital investment in pollution prevention and control but also comprehensively consolidate the concept that “only high-quality innovation can drive high-quality development,” fully implement “scientific and technological innovation as the core” in EG, and improve the investment proportion of “software” for EG to realize scientific and accurate pollution control. For example, to strengthen the construction of environmental protection teams and increase the investment in scientific research on EG, it is crucial to further R&D investment in technology and equipment related to EG. In addition, the innovation subjects of environmental control technology come mainly from micro-enterprises and scientific research institutions. Therefore, the government should increase incentives for their technological innovation so that they can “attack difficulties, strengthen weak points and catch up with the frontier” and fundamentally adjust the way of EG. 3) Improve the supervision mechanism for environmental treatment and the efficiency of the use of government funds. Local governments should improve the EG assessment mechanism, incorporate EG innovation into the assessment content of functional departments, and build an assessment system that focuses on quality and supplements with quantity. At the same time, it is necessary to build a government-based diversified EG mode, encourage the public, nongovernmental organizations, and other social entities to actively participate in supervision actively, clarify the boundaries of the responsibilities and rights of each entity, promote the coordination and complementarity among different entities, and enhance the efficiency of resource input, so as to guide high-quality EG. In addition, other policy recommendations include strengthening the efficiency of the use of EG funds, effectively supervising fund use, improving the accountability mechanism for the utilization of environmental funds, earmarking funds for special purposes, and avoiding dark-box operations.
Data Availability Statement
The raw data supporting the conclusion of this article will be made available by the authors, without undue reservation.
Author Contributions
YM was responsible for the conception and design of the study and was the main writer of the manuscript; HC was responsible for adding new data, calculating and analyzing data in the revised version; YZ was responsible for material preparation and data collection; ZL reviewed, supervised and approved the manuscript.
Funding
This article was supported by the National Social Science Foundation of China (grant no. 21XTJ003), the Shaanxi Social Science Foundation (Grant No. 2021D015), the Shaanxi Natural Science Foundation (Grant No. 2022JM‐431) and the Xi'an Soft Science Foundation (Grant No. 21RKYJ0038).
Conflict of Interest
The authors declare that the research was conducted in the absence of any commercial or financial relationships that could be construed as a potential conflict of interest.
Publisher’s Note
All claims expressed in this article are solely those of the authors and do not necessarily represent those of their affiliated organizations, or those of the publisher, the editors, and the reviewers. Any product that may be evaluated in this article, or claim that may be made by its manufacturer, is not guaranteed or endorsed by the publisher.
Supplementary Material
The Supplementary Material for this article can be found online at: https://www.frontiersin.org/articles/10.3389/fenvs.2022.901936/full#supplementary-material
Footnotes
1Eastern and central regions: Anhui, Beijing, Fujian, Guangdong, Guangxi, Hainan, Hebei, Heilongjiang, Henan, Hubei, Hunan, Jiangsu, Jiangxi, Jilin, Liaoning, Inner Mongolia, Shandong, Shanghai, Shanxi, Tianjin, and Zhejiang; Western regions: Chongqing, Sichuan, Guizhou, Yunnan, Shaanxi, Gansu, Ningxia, Qinghai, and Xinjiang.
2Economically developed provinces: Beijing, Tianjin, Shanghai, Jiangsu, Zhejiang, Fujian, and Guangdong; Economically undeveloped provinces: Anhui, Chongqing, Gansu, Guangxi, Guizhou, Hainan, Hebei, Heilongjiang, Henan, Hubei, Hunan, Jiangxi, Jilin, Liaoning, Inner Mongolia, Ningxia, Qinghai, Shaanxi, Shandong, Shanxi, Sichuan, Xinjiang, and Yunan.
3Resource-based provinces: Gansu, Heilongjiang, Inner Mongolia, Ningxia, Shaanxi, Shanxi, Xinjiang, and Yunnan; Nonresource-based provinces: Anhui, Beijing, Chongqing, Fujian, Guangdong, Guangxi, Guizhou, Hainan, Hebei, Henan, Hubei, Hunan, Jiangsu, Jiangxi, Jilin, Liaoning, Qinghai, Shandong, Shanghai, Sichuan, Tianjin, and Zhejiang.
4Resource-based industries: Mining and Washing of Coal, Extraction of Petroleum and Natural Gas, Mining and Processing of Ferrous Metal Ores, Mining and Processing of Non-Ferrous Metal Ores, Mining and Processing of Non-metal Ores, Processing of Petroleum and Coking, Manufacture of Non-metallic Mineral Products, Smelting and Pressing of Ferrous Metals, Smelting and Pressing of Non-ferrous Metals, Manufacture of Metal Products, and Production and Supply of Electric Power and Heat Power.
References
Ai, H., Hu, S., Li, K., and Shao, S. (2020). Environmental Regulation, Total Factor Productivity, and Enterprise Duration: Evidence from China. Bus. Strat. Env. 29 (6), 2284–2296. doi:10.1002/bse.2502
Amir-ud-Din, R., Usman, M., Abbas, F., and Javed, S. A. (2019). Human versus Physical Capital: Issues of Accumulation, Interaction and Endogeneity. Econ. Change Restruct. 52 (4), 351–382. doi:10.1007/s10644-017-9225-2
Basoglu, A., and Uzar, U. (2019). An Empirical Evaluation about the Effects of Environmental Expenditures on Environmental Quality in Coordinated Market Economies. Environ. Sci. Pollut. Res. 26, 23108–23118. doi:10.1007/s11356-019-05567-3
Cao, H., Zhang, L., Qi, Y., Yang, Z., and Li, X. (2022). Government Auditing and Environmental Governance: Evidence from China's Auditing System Reform. Environ. Impact Assess. Rev. 93, 106705. doi:10.1016/j.eiar.2021.106705
Chen, L., and Huo, C. (2021). Impact of Green Innovation Efficiency on Carbon Emission Reduction in the Guangdong-Hong Kong-Macao GBA. Sustainability 13 (23), 13450. doi:10.3390/su132313450
Chen, M., Qian, X., and Zhang, L. (2015). Public Participation in Environmental Management in China: Status Quo and Mode Innovation. Environ. Manag. 55, 523–535. doi:10.1007/s00267-014-0428-2
Chen, X., and Chang, C.-P. (2020). Fiscal Decentralization, Environmental Regulation, and Pollution: A Spatial Investigation. Environ. Sci. Pollut. Res. 27 (25), 31946–31968. doi:10.1007/s11356-020-09522-5
Chen, X., Zhang, J., and Zeng, H. (2020). Is Corporate Environmental Responsibility Synergistic with Governmental Environmental Responsibility? Evidence from China. Bus. Strat. Env. 29, 3669–3686. doi:10.1002/bse.2603
Chu, Z., Bian, C., and Yang, J. (2022). How Can Public Participation Improve Environmental Governance in China? A Policy Simulation Approach with Multi-Player Evolutionary Game. Environ. Impact Assess. Rev. 95, 106782. doi:10.1016/j.eiar.2022.106782
Deng, H., Zheng, X., Huang, N., and Li, F. (2012). Strategic Interaction in Spending on Environmental Protection: Spatial Evidence from Chinese Cities. China World Econ. 20 (5), 103–120. doi:10.1111/j.1749-124X.2012.01304.x
Deng, Y., Wu, Y., and Xu, H. (2019). Political Turnover and Firm Pollution Discharges: An Empirical Study. China Econ. Rev. 58, 101363. doi:10.1016/j.chieco.2019.101363
Dong, F., Zhu, J., Li, Y., Chen, Y., Gao, Y., Hu, M., et al. (2022). How Green Technology Innovation Affects Carbon Emission Efficiency: Evidence from Developed Countries Proposing Carbon Neutrality Targets. Environ. Sci. Pollut. Res. 29, 35780‐35799 doi:10.1007/s11356-022-18581-9
Du, Z., Zheng, L., and Lin, B. (2022). Does Rent-Seeking Affect Environmental Regulation? J. Glob. Inf. Manag. 30 (6), 1–22. doi:10.4018/JGIM.288549
Escribá-Pérez, F. J., Murgui-García, M. J., and Ruiz-Tamarit, J. R. (2018). Economic and Statistical Measurement of Physical Capital: From Theory to Practice. Econ. Model. 75, 246–255. doi:10.1016/j.econmod.2018.06.023
Feng, T., Du, H., Lin, Z., and Zuo, J. (2020). Spatial Spillover Effects of Environmental Regulations on Air Pollution: Evidence from Urban Agglomerations in China. J. Environ. Manag. 272, 110998. doi:10.1016/j.jenvman.2020.110998
Feng, Y., Wang, X., and Liang, Z. (2021). How Does Environmental Information Disclosure Affect Economic Development and Haze Pollution in Chinese Cities? the Mediating Role of Green Technology Innovation. Sci. Total Environ. 775 (25), 145811. doi:10.1016/j.scitotenv.2021.145811
Garcia, R. M., and Burns, S. L. (2022). Bureaucratic Politics in Protected Areas: The Voided Power Projection Efforts of Conservation Vis-À-Vis Forest Bureaucracies in Patagonia, Argentina. For. Policy Econ. 134, 102630. doi:10.1016/j.forpol.2021.102630
Guo, A., and Bai, L. (2019). The Role of Public Participation in Environmental Governance: Empirical Evidence from China. Sustainability 11 (17), 4696. doi:10.3390/su11174696
Hall, R. E., and Jorgenson, D. W. (1969). Tax Policy and Investment Behavior: Reply and Further Results. Am. Econ. Rev. 59 (3), 388–401. doi:10.2307/1808970
He, L., Wu, M., Wang, D., and Zhong, Z. (2018). A Study of the Influence of Regional Environmental Expenditure on Air Quality in China: The Effectiveness of Environmental Policy. Environ. Sci. Pollut. Res. 25 (8), 7454–7468. doi:10.1007/s11356-017-1033-8
He, L., Yuan, E., Yang, K., and Tao, D. (2022). Does Technology Innovation Reduce Haze Pollution? an Empirical Study Based on Urban Innovation Index in China. Environ. Sci. Pollut. Res. 29, 24063–24076. doi:10.21203/rs.3.rs-586766/v110.1007/s11356-021-17448-9
Hernández, J. A., and Mauleón, I. (2005). Econometric Estimation of a Variable Rate of Depreciation of the Capital Stock. Empir. Econ. 30 (3), 575–595. doi:10.1007/s00181-004-0234-4
Huang, J.-T. (2018). Sulfur Dioxide (SO2) Emissions and Government Spending on Environmental Protection in China - Evidence from Spatial Econometric Analysis. J. Clean. Prod. 175, 431–441. doi:10.1016/j.jclepro.2017.12.001
Huang, J.-T. (2021). The Influence of Government's Expenditure in the Environmental Protection on Air Pollution in Taiwan. Singap. Econ. Rev., 1–13. doi:10.1142/S0217590821500570
Huang, N., and Diewert, E. (2011). Estimation of R&D Depreciation Rates: A Suggested Methodology and Preliminary Application. Can. J. Econ.-Rev. Can. Econ. 44 (2), 387–412. doi:10.1111/j.1540-5982.2011.01638.x
Jiang, L., Zhou, H., and He, S. (2020). The Role of Governments in Mitigating SO2 Pollution in China: A Perspective of Fiscal Expenditure. Environ. Sci. Pollut. Res. 27, 33951–33964. doi:10.1007/s11356-020-09562-x
Kahn, M. E., Li, P., and Zhao, D. (2015). Water Pollution Progress at Borders: The Role of Changes in China's Political Promotion Incentives. Am. Econ. J. Econ. Policy 7 (4), 223–242. doi:10.1257/pol.20130367
Kanada, M., Fujita, T., Fujii, M., and Ohnishi, S. (2013). The Long-Term Impacts of Air Pollution Control Policy: Historical Links between Municipal Actions and Industrial Energy Efficiency in Kawasaki City, Japan. J. Clean. Prod. 58, 92–101. doi:10.1016/j.jclepro.2013.04.015
Khan, Z., Ali, S., Dong, K., and Li, R. Y. M. (2021). How Does Fiscal Decentralization Affect CO2 Emissions? the Roles of Institutions and Human Capital. Energy Econ. 94, 105060. doi:10.1016/j.eneco.2020.105060
Li, G., Fang, C., and He, S. (2020). The Influence of Environmental Efficiency on PM2.5 Pollution: Evidence from 283 Chinese Prefecture-Level Cities. Sci. Total Environ. 748 (15), 141549. doi:10.1016/j.scitotenv.2020.141549
Li, J. (2021). Public Participation in China: The Case for Environmental Enforcement. J. Chin. Gov. 7 (2), 159-179. doi:10.1080/23812346.2021.1968192
Li, R., and Ramanathan, R. (2020). Can Environmental Investments Benefit Environmental Performance? the Moderating Roles of Institutional Environment and Foreign Direct Investment. Bus. Strat. Env. 29, 3385–3398. doi:10.1002/bse.2578
Li, Z., Hou, Y., Cao, J., Ding, Y., and Yuan, X. (2022). What Drives Green Development in China: Public Pressure or the Willingness of Local Government? Environ. Sci. Pollut. Res. 29, 5454–5468. doi:10.1007/s11356-021-16059-8
Li, Z., Li, D., Yang, W., and Qi, X. (2020). The Spatial-Temporal Evolution and Spatial Convergence of Ecological Total Factor Productivity in China. Energy Environ. 33, 617–639. doi:10.1177/0958305X20941141
Lin, B., and Ma, R. (2022). Green Technology Innovations, Urban Innovation Environment and CO2 Emission Reduction in China: Fresh Evidence from a Partially Linear Functional-Coefficient Panel Model. Technol. Forecast. Soc. Change 176, 121434. doi:10.1016/j.techfore.2021.121434
Lin, S., Xiao, L., and Wang, X. (2021). Does Air Pollution Hinder Technological Innovation in China? A Perspective of Innovation Value Chain. J. Clean. Prod. 278, 123326. doi:10.1016/j.jclepro.2020.123326
Long, Z., and Herrera, R. (2016). Building Original Series of Physical Capital Stocks for China's Economy Methodological Problems, Proposals for Solutions and a New Database. China Econ. Rev. 40, 33–53. doi:10.1016/j.chieco.2016.05.002
López, R., Galinato, G. I., and Islam, A. (2011). Fiscal Spending and the Environment: Theory and Empirics. J. Environ. Econ. Manag. 62 (2), 180–198. doi:10.1016/j.jeem.2011.03.001
Moshiri, S., and Daneshmand, A. (2020). How Effective Is Government Spending on Environmental Protection in a Developing Country? Jes 47 (4), 789–803. doi:10.1108/JES-12-2018-0458
Pan, D., and Tang, J. (2021). The Effects of Heterogeneous Environmental Regulations on Water Pollution Control: Quasi-Natural Experimental Evidence from China. Sci. Total Environ. 751, 141550. doi:10.1016/j.scitotenv.2020.141550
Patriarca, R., Di Gravio, G., Costantino, F., and Tronci, M. (2017). The Functional Resonance Analysis Method for a Systemic Risk Based Environmental Auditing in a Sinter Plant: A Semi-quantitative Approach. Environ. Impact Assess. Rev. 63, 72–86. doi:10.1016/j.eiar.2016.12.002
Peng, B., Zhao, Y., Elahi, E., and Wan, A. (2022). Investment in Environmental Protection, Green Innovation, and Solid Waste Governance Capacity: Empirical Evidence Based on Panel Data from China. J. Environ. Plan. Manag., 1–24. doi:10.1080/09640568.2021.2017866
Prucha, I. (1997). Estimation of a Variable Rate of Depreciation: A Dummy Variable Approach. Struct. Change Econ. Dyn. 8 (3), 319–325. doi:10.1016/S0954-349X(97)00007-6
Pu, Z., and Fu, J. (2018). Economic Growth, Environmental Sustainability and China Mayors' Promotion. J. Clean. Prod. 172, 454–465. doi:10.1016/j.jclepro.2017.10.162
Qian, Y., Cao, H., and Huang, S. (2020). Decoupling and Decomposition Analysis of Industrial Sulfur Dioxide Emissions from the Industrial Economy in 30 Chinese Provinces. J. Environ. Manag. 260, 110142. doi:10.1016/j.jenvman.2020.110142
Que, W., Zhang, Y., Liu, S., and Yang, C. (2018). The Spatial Effect of Fiscal Decentralization and Factor Market Segmentation on Environmental Pollution. J. Clean. Prod. 184, 402–413. doi:10.1016/j.jclepro.2018.02.285
Sun, H., and Liu, Y. Y. (2016). Analysis on Inter-regional Difference of Carbon Emissions and Loss and Profit Deviation in China. Manag. Rev. 28 (10), 89–96. doi:10.14120/j.cnki.cn11-5057/f.2016.10.008
Tang, C. F., and Tan, B. W. (2015). The Impact of Energy Consumption, Income and Foreign Direct Investment on Carbon Dioxide Emissions in Vietnam. Energy 79, 447–454. doi:10.1016/j.energy.2014.11.033
Tang, X., Chen, W., and Wu, T. (2018). Do Authoritarian Governments Respond to Public Opinion on the Environment? Evidence from China. Ijerph 15 (2), 266. doi:10.3390/ijerph15020266
Wang, L., Su, C.-W., Ali, S., and Chang, H.-L. (2020). How China Is Fostering Sustainable Growth: The Interplay of Green Investment and Production-Based Emission. Environ. Sci. Pollut. Res. 27, 39607–39618. doi:10.1007/s11356-020-09933-4
Wang, T., Peng, J., and Wu, L. (2021). Heterogeneous Effects of Environmental Regulation on Air Pollution: Evidence from China's Prefecture-Level Cities. Environ. Sci. Pollut. Res. 28, 25782–25797. doi:10.1007/s11356-021-12434-7
Wang, W., Chen, J., and Mao, S. Y. (2017). Revaluation of Chinese Capital Stock Based on Ten Categories: 1978-2016. J. Quantitative Tech. Econ. 34 (10), 60–77. doi:10.13653/j.cnki.jqte.2017.10.004
Wang, Y., and Yao, Y. (2003). Sources of China's Economic Growth 1952-1999: Incorporating Human Capital Accumulation. China Econ. Rev. 14 (1), 32–52. doi:10.1016/S1043-951X(02)00084-6
Wu, J., Li, N., and Shi, P. (2014). Benchmark Wealth Capital Stock Estimations across China's 344 Prefectures: 1978 to 2012. China Econ. Rev. 31, 288–302. doi:10.1016/j.chieco.2014.10.008
Wu, L. H., Ma, T. S., Bian, Y. C., Li, S. J., and Yi, Z. Q. (2020). Improvement of Regional Environmental Quality: Government Environmental Governance and Public Participation. Sci. Total Environ. 717, 137265. doi:10.1016/j.scitotenv.2020.137265
Wu, Y. (2000). Is China's Economic Growth Sustainable? A Productivity Analysis. China Econ. Rev. 11 (3), 278–296. doi:10.1016/S1043-951X(00)00022-5
Xie, X., and Wang, Y. (2019). Evaluating the Efficacy of Government Spending on Air Pollution Control: A Case Study from Beijing. Ijerph 16 (1), 45. doi:10.3390/ijerph16010045
Xiong, W., Han, Y., Crabbe, M. J. C., and Yue, X.-G. (2020). Fiscal Expenditures on Science and Technology and Environmental Pollution: Evidence from China. Ijerph 17 (23), 8761. doi:10.3390/ijerph17238761
Xu, L., Fan, M., Yang, L., and Shao, S. (2021). Heterogeneous Green Innovations and Carbon Emission Performance: Evidence at China's City Level. Energy Econ. 99, 105269. doi:10.1016/j.eneco.2021.105269
Xue, B., Mitchell, B., Geng, Y., Ren, W., Müller, K., Ma, Z., et al. (2014). A Review on China's Pollutant Emissions Reduction Assessment. Ecol. Indic. 38, 272–278. doi:10.1016/j.ecolind.2013.11.020
Yang, D., Wang, Z., and Lu, F. (2019). The Influence of Corporate Governance and Operating Characteristics on Corporate Environmental Investment: Evidence from China. Sustainability 11 (10), 2737. doi:10.3390/su11102737
Yin, J., Zheng, M., and Chen, J. (2015). The Effects of Environmental Regulation and Technical Progress on CO2 Kuznets Curve: An Evidence from China. Energy Policy 77, 97–108. doi:10.1016/j.enpol.2014.11.008
Zang, J., and Liu, L. (2020). Fiscal Decentralization, Government Environmental Preference, and Regional Environmental Governance Efficiency: Evidence from China. Ann. Reg. Sci. 65 (2), 439–457. doi:10.1007/s00168-020-00989-1
Zeraibi, A., Balsalobre-Lorente, D., and Shehzad, K. (2021). Testing the Environmental Kuznets Curve Hypotheses in Chinese Provinces: A Nexus between Regional Government Expenditures and Environmental Quality. Ijerph 18 (18), 9667. doi:10.3390/ijerph18189667
Zhang, C., and Zhou, X. (2016). Does Foreign Direct Investment Lead to Lower CO 2 Emissions? Evidence from a Regional Analysis in China. Renew. Sustain. Energy Rev. 58, 943–951. doi:10.1016/j.rser.2015.12.226
Zhang, J. (2008). Estimation of China's Provincial Capital Stock (1952-2004) with Applications. J. Chin. Econ. Bus. Stud. 6 (2), 177–196. doi:10.1080/14765280802028302
Zhang, J., Zhang, H., and Gong, X. (2022). Government's Environmental Protection Expenditure in China: The Role of Internet Penetration. Environ. Impact Assess. Rev. 93, 106706. doi:10.1016/j.eiar.2021.106706
Zhang, T., and Chen, C. (2018). The Effect of Public Participation on Environmental Governance in China-Based on the Analysis of Pollutants Emissions Employing a Provincial Quantification. Sustainability 10 (7), 2302. doi:10.3390/su10072302
Zhang, Y.-J., Jin, Y.-L., Chevallier, J., and Shen, B. (2016). The Effect of Corruption on Carbon Dioxide Emissions in APEC Countries: A Panel Quantile Regression Analysis. Technol. Forecast. Soc. Change 112, 220–227. doi:10.1016/j.techfore.2016.05.027
Zhao, J., Jiang, Q., Dong, X., Dong, K., and Jiang, H. (2022b). How Does Industrial Structure Adjustment Reduce CO2 Emissions? Spatial and Mediation Effects Analysis for China. Energy Econ. 105, 105704. doi:10.1016/j.eneco.2021.105704
Zhao, J., Shen, J., Yan, J., Yang, X., Hao, Y., and Ran, Q. (2022a). Corruption, Market Segmentation and Haze Pollution: Empirical Evidence from China. J. Environ. Plan. Manag., 1–23. doi:10.1080/09640568.2021.2001316
Zhao, Y., Liang, C., and Zhang, X. (2021). Positive or Negative Externalities? Exploring the Spatial Spillover and Industrial Agglomeration Threshold Effects of Environmental Regulation on Haze Pollution in China. Environ. Dev. Sustain. 23, 11335–11356. doi:10.1007/s10668-020-01114-0
Zhou, C. (2021). Game Theory-Based Analysis of Local Governments' Behavioral Dissimilation in the Third-Party Soil Pollution Control under Chinese-Style Fiscal Decentralization. Land 10 (4), 389. doi:10.3390/land10040389
Keywords: environmental governance efficiency, environmental governance investment, environmental governance mode, environmental governance industry capital stock, variable depreciation
Citation: Ma Y, Chen H, Zhao Y and Li Z (2022) Research on China's Environmental Governance Mode: Quality Driven or Quantity Driven?. Front. Environ. Sci. 10:901936. doi: 10.3389/fenvs.2022.901936
Received: 22 March 2022; Accepted: 03 May 2022;
Published: 09 June 2022.
Edited by:
Kangyin Dong, University of International Business and Economics, ChinaReviewed by:
Jianda Wang, University of International Business and Economics, ChinaHong-Dian Jiang, China University of Geosciences, China
Copyright © 2022 Ma, Chen, Zhao and Li. This is an open-access article distributed under the terms of the Creative Commons Attribution License (CC BY). The use, distribution or reproduction in other forums is permitted, provided the original author(s) and the copyright owner(s) are credited and that the original publication in this journal is cited, in accordance with accepted academic practice. No use, distribution or reproduction is permitted which does not comply with these terms.
*Correspondence: Zhengda Li, bGl6aGVuZ2RhQHhhdWF0LmVkdS5jbg==