 Jun Li1
 Wanyu Liu1Dimitri Castarède2Wenjun Gu3Linjie Li2
 Takuji Ohigashi4Guiqian Zhang1
 Mingjin Tang3Erik S. Thomson2Mattias Hallquist2Sen Wang1*
 Xiangrui Kong2*
- 1Shaanxi Key Laboratory of Earth Surface System and Environmental Carrying Capacity, Northwest University, Xi’an, China
- 2Department of Chemistry and Molecular Biology, Atmospheric Science, University of Gothenburg, Gothenburg, Sweden
- 3State Key Laboratory of Organic Geochemistry, Guangzhou Institute of Geochemistry, Chinese Academy of Sciences, Guangzhou, China
- 4UVSOR Synchrotron, Institute for Molecular Science, Okazaki, Japan
Dust storms are common meteorological events that occur frequently in the late spring and early summer in arid and semi-arid areas. The resulting lofted dust and salt mixtures can impact atmospheric chemistry and climate systems through the many pathways represented by aerosol-cloud-climate interactions. In this study, dust/salt samples were collected from important sources of the East Asian dust storm, including the Badain Jaran Desert, the Tengger Desert and the Ulan Buh Desert in northwestern China. Ion chromatography (IC) measurements were performed to determine the concentrations of cations and anions. The ionic concentrations, pH and dissolvable fractions of sand samples show a positive correlation, indicating that the dissolved content is rich in alkaline ions. A positive matrix factorization (PMF) receptor model was employed to analyze the IC results, and from the PMF solutions non-obvious connections to local geography emerge. The results of hygroscopic experiments of sand samples which were measured by a vapor sorption analyzer indicate that the hygroscopicity may be related to the soluble content of samples, and the observed hygroscopic behavior can be well described by a thermodynamic model. The morphology of individual particles was chemically mapped by the synchrotron-based scanning transmission X-ray microscopy, and needle-shaped CaCO3 particles were observed to adhere to more irregular high K-containing particles. Moreover, a continuous flow diffusion chamber was used to investigate the ice nucleation abilities of typical salts, with both homogeneous freezing and deposition nucleation being observed. The results indicate that the salts primarily act as cloud condensation nuclei but can also act as ice nucleating particles at low temperatures.
1 Introduction
Dust storms are common meteorological events which occur frequently in the late spring and early summer in arid and semi-arid areas (Barkan et al., 2005; Bou Karam et al., 2014; Liu et al., 2020). North Africa, Middle East Asia (including Western China), Western Australia and Western North America are the four most important dust-prone areas in the world (Su et al., 2016). Annually, about 1,000 to 3,000 trillion grams (Tg) of dust is emitted into the atmosphere (Huang et al., 2010), and more than 40% of the land areas on Earth are affected by aeolian processes. In Asia, about 800 Tg of dust is lofted into the atmosphere every year, of which about 30% is redeposited onto deserts, 20% is transported over regional scales, and 50% is transported to the Pacific Ocean or even further (Uno et al., 2009; Li et al., 2010; An et al., 2018). Asian dust storms follow a typical transport path across the northern regions to the eastern seas of China under the influence of strong northwest to southeast airflow at high altitude, and also affect Japan and Korea, and at long-range the United States and Europe, as well as both Arctic and equatorial regions under special weather conditions (Duce et al., 1980; Kanayama et al., 2002; Okin, 2005; Ziegler et al., 2008; Huang et al., 2015). The global character of dust has been demonstrated, for example, by assessing the contributed fractions from North Africa (15%), the Middle East (21%), the Taklimakan Desert (25%), and Northeast China/Mongolia (42%) to aerosols collected in California (Creamean et al., 2013).
Mineral dust aerosols are a primary component in the atmosphere, accounting for almost half of tropospheric aerosol mass, and they can deteriorate human living conditions (Engelstaedter et al., 2006; Prospero et al., 2014), endanger human health (Ichinose et al., 2008; Venero-Fernández, 2016), and affect ecosystems (Mahowald et al., 2014; He et al., 2016; Kok et al., 2021; Rashki et al., 2021). Dust particles can also absorb or scatter radiation to heat or cool the atmosphere, thereby affecting the radiative balance of the Earth-atmosphere system (Che et al., 2019; Zhang et al., 2019). During long-distance transportation processes, dust aerosols can participate in chemical reactions by interacting with the sulfide, nitride and black carbon in the atmosphere, and thus influence terrestrial and marine biogeochemical cycles (Costa et al., 2006; Nee et al., 2007). N2O5 produced by the reaction of NO2 and O3 can be hydrolyzed to HNO3 on the surface of salt-containing mineral dusts (e.g., CaSO4 and Na2SO4), and can be further neutralized by NH3 to NH4NO3 through heterogeneous reactions (Wu et al., 2020). Some studies show that, in dusty weather, nitrate, mainly Ca(NO3)2, can be formed by the reaction of HNO3 and carbonate in dust particles under alkaline condition (Krueger et al., 2004; Tobo et al., 2010; Tang et al., 2016).
Mixtures of mineral dust and salts also impact atmospheric chemistry and the climate system due to their high hygroscopicity and their potential to act as cloud particle seeds. Hygroscopicity determines the ability of aerosol particles to grow in humid environments, which is important for optical properties and atmospheric aging processes, and the ability to act as cloud condensation nuclei (CCN) or ice nucleating particles (INPs) (Kumar et al., 2011; Karydis et al., 2017). Mixtures that have high hygroscopicity can act as CCN and potentially INPs, to change the optical characteristics and lifetime of clouds, and to suppress or enhance precipitation under certain conditions, all of which have indirect climate effects (Rosenfeld et al., 2001; Rudich et al., 2002; Sassen, 2002; Yin et al., 2002; Huang et al., 2006; Hoose and Möhler, 2012; Huang et al., 2014; DeMott et al., 2015; Chen et al., 2017; Gui et al., 2017; Kok et al., 2018; Huang et al., 2021). Mineral dust has a significant impact on the hygroscopicity of particles, soluble inorganic ions such as Ca2+, Mg2+, Na+, and K+ on dust surfaces can react heterogeneously with HNO3 and HCl, processes that can coat the dust particles with soluble substances, further increasing the hygroscopicity and the ability to act as CCN (Kelly et al., 2007). Based on a 4-year combined CALIPSO and CloudSat dataset, Zhang et al. proposed that dust increased the effective INPs leading to glaciated mixed-phase clouds over east Asia (Zhang et al., 2015). Based on satellite retrievals, Yuan et al. analyzed a typical dust-rain storm in northwest India in 2018, and showed that under the influence of dust, a supercooled liquid water cloud was likely to freeze due to increased INPs. In this scenario, ice water path and cloud optical depth were both increased, leading to heavy rainfall in northern India (Yuan et al., 2021).
In the context of global climate change, the trend of warming and drying that is intensifying desertification in northern China is clear (Fu et al., 2008; Wang et al., 2008). The dominant regional geophysical feature, the neighboring Third Pole, that is the elevated region represented by the Himalayas and the Tibetan Plateau, impacts the entire planet’s climate directly and via global teleconnections (You et al., 2021). This makes desert research in northwestern China well situated to help build a deeper understanding of driving mechanisms and consequences of climate change (You et al., 2021). This has motivated investigations of the physiochemical properties and sediment characteristics of desert lakes (Wang et al., 2013; Bogen et al., 2015; Liu et al., 2016; Schillereff et al., 2016; Li et al., 2018), but few studies thoroughly probe the physiochemical properties and hygroscopicity of the deserts’ salt/sand mixtures. In this study, dust, salts and mixed samples were collected from important source regions of East Asian Dust Storms, including the Badain Jaran Desert, the Tengger Desert and the Ulan Buh Desert in northwestern China. Ion chromatography (IC) measurements were performed to determine the concentrations of cations and anions. Synchrotron-based scanning transmission X-ray microscopy (STXM) was carried out to investigate particle morphology and to chemically map representative dust/salt particles. Hygroscopic properties of the samples were measured using a vapor sorption analyzer, and a thermodynamic model was used to predict the deliquescence relative humidity (DRH) based on samples’ chemical compositions. To expose links between physiochemical properties and the sample origins/types, a positive matrix factorization (PMF) receptor model was implemented to analyze the results of the IC and the thermodynamic model. Ice nucleation activity has been investigated with the Portable Ice Nucleation Chamber II (PINCii), with which both homogeneous freezing and deposition nucleation were observed.
2 Sampling Sites
The sampling was carried out between 17 May and 24 May 2021. Figure 1 shows the sampling locations in the Tengger, Badain Jaran and Ulan Buh deserts. In this study, not all but representative samples are analyzed. Different types of samples, e.g., brines, high salt-content samples and sand samples, were collected in some sites, e.g., Gurinai (sample #14, #15 and #16). The background information of the three deserts is summarized below.
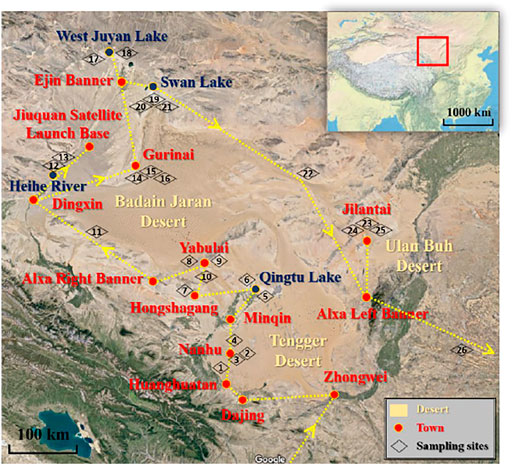
FIGURE 1. Sampling route, sampling sites, and aqueous environments marked in blue.
2.1 Badain Jaran Desert
The Badain Jaran Desert (39°20′∼41°30′N, 99°48′∼104°14′E) is located in the western Inner Mongolia Autonomous Region, with Yabulai Mountain and the Tengger Desert to the southeast, Guaizi Lake and the ancient Juyan Lake to the north, the Heihe River and Gurinai Lake to the west, and Beida Mountain to the south (Ma et al., 2014). The Badain Jaran Desert is the second largest desert in China, with an area of about 5.2 × 10⁴ km2, and mobile sand dunes accounting for approximately 83% of the total desert area (Zhu et al., 2010). The southeastern part of the desert has a higher topography, including more and well-developed tall sand hills, and relatively more precipitation and lakes. The sand dunes in the Badain Jaran Desert are the highest sand hills in the world, with a relative height greater than 300 m and a maximum height of close to 500 m (Qu et al., 2003).
The Badain Jaran Desert has a temperate continental desert climate with extremely arid areas and scarce precipitation (Dong et al., 2013). The average annual precipitation in the southern part of the desert is 90–115 mm, while it is 35–43 mm in the northern area and the precipitation is mostly concentrated in June to August (Ma et al., 2011). The annual evaporation exceeds 3,500 mm, which is 40–80 times larger than the annual precipitation. The annual average temperature is 7–8°C, with the average summer temperature being 25°C and average winter temperature –9°C (Xu and Li, 2016). The annual average wind speed is 4 m/s, which is mainly a northwest wind (Hu and Yang, 2016).
2.2 Tengger Desert
The Tengger Desert (37°30′∼40°00′N, 102°20′∼106°00′E) is located in the southwest area of Alxa Left Banner, Inner Mongolia Autonomous Region, close to the central Gansu Province. The Great Wall lies to the south, Helan Mountain to the east and Yabulai Mountain to the west. The Tengger Desert is the fourth largest desert in China, with a total area of about 4.3 × 10⁴ km2. The desert includes two parts, Nanjiling in the north and Tengger in the south, which are collectively referred to as the Tengger Desert. Sand dunes account for 71% of the total desert area, lake basins 7%, and mountainous hills and flat lands 22%. Among the dunes, mobile dunes, semi-fixed dunes, and fixed dunes represent fractions of 67.2, 17.4, and 15.4%, respectively.
The Tengger Desert is a typical continental arid climate and is very sensitive to climate change (Zhang et al., 2000; Ji et al., 2014). The annual average temperature is 7.0–9.7°C, and the average summer temperature is 24.2°C (Gao et al., 2020). The 60-year average precipitation in the Tengger Desert is 146.5 mm, wherein summer and autumn precipitation accounts for about 80% of the annual precipitation, and more rain falls in east and south (Wang et al., 2020). The average annual evaporation is ≈ 2,600 mm (Li et al., 2015). The annual average wind speed is 3–4 m/s, and the main wind direction is northwest wind.
2.3 Ulan Buh Desert
The Ulan Buh Desert (39°41′07″∼40°31′14″N, 105°59′45″∼106°41′53″E) is located in the eastern part of the Alxa Plateau in Inner Mongolia, with the Jilantai Saline Lake to the west, Langshan Mountain to the north, the Yellow River to the east, and Helan Mountain to the south. The Ulan Buh Desert is one of eight major deserts in China with a total area of about 9.991 × 10³ km2 (Jia et al., 2015). The desert’s altitude ranges from 1,028 to 1,054 m, and its terrain slopes from south to west (Chun et al., 2009). Mobile sand dunes account for about 49.9% of the total desert area, semi-fixed sand dunes account for around 21.8%, and fixed sand dunes account for ≈23.4%. The Ulan Buh Desert has a mid-temperate arid climate, with an average annual temperature of 7.8°C, an average annual precipitation of 102.9 mm, and an average annual evaporation of 2,258.8 mm.
3 Methodology
For sampling the sand samples, about 300–500 g samples were collected at each site with a sampling area of around 10 × 10 cm2 and a sampling depth of about 0–10 cm. For the high salt-content samples, about 100–150 g samples were taken at the surface of each sampling site with the sampling area of about 10 × 10 cm2. Sand samples (#1, #6, #8, #11, #12, #15, #18, #19, #20, #22, #25, #26) and high salt-content samples (#13, #17, #21) were first dried in a Muffle furnace at 90°C. From the dried samples 0.4 g was extracted and added to 40 ml distilled water to dissolve soluble content. The suspensions were sonicated and centrifuged, with the upper part extracted and filtered through a 0.22 μm membrane filter. Filtered sample solutions were stored in polyethylene bottles sealed with Parafilm and refrigerated at 4°C before measurements. The undissolved sands were dried and weighed to calculate the fractions of dissolvable content. The pH and conductivity of all filtered sample solutions were measured using a pH meter (FE28-Standard, Mettler Toledo, China) and a portable conductivity meter (F3-Standard, Mettler Toledo, China), respectively.
3.1 Ion Chromatography
Filtered sample solutions prepared as described above were used to determine the ionic compositions. The Dionex AQUION Ion Chromatography system (Thermo Fisher Scientific, MA, United States) was used to measure cations (Na+, K+, Mg2+, Ca2+, and NH4+) and anions (Cl⁻, SO42⁻, NO3⁻, NO2⁻, and F⁻) simultaneously. High salt-content sample solutions (#13, #17, #21) were diluted 20–100 times to reduce concentrations to be within the instrumental detection limits. The sand sample solutions were measured without dilution. Cations and anions were measured with CS12A IC columns (Dionex IonPac, Thermo Fisher) with a 30 mmol L⁻1 methanesulfonic acid eluent, and AS11-HC IC columns (Dionex IonPac, Thermo Fisher) with a 20 mmol L⁻1 KOH eluent, respectively. All samples were measured in duplicate with good reproducibility.
3.2 Hygroscopicity Measurements
Hygroscopic properties of 0.5–1 mg sand samples (#12, #18, #20) were measured using a vapor sorption analyzer (Q5000SA, TA Instruments). Relative humidity (RH) was elevated in a stepwise manner (at 25 ± 0.1°C), with the sample mass change, during the RH ramp, monitored with a balance that has a 0–100 mg dynamic range and <0.1 µg measurement sensitivity. Only brief descriptions are presented here, with detailed instrumental and operational information found in previous publications (Gu et al., 2017; Guo et al., 2019; Tang et al., 2019). The mass change of an empty sample holder during the RH ramp was measured as a baseline, which was removed during data processing. The apparatus is calibrated using pure NaCl, KCl and (NH4)2SO4 and the differences between measured results and the theoretical deliquescence RHs were within 1% (Tang et al., 2019). The samples were dried to <1% RH before each experiment, and then the RH was increased to 90% over 30 min, in 10% RH steps. At each step, the samples were equilibrated until the observed mass change ratio was less than 0.05% in 1 minute. Triplicate samples were prepared and measured, with the average values reported.
3.3 Thermodynamic Model
The Aerosol Inorganic-Organic Mixtures Functional groups Activity Coefficients (AIOMFAC) model was used to simulate the DRH of the samples based on their chemical matrix (Zuend et al., 2008; Zuend et al., 2011). The cations and anions were balanced by scaling, and water was selected to be present in the system. From the results, the molar Ion Activity Product (IAP) is calculated based on the generated ion activities. As an example, for MgCl2 the IAP is calculated as,
where am is the activity of the relevant ion. The IAP is a function of RH (Figure 2), and when the IAP reaches the IAP of saturated solutions (IAPsat), the corresponding RH is the DRH. The IAPsat is calculated based on the ionic concentrations of saturated solution from literature. Figure 2 shows one example with the IAP plotted versus RH. The horizontal dashed lines indicate the IAPsat of saturated solutions of four common salts, while the vertical dashed lines point to the DRHs simulated by the AIOMFAC model.
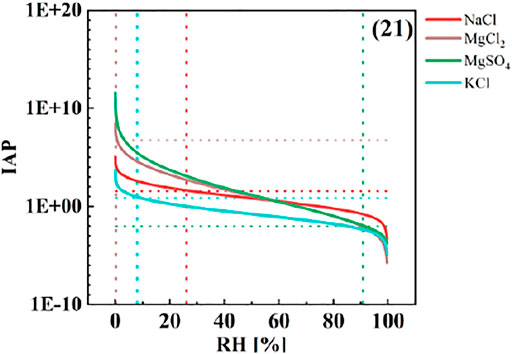
FIGURE 2. IAP as a function of RH, including four salt components in sample #21. The horizontal dashed lines indicate the IAPsat of saturated solutions of four common salts marked on the y-axis. The vertical dashed lines point to the DRH simulated by the AIOMFAC model on the x-axis.
3.4 Positive Matrix Factorization Analysis
A Positive Matrix Factorization (PMF) receptor model was used to explore the correlations of the chemical compositions between the samples. An open-source program EPA PMF 5.0 was employed for the analysis (Norris et al., 2014). The input datasets to the PMF program are the ionic concentrations measured by the IC and the uncertainty of the measurements. A 3-factor solution is identified from a 20-iteration PMF calculation, and the interpretation of the factors is discussed, where the recognized factors are closely linked to the local characteristics of the sampling sites.
3.5 STXM Experiment
Scanning transmission X-ray microscopy (STXM) measurements were performed at the BL4U UVSOR-III beamline (Ohigashi et al., 2013). The STXM technique records high-resolution images of soft X-rays transmitted through samples at set photon energies (Kilcoyne et al., 2003). The photon energy spectra provide information on mixing states and chemical compositions. For STXM measurements sample particles were deposited on filmed TEM grids (Copper 230 mesh, Beijing Zhongjingkeyi Technology Co., Ltd.), and data was analyzed with the aXis2000 program. Example optical images (sample #20) are presented in Figure 3, where Figure 3A is an image captured at 348 eV photon energy, corresponding to calcium absorption. In this case the calcium-rich particles appear dark with a needle-like morphology. Potassium-containing particles in the same sample are highlighted in Figure 3B (297 eV) as the dark more polygonal particles.
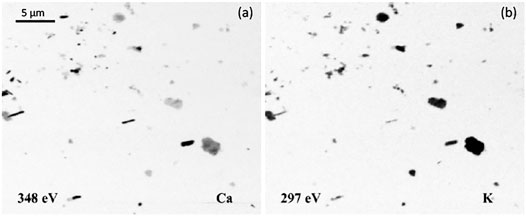
FIGURE 3. STXM images show the morphology of sample #20 particles. (A,B) Snapshots measured at 348 and 297 eV, which are high absorption regions for Ca 2p and K 2p, respectively.
3.6 Ice Nucleation Experiments
Ice nucleation experiments were carried out using a Portable Ice Nucleation Chamber II (PINCii), which is a newly-built Continuous Flow Diffusion Chamber (CFDC) apparatus (Brasseur et al., 2022; Castarède, 2021). Solutions of four samples with higher salt content were diluted and atomized, with the resulting aerosol flow being dried and split. One part of the resulting flow was monitored using a condensation particle counter (TSI CPC 3040) to measure input particle concentrations, while the remainder of the flow was directed through the PINCii. Experiments were run at four selected temperatures with the RH increased by 1% per min from ice saturation, RHice = 100%. The output flow was measured using a four Channel OPC (Remote 3,104, Lighthouse Worldwide Solutions, United States) that detects ice nucleation by size discrimination. Using the input and outlet flows and particle counting the concentration of ice active particles in a given size channel (particles larger than 3 μm, C>3μm) is determined.
4 Results and Discussions
4.1 Dissolvable Content and Ionic Composition
Dissolvable content fractions of the sand samples are plotted together with pH and conductivity in Figure 4A. The dissolvable fractions range between 0.15 and 3.15%, with pH between 7 and 8 except for sample #20 which has pH ≈ 8.6. The dissolvable fraction, pH and conductivity are positively correlated, which indicates that the dissolved fractions are rich in alkaline ions. Samples #6 and #20 have relatively large values for all three parameters, while sample #12 has a notably large dissolvable fraction but does not exhibit increased conductivity or pH as measured. This indicates that the dissolved content of the sample #12 is not in ionic form. In general, all the solutions show slight alkalinity, agreeing with previous studies, which report that the precipitation in northwest China is commonly slightly alkaline due to the presence of alkaline dust in the atmosphere (Cao et al., 2009; Wang and Xu, 2009).
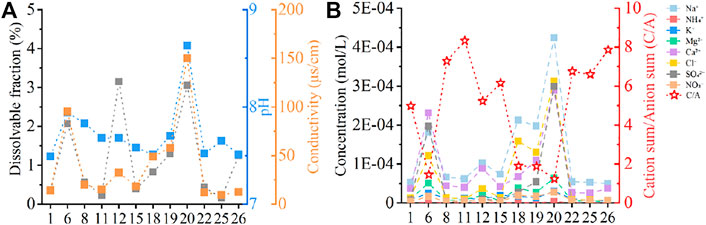
FIGURE 4. (A) The dissolvable fractions, pH and conductivities of the 12 sample solutions. (B) On the left vertical axis the ionic molar concentrations measured by IC are shown, while the right hand axis scaling depicts the ratio of total cationic charges to total anionic charges (C/A). The amount of each cation or anion (n) is multiplied by the number of charges and then added together to get the total charges of the cation or anion, i.e., cation sum = n (Na+) + n (NH4+) + n (K+) + 2n (Mg2+) + 2n (Ca2+); anion sum = n (Cl−) + 2n (SO42−) + n (NO3−).
In Figure 4B the measured ionic molar concentrations are presented in addition to the ratios of total cationic charges to total anionic charges (C/A). The total cationic charges are generally greater than the total anionic charges, yielding C/A ratios ranging from approximately 1–8. For the samples with low C/A ratios, i.e., cation and anion balanced, the Cl⁻ and SO42⁻ concentrations are relatively higher than in other samples. In the high C/A ratio samples, the missing anions are probably carbonates and bicarbonates, which are not detected by IC but have been reported to be abundant in desert environments (Zhu and Yang, 2010).
To visualize the relative abundance in detail, normalized ionic molar concentrations are plotted in Figure 5. For comparison three high salt-content samples (salt crusts; #13, #17 and #21) are added (their absolute ionic concentrations are too high to be shown in Figure 4). In general, the sand sample solutions contain increased fractions of Ca2+ and Cl⁻ compared to the high salt-content samples, indicating the high content of Ca2+- and Cl⁻- containing species are associated with sand. In the high salt-content samples, the SO42⁻ fractions are commonly the greatest except for Na+, and in two samples (#17 and #21) the Mg2+ levels are relatively large. These Mg2+ and SO42⁻ fractions are commonly associated with aqueous systems (Li et al., 2020), which matches the geographic features of these sampling locations: sample #13 is in the vicinity of the Heihe River, sample #17 is close to the West Juyan Lake, and sample #21 is near the Swan Lake (Figure 1).
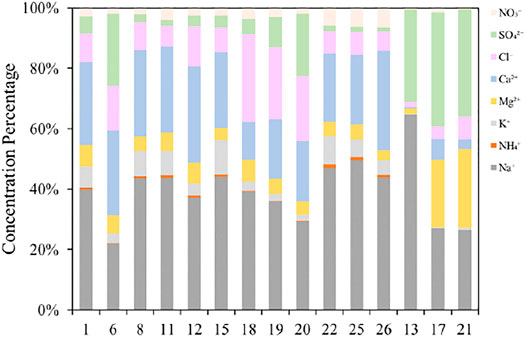
FIGURE 5. Normalized ionic molar concentrations as a function of species for sand sample solutions (#1, #6, #8, #11, #12, #15, #18, #19, #20, #22, #25, #26) and high salt-content sample solutions (#13, #17, #21).
To further explore the differences and connections between the chemical compositions of samples, PMF was performed to analyze ionic concentrations obtained from the IC experiments. A 3-factor PMF solution converges best, and the results are shown in Figure 6. The factor profiles, i.e., the ionic compositions of each factor, are shown in Figure 6A. It is not straightforward to directly interpret the factor profile due to its complexity and shared ionic profiles. However, the factor contributions shown in Figure 6B are relatively easy to rationalize, where the samples can be grouped based on the relative significance of factors. Color codes beneath the x-axis are used to illustrate this grouping, i.e., sample #18 and #19 are dominated by Factor 1 (Na+, Ca2+ and Cl⁻); samples #1, #8, #11, #15, #22, #25, and #26 are dominated by Factor 2 (Na+ and Ca2+); samples #13, #17 and #21 are dominated by Factor 3 (SO42⁻); samples #6 and #20 are dominated by Factors 1 and 3; sample #12 is dominated by Factors 1 and 2 together.
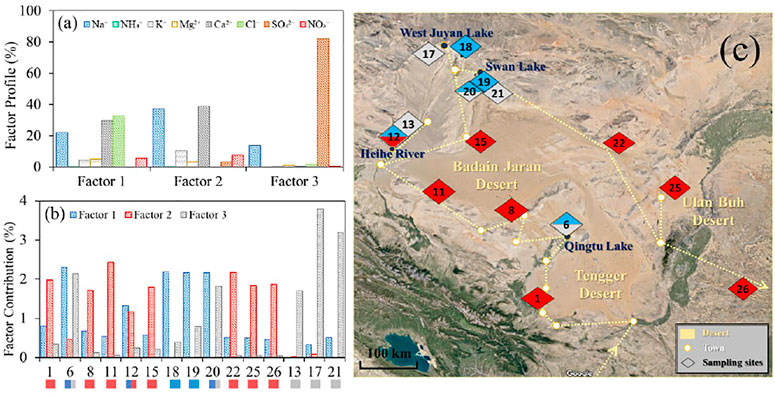
FIGURE 6. PMF 3-factor solution based on ionic concentrations. (A) Factor profile and (B) factor contribution of all samples, where the color codes below the x-axis indicate factors. (C) Sampling sites with color codes shown in map, aqueous environments marked in blue typeface. The blue code is for factor 1, the red code is for factor 2, and the grey code is for factor 3. Some samples show joint features form multiple factors.
In Figure 6C these color-coded samples are mapped, and it appears that the PMF factors correspond with local characteristics of the sampling locations. The factor 2 samples in red are close to the deserts, while the other samples are closer to aqueous sources and playa regions, i.e., the sampling location of sample #6 is near Qingtu Lake, the samples #12 and #13 are near the Heihe River, samples #17 and #18 are near West Juyan Lake, the samples #19, #20, and #21 are near Swan Lake. Thus, the PMF analysis illuminates non-obvious classification links related to the local geography that do not stand out from examining the ionic compositions alone (Figure 5). Although the calculated factor profiles are complicated in their compositions, the factor contributions provide useful information that can be used to infer geographic features based on the chemical analyses, which can be of use for analyzing samples from unknown locations or environments.
4.2 Hygroscopicity
4.2.1 Experimental Results
Three sand samples (#12, #18, #20) were measured for hygroscopicity using a vapor sorption analyzer and the results are shown in Figure 7. In Figure 7A growth factors (m/m0) are plotted as a function of RH, with Figure 7B providing a rescaled y-axis to illuminate the low RH behavior. In all samples mass increases immediately as RH rises. Two behaviors are observed: 1) When RH ≤ 60%, the mass growth is gradual and limited and 2) when RH > 60%, the mass growth diverges. Among the three samples, #20 has the greatest hygroscopicity, which is expected because the sample also has more soluble content (65.80 mg/L) than sample #18 (18.74 mg/L) and sample #12 (9.62 mg/L).
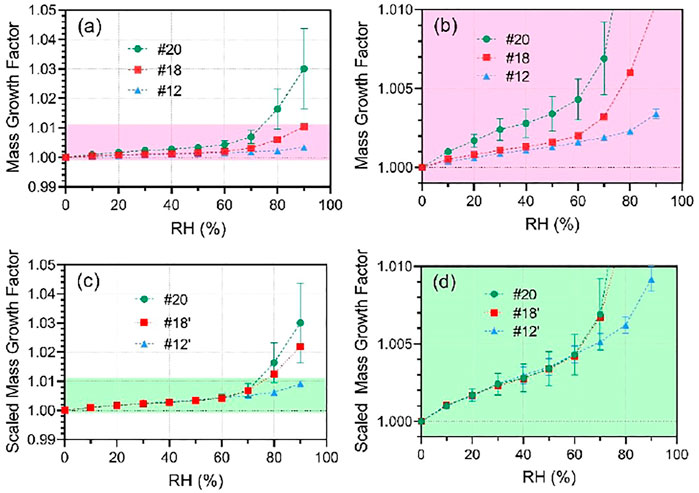
FIGURE 7. (A) Mass growth factor (m/m0) as a function of RH. (B) Zoomed-in, (C) scaled, and (D) scaled and zoomed-in mass growth factors. Sample #18 is scaled by a factor of 2.1 and sample #12 is multiplied by 2.7 to overlap with sample #20.
In Figures 7C,D the hygroscopic curves are scaled, i.e., sample #18 is scaled by a factor of 2.1 and sample #12 is scaled by a factor of 2.7. The good overlap below RH = 60% indicates similar hygroscopicity in this RH range, although the absolute values vary, which is due to the variation in hygroscopic contents. Based on the dissolvable fractions, sample #20 has a higher soluble content than sample #18 by a factor of 3.5, and higher than sample #12 by 6.8 times. In other words, the variations in soluble contents are higher than the variations in mass growth factors, meaning that the hygroscopic fractions in the three samples are different. Such differences are reflected above RH = 60%, where the three scaled hygroscopic curves diverge. Samples #20 and #18 are more hygroscopic than sample #12, and the hygroscopicity is stronger at higher RH.
4.2.2 Thermodynamic Model
The AIOMFAC thermodynamic model was used to formulate predictions for the hygroscopic behavior based on chemical compositions. In Figure 8 modeled Ion Activity Products (IAP) are presented as a function of RH for three sand samples based on their ionic components, and complete results of all samples can be found in Supplementary Figure S1 in the Supplementary Information (SI). The corresponding RHs where the IAP curves intersect with the horizontal dashed lines (IAP of saturated solutions; IAPsat) are the predicted DRHs of individual salts in the salt mixtures.
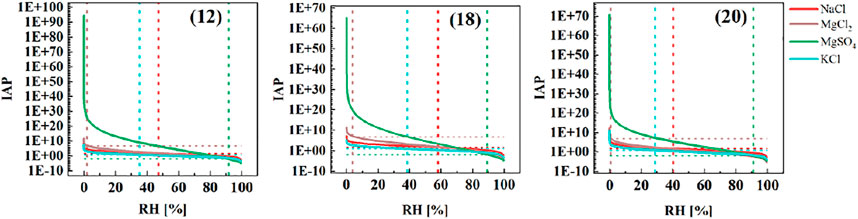
FIGURE 8. AIOMFAC modeled IAP as a function of RH. The horizontal dashed lines indicate the IAPsat of saturated solutions of four common salts (NaCl, MgCl2, MgSO4, KCl). The vertical dashed lines are the model predicted DRH for individual salts in the corresponding salt mixtures.
The DRHs of four common deliquescing salts (MgCl2, KCl, NaCl and MgSO4) predicted by the AIOMFAC model are 0–5%, 30–40%, 40–60%, ≈90%, respectively. Among these four components MgCl2 has the lowest DRH value, which determines the earliest bulk water dissolution. NaCl and MgSO4 are major components in most samples, and thus these two components strongly influence the mass growth of the mixtures. The results predicted by the thermodynamic model are consistent with the results of the hygroscopicity experiments, showing that the observed hygroscopicity is thermodynamically well described. The PMF 2-factor solution based on the DRHs predicted by the AIOMFAC model can be found in Supplementary Figure S2 in the Supplementary Information.
4.3 Individual Particle Chemical Analysis
Individual particles were chemically mapped using the STXM technique. Particle images are shown in Figure 3 and a zoomed-in view in Figure 9A. Figure 9A shows the two typically observed particle morphologies, needle-like and more cubic or polygonal. We observe distinct chemical characteristics of the two morphologies, as illustrated in Figures 9B–D, which include the carbon K-edge and potassium L-edge spectra (Figure 9B), the calcium L-edge spectra (Figure 9C) and the oxygen K-edge spectra (Figure 9D).
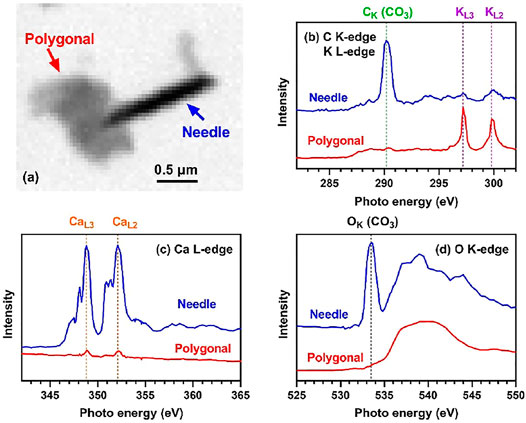
FIGURE 9. STXM image and X-ray spectra of representative particles. (A) Optical image, (B) spectra scanned at C K-edge and K L-edge, (C) Ca L-edge spectra, (D) O K-edge spectra. Blue lines and red lines represent the mean spectra for needle-like particles and polygonal particles, respectively.
The carbon K-edge includes the presence of a carbonate peak (at 290.2 eV) for needle particles that is minimally present for the polygonal particles (Benzerara et al., 2004). Given the region around 284–290 eV is flat, these particles cannot include significant black or organic carbon components. At the potassium L-edge, a doublet at 297.2 and 299.8 eV indicates the presence of potassium in the polygonal particle (Moffet et al., 2013). In Figure 9C, the calcium L-edge shows the presence of calcium (at 348.8 and 352.1 eV) in the needle, suggesting the needle is likely CaCO3 (Benzerara et al., 2004). At the oxygen K-edge (Figure 9D), one sharp peak is observed at 533.6 eV in the needle, which likely corresponds to the oxygen in the carbonate ions, which further supports the supposition that the needle-like particles are dominated by CO3 and Ca. The broad components in the oxygen K-edge spectra are associated with other oxygen species. These results show the mixing state of the CaCO3 and K/O salts in sand samples, and these two components most likely have different solubilities, i.e., CaCO3 has low solubility in water but the K/O salts may be highly dissolvable. This indicates that IC measurements can only detect low level Ca2+, though there are abundant CaCO3 needles in the sand.
4.4 Ice Nucleation
Four samples with higher salt content (#13, #17, #20 and #21, for chemical compositions see Section 4.1) were tested using PINCii for their ice nucleation ability, and results are shown in Figure 10. The four samples were used to produce salt solutions, which were atomized and dried before being introduced into PINCii. These samples were taken from locations close to samples (#12, #18 and #20) that were studied for hygroscopicity (Section 4.2). In Figures 10A–D, the concentrations of activated ice particles are plotted against RHice at different temperatures. During experiments, the RH was increasing isothermally. In all subplots the black solid line represents water saturation, and the dashed line is the Koop et al. (Koop et al., 2000) prediction for homogeneous freezing of a solution (nucleation rate; J = 1.7 × 10⁴). The heat map of concentration is scaled to make the ice nucleation onset stand out at the transition to green. Onset values are quantified using a cumulative sum algorithm for particle counts in the selected size channel for ice (>3 μm) and are replotted in Figure 10E, which summarizes the critical RHice for nucleation onsets. For most temperatures and samples, the observed nucleation matches what is predicted for homogeneous freezing. However, at the lowest temperature (−50°C) ice nucleation activation is also observed well below the homogeneous freezing line, which strongly suggests that some of these samples initiate deposition nucleation, which may occur at RHs between ice saturation and homogeneous freezing (Kong et al., 2018; Wagner et al., 2018).
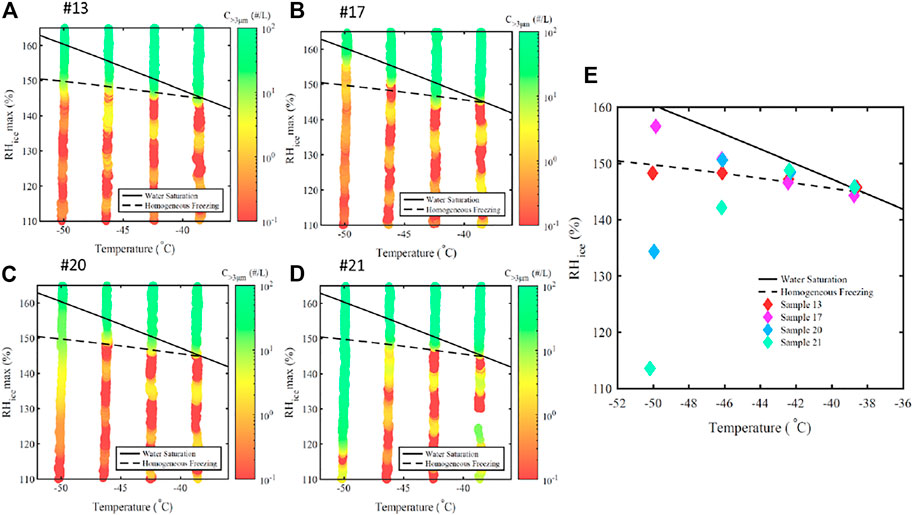
FIGURE 10. (A–D) Particle concentrations observed in the OPC >3 μm size channel, indicative of ice active particles, plotted against maximum lamina supersaturations with respect to RHice at different temperatures. During experiments, the RH was increased isothermally at 1% per minute. The heat map is used to emphasize ice nucleation onset—indicated by the transition to green. (E) Critical RHice of ice nucleation onset. Water saturation is represented by the solid black line, while the dashed line represents homogeneous freezing of a solution (J = 1.7 × 10⁴) as given by Koop et al. (Koop et al., 2000).
Deposition nucleation primarily occurs on solid surfaces or within micropores (Marcolli, 2014; David et al., 2019), but these salt mixtures are very hygroscopic and start to take up water at low RH, as shown in Figure 7. This raises the question as to whether such salt mixture particles can serve as both CCN and INP. The parallel CCN and INP behaviors have been observed on sea salt particles in previous studies (Kong et al., 2018; Wagner et al., 2018). However, in previous studies, deposition nucleation was primarily observed below the DRH. In this study, the salt mixtures may also contain small less-soluble components, even though they are observed to be very hygroscopic. Therefore, the specific behavior may reflect how well the less-soluble components facilitate ice nucleation, and simultaneously how much water uptake is promoted. The balance between water uptake, solvation, and ice nucleation is an area of active investigation in the cloud micro-physics community (Hoose and Möhler, 2012; DeMott et al., 2015; Brasseur et al., 2022). There may also be other important properties of the solvating salt surfaces, such as surface-promoted redox chemistry, that result in important physicochemical phenomena (Kong et al., 2021).
5 Conclusion
Dust/salt mixture samples were collected from important source areas of East Asian Dust Storms, including the Badain Jaran Desert, the Tengger Desert and the Ulan Buh Desert in northwestern China. The concentrations of cations and anions were determined by IC measurements. The ionic concentrations, pH and dissolvable fractions of sand samples are positively correlated, indicating that the dissolved content is rich in alkaline ions. A PMF receptor model was implemented to analyze the IC results and the PMF solution seemingly connects with the location of sampling sites, i.e., whether there are or were aqueous environments nearby. The hygroscopic properties of the samples were measured by a vapor sorption analyzer, and a thermodynamic model was used to well describe the DRH based on chemical compositions. Synchrotron-based STXM was carried out to examine the sample morphology and chemically map typical dust/salt particles. Needle-shaped CaCO3 particles are observed as are more irregularly shaped high K-containing particles. Ice nucleation activity was measured for typical salts, with both homogeneous freezing and deposition nucleation observed from atomized and dried salt solutions/particles. The results indicate that the salts primarily act as cloud condensation nuclei that freeze at low temperatures but can also act as ice nucleating particles at lower vapor saturations and at low temperatures. We hypothesize that this is due the co-existence of high- and low-hygroscopic materials within the salt mixtures.
Data Availability Statement
The raw data supporting the conclusion of this article will be made available by the authors, without undue reservation.
Author Contributions
XK and SW contributed to the conception and the design of the study. JL, WL, and GZ carried out the sampling campaign. JL, WL, DC, WG, and TO conducted the experiments. JL, WL, DC, WG, and LL analyzed the data. MT, ET, MH, SW, and XK supervised the project. JL, LL, and XK wrote the first draft of the manuscript. All authors contributed to manuscript revision, read, and approved the submitted version.
Funding
This work is supported by the National Natural Science Foundation of China (41975160) and the Swedish Research Council (2021-04042). It is a contribution to the Swedish Strategic Research Area Modelling the Regional and Global Earth System (MERGE). EST and DC have been supported by the Swedish Research Councils, FORMAS (2017-00564) and VR (2020-03497).
Conflict of Interest
The authors declare that the research was conducted in the absence of any commercial or financial relationships that could be construed as a potential conflict of interest.
Publisher’s Note
All claims expressed in this article are solely those of the authors and do not necessarily represent those of their affiliated organizations, or those of the publisher, the editors and the reviewers. Any product that may be evaluated in this article, or claim that may be made by its manufacturer, is not guaranteed or endorsed by the publisher.
Acknowledgments
A part of this work was performed at the BL4U of UVSOR Synchrotron Facility, Institute for Molecular Science (IMS program 21-840).
Supplementary Material
The Supplementary Material for this article can be found online at: https://www.frontiersin.org/articles/10.3389/fenvs.2022.897127/full#supplementary-material
References
An, L., Che, H., Xue, M., Zhang, T., Wang, H., Wang, Y., et al. (2018). Temporal and Spatial Variations in Sand and Dust Storm Events in East Asia from 2007 to 2016: Relationships with Surface Conditions and Climate Change. Sci. Total Environ. 633, 452–462. doi:10.1016/j.scitotenv.2018.03.068
Barkan, J., Alpert, P., Kutiel, H., and Kishcha, P. (2005). Synoptics of Dust Transportation Days from Africa toward Italy and Central Europe. J. Geophys. Res.-Atmos. 110, D07208. doi:10.1029/2004jd005222
Benzerara, K., Yoon, T. H., Tyliszczak, T., Constantz, B., Spormann, A. M., and Brown, G. E. (2004). Scanning Transmission X-Ray Microscopy Study of Microbial Calcification. Geobiology 2, 249–259. doi:10.1111/j.1472-4677.2004.00039.x
Bogen, J., Xu, M., and Kennie, P. (2015). The Impact of Pro-glacial Lakes on Downstream Sediment Delivery in Norway. Earth Surf. Proc. Land. 40, 942–952. doi:10.1002/esp.3669
Bou Karam, D., Williams, E., Janiga, M., Flamant, C., McGraw-Herdeg, M., Cuesta, J., et al. (2014). Synoptic-scale Dust Emissions over the Sahara Desert Initiated by a Moist Convective Cold Pool in Early August 2006. Q.J.R. Meteorol. Soc. 140, 2591–2607. doi:10.1002/qj.2326
Brasseur, Z., Castarède, D., Thomson, E. S., Adams, M. P., Drossaart van Dusseldorp, S., Heikkilä, P., et al. (2022). Measurement Report: Introduction to the HyICE-2018 Campaign for Measurements of Ice-Nucleating Particles and Instrument Inter-comparison in the Hyytiälä Boreal Forest. Atmos. Chem. Phys. 22, 5117–5145. doi:10.5194/acp-22-5117-2022
Cao, Y.-Z., Wang, S., Zhang, G., Luo, J., and Lu, S. (2009). Chemical Characteristics of Wet Precipitation at an Urban Site of Guangzhou, South China. Atmos. Res. 94, 462–469. doi:10.1016/j.atmosres.2009.07.004
Castarède, D. (2021). Water Condensation and Freezing in the Atmosphere: Exploring Deliquescence and Ice Nucleation. Gothenburg: Department of Chemistry and Molecular Biology, University of Gothenburg.
Che, H., Xia, X., Zhao, H., Dubovik, O., Holben, B. N., Goloub, P., et al. (2019). Spatial Distribution of Aerosol Microphysical and Optical Properties and Direct Radiative Effect from the China Aerosol Remote Sensing Network. Atmos. Chem. Phys. 19, 11843–11864. doi:10.5194/acp-19-11843-2019
Chen, S., Huang, J., Kang, L., Wang, H., Ma, X., He, Y., et al. (2017). Emission, Transport, and Radiative Effects of Mineral Dust from the Taklimakan and Gobi Deserts: Comparison of Measurements and Model Results. Atmos. Chem. Phys. 17, 2401–2421. doi:10.5194/acp-17-2401-2017
Chun, X., Chen, F., Fan, Y., Xia, D., and Zhao, H. (2009). Evidence of Palaeolake Existence in Ulan Buh Desert and its Environmental Evolution (In Chinese). Acta Geogr. Sin. 64, 339–348. doi:10.11821/xb200903009
Costa, M. J., Sohn, B.-J., Levizzani, V., and Silva, A. M. (2006). Radiative Forcing of Asian Dust Determined from the Synergized GOME and GMS Satellite Data-A Case Study. J. Meteorological Soc. Jpn. 84, 85–95. doi:10.2151/jmsj.84.85
Creamean, J. M., Suski, K. J., Rosenfeld, D., Cazorla, A., DeMott, P. J., Sullivan, R. C., et al. (2013). Dust and Biological Aerosols from the Sahara and Asia Influence Precipitation in the Western U.S. Science 339, 1572–1578. doi:10.1126/science.1227279
David, R. O., Marcolli, C., Fahrni, J., Qiu, Y., Perez Sirkin, Y. A., Molinero, V., et al. (2019). Pore Condensation and Freezing Is Responsible for Ice Formation below Water Saturation for Porous Particles. Proc. Natl. Acad. Sci. U.S.A. 116, 8184–8189. doi:10.1073/pnas.1813647116
DeMott, P. J., Prenni, A. J., McMeeking, G. R., Sullivan, R. C., Petters, M. D., Tobo, Y., et al. (2015). Integrating Laboratory and Field Data to Quantify the Immersion Freezing Ice Nucleation Activity of Mineral Dust Particles. Atmos. Chem. Phys. 15, 393–409. doi:10.5194/acp-15-393-2015
Dong, Z., Qian, G., Lv, P., and Hu, G. (2013). Investigation of the Sand Sea with the Tallest Dunes on Earth: China's Badain Jaran Sand Sea. Earth-Science Rev. 120, 20–39. doi:10.1016/j.earscirev.2013.02.003
Duce, R. A., Unni, C. K., Ray, B. J., Prospero, J. M., and Merrill, J. T. (1980). Long-range Atmospheric Transport of Soil Dust from Asia to the Tropical North Pacific: Temporal Variability. Science 209, 1522–1524. doi:10.1126/science.209.4464.1522
Engelstaedter, S., Tegen, I., and Washington, R. (2006). North African Dust Emissions and Transport. Earth-Science Rev. 79, 73–100. doi:10.1016/j.earscirev.2006.06.004
Fu, P., Huang, J., Li, C., and Zhong, S. (2008). The Properties of Dust Aerosol and Reducing Tendency of the Dust Storms in Northwest China. Atmos. Environ. 42, 5896–5904. doi:10.1016/j.atmosenv.2008.03.041
Gao, Y. H., Li, Z. L., Zhu, R. X., and Liao, H. (2020). Stable Isotope Compositions, Sources and Paleoenvironmental Significance of Holocene Calcareous Root Tubes in the Tengger Desert, Northwest China. Catena 195, 104846. doi:10.1016/j.catena.2020.104846
Gu, W., Li, Y., Zhu, J., Jia, X., Lin, Q., Zhang, G., et al. (2017). Investigation of Water Adsorption and Hygroscopicity of Atmospherically Relevant Particles Using a Commercial Vapor Sorption Analyzer. Atmos. Meas. Tech. 10, 3821–3832. doi:10.5194/amt-10-3821-2017
Gui, K., Che, H., Chen, Q., Zeng, Z., Zheng, Y., Long, Q., et al. (2017). Water Vapor Variation and the Effect of Aerosols in China. Atmos. Environ. 165, 322–335. doi:10.1016/j.atmosenv.2017.07.005
Guo, L., Gu, W., Peng, C., Wang, W., Li, Y. J., Zong, T., et al. (2019). A Comprehensive Study of Hygroscopic Properties of Calcium- and Magnesium-Containing Salts: Implication for Hygroscopicity of Mineral Dust and Sea Salt Aerosols. Atmos. Chem. Phys. 19, 2115–2133. doi:10.5194/acp-19-2115-2019
He, M., Ichinose, T., Song, Y., Yoshida, Y., Bekki, K., Arashidani, K., et al. (2016). Desert Dust Induces TLR Signaling to Trigger Th2-Dominant Lung Allergic Inflammation via a MyD88-dependent Signaling Pathway. Toxicol. Appl. Pharmacol. 296, 61–72. doi:10.1016/j.taap.2016.02.011
Hoose, C., and Möhler, O. (2012). Heterogeneous Ice Nucleation on Atmospheric Aerosols: A Review of Results from Laboratory Experiments. Atmos. Chem. Phys. 12, 9817–9854. doi:10.5194/acp-12-9817-2012
Hu, F., and Yang, X. (2016). Geochemical and Geomorphological Evidence for the Provenance of Aeolian Deposits in the Badain Jaran Desert, Northwestern China. Quat. Sci. Rev. 131, 179–192. doi:10.1016/j.quascirev.2015.10.039
Huang, J. F., Zhang, C. D., and Prospero, J. M. (2010). African Dust Outbreaks: A Satellite Perspective of Temporal and Spatial Variability over the Tropical Atlantic Ocean. J. Geophys. Res.-Atmos. 115, D05202. doi:10.1029/2009jd012516
Huang, J. P., Minnis, P., Lin, B., Wang, T. H., Yi, Y. H., Hu, Y. X., et al. (2006). Possible Influences of Asian Dust Aerosols on Cloud Properties and Radiative Forcing Observed from MODIS and CERES. Geophys. Res. Lett. 33, L06824. doi:10.1029/2005gl024724
Huang, J. P., Wang, T. H., Wang, W. C., Li, Z. Q., and Yan, H. R. (2014). Climate Effects of Dust Aerosols over East Asian Arid and Semiarid Regions. J. Geophys. Res.-Atmos. 119, 11398–11416. doi:10.1002/2014jd021796
Huang, S., Hu, W., Chen, J., Wu, Z., Zhang, D., and Fu, P. (2021). Overview of Biological Ice Nucleating Particles in the Atmosphere. Environ. Int. 146, 106197. doi:10.1016/j.envint.2020.106197
Huang, Z. W., Huang, J. P., Hayasaka, T., Wang, S. S., Zhou, T., and Jin, H. C. (2015). Short-cut Transport Path for Asian Dust Directly to the Arctic: A Case Study. Environ. Res. Lett. 10, 11. doi:10.1088/1748-9326/10/11/114018
Ichinose, T., Yoshida, S., Hiyoshi, K., Sadakane, K., Takano, H., Nishikawa, M., et al. (2008). The Effects of Microbial Materials Adhered to Asian Sand Dust on Allergic Lung Inflammation. Arch. Environ. Contam. Toxicol. 55, 348–357. doi:10.1007/s00244-007-9128-8
Ji, F., Wu, Z., Huang, J., and Chassignet, E. P. (2014). Evolution of Land Surface Air Temperature Trend. Nat. Clim. Change 4, 462–466. doi:10.1038/nclimate2223
Jia, P., Wang, N. a., Cheng, H., Li, Z., Ning, K., Zhang, X., et al. (2015). A Study on the Range and Area of Ulan Buh Desert Based on 3S Technology (In Chinese). J. Arid Land Resour. Environ. 29, 131–138. doi:10.13448/j.cnki.jalre.2015.413
Kanayama, S., Yabuki, S., Yanagisawa, F., and Motoyama, R. (2002). The Chemical and Strontium Isotope Composition of Atmospheric Aerosols over Japan: The Contribution of Long-Range-Transported Asian Dust (Kosa). Atmos. Environ. 36, 5159–5175. doi:10.1016/s1352-2310(02)00587-3
Karydis, V. A., Tsimpidi, A. P., Bacer, S., Pozzer, A., Nenes, A., and Lelieveld, J. (2017). Global Impact of Mineral Dust on Cloud Droplet Number Concentration. Atmos. Chem. Phys. 17, 5601–5621. doi:10.5194/acp-17-5601-2017
Kelly, J. T., Chuang, C. C., and Wexler, A. S. (2007). Influence of Dust Composition on Cloud Droplet Formation. Atmos. Environ. 41, 2904–2916. doi:10.1016/j.atmosenv.2006.12.008
Kilcoyne, A. L. D., Tyliszczak, T., Steele, W. F., Fakra, S., Hitchcock, P., Franck, K., et al. (2003). Interferometer-controlled Scanning Transmission X-Ray Microscopes at the Advanced Light Source. J. Synchrotron Radiat. 10, 125–136. doi:10.1107/s0909049502017739
Kok, J. F., Ward, D. S., Mahowald, N. M., and Evan, A. T. (2018). Global and Regional Importance of the Direct Dust-Climate Feedback. Nat. Commun. 9, 241. doi:10.1038/s41467-017-02620-y
Kok, J. F., Adebiyi, A. A., Albani, S., Balkanski, Y., Checa-Garcia, R., Chin, M., et al. (2021). Contribution of the World's Main Dust Source Regions to the Global Cycle of Desert Dust. Atmos. Chem. Phys. 21, 8169–8193. doi:10.5194/acp-21-8169-2021
Kong, X., Castarède, D., Thomson, E. S., Boucly, A., Artiglia, L., Ammann, M., et al. (2021). A Surface-Promoted Redox Reaction Occurs Spontaneously on Solvating Inorganic Aerosol Surfaces. Science 374, 747–752. doi:10.1126/science.abc5311
Kong, X., Wolf, M. J., Roesch, M., Thomson, E. S., Bartels-Rausch, T., Alpert, P. A., et al. (2018). A Continuous Flow Diffusion Chamber Study of Sea Salt Particles Acting as Cloud Nuclei: Deliquescence and Ice Nucleation. Tellus B Chem. Phys. Meteorology 70, 1–11. doi:10.1080/16000889.2018.1463806
Koop, T., Kapilashrami, A., Molina, L. T., and Molina, M. J. (2000). Phase Transitions of Sea-Salt/water Mixtures at Low Temperatures: Implications for Ozone Chemistry in the Polar Marine Boundary Layer. J. Geophys. Res. 105, 26393–26402. doi:10.1029/2000jd900413
Krueger, B. J., Grassian, V. H., Cowin, J. P., and Laskin, A. (2004). Heterogeneous Chemistry of Individual Mineral Dust Particles from Different Dust Source Regions: the Importance of Particle Mineralogy. Atmos. Environ. 38, 6253–6261. doi:10.1016/j.atmosenv.2004.07.010
Kumar, P., Sokolik, I. N., and Nenes, A. (2011). Measurements of Cloud Condensation Nuclei Activity and Droplet Activation Kinetics of Fresh Unprocessed Regional Dust Samples and Minerals. Atmos. Chem. Phys. 11, 3527–3541. doi:10.5194/acp-11-3527-2011
Li, C., Krotkov, N. A., Dickerson, R. R., Li, Z. Q., Yang, K., and Chin, M. (2010). Transport and Evolution of a Pollution Plume from Northern China: A Satellite-Based Case Study. J. Geophys. Res.-Atmos. 115, D00K03. doi:10.1029/2009jd012245
Li, Q., Fan, Q., Wei, H., Qin, Z., Zhang, X., Du, Y., et al. (2020). Sulfur Isotope Constraints on the Formation of MgSO4-Deficient Evaporites in the Qarhan Salt Lake, Western China. J. Asian Earth Sci. 189, 104160. doi:10.1016/j.jseaes.2019.104160
Li, Z., Wang, N. a., Cheng, H., Ning, K., Zhao, L., and Li, R. (2015). Formation and Environmental Significance of Late Quaternary Calcareous Root Tubes in the Deserts of the Alashan Plateau, Northwest China. Quat. Int. 372, 167–174. doi:10.1016/j.quaint.2014.11.021
Li, Z., Wei, Z., Dong, S., and Chen, Q. (2018). The Paleoenvironmental Significance of Spatial Distributions of Grain Size in Groundwater-Recharged Lakes: A Case Study in the Hinterland of the Badain Jaran Desert, Northwest China. Earth Surf. Process. Landforms 43, 363–372. doi:10.1002/esp.4248
Liu, C., Zhang, J., Jiao, P., and Mischke, S. (2016). The Holocene History of Lop Nur and its Palaeoclimate Implications. Quat. Sci. Rev. 148, 163–175. doi:10.1016/j.quascirev.2016.07.016
Liu, Y., Wang, G. P., Hu, Z. Y., Shi, P. J., Lyu, Y. L., Zhang, G. M., et al. (2020). Dust Storm Susceptibility on Different Land Surface Types in Arid and Semiarid Regions of Northern China. Atmos. Res. 243, 105031. doi:10.1016/j.atmosres.2020.105031
Ma, N., Wang, N., Li, Z., Chen, X., Zhu, J., and Dong, C. (2011). Analysis on Climate Change in the Northern and Southern Marginal Zones of the Badain Juran Desert during the Period 1960–2009 (In Chinese). Arid Zone Res. 28, 242–250. doi:10.13866/j.azr.2011.02.020
Ma, N., Wang, N., Zhao, L., Zhang, Z., Dong, C., and Shen, S. (2014). Observation of Mega-Dune Evaporation after Various Rain Events in the Hinterland of Badain Jaran Desert, China. Chin. Sci. Bull. 59, 162–170. doi:10.1007/s11434-013-0050-3
Mahowald, N., Albani, S., Kok, J. F., Engelstaeder, S., Scanza, R., Ward, D. S., et al. (2014). The Size Distribution of Desert Dust Aerosols and its Impact on the Earth System. Aeolian Res. 15, 53–71. doi:10.1016/j.aeolia.2013.09.002
Marcolli, C. (2014). Deposition Nucleation Viewed as Homogeneous or Immersion Freezing in Pores and Cavities. Atmos. Chem. Phys. 14, 2071–2104. doi:10.5194/acp-14-2071-2014
Moffet, R. C., Rödel, T. C., Kelly, S. T., Yu, X. Y., Carroll, G. T., Fast, J., et al. (2013). Spectro-microscopic Measurements of Carbonaceous Aerosol Aging in Central California. Atmos. Chem. Phys. 13, 10445–10459. doi:10.5194/acp-13-10445-2013
Nee, J. B., Chiang, C. W., Hu, H. L., Hu, S. X., and Yu, J. Y. (2007). Lidar Measurements of Asian Dust Storms and Dust Cloud Interactions. J. Geophys. Res.-Atmos. 112, D15202. doi:10.1029/2007jd008476
Norris, G., Duvall, R., Brown, S., and Bai, S. (2014). EPA Positive Matrix Factorization (PMF) 5.0 Fundamentals and User Guide. Washington, DC: US Environmental Protection Agency.
Ohigashi, T., Arai, H., Araki, T., Kondo, N., Shigemasa, E., Ito, A., et al. (2013). Construction of the Scanning Transmission X-Ray Microscope Beamline at UVSOR. J. Phys. Conf. Ser. 463, 012006. doi:10.1088/1742-6596/463/1/012006
Okin, G. S. (2005). Dependence of Wind Erosion and Dust Emission on Surface Heterogeneity: Stochastic Modeling. J. Geophys. Res.-Atmos. 110, 0148–0227. doi:10.1029/2004jd005288
Prospero, J. M., Collard, F.-X., Molinié, J., and Jeannot, A. (2014). Characterizing the Annual Cycle of African Dust Transport to the Caribbean Basin and South America and its Impact on the Environment and Air Quality. Glob. Biogeochem. Cycles 28, 757–773. doi:10.1002/2013gb004802
Qu, J., Chang, X., Dong, G., Wang, X., Lu, J., and Zhong, D. (2003). Fractal Behavior of Aeolian Sand Landform in Typical Megadune Area of Badin Jaran Desert (In Chinese). J. Desert Res. 23, 361–365.
Rashki, A., Middleton, N. J., and Goudie, A. S. (2021). Dust Storms in Iran - Distribution, Causes, Frequencies and Impacts. Aeolian Res. 48, 100655. doi:10.1016/j.aeolia.2020.100655
Rosenfeld, D., Rudich, Y., and Lahav, R. (2001). Desert Dust Suppressing Precipitation: A Possible Desertification Feedback Loop. Proc. Natl. Acad. Sci. U.S.A. 98, 5975–5980. doi:10.1073/pnas.101122798
Rudich, Y., Khersonsky, O., and Rosenfeld, D. (2002). Treating Clouds with a Grain of Salt. Geophys. Res. Lett. 29, 17/1–17/4. doi:10.1029/2002gl016055
Sassen, K. (2002). Indirect Climate Forcing over the Western US from Asian Dust Storms. Geophys. Res. Lett. 29, 136–142. doi:10.1029/2001gl014051
Schillereff, D. N., Chiverrell, R. C., Macdonald, N., and Hooke, J. M. (2016). Hydrological Thresholds and Basin Control over Paleoflood Records in Lakes. Geology 44, 43–46. doi:10.1130/g37261.1
Su, X., Xu, L., Wei, Q., Zhang, Z., Wang, S., and Wu, H. (2016). Study of Impacts of Dust Aerosol on Precipitation over East Asia (In Chinese). Plateau Meteorol. 35, 211–219. doi:10.7522/j.issn.1000-0534.2014.00091
Tang, M., Cziczo, D. J., and Grassian, V. H. (2016). Interactions of Water with Mineral Dust Aerosol: Water Adsorption, Hygroscopicity, Cloud Condensation, and Ice Nucleation. Chem. Rev. 116, 4205–4259. doi:10.1021/acs.chemrev.5b00529
Tang, M., Gu, W., Ma, Q., Li, Y. J., Zhong, C., Li, S., et al. (2019). Water Adsorption and Hygroscopic Growth of Six Anemophilous Pollen Species: The Effect of Temperature. Atmos. Chem. Phys. 19, 2247–2258. doi:10.5194/acp-19-2247-2019
Tobo, Y., Zhang, D., Matsuki, A., and Iwasaka, Y. (2010). Asian Dust Particles Converted into Aqueous Droplets under Remote Marine Atmospheric Conditions. Proc. Natl. Acad. Sci. U.S.A. 107, 17905–17910. doi:10.1073/pnas.1008235107
Uno, I., Eguchi, K., Yumimoto, K., Takemura, T., Shimizu, A., Uematsu, M., et al. (2009). Asian Dust Transported One Full Circuit Around the Globe. Nat. Geosci. 2, 557–560. doi:10.1038/ngeo583
Venero-Fernández, S. J. (2016). Saharan Dust Effects on Human Health: A Challenge for Cuba's Researchers. Medicc Rev. 18, 32–34. doi:10.37757/MR2016.V18.N3.8
Wagner, R., Kaufmann, J., Möhler, O., Saathoff, H., Schnaiter, M., Ullrich, R., et al. (2018). Heterogeneous Ice Nucleation Ability of NaCl and Sea Salt Aerosol Particles at Cirrus Temperatures. J. Geophys. Res. Atmos. 123, 2841–2860. doi:10.1002/2017jd027864
Wang, B., Liu, X., and Liu, L. (2020). Characteristics of Precipitation in the Surrounding Area of Tengger Desert in 1957–2017 (In Chinese). J. Desert Res. 40, 163–170. doi:10.7522/j.issn.1000-694X.2020.00047
Wang, N. a., Li, Z., Li, Y., and Cheng, H. (2013). Millennial-scale Environmental Changes in the Asian Monsoon Margin during the Holocene, Implicated by the Lake Evolution of Huahai Lake in the Hexi Corridor of Northwest China. Quat. Int. 313-314, 100–109. doi:10.1016/j.quaint.2013.08.039
Wang, W. X., and Xu, P. J. (2009). Research Progress in Precipitation Chemistry in China. Prog. Chem. 21, 266–281.
Wang, X., Huang, J., Ji, M., and Higuchi, K. (2008). Variability of East Asia Dust Events and Their Long-Term Trend. Atmos. Environ. 42, 3156–3165. doi:10.1016/j.atmosenv.2007.07.046
Wu, C., Zhang, S., Wang, G., Lv, S., Li, D., Liu, L., et al. (2020). Efficient Heterogeneous Formation of Ammonium Nitrate on the Saline Mineral Particle Surface in the Atmosphere of East Asia during Dust Storm Periods. Environ. Sci. Technol. 54, 15622–15630. doi:10.1021/acs.est.0c04544
Xu, M., and Li, Z. (2016). Accumulated Temperature Changes in Desert Region and Surrounding Area during 1960–2013: A Case Study in the Alxa Plateau, Northwest China. Environ. Earth. Sci. 75, 1276. doi:10.1007/s12665-016-6084-5
Yin, Y., Wurzler, S., Levin, Z., and Reisin, T. G. (2002). Interactions of Mineral Dust Particles and Clouds: Effects on Precipitation and Cloud Optical Properties. J. Geophys. Res.-Atmos. 107, AAC 19/1-19/14. doi:10.1029/2001jd001544
You, Q., Cai, Z., Pepin, N., Chen, D., Ahrens, B., Jiang, Z., et al. (2021). Warming Amplification over the Arctic Pole and Third Pole: Trends, Mechanisms and Consequences. Earth-Science Rev. 217, 103625. doi:10.1016/j.earscirev.2021.103625
Yuan, T. G., Huang, J. P., Cao, J. H., Zhang, G. L., and Ma, X. J. (2021). Indian Dust-Rain Storm: Possible Influences of Dust Ice Nuclei on Deep Convective Clouds. Sci. Total Environ. 779, 146439. doi:10.1016/j.scitotenv.2021.146439
Zhang, C., Liu, C., Hu, Q., Cai, Z., Su, W., Xia, C., et al. (2019). Satellite UV-Vis Spectroscopy: Implications for Air Quality Trends and Their Driving Forces in China during 2005-2017. Light Sci. Appl. 8, 100. doi:10.1038/s41377-019-0210-6
Zhang, D., Liu, D., Luo, T., Wang, Z., and Yin, Y. (2015). Aerosol Impacts on Cloud Thermodynamic Phase Change over East Asia Observed with CALIPSO and CloudSat Measurements. J. Geophys. Res. Atmos. 120, 1490–1501. doi:10.1002/2014jd022630
Zhang, H. C., Ma, Y. Z., Wünnemann, B., and Pachur, H.-J. (2000). A Holocene Climatic Record from Arid Northwestern China. Palaeogeogr. Palaeoclimatol. Palaeoecol. 162, 389–401. doi:10.1016/s0031-0182(00)00139-5
Zhu, B., and Yang, X. (2010). The Origin and Distribution of Soluble Salts in the Sand Seas of Northern China. Geomorphology 123, 232–242. doi:10.1016/j.geomorph.2010.07.001
Zhu, J., Wang, N., Chen, H., Dong, C., and Zhang, H. (2010). Study on the Boundary and the Area of Badain Jaran Desert Based on Remote Sensing Imagery (In Chinese). Prog. Geogr. 29, 1087–1094. doi:10.3724/SP.J.1084.2010.00199
Ziegler, C. L., Murray, R. W., Plank, T., and Hemming, S. R. (2008). Sources of Fe to the Equatorial Pacific Ocean from the Holocene to Miocene. Earth Planet. Sci. Lett. 270, 258–270. doi:10.1016/j.epsl.2008.03.044
Zuend, A., Marcolli, C., Booth, A. M., Lienhard, D. M., Soonsin, V., Krieger, U. K., et al. (2011). New and Extended Parameterization of the Thermodynamic Model AIOMFAC: Calculation of Activity Coefficients for Organic-Inorganic Mixtures Containing Carboxyl, Hydroxyl, Carbonyl, Ether, Ester, Alkenyl, Alkyl, and Aromatic Functional Groups. Atmos. Chem. Phys. 11, 9155–9206. doi:10.5194/acp-11-9155-2011
Keywords: ice nucleation, hygroscopicity, AIOMFAC, ion chromatography, STXM, PMF
Citation: Li J, Liu W, Castarède D, Gu W, Li L, Ohigashi T, Zhang G, Tang M, Thomson ES, Hallquist M, Wang S and Kong X (2022) Hygroscopicity and Ice Nucleation Properties of Dust/Salt Mixtures Originating from the Source of East Asian Dust Storms. Front. Environ. Sci. 10:897127. doi: 10.3389/fenvs.2022.897127
Received: 15 March 2022; Accepted: 17 May 2022;
Published: 08 June 2022.
Edited by:
Yanlin Zhang, Nanjing University of Information Science and Technology, ChinaReviewed by:
Guangxing Lin, Institute of Atmospheric Physics (CAS), ChinaShufeng Pang, Beijing Institute of Technology, China
Chong Qiu, University of New Haven, United States
Copyright © 2022 Li, Liu, Castarède, Gu, Li, Ohigashi, Zhang, Tang, Thomson, Hallquist, Wang and Kong. This is an open-access article distributed under the terms of the Creative Commons Attribution License (CC BY). The use, distribution or reproduction in other forums is permitted, provided the original author(s) and the copyright owner(s) are credited and that the original publication in this journal is cited, in accordance with accepted academic practice. No use, distribution or reproduction is permitted which does not comply with these terms.
*Correspondence: Sen Wang, d2FuZ3NlbkBud3UuZWR1LmNu; Xiangrui Kong, a29uZ3hAY2hlbS5ndS5zZQ==