 Menglin Zhan
 Yan Chen1,2*
- 1College of Economics and Management, Nanjing Forestry University, Nanjing, China
- 2Academy of Chinese Ecological Progress and Forestry Development Studies, Nanjing Forestry University, Nanjing, China
Under the background of the low-carbon economy, considering that manufacturers produce common products and low-carbon products simultaneously and the two products are substituting, three models are set up, namely, no government subsidy, subsidy based on the research and development (R&D) cost, and subsidy based on the production volume of low-carbon products. The Stackelberg game theory is used to analyze the optimal decision of the supply chain under the three methods of government subsidy, the influence of the correlation coefficient on optimal decision-making is discussed, and the effects of different government subsidy methods on the equilibrium solutions are compared and analyzed. Finally, the results are verified and illustrated by example analysis. The study found that the government subsidy reduces the sales volume of common products but increases the sales volume of low-carbon products, the emission reduction of unit low-carbon products, total emission reductions, and manufacturer’s profit. The unit emission reduction and total emission reductions are the highest when the government subsidies are according to the R&D cost, and the manufacturer’s profit is the highest when the government subsidies are according to the production volume of low-carbon products. Total emission reduction and supply members’ profit have a positive relationship with the subsidy coefficient and the sensitivity of consumers toward price difference and have a negative relationship with the R&D cost coefficient.
1 Introduction
In recent years, as the international community pays attention to the environmental pollution caused by economic development, green development has gradually become the general consensus of all countries (He et al., 2019). Research shows that factors such as trade openness, urbanization, and energy use are important reasons for the increase in global carbon emissions (Sun et al., 2020), and a low-carbon supply chain management model that considers resource consumption and environmental impact emerges as the times require. At the same time, with the development of a low-carbon economy and the improvement of consumer environmental awareness (CEA), low-carbon products are increasingly favored by consumers. The production of low-carbon products by core enterprises in the supply chain can not only enhance their public image but also gain market competitive advantages (Wen et al., 2018). Therefore, in order to maintain the original production advantages and adapt to the low-carbon economy, some companies have begun to produce common products and low-carbon products simultaneously. For example, Toyota Motor Corporation produces both fuel vehicles and new energy vehicles, and Foshan Lighting produces both incandescent lamps and energy-saving lamps. Common products and low-carbon products have the same function but have different levels of emission reduction, so they are substitutable. However, producing low-carbon products requires emission reduction R&D, which will occupy the funds of enterprises’ production activities, resulting in low enthusiasm for enterprises to reduce carbon emissions. In order to guide the green production of enterprises and improve their motivation, the government has adopted a series of policies, such as carbon trading (Liu et al., 2021), carbon tax (Mishra et al., 2021), and subsidies. Among them, government subsidy is one of the policies that have been applied earlier, especially in the promotional stage of low-carbon products. But the government has a variety of subsidy methods, and the effects of different subsidy methods are also different. For the government, in order to more effectively incentivize manufacturers to produce more low-carbon products with higher emission reductions, it is an important issue to analyze the impact of different subsidy methods on the low-carbon supply chain, which will also help the government to formulate subsidy methods.
Therefore, considering that manufacturers produce common products and low-carbon products simultaneously and the two products are substitutable, this study further analyzes the impact of different government subsidy methods on the low-carbon supply chain. The supply chain problems to be solved in this study are as follows: 1) what is the impact of different government subsidy methods on the equilibrium decision of supply chain members? 2) How can the government subsidize manufacturers to encourage consumers to buy low-carbon products, increase the production volume of low-carbon products, manufacturers’ total emission reductions and manufacturers’ enthusiasm for green production, and maximize social welfare? 3) What is the impact of changes in the sensitivity of consumers toward price difference, the R&D cost coefficient, and the subsidy coefficient on the equilibrium decisions of supply chain members?
In order to solve the aforementioned problems, this study compares three decision-making scenarios: no government subsidy (N), subsidy based on the R&D cost (C), and subsidy based on the production volume of low-carbon products (D). First, the optimal decision-making of supply chain members in each scenario is solved, and the sensitivity analysis of the equilibrium solution is carried out. Finally, an example analysis is given. Our study will provide a scientific basis for the government to formulate subsidy methods and for enterprises to make emission reduction and production decisions.
2 Literature Review
This study mainly involves two aspects of research, namely, product substitution and different methods of government subsidy, and some research studies related to these two parts will be discussed in the following paragraphs.
The research on the production of mixed products by enterprises is mainly divided into three aspects: the impact of product substitution on supply chain members, product pricing, and supply chain coordination. First, regarding the impact of product substitution on supply chain members, some scholars have found that product substitution promotes green innovation of manufacturers, achieves a win–win situation for manufacturers and retailers, and can reduce environmental damage and increase social welfare (Cao et al., 2021). Some scholars further considered the impact of product substitution and complementarity on supply chain members and proposed bundling strategies to improve members’ profits (Chen et al., 2021). Second, for manufacturers to price common products and low-carbon products, some scholars (Giri et al., 2016) considered the situation of selling two substitute products and one supplementary product in a two-tier supply chain and studied the manufacturers pricing decision. Some scholars have further considered the carbon quota trading policy (Guo et al., 2018), the manufacturer’s financial constraints (Qin and Li, 2021), the heterogeneity of consumers (Liu et al., 2018), the existence of search costs (Bi and Wu, 2018), product warranty issues (Wang, 2017), and the triple competitive factors of alternative products (Han et al., 2020), and so on. Finally, aiming at the coordination problem of the mixed product supply chain, some studies have found that product return contract (Zhang et al., 2015), member collaboration (Li et al., 2019), Shapley value method (Xu et al., 2014; Wang et al., 2018), multilateral compensation wholesale price contract (Hosseini-Motlagh et al., 2018), revenue-sharing and cost-sharing contracts (Wang and Wang, 2015), and cost-sharing—both pricing mechanisms (Chen et al., 2020) can achieve supply chain coordination for the production of mixed products.
The research on different government subsidy methods is mainly divided into two aspects: different government subsidy objects and different subsidy mechanisms. First, in response to the problem of different subsidy objects, government subsidy objects mainly include manufacturers, suppliers (Meng et al., 2021), and consumers (Yang et al., 2019; Xiong et al., 2020), among which manufacturers are also divided into core manufacturers, original manufacturers, and remanufacturers (Xia and Cao, 2020). Second, in response to the different government subsidy mechanisms, some scholars have studied the impact of government fixed subsidies and discount subsidies on the decision-making of supply chain members when the government subsidizes consumers (Zhang et al., 2018; Hai and Li, 2021). The impact of cost, product greenness, and product production cost subsidies on the green supply chain has been studied (Wen et al., 2018). Research shows that reasonable government subsidy is beneficial to incentivize manufacturers to improve green production levels and enhances the economic benefits of supply chain members (Feng et al., 2022).
3 The Model
3.1 Problem Description and Model Assumptions
This study considers a secondary low-carbon supply chain consisting of a single manufacturer and a single retailer, where the manufacturer produces both common and low-carbon products, and the retailer sells both products. Since, the manufacturer’s R&D cost of emission reduction is relatively high, in order to encourage the manufacturer to reduce emissions, this study further considers the situation of the government subsidizing the manufacturer, and three models are constructed: no government subsidy (N), subsidy based on emission reduction R&D cost (C), and subsidy based on the production volume of low-carbon products (D). The relevant parameters involved in this study are shown in Table 1.
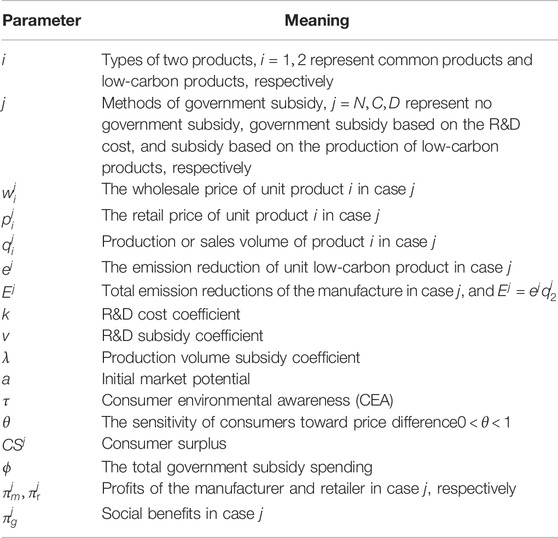
TABLE 1. Parameter symbols and their meanings.
3.2 Model Basic Assumptions
On the premise of not changing the essence of the problem, the following assumptions are made on the model:
Assumption 1. Consider a two-stage supply chain consisting of a single manufacturer and a single retailer. The Stackelberg game is formed between the manufacturer and the retailer. The manufacturer is the leader of the game, and the retailer is the follower of the game. In the first stage of the game, the manufacturer decides the wholesale price of common products and low-carbon products and the emission reduction of unit low-carbon product. In the second stage, the retailer decides the retail price of the two products based on the manufacturer’s decision.
Assumption 2. Common products and low-carbon products are substitutable, and
In addition, we do not consider the problem of random demand and assume that the market can be completely cleared, that is, the production volume of products is equal to the sales volume of products.
Assumption 3. According to the standard assumption of the classic model (the emission reduction and the R&D cost have a quadratic relationship) (Nielsen et al., 2019), therefore, the manufacturer’s R&D cost of emission reduction is
Assumption 4. Manufacturers need to pay extra R&D cost to produce low-carbon products, so in order to encourage manufacturers to produce low-carbon products, the government provides subsidies to manufacturers, and the total government subsidy spending is
Assumption 5. Considering that the R&D cost coefficient is high, at the same time, all profit objective functions discussed in this study are concave functions of decision variables, we assume that
3.3 Model Establishment and Solution
According to different government subsidy methods, the Stackelberg game model is established under no government subsidy (N), subsidy based on the R&D cost (C), and subsidy based on the production volume of low-carbon products (D), respectively, to study the effect of different government subsidy methods on the balanced decision-making of manufacturers and retailers.
3.3.1 No Government Subsidy (N)
In order to analyze the effects of government subsidy and different subsidy methods, first, the results in the case of no government subsidy are given as the lower-line benchmark for the comparison of the effects of different government subsidy methods. The profits of manufacturers and retailers with no government subsidy are:
When
Detailed derivations for optimal decision in Scenarios N are presented in Supplementary Appendix SA.
Conclusion 1: When with no government subsidy, the impact of the sensitivity of consumers toward price difference on equilibrium solutions is:
Conclusion 1 shows that when with no government subsidy the wholesale price and retail price of common products are only related to the initial market potential of two products and have nothing to do with the sensitivity of consumers toward price difference and the R&D cost coefficient. With the increase of the sensitivity of consumers toward price difference and the decrease of the R&D cost coefficient, the production volume of common products will decrease, while the wholesale price, retail price, unit emission reduction, the production volume of low-carbon products, and supply chain members’ profits will increase. Proof: see Supplementary Appendix SB.
3.3.2 Subsidy Based on the R&D Cost (C)
When the government subsidizes the manufacturer based on the R&D cost, according to the aforementioned assumption, the profits of the manufacturer and the retailer are:
When
When
Proof: see Supplementary Appendix SC.
Conclusion 2: When the government subsidizes based on the R&D cost, the impact of the sensitivity of consumers toward price difference on equilibrium solutions is:
Conclusion 2 shows that when the government subsidizes based on the R&D cost the wholesale price and retail price of common products are only related to the initial market potential of two products and have nothing to do with the sensitivity of consumers toward price difference and the R&D cost coefficient. With the increase of the sensitivity of consumers toward price difference and with the increase of the R&D subsidy coefficient, the production volume of common products will decrease, while the wholesale price, retail price, unit emission reduction, the production volume of low-carbon products, and supply chain members’ profits will increase.
3.3.3 Subsidy Based on the Production Volume of Low-Carbon Products (D)
When the government subsidizes the manufacturer based on the production volume of low-carbon products, the profits of the manufacturer and the retailer are:
When
When
Proof: see Supplementary Appendix SC.
Conclusion 3: When the government subsidizes based on the production volume of low-carbon products, the impact of the sensitivity of consumers toward price difference on equilibrium solutions is:
Conclusion 3 shows that when the government subsidizes based on the production volume of low-carbon products, the wholesale price and the retail price of common products are only related to the initial market potential of two products and have nothing to do with the sensitivity of consumers toward price difference and the R&D cost coefficient. With the increase of the sensitivity of consumers toward price difference, the production volume of common products will decrease, while the wholesale price, retail price, unit emission reduction, the production volume of low-carbon products, and supply chain members’ profits will increase. With the increase of the production volume subsidy coefficient, the production volume of common products will decrease, while the unit emission reduction, the production volume of low-carbon products, and supply chain members’ profits will increase, and the relationship between the wholesale price and the retail price of low-carbon products and the production volume subsidy coefficient are related to the R&D cost coefficient.
4 Comparative Analysis of Different Government Subsidy Methods
In order to compare and analyze the effects of different government subsidy methods, it is first necessary to solve the comparability problem between the government subsidy based on the R&D cost and the subsidy based on the production volume of low-carbon products. Based on the same government subsidy spending, this study compares and analyzes the optimal decision-making of supply chain members under different government subsidy methods. The total government subsidy spending under two government subsidy methods is:
When
where
Regarding the effect of different government subsidy methods, there are the following five propositions:
Proof: see Supplementary Appendix SD.
Proposition 1. The influence of different government subsidy methods on the wholesale price and retail price of the two products is:
(1)
(2) When
(3) When
Management implications: different government subsidy methods will not affect the wholesale price and retail price of common products, and government subsidies will not necessarily reduce the retail price and wholesale price of low-carbon products. When the R&D cost coefficient is relatively high, the wholesale price and retail price of low-carbon products under the subsidy based on the R&D cost are the highest, followed by the one without subsidy, and the lowest under the subsidy based on the production volume of low-carbon products. When the R&D cost coefficient is medium, the wholesale price and retail price of low-carbon products under the subsidy based on the R&D cost are the highest, followed by the subsidy based on the production volume of low-carbon products, and the non-subsidy is the lowest. Therefore, if the government wants to promote consumers to buy low-carbon products, when the R&D cost coefficient is high, it should consider subsidizing the manufacture based on its production volume of low-carbon products, and when the R&D cost coefficient is medium, the government should not subsidize the manufacture.
Proposition 2. The influence of different government subsidy methods on the production volume of the two products is:
(1) When
(2) When
Management implications: government subsidy will reduce the production volume of common products and increase the production volume of low-carbon products. If the government wants to encourage the manufacturer to increase the production volume of low-carbon products, when the R&D cost coefficient is high, it should consider subsidizing the manufacture based on the production volume of its low-carbon products, and when the R&D cost coefficient is medium, the government should consider subsidizing the manufacture based on its R&D cost.
Proposition 3. The influence of different subsidy methods on the emission reduction of unit low-carbon product and total emission reductions is as follows:
Proposition 4. The influence of different subsidy methods on the profits of manufactures and retailers is as follows:
(1)
(2) When
Management implications: when the government wants to increase the manufacturers incentive to reduce emissions, it should consider subsidizing the manufacture based on its production volume. If the government wants to increase the retailer’s sales incentive, when the R&D cost coefficient is medium, it should consider subsidizing the manufacture based on its R&D cost.
Proposition 5. The influence of different subsidy methods on the optimal solution of social welfare is:
(1) When
(2) When
Management implications: the size of social welfare under different government subsidy methods is related to the R&D cost coefficient. If the government wants to maximize social welfare, it should make a decision according to the R&D cost coefficient.
5 Example Analysis
In order to illustrate the validity of the model and verify the correctness of the conclusions and propositions, this study uses MATLAB to conduct an example analysis to compare the impact of different government subsidy methods and related parameters on the total emission reduction,

TABLE 2. Part of the corresponding value of the subsidy coefficient under the two government subsidy methods.
Figures 1A–C show the effects of changes in R&D subsidy coefficients,

FIGURE 1. Impact of different government subsidy methods on
It can be seen from Figures 1A–C that total emission reductions and profits of manufacturers and retailers are proportional to the government subsidy coefficient. It can be seen from Figure 1A that total emission reduction is the highest when the government subsidizes the manufacture based on its R&D cost, the second is when the government subsidizes the manufacture based on its production volume of low-carbon products, and the smallest when the subsidy is not adopted. Combined with Proposition 3, it can be seen that, when the government subsidizes the manufacture based on its R&D cost, the emission reduction of unit low-carbon products and total emission reductions are the highest. Therefore, when the government wants to increase emission reductions, it should consider subsidizing the manufacture based on its R&D costs.
It can be seen from Figure 1B that when the government subsidizes the manufactures according to their production volume of low-carbon products, the manufacturers’ profit is the highest, followed by subsidies based on R&D costs, and the smallest when the subsidy is not adopted. Combining with Figure 1A, we know that in the early stage of the manufacturers emission reduction R&D, the government should subsidize the manufacturer according to its production volume of low-carbon products, thereby increasing the enthusiasm of manufacturers. Also, in the late stage of the manufacturer’s emission reduction R&D, the government should subsidize the manufacture according to its R&D cost, and the total emission reduction can be maximized at this time.
It can be seen from Figure 1C that the retailer’s profit is the lowest when the government does not subsidize the manufacturer. When
5.1 Effects of Changes on
The effects of the sensitivity of consumers toward price difference and R&D cost coefficient on manufacturers total emission reductions, manufacturers profit, and retailer’s profit are shown in Figures 2A–C. The values of relevant parameters in the model are:
As can be seen from Figures 2A–C, with the increase of the sensitivity of consumers toward price difference and the decrease of the R&D cost coefficient, the total emission reductions, manufacturer’s profit, and retailer’s profit will increase.
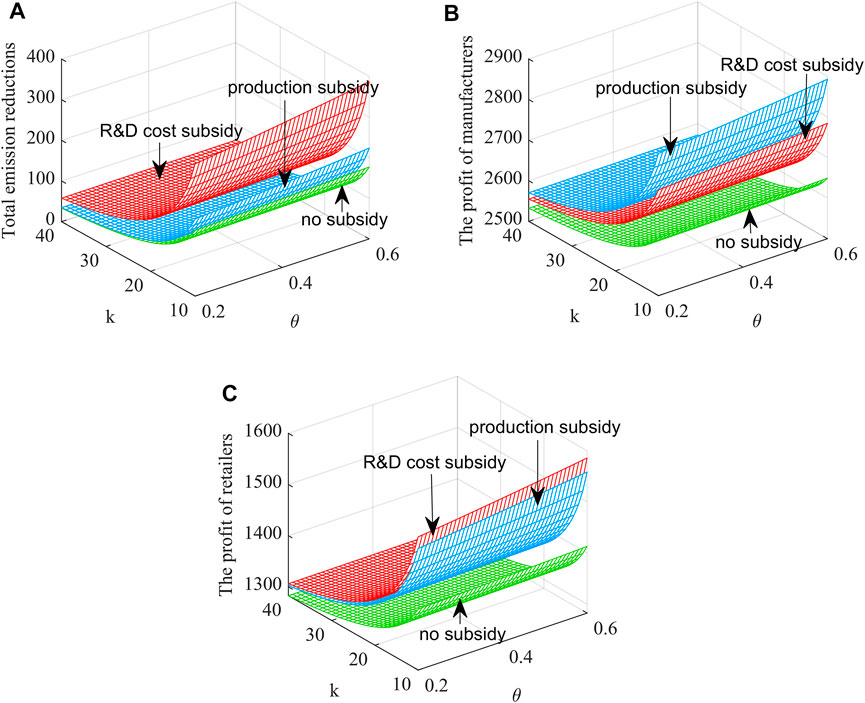
FIGURE 2. Effect of parameters
Management implications: first, the increase of the sensitivity of consumers toward price differences is reflected in the improvement of CEA; therefore, the government, manufacturers, and retailers should increase the promotion of low-carbon products. Second, the R&D level of the manufacturer determines its R&D cost coefficient, and as the manufacturer’s emission reduction technology matures, the R&D cost coefficient of the manufacture will decrease. In addition, the manufacturer can also consider outsourcing emission reduction production to professional emission reduction agencies, thereby reducing the cost for manufacturers to produce low-carbon products.
6 Conclusion and Management Implications
6.1 Conclusion
There are many studies on product substitutability and different government subsidy methods, but little literature considers the impact of different government subsidy methods on the decision-making of mixed manufacturers. Therefore, considering that manufacturers produce common products and low-carbon products at the same time and the two products are substituted, this study constructs a game model of low-carbon supply chain decision-making under three government subsidy methods and then discusses the influence of relevant coefficient on optimal decision-making, and the optimal decision-making of supply chain members under different government subsidy methods is also compared. Through theoretical analysis and example analysis, the results show that: 1) the wholesale price and retail price of common products under different government subsidy methods remain unchanged, but the government subsidy will reduce the sales volume of common products. 2) Government subsidy will not necessarily reduce the wholesale price and retail price of low-carbon products. When the R&D cost coefficient is high, the wholesale price and retail price of low-carbon products under the subsidy based on the R&D cost subsidy are the highest and the lowest under the subsidy based on the production volume of low-carbon products, and when the R&D cost coefficient is medium, the wholesale price and retail price of low-carbon products under the subsidy based on the R&D cost subsidy are the highest and the lowest when the subsidy is not adopted. 3) Government subsidy will increase the emission reduction of unit low-carbon products, total emission reductions, and the production volume of low-carbon products. The emission reduction of unit low-carbon product and total emission reduction are the highest when the government subsidizes the manufacture according to its R&D cost subsidy. When the R&D cost coefficient is high, the production volume of low-carbon products under the subsidy based on the manufacturer’s production volume is the highest, and when the R&D cost coefficient is medium, the production volume of low-carbon products under the subsidy based on the manufacturer’s R&D cost is the highest. 4) Government subsidy will increase manufacturers’ profit, and when the government subsidizes the manufacture according to its production volume of low-carbon products, the manufacturers profit is the largest. The size of retailers’ profit and social welfare under different government subsidy methods is related to the value of these parameters,
6.2 Management Implications
Our study has the following management implications for the government and manufacturers:
The practical implications of the research results for the government are as follows: first, if the government wants to promote consumers to buy low-carbon products, when the R&D cost coefficient is high, the government should consider subsidizing the manufactures based on their production volume of low-carbon products, and when the R&D cost coefficient is medium, the government should not subsidize.
Second, if the government wants to increase the production volume of low-carbon products, when the R&D cost coefficient is high, the government should consider subsidizing the manufactures based on their production volume of low-carbon products. When the R&D cost coefficient is medium, the government should consider subsidizing the manufactures based on their R&D cost.
Third, if the government wants to increase the emission reduction of unit low-carbon products and total emission reductions, it should consider subsidizing the manufactures based on their R&D cost.
Fourth, if the government wants to increase the enthusiasm of manufacturers for emission reduction R&D, it should consider subsidizing the manufactures based on their production volume of low-carbon products.
Finally, it can be found that there is a contradiction between the government’s goal of maximizing total emission reductions and the manufacturer’s goal of maximizing their own profits. In order to coordinate this contradiction, in the early stage of the manufacturers emission reduction R&D, the government should subsidize the manufactures based on their production volume of low-carbon products, thereby increasing the enthusiasm of the manufacturer for emission reduction R&D, and in the late stage of the manufacturers emission reduction R&D, the government should subsidize the manufactures based on their R&D cost.
The practical implications of the research results for manufacturers are as follows: first, the sensitivity of consumers toward price difference is proportional to the manufacturers profit, and the R&D cost coefficient is inversely proportional to the manufacturers profit. Therefore, manufacturers can increase CEA by promoting low-carbon products, thereby increasing the sensitivity of consumers toward price differences. Second, manufacturers can also strive to improve the maturity of emission reduction R&D technologies to reduce the R&D cost coefficient or outsource low-carbon links to professional energy-saving service companies to reduce R&D costs.
6.3 Limitations
However, this study only considers government subsidizing manufacturers; however, the government may also encourage manufacturers to reduce emissions by subsidizing retailers or consumers. In addition, the government can also consider issues such as the government’s participation in supply chain emission reductions by levying carbon taxes and implementing carbon trading. It is also possible to consider the cooperation of supply chain members to reduce emissions and coordinate the supply chain through contracts.
Data Availability Statement
The original contributions presented in the study are included in the article/Supplementary Material; further inquiries can be directed to the corresponding author.
Author Contributions
All authors listed have made a substantial, direct, and intellectual contribution to the work and approved it for publication.
Funding
The study is supported by the Graduate Practical Innovation Project of Jiangsu Province (SJCX21_0323), the National Social Science Foundation of China (21BGL181), and Humanities and Social Science Research General Project of the Ministry of Education (20YJA630006).
Conflict of Interest
The authors declare that the research was conducted in the absence of any commercial or financial relationships that could be construed as a potential conflict of interest.
Publisher’s Note
All claims expressed in this article are solely those of the authors and do not necessarily represent those of their affiliated organizations, or those of the publisher, the editors, and the reviewers. Any product that may be evaluated in this article, or claim that may be made by its manufacturer, is not guaranteed or endorsed by the publisher.
Acknowledgments
We would like to thank reviewers and the editor-in-charge for their valuable time on the article. Also, we are grateful to all the foundations that supported us.
Supplementary Material
The Supplementary Material for this article can be found online at: https://www.frontiersin.org/articles/10.3389/fenvs.2022.894659/full#supplementary-material
References
Bi, W. J., and Wu, H. L. (2018). Pricing Strategy and Inventory Decision for Alternative Products under Search Cost. Operations Res. Manag. Sci. 27 (08), 63–70. doi:10.12005/orms.2018.0182
Cao, D., Li, J., Liu, G., and Mei, R. (2021). Can Decentralization Drive Green Innovation? A Game Theoretical Analysis of Manufacturer Encroachment Selection with Consumer Green Awareness. Processes 9 (6), 990. doi:10.3390/pr9060990
Chen, K. B., Kong, Y. Q., and Lei, D. (2020). Pricing and Green Input Decisions of a Competitive Supply Chain with Consumers’ Product Preference and Different Channel Powers. Chin. J. Manag. Sci. 2020, 1924. doi:10.16381/j.cnki.issn1003-207x.2020.1924
Chen, K. B., and Wang, Y. Q. (2022). Channel Selection Strategy of the Green-Product Manufacturer under Different Forms of Government Subsidies. Chin. J. Manag. Sci. 2022, 1–14. doi:10.16381/j.cnki.issn1003-207x
Chen, T., Yang, F., and Guo, X. (2021). Optimal Bundling in a Distribution Channel in the Presence of Substitutability and Complementarity. Int. J. Prod. Res. 59 (4), 1145–1165. doi:10.1080/00207543.2020.1720930
Feng, Y., Wang, M. Y., Zhang, Y. Z., and Feng, C. H. (2022). The Government Subsidy Mechanism in a Green Supply Chain with the Manufacturer Assuming Social Responsibility. J. Industrial Engineering/Engineering Manag. 2022, 1–12. doi:10.13587/j.cnki.jieem
Giri, R. N., Mondal, S. K., and Maiti, M. (2016). Analysis of Pricing Decision for Substitutable and Complementary Products with a Common Retailer. Pac. Sci. Rev. A Nat. Sci. Eng. 18 (3), 190–202. doi:10.1016/j.psra.2016.09.012
Guo, Q., Liu, J., Ying, S. B., and Nei, J. J. (2018). Low-carbon Technology Choice on the Manufacture under Cap-And-Trade Policy. Industrial Eng. Manag. 23 (04), 45–52+61. doi:10.19495/j.cnki.1007-5429.2018.04.007
Hai, J. T., and Li, X. (2021). Government’s Optimal Subsidies during the Adoption of Green Products under Uncertain Demand. Chin. J. Manag. Sci. 29 (05), 180–189. doi:10.16381/j.cnki.issn1003-207x.2018.1258
Han, M. Y., Feng, L. Q., and Zhang, L. (2020). The Impact of Triple Competition in the Green Supply Chain on the Issuance of Substitutable Products. Chin. J. Manag. Sci. 2020, 0794. doi:10.16381/j.cnki.issn1003-207x.2020.0794
He, Y., Chen, Z. H., and Liao, N. (2019). The Impact Mechanism of Government Subsidy Approach on Manufacturer’s Decision-Making in Green Supply Chain. Chin. J. Manag. Sci. 2019, 1854. doi:10.16381/j.cnki.issn1003-207x.2019.1854
Hosseini-Motlagh, S.-M., Nematollahi, M., and Nouri, M. (2018). Coordination of Green Quality and Green Warranty Decisions in a Two-Echelon Competitive Supply Chain with Substitutable Products. J. Clean. Prod. 196, 961–984. doi:10.1016/j.jclepro.2018.06.123
Li, Y. D., Xia, L. J., and Wang, F. Z. (2019). Game and Coordination Model for Low-Carbon Supply Chain with Product Substitution. Chin. J. Manag. Sci. 27 (10), 66–76. doi:10.16381/j.cnki.issn1003-207x.2019.10.007
Liu, H., Kou, X., Xu, G., Qiu, X., and Liu, H. (2021). Which Emission Reduction Mode Is the Best under the Carbon Cap-And-Trade Mechanism? J. Clean. Prod. 314, 128053. doi:10.1016/j.jclepro.2021.128053
Liu, M. W., Zhao, W. P., and Liao, A. L. (2018). Pricing Decision-Making of Supply Chain Alliance Considering Heterogeneous Consumers. Industrial Eng. Manag. 23 (04), 73–80. doi:10.19495/j.cnki.1007-5429.2018.04.010
Liu, Z., Anderson, T. D., and Cruz, J. M. (2012). Consumer Environmental Awareness and Competition in Two-Stage Supply Chains. Eur. J. Operational Res. 218 (3), 602–613. doi:10.1016/j.ejor.2011.11.027
Meng, Q., Wang, Y., Zhang, Z., and He, Y. (2021). Supply Chain Green Innovation Subsidy Strategy Considering Consumer Heterogeneity. J. Clean. Prod. 281, 125199. doi:10.1016/j.jclepro.2020.125199
Mishra, U., Wu, J.-Z., and Sarkar, B. (2021). Optimum Sustainable Inventory Management with Backorder and Deterioration under Controllable Carbon Emissions. J. Clean. Prod. 279, 123699. doi:10.1016/j.jclepro.2020.123699
Nielsen, I. E., Majumder, S., Sana, S. S., and Saha, S. (2019). Comparative Analysis of Government Incentives and Game Structures on Single and Two-Period Green Supply Chain. J. Clean. Prod. 235, 1371–1398. doi:10.1016/j.jclepro.2019.06.168
Qin, J. J., and Li, J. (2021). Manufacturer’s Production Strategies for Two Substitutable Products under Capital Constraints and Cap-And-Trade Regulation of Carbon Emissions. Operations Res. Manag. Sci. 30 (05), 88–94. doi:10.12005/orms.2021.0149
Sun, H., Samuel, C. A., Kofi Amissah, J. C., Taghizadeh-Hesary, F., and Mensah, I. A. (2020). Non-linear Nexus between CO2 Emissions and Economic Growth: a Comparison of OECD and B&R Countries. Energy 212, 118637. doi:10.1016/j.energy.2020.118637
Wang, D. P., Li, X. Y., and Zhao, L. (2018). Study on the Coordination of Supply Chain Based on Carbon Emissions Trading Considering the Manufactures’ Competition. Operations Res. Manag. Sci. 27 (04), 62–71. doi:10.12005/orms.2018.0086
Wang, J., and Wang, C. X. (2015). Supply Chain’s Pricing and the Level of Environmental Protection Decision-Making with Substitutable Products[J]. Industrial Eng. Manag. 20 (06), 61–68+75. doi:10.19495/j.cnki.1007-5429.2015.06.010
Wang, Y. (2017). Pricing and Warranty Decisions of Substitutable Products for a Fuzzy Two-Echelon Supply Chain. Discrete Dyn. Nat. Soc. 2017, 1–12. doi:10.1155/2017/8476516
Wen, X. Q., Cheng, H. F., Cai, J. H., and Lu, C. (2018). Government Subside Policies and Effect Analysis in Green Supply Chain. Chin. J. Manag. 15 (04), 625–632. doi:10.3969/j.issn.1672-884x.2018.04.017
Xia, X. Q., and Cao, Y. (2020). Studying on the Impact of Government Subsidies on Manufacture/remanufacture Based on Outsourcing Remanufacturing. Syst. Engineering-Theory Pract. 40 (07), 1780–1791. doi:10.12011/1000-6788-2019-0038-12
Xiong, Y. Q., Li, X. L., and Huang, T. T. (2020). Research on New Energy Vehicle Manufactures Pricing Decision Basis for Different Subsidy Bodies. Chin. J. Manag. Sci. 28 (08), 139–147. doi:10.16381/j.cnki.issn1003-207x.2020.08.012
Xu, C. Q., Zhao, D. Z., and Yuan, B. Y. (2014). Products Differential Pricing and Supply Chain Coordination Mechanism under the Government Subsidy Policy. Syst. Eng. 32 (03), 78–86.
Yang, D.-x., Qiu, L.-s., Yan, J.-j., Chen, Z.-y., and Jiang, M. (2019). The Government Regulation and Market Behavior of the New Energy Automotive Industry. J. Clean. Prod. 210, 1281–1288. doi:10.1016/j.jclepro.2018.11.124
Zhang, L., Wang, J., and You, J. (2015). Consumer Environmental Awareness and Channel Coordination with Two Substitutable Products. Eur. J. Operational Res. 241 (1), 63–73. doi:10.1016/j.ejor.2014.07.043
Keywords: low-carbon supply chain, emission reduction, product substitution, government subsidy methods, Stackelberg game theory
Citation: Zhan M, Chen Y and Liu Y (2022) Emission Reduction Strategies of a Low-Carbon Supply Chain Considering Product Substitution and Government Subsidy. Front. Environ. Sci. 10:894659. doi: 10.3389/fenvs.2022.894659
Received: 22 March 2022; Accepted: 09 May 2022;
Published: 24 June 2022.
Edited by:
Faik Bilgili, Erciyes University, TurkeyReviewed by:
Subrata Saha, Aalborg University, DenmarkMehmet Akif Destek, University of Gaziantep, Turkey
Huaping Sun, Jiangsu University, China
Copyright © 2022 Zhan, Chen and Liu. This is an open-access article distributed under the terms of the Creative Commons Attribution License (CC BY). The use, distribution or reproduction in other forums is permitted, provided the original author(s) and the copyright owner(s) are credited and that the original publication in this journal is cited, in accordance with accepted academic practice. No use, distribution or reproduction is permitted which does not comply with these terms.
*Correspondence: Yan Chen, c2FuY2hlbjAwN0AxNjMuY29t