 Jie Wang
 Dongwei Liu
 Xijie Xu5
94% of researchers rate our articles as excellent or good
Learn more about the work of our research integrity team to safeguard the quality of each article we publish.
Find out more
ORIGINAL RESEARCH article
Front. Environ. Sci., 31 August 2022
Sec. Atmosphere and Climate
Volume 10 - 2022 | https://doi.org/10.3389/fenvs.2022.893437
This article is part of the Research TopicAir Pollution Remote Sensing and the Subsequent Interactions with Ecology on Regional ScalesView all 31 articles
The central region of Inner Mongolia is the northern ecological safety barrier of Beijing and even the whole country. It is one of the main sources of dust in North China, and air pollution control is the top priority in this region. In this study, the central region of Inner Mongolia was selected as the study area, multiple auxiliary variables were used to estimate the spatial distribution of PM2.5 concentration from 2016 to 2018 by geographically weighted regression, and the socioeconomic determinants of PM2.5 concentration were analyzed by geographic detectors. The results show that: 1) the established model can better estimate the spatial distribution of PM2.5 concentration in the study area, and the monthly mean correlation coefficient R of the verification parameters is stable, ranging from 0.58 to 0.66. 2) PM2.5 concentration in central Inner Mongolia showed significant temporal and spatial variation. The mean annual PM2.5 concentration along the Yellow River basin is the highest in the study area. PM2.5 concentration first increased and then decreased from 2016 to 2018. 3) Urban built-up area, permanent population and per capita GDP are the key factors affecting the spatial and temporal distribution of PM2.5 concentration in the study area. The results of this study provide theoretical basis and technical support for air pollution monitoring, management and prevention in central Inner Mongolia.
With the rapid development of global economy, the progress of urbanization and industrialization has accelerated, people’s living standards have improved. The consumption of coal and electricity have increased (Xiao et al., 2015), and the demand for sand, steel, etc. Required in the process of urban construction has increased (Wu et al., 2015). The extensive development of industry and the substantial increase in pollutant emissions have directly or indirectly brought about an important impact on atmospheric pollution (Miao Zhang et al., 2021). At the same time, air pollution has a greater impact on the ecological environment (Yan, 2012), climate change (Sui, 2019) and human health (Guan et al., 2016), and it has become a global focus of attention.
Air pollution refers to the phenomenon that the concentration of pollutants in the atmosphere reaches a harmful level, even destroying the conditions for the normal survival and development of the ecosystem and human beings, and causing harm to people and objects (Bai et al., 2018). Suspended Particulate Matter is an important source of air pollution (Meng et al., 2019; Kong et al., 2020). Fine Particulate Matter (PM2.5, Particulate Matter, PM) is the Particulate with aerodynamic equivalent diameter less than or equal to 2.5 microns in ambient air (Vo et al., 2020), and is also an important component of suspended Particulate Matter (Yang and Jiang, 2020). From the perspective of research methods, scholars from various countries made a thorough analysis of air pollution, which has laid a relatively solid theoretical foundation. In 1969, Ken Whitby, an American scientist, conducted the first study on PM2.5 (Whitby et al., 1972). In 1970, the United States enacted and implemented the Clean Air Act, establishing an air pollution control system (Domenici, 1979). In 1984, the European Community established the EMEP (European Monitoring and Evaluation Program) (Tørseth et al., 2012), and in 1987, the European Union issued an air pollution restriction order to control the discharge of relevant pollutants (McNaughton, 2018). In 1997, The US National Environmental Protection Agency proposed a relatively accurate concentration standard value based on particulate matter, and a higher standard was proposed in 2013 (Esworthy, 2014). Juliette et al. (2008) mainly explored the connection between PM10 and meteorological factors, and studied the relationship between the concentration of PM10, O3, NOX and SO2 and the spatial change by using the environmental data detected by the weather station for a trade port. For the study of air pollution in typical regions, scholars from various countries have conducted research and analysis to different degrees for regions with different geographical and social environments. Liu et al. (2020) studied on the environmental air quality of 366 cities in China showed that China’s air pollution is mainly PM10 and PM2.5. The high value of PM10 is mainly concentrated in Xinjiang and greatly influenced by natural factors. The high value of PM2.5 is mainly distributed in central China, North China and northern Jiangsu and is more influenced by human activities. Wang et al. (2019) studied the change characteristics of PM2.5 in the Beijing-Tianjin-Hebei region from 2013 to 2018. They found that PM2.5 pollution in the Beijing-Tianjin-Hebei plain showed a more significant change than that in the mountainous region. PM2.5 mass concentration was the highest in winter and the lowest in summer, and its spatial distribution was high in the south and low in the north. Zhou et al. (2019) found that air quality is closely related to the synoptic circulation and local wind field affecting a specific area, and conducted a validation analysis in Shanghai, China. They found that the Shanghai area is most prone to severe haze under specific circulation patterns (CT1, CT2, and CT4), mainly related to cold air activity and the displacement of the high pressure system relative to Shanghai (Zhao et al., 2019). At present, there are few studies in arid and semi-arid regions dominated by dust pollution, and in China it is mainly concentrated in the northwest regions (Haijun et al., 2020; Rupakheti et al., 2021). Understanding the characteristics of air pollution is the basis for scientific decision-making and comprehensive management of air pollution control.
Scientific identification of spatial heterogeneity and driving factors of PM2.5 concentration is of great significance to regional air linkage governance and has become the focus of various disciplines. Current research methods can be divided into the following six categories: 1) Using the statistical yearbook data of a certain region, combined with the data of the meteorological department and the environmental protection department, the results are obtained by integrated analysis. 2) Through a combination of questionnaires and interviews, the awareness and specific opinions of residents on urban air pollution are obtained. 3) Specific models are used to obtain information on major urban pollution sources, such as AOD (Aerosol optical thickness) remote sensing model, super-efficiency DEA (Data envelopment analysis) model, DOAS (Differential Optical Absorption Spectroscopy) technology, TDLAS (Tunable Diode Laser Absorption Spectroscopy) technology, ground-based multi-axis differential absorption spectrometer (MAX-DOAS), weather research and prediction model chemical module WRF-Chem (Zhang and Li, 2020). 4) the specific relationship between urbanization level and air pollution in multiple cities is comparatively analyzed by selecting urbanization indicators and specific pollutant information of multiple cities. 5) Comparing and analyzing the differences and contents of pollutants in different economic zones by selecting specific locations and monitoring them at fixed points. 6) Through the magnetic and heavy metal monitoring of the samples, the specific association between the samples and air pollutants is found. The most common used model of these is remote sensing model, which uses Aerosol Optical Depth (AOD) data from satellite remote sensing to evaluate the PM2.5 concentration in a wide range. In remote sensing models, commonly used inversion models include semi-empirical Model (Yuan Wei et al., 2021), Artificial Neural Network (ANN) Model (Casallas et al., 2021), Machine Learning Algorithm Model (Jain et al., 2021), Generalized Additive Model (GAM) (Analitis et al., 2020), General Linear Regression Model (Xin Zhang et al., 2021), Geographically Weighted Regression (GWR) model (Song et al., 2014), remote sensing formula (Lin et al., 2015), statistical downscaling method (Qian Yang et al., 2020), Geographically and Temporally Weighted Regression (GTWR) model (Wei et al., 2019), etc. In recent years, the GTWR model has become increasingly popular in environmental research because the model can incorporate temporal information into spatial variability (He and Huang, 2018a; Mirzaei et al., 2019; Liu et al., 2021). However, when GTWR lacks sample points in time and region, the accuracy of the model needs to be optimized (He and Huang, 2018b). GWR is a technique to test spatial variability and non-stationarity by generating local regression results, which is suitable for PM2.5 prediction at regional scale (Hu et al., 2013). Therefore, the GWR model was selected for PM2.5 estimation in this study.
The central region of Inner Mongolia includes Ordos, Hohhot, Bayannur, Ulanqab and Baotou. They are located in the traffic arteries of China’s western development. Their terrain is flat, and the land resources are relatively rich. In addition, the region has a strong economic foundation, certain technological innovation capabilities and good development potential (Liu, 2002). However, the central region of Inner Mongolia is one of the largest coal chemical bases in China, and its air quality has been greatly affected. Therefore, how to better improve the air quality of Inner Mongolia’s central cities while ensuring the supply of energy in the Beijing-Tianjin-Hebei region has become the primary problem to be solved in the protection of atmospheric environment in this region (Qiu et al., 2017; Gao et al., 2021). And it is also the key problem of air pollution prevention and control in the region in the future.
In this paper, the central region of Inner Mongolia was selected as the study area, and the factor with the greatest monthly correlation with PM2.5 from 2016 to 2018 was selected from multiple factors to establish a GWR model and invert the spatial distribution data of PM2.5 from 2016 to 2018. In this study, the spatial and temporal distribution characteristics of PM2.5 in central cities of Inner Mongolia were analyzed from different time scales, such as space, year, season and month, and the impact of economic development, urbanization, industrialization and energy on PM2.5 was analyzed. The results of this paper provide a theoretical basis for air pollution monitoring, management and prevention in central Inner Mongolia.
The central region of Inner Mongolia belongs to the Yin Mountains, located on the northern slope of Daqing Mountain in Inner Mongolia, 105°12′–114°49′E, 37°37′–43°23′N, including Ordos, Hohhot, Bayannur, Ulanqab and Baotou. (Figure 1A). The Inner Mongolia Autonomous Region is the northern ecological security barrier for Beijing and even the whole country. The central part of Inner Mongolia is 804–2345 m above sea level, the terrain is low in the middle part and high in the north and south (Figure 1B). The south is dominated by low mountains, the middle is dominated by low hills and tidal wetlands, and the north is dominated by grasslands (Figure 1C). The study area belongs to a continental monsoon arid climate with large temperature changes. The highest temperature in the past 20 years reaches 39°C, the lowest temperature in the past 20 years is −41°C, and the wind is mostly above six levels. The maximum annual temperature difference can reach 70–80°C, and the annual mean temperature is about 4°C. Since 1999, the annual precipitation has been 200–360 mm, and the evaporation has been 7–8 times of the precipitation. Sand and deserts are distributed in the study area, which is one of the main sources of sand and dust in North China and one of the chief culprits of sand and dust weather in the surrounding areas of Beijing (Yang et al., 2021).
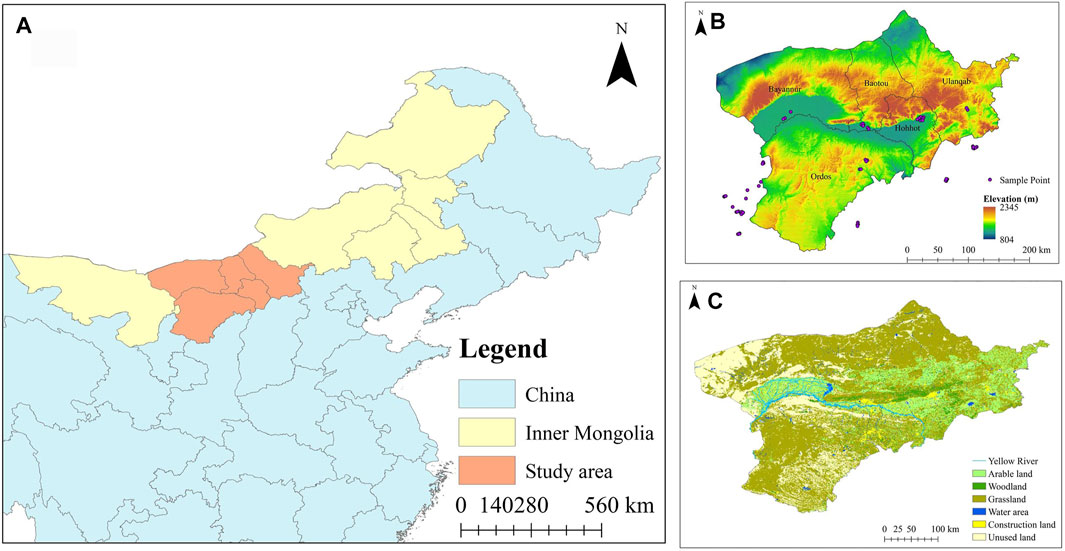
FIGURE 1. (A) Geographical location of the study area; (B) Surface elevation and PM2.5 monitoring stations in the study area; (C) Land use types in the study area.
The central region of Inner Mongolia is the region with the highest regional economy in the Inner Mongolia Autonomous Region. Among them, the economic development speed of Ordos has ranked first in the Inner Mongolia Autonomous Region (Guo and Wu, 2011). The central part of Inner Mongolia is one of the largest coal chemical industrial bases in China. In the region, the heating fuel is mainly coal, and the transportation fuel is mainly gasoline. Combustion of these two fuels produces a large amount of air pollution emissions. The heating period in central Inner Mongolia is mainly in winter and spring (Bai et al., 2010). Coal-fired heating has greatly increased the frequency of use of coal-fired power plants and thermal power plants, resulting in more air pollutants (Khuzestani et al., 2017). In addition, the number of private motor vehicles in central Inner Mongolia is higher than that in other areas of Inner Mongolia, and air pollution caused by vehicle exhaust is also worthy of attention (Liu et al., 2022). The air pollutant considered in this study is the PM2.5.
In 2013, the State Council of China issued the Air Pollution Prevention and Control Action Plan, focusing on strengthening the prevention and control of air pollution with a focus on fine particulate matter (PM2.5). In 2018, the air pollution prevention and control plan was successfully concluded by the Inner Mongolia Autonomous Region, and the Inner Mongolia Autonomous Region successfully completed various national goals and tasks. Therefore, the research time interval of this paper is in the 2016–2018 years of the completion plan.
The air pollutants considered in this study are mainly PM2.5. The PM2.5 monitoring station data comes from the China National Environmental Monitoring Center (http://www.cnemc.cn). The data format is the mean daily PM2.5 concentration value, the concentration unit is μg/m3, and the selected time range is 1 January 2016 to 31 December 2018. PM2.5 concentration data quality in line with China ambient air quality standards (Wang et al., 2010).
There are a total of 75 monitoring stations around the selected study area, and the distribution of the stations is shown in Figure 1B. In this study, the PM2.5 concentration value was used as the model dependent variable. In order to reduce the model error, the value of PM2.5 less than 2 μg/m3 was discarded, and the stations with measurement days less than 10 days were also excluded. The monthly mean PM2.5 concentration value is calculated by calculating the monthly mean value from the daily mean PM2.5 concentration value of each station. Since the distribution of stations is too concentrated, 50 stations are randomly selected to build the PM2.5 estimation model, and the remaining 25 points are used for model accuracy verification.
MODIS AOD data is a level 2 aerosol product released by NASA, which can be used to obtain atmospheric aerosol optical properties (such as optical thickness and size distribution) and mass concentration in the global ocean and terrestrial environment. In order to obtain higher spatial resolution PM2.5 pollution inversion results, we use MODIS Collection 061 3 km (cross-border time 10:30 and 13:30 Beijing time) aerosol data (https://ladsweb.modaps. eosdis. nasa.gov/), select daily AOD data with a resolution of 3 km from January 2016 to December 2018, and use the layer name: Optical_Depth_Land_And_Ocean (AOT at 0.55 micron for both ocean (Mean) (Quality Flag) = 1, 2, 3) and land (corrected) (Quality Flag = 3)).
In this study, ENVI 5.3 was used to organize and calculate the monthly mean AOD data of MODIS AOD.
We used the ERA-Interim (ECMWF Re-Analysis) reanalysis data (http://apps.ecmwf.int/datasets/) of the European Center for Medium-Range Weather Forecast (ECMWF) as the meteorological data. Its spatial resolution is 0.125° and its temporal resolution is Monthly Means of Daily Means. We selected a total of five meteorological factors in the Surface variable and Pressure levels variable: relative humidity (RH, %) under 1000 h Pa, temperature of 2 m (T2m, K), wind speed of 10 m (WS10, m/s), surface pressure (SP, Pa), boundary layer height (BLH, m).
Due to the inconsistency of statistical indicators in various cities and incomplete data in some cities, the acquisition of data is subject to certain restrictions. Based on the overall integrity and availability of data, considering economic development, urbanization, industrialization, etc., the urban built-up area (km2), permanent population (10,000 people), and the proportion of the secondary industry in the regional GDP (%), GDP per capita (yuan), number of industrial enterprises above designated size (unit), annual gas supply (natural gas, 104m3) and heat supply (water, 104 GJ) are selected as independent variables to make the spatial relationship model between PM2.5 and socioeconomic factors. Influencing factor index data comes from the “2017–2019 Inner Mongolia Statistical Yearbook” published by the Inner Mongolia Bureau of Statistics (http://tj.nmg.gov.cn/tjyw/jpsj/). The 2017 Statistical Yearbook is actually an overview of 2016 in 2017. Similarly, the 2018 and 2019 Statistical Yearbooks represent the values of Inner Mongolia statistical data in 2017 and 2018, respectively.
In order to improve the accuracy of PM2.5 estimation, NDVI (Normalized Difference Vegetation Index) and DEM (Digital elevation model) are selected to provide reference for the research. The NDVI data comes from MODIS 3 level 1 km monthly NDVI data (https://ladsweb.modaps.eosdis.nasa.gov/). DEM data is selected from ASTGTM: ASTER Global Digital Elevation Model V002, with a resolution of 30 m (https://search.earthdata.nasa.gov/). All the above data can be sorted into Table 1.
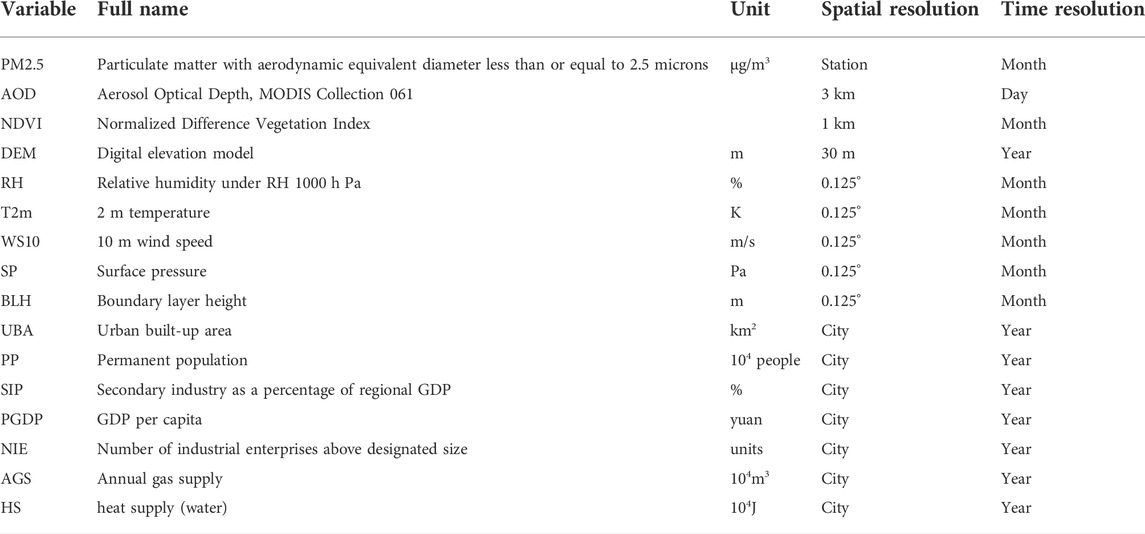
TABLE 1. Description of all data used in this study.
In order to estimate the monthly PM2.5 data with a spatial resolution of 3 × 3 km, the data of different spatial sizes and time scales need to be processed uniformly, data integration, and uniform resolution. The IDL software is used to resample the meteorological factors with reference to the pixel size of the fused MODIS 3 km AOD data. The DEM data first uses the Arc GIS “mosaic” and “mask” tools to make the DEM coincide with the study area, and then uses ArcGIS 10.3 to downscale the DEM and NDVI data to 3 km.
Previous studies have shown that the relationship between PM2.5 and AOD will change differently with the change of geographical space, and there is spatial dependence and spatial non-stationary between PM2.5 and AOD. For this local variation GWR model, local variable parameters can be more accurately used to reflect the spatial variation and difference, and a continuous parameter value surface is generated (Engel-Cox et al., 2004; Hu et al., 2013). GWR is a regression model for testing continuous surface spatial variation and non-stationary problems of regression parameter values on a regional scale (Wang et al., 2020). Although AOD is the most significant indicator of PM2.5 concentration, PM2.5 concentration is also significantly affected by temperature, precipitation and other climatic factors (Lv and Li, 2018). AOD, RH, T2m, WS10, BLH, SP, DEM, and NDVI were used as auxiliary variables to estimate the spatial distribution of PM2.5 concentration.
Based on the significant spatial difference between PM2.5 and auxiliary variables, GWR was selected to test the variation and non-stationarity of continuous surface of parameter values. Due to the serious loss of AOD daily data, in order to reduce the model error and improve the accuracy, this paper constructed the model on the monthly scale. The basic form of the model is shown in Eq. 1:
Where, PM2.5im (μg/m3) is the PM2.5 concentration value of the i grid cell in the m month; AODim (without unit) is the i grid cell of AOD in the m month, T2mim, WS10im, RHim, BLHim, SPim are the values of the i grid cell in the m month corresponding to other auxiliary variables; β0,im represents the intercept of the i grid cell in the m-month, β1,im, β2,im, β3,im, β4,im, β5,im, β6,im, β7,im, and β8,im are the regression coefficients of the corresponding variable of the i grid cell in the m month, εim is the random error of the I grid cell in the m month. The model is a local model, and the coefficients of the model will vary with the time and geographic location of the sample point.
Regarding the temporal heterogeneity relationship between PM2.5 and auxiliary variables, the auxiliary variables of the model are selected according to the following criteria: 1) the selected auxiliary variables are significantly related to PM2.5; 2) the selected auxiliary variables improve the model’s inversion of PM2.5 spatiotemporal variation. In other words, under the influence of the temporal and spatial heterogeneity of PM2.5, the auxiliary variables used in the monthly GWR model are different, and the models constructed are also different.
In the process of model construction, the self-adaptive Gauss function is used to create the core surface according to the density of the relevant element distribution (Utari et al., 2019), and the cross-validation method proposed by Cleveland in 1979 is used (Zhai et al., 2018).
In order to test the accuracy of PM2.5 estimation, the error between the actual observation value and the estimated value of the effective PM2.5 stations used for verification is used to judge the pros and cons of the model. The test indicators used are correlation coefficient (R), residuals (RD) and root mean square error (RMSE). R is used to measure the degree of agreement between the measured value and the estimated value, and the calculation method is shown in Eq. 2 (Machin et al., 2018). The closer the statistic is to 1, the higher the accuracy of the model result and the better the agreement between the measured value and the estimated value. RMSE is used to measure the deviation between the observed value and the true value, reflecting the estimation sensitivity and extreme value of sample data (Joseph and Agustí, 2021). The smaller the value of RMSE, the higher the accuracy of PM2.5 estimation. The calculation method is shown in Eq. 4.
Where, Ysi is the i of PM2.5 estimated value, Yoi is the i of PM2.5 measured value;
Geographic detector is a new statistical method for detecting spatial differentiation and revealing the driving factors behind it (Wang and Xu, 2017). The basic idea is: assuming that the study area is divided into several sub-regions, if the sum of the variances of the sub-regions is less than the total area variance, there is spatial differentiation; if the spatial distribution of the two variables tends to be the same, there is a statistical correlation between the two. There are four sub-detectors in the geographic detector. This article analyzes the results of factor detectors. Factor detector explore the spatial differentiation of Y, and detect the degree of interpretation of the factor X to the spatial differentiation of Y (Wang and Xu, 2017). Measured by the q value, the expression is:
Where, h = 1, 2, 3… L is the stratification of variable Y or factor X. There are seven types of variables in this article; Nh and N are the number of units in the whole domain and a certain layer, respectively. In this article, they represent central Inner Mongolia total number of units and the number of units in each type of prefecture-level city; and are the variances of the Y values of layer h and the whole region, respectively.
In order to analyze the seasonal effects of socioeconomic factors on PM2.5, a year was divided into four seasons. The classification criteria are: spring from March to 359 May, summer from June to August, autumn from September to November, and winter from December 360 to January and February of the following year.
The correlation matrix between different explanatory variables and PM2.5 from January to December in central Inner Mongolia from 2016 to 2018 is shown in Table 2. It can be observed that the variable with the highest correlation coefficient with PM2.5 is T2m, followed by RH, and NDVI has the lowest correlation coefficient. In addition, we found that although the monthly mean correlations of AOD, WS10 and BLH with PM2.5 were not high; in some months, their correlations also had significant advantages over other variables. For example, in August, the correlation coefficient of AOD reached 0.655, and that of WS10 reached 0.726, which was significantly higher than other variables in the same month; in June and October, the correlation coefficient of BLH reached 0.565 and 0.574, respectively. Therefore, for the explanatory variables of the GWR model in central Inner Mongolia, we choose T2m, RH, AOD, WS10, and BLH.
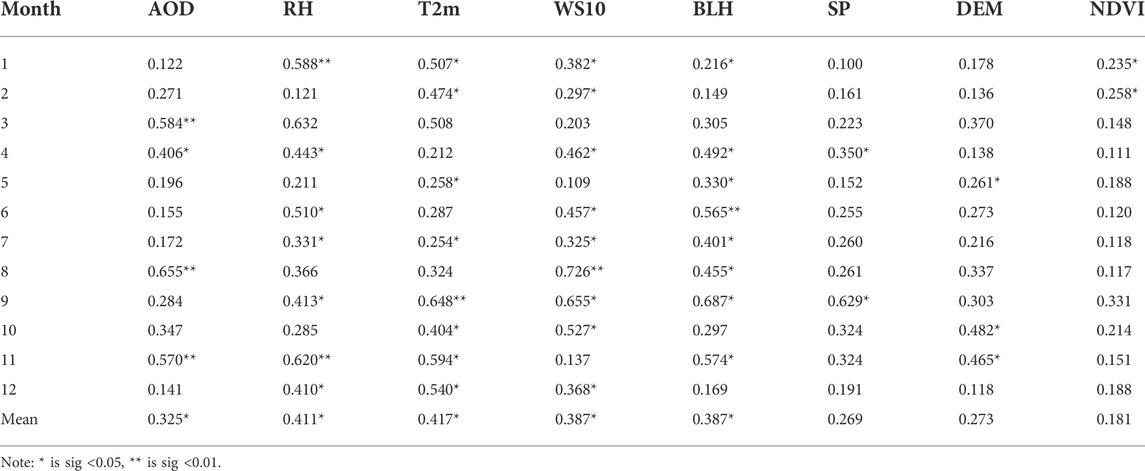
TABLE 2. Unsigned correlation matrix between different explanatory variables and PM2.5 from January to December.
The global mean fit (R2) of the 12 GWRs in central Inner Mongolia from January to December 2016–2020 constructed in this study is shown in Figure 2. It can be found from the figure that 1) throughout the study period, the global mean build R2 of GWR was higher than 0.40, with the highest value reaching 0.71. In other words, the GWR model constructed in this study has a high degree of fit. 2) The fit of the model from May to July was generally inferior to other models, indicating that the explanatory variables of PM2.5 concentration in these months were complex and affected by multiple factors. The model fitting R2 of August, September, and November is higher than that of other months, indicating that the model has fully considered the main explanatory variables of PM2.5 concentration in that month, so the fitting degree is higher, which makes the results more believable.
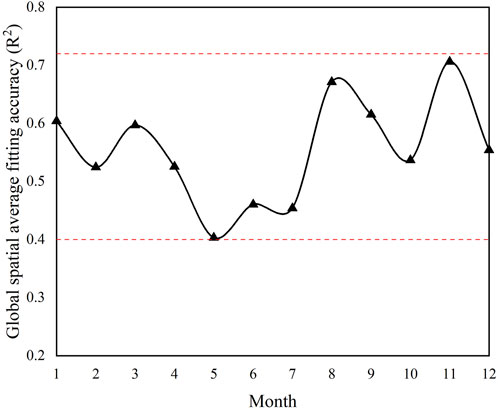
FIGURE 2. The average fitting accuracy of the models in the study area from 2016 to 2018.
The verification data is used to verify the accuracy of the PM2.5 inversion results in the study area. The verification diagram is shown in Figure 3. From the figure, we can find: 1) The change of the monthly mean correlation coefficient R in the verification parameters in 2016–2018 is relatively stable, between 0.58–0.66; 2) The monthly mean correlation coefficients R from August to December and January to March in the 3 years are extremely stable, and fluctuate greatly from April to July. Therefore, it is predicted that the spatial heterogeneity of the simulation results from April to July is relatively large. 3) The monthly mean RMSE of the verification parameters fluctuated greatly from 2016 to 2018, from 4.0 to 15.0; 4) The RMSE of September to December and January of the following year fluctuated little in the 3 years, and the RMSE from February to July fluctuates greatly, which is similar to the rule of (2). Therefore, it is guessed that the spatial heterogeneity of the PM2.5 concentration simulation results from February to July is relatively large.
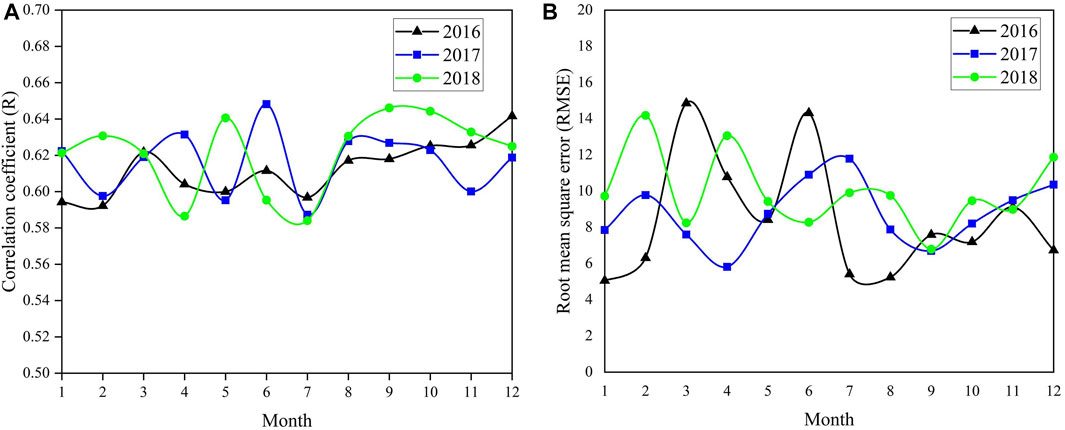
FIGURE 3. Model accuracy verification results in the study area: (A) Monthly average correlation coefficient between measured data and inverted data; (B) Monthly average root mean square error of measured data and inverted data (μg/m3).
The comparison between the measured value and the predicted value of the verification point is shown in Supplementary Appendix Figure S1. From the figure we can find that all verification points are evenly distributed on both sides of the dotted axis (y = x). Our model validation results are good. Supplementary Appendix Figure S2 shows the residual probability distribution. The validation residuals for all months were normally distributed. The constructed model conforms to statistical laws. In addition, the residual probability distribution in July-October is more compact. Combining Supplementary Appendix Figure S1 and Figure 3B, we find that the comprehensive RMSE of July-October is also smaller, and the verification points are more concentrated. It shows that the model adaptability from July to October is better.
The distribution of monthly PM2.5 patterns estimated by the GWR model is presented in a later chapter. We superimposed the PM2.5 data in different months from 2016 to 2018 to calculate the annual mean, and obtained the spatial distribution pattern of the annual mean PM2.5 concentration in the study area from 2016 to 2018 (Figure 4). The annual mean PM2.5 distribution map can more directly observe the spatial distribution law. It can be found from Figure 4 that the spatial distribution pattern of the annual mean concentration of PM2.5 from 2016 to 2018 is basically the same, with obvious spatial differentiation. The 3-years mean PM2.5 concentration in the study area fluctuated between 5 and 30 μg/m3. Comparing the ground elevation and land use in the study area (Figures 1B,C), the spatial distribution of PM2.5 concentration in the study area is similar to the distribution of ground elevation and land use. Combining the land use and ground elevation of the study area, we found that: 1) Ground elevation was negatively correlated with the annual mean PM2.5 concentration. The higher the ground elevation, the lower the PM2.5 concentration. 2) The distribution of annual mean PM2.5 concentration also has a certain correlation with the distribution of land use types. The area above the lake is the place with the lowest PM2.5 concentration in the entire study area; secondly, the annual mean PM2 above the cultivated land far away from the tributaries of the Yellow River. The concentration of PM2.5 is also low; the annual mean PM2.5 concentration over the unused land is the highest.
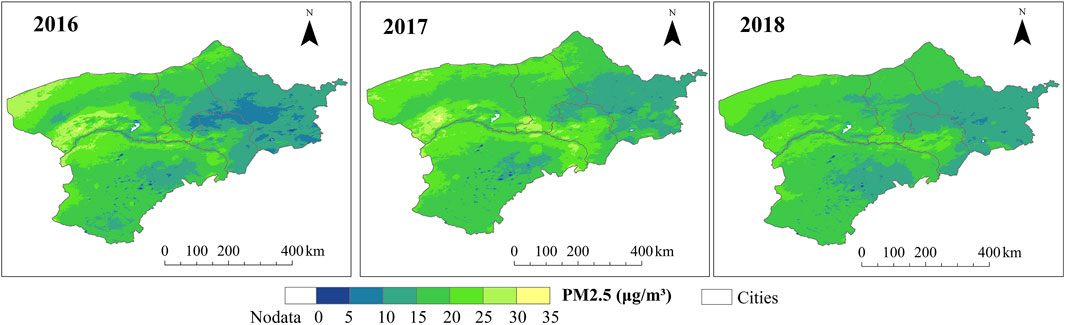
FIGURE 4. The spatial distribution of the average annual PM2.5 concentration in the study area from 2016 to 2018.
In addition, we can observe from Figure 4: 1) From 2016 to 2018, the central and southern parts of Ulanqab, the northeastern end of Hohhot, and the southeastern end of Baotou were the lowest in the study area (central Inner Mongolia). 2) The annual mean PM2.5 concentration along the Yellow River Basin in Bayannur is the highest in the study area. 3) The mean annual PM2.5 along the Yellow River Basin in the northern section of Ordos is also high. 4) On the whole, the mean annual PM2.5 concentration of central Inner Mongolia from 2016 to 2018 was the lowest in the east, increasing in order to the west, lower in the south, and gradually increasing to the northwest.
Table 3 describes the statistical characteristics of the annual mean PM2.5 concentration in the study area from 2016 to 2018. It can be directly observed from the table that 1) Bayannur is the city with the highest annual mean concentration of PM2.5 in central Inner Mongolia, followed by Ordos and Baotou. Hohhot has a lower annual PM2.5 concentration, and Ulanqab has the lowest annual PM2.5 concentration. Most cities exceed the China national mean PM2.5 level 1 standard [(GB3095-2012) “Ambient Air Quality Standard” (Wang et al., 2010), the annual mean PM2.5 concentration limit is 15 μg/m3 at level 1 and 35 μg/m3 at level 2]. The mean annual PM2.5 concentration in all cities is greater than the health standard recommended by the World Health Organization (WHO Air Quality Guidelines), that is, the mean annual PM2.5 concentration is 5 μg/m3 (Ouyang et al., 2022). 2) The mean annual concentration of PM2.5 in the study area in 2016 was 17.03 μg/m3, the mean annual concentration of PM2.5 in the study area in 2017 was 18.42 μg/m3, and the mean annual concentration of PM2.5 in the study area in 2018 was 16.30 μg/m3. In the 3 years from 2016 to 2018, the overall concentration value in 2017 was also the highest. 3) From 2016 to 2018, it generally increased first and then decreased. Except for Bayannur, which has been declining, other cities also increased first and then decreased.
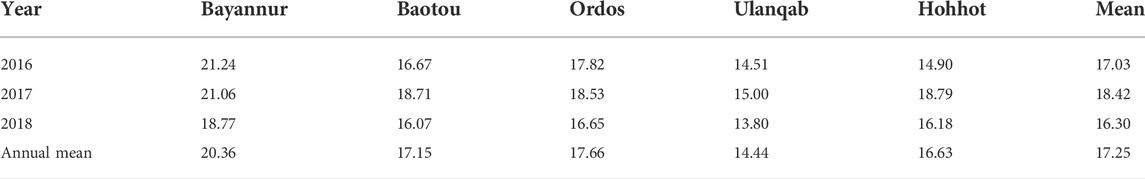
TABLE 3. Description of the statistical characteristics of the annual mean PM2.5 concentration (μg/m3) of cities in central Inner Mongolia from 2016 to 2018.
At the same time, we calculated the percentage of air pollution days in central Inner Mongolia cities from 2016 to 2018 to the number of days in the whole year, as shown in Figure 5. From the figure, we can find that the proportion of air pollution days in Baotou and Hohhot in the past 3 years is higher than 0.20, especially in 2017, the proportion of Hohhot is higher than 0.3. Compared with the other four cities, Ulanqab has a lower proportion of polluted days, but it is also higher than 0.1. As a result, cities in central Inner Mongolia are plagued by air pollution.
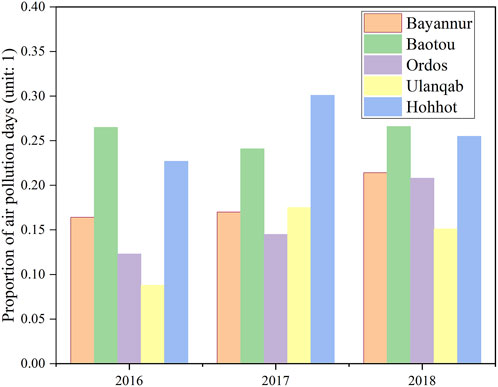
FIGURE 5. Percentage of air pollution days in central Inner Mongolia cities from 2016 to 2018.
The central part of Inner Mongolia has a continental monsoon arid climate with four distinct seasons. In addition, the region’s economic development is faster than other regions in Inner Mongolia, and has obvious seasonal characteristics, which has an important impact on the seasonal distribution of PM2.5, so it is necessary to study and analyze the seasonal changes of PM2.5 concentration. According to the monthly mean PM2.5 concentration data in the study area from 2016 to 2018, the mean PM2.5 concentration values of the corresponding seasons are calculated for many years. Figure 6 shows the spatial distribution of seasonal mean PM2.5 from 2016 to 2018. It can be seen from the figure that the highest seasonal mean PM2.5 concentration value for many years occurs in winter, and the spatial variation of the seasonal mean PM2.5 concentration value in winter is also the largest. The PM2.5 concentration value is the smallest in summer, and is at the intermediate level in spring and autumn. The seasonal mean concentration of PM2.5 has high value areas, which are concentrated in the Yellow River Basin in the northern part of Bayannur and along the banks of the Yellow River Basin in other cities, especially in autumn and winter.
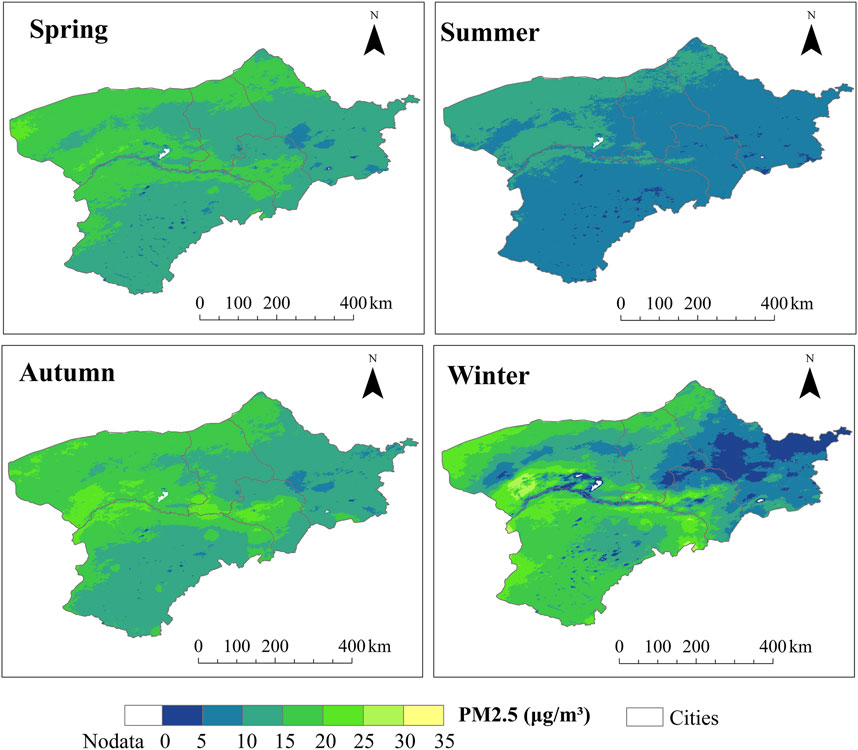
FIGURE 6. Spatial distribution of seasonal average PM2.5 concentration from 2016 to 2018.
Figure 7 shows the change of the seasonal mean concentration of PM2.5 in the cities of central Inner Mongolia from 2016 to 2018. It can be found from the figure that the seasonal variation of PM2.5 concentration in the five cities is basically the same. The mean PM2.5 concentration in the three seasons of spring, autumn and winter in each city is higher, and the lowest in summer. However, starting from the summer of 2018, the seasonal mean concentration of PM2.5 in all cities began to decline. The mean PM2.5 of Bayannur in each season is mostly higher than that of other cities, except for Ordos in the winter of 2016 and spring of 2018. In the summer of 2016, all cities had the lowest mean PM2.5. In the fall of 2017 and the spring of 2018, the seasonal mean PM2.5 concentration of all cities was the highest in 3 years, especially in the spring of 2018.
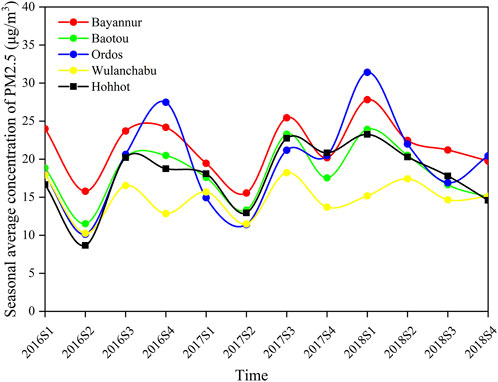
FIGURE 7. The seasonal variation of PM2.5 concentration of cities in central Inner Mongolia.
The spatial distribution pattern of the monthly mean concentration of PM2.5 in the study area from 2016 to 2018 from January to December can be found in the Supplementary Appendix Figures S3–S5. The monthly changes of PM2.5 concentration in the cities of central Inner Mongolia from 2016 to 2018 are shown in Figure 8. It can be seen from Figure 8 that the overall change patterns of the five cities are basically the same. November is the month with the most severe PM2.5 concentration in the urban agglomeration of central Inner Mongolia, followed by January, March, and May. In addition, June and September are months with lower PM2.5 concentrations.
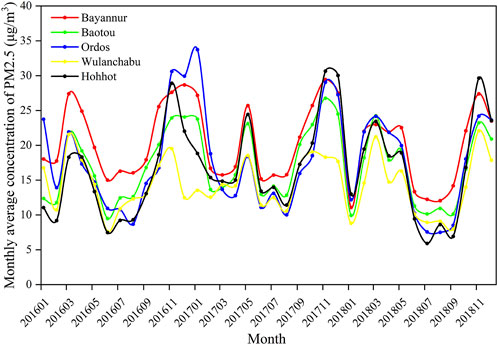
FIGURE 8. The monthly average change of PM2.5 concentration in cities from 2016 to 2018.
The monthly mean concentration of PM2.5 in most areas of central Inner Mongolia from June to September was lower than 20 μg/m3, and the pollution was relatively small. In January, the concentration of PM2.5 was highest in southwestern Bayannur, southern Baotou, and northeastern Ordos; starting from February, the overall PM2.5 concentration value slowed down and drifted laterally along the main stream of the Yellow River; until October, the PM2.5 concentration value began to increase significantly, and continued to decay around the main stream of the Yellow River, reaching the highest month of the overall PM2.5 concentration distribution in the study area in November and December. In addition, other spatial distribution laws are consistent with the above-mentioned characteristics of annual and seasonal changes of PM2.5.
Using factor detectors to determine the influence degree of each influencing factor on the seasonal variation of PM2.5, the results are shown in Table 4. It can be seen from Table 4 that, overall, the single factor that has the greatest impact on the seasonal concentration of PM2.5 is the urban built-up area (UBA, q = 0.386), followed by the permanent population (PP, q = 0.340), the least impact is the number of industrial enterprises above designated size (NIE, q = 0.016). In addition, the concentration of PM2.5 varies in different seasons, and the impact factors are naturally also inconsistent. In spring, the most explanatory factor is the permanent population, followed by the urban built-up area and heat supply. In summer, the most explanatory factor is GDP per capita (PGDP), followed by the area of urban built-up areas and the number of industrial enterprises above designated size. In autumn, the most explanatory factor is the area of urban built-up areas (UBA). In winter, except for per capita GDP (PGDP) and the number of industrial enterprises above designated size (NIE), other factors have a high degree of explanation. The most explanatory factor in winter and spring is the permanent population (PP, q = 0.728), followed by heat supply (HS, q = 0.562) and urban built-up area (UBA, q = 0.536).
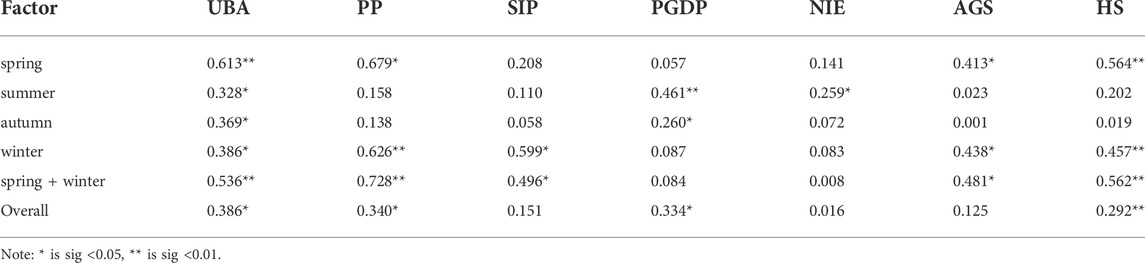
TABLE 4. Explanation degree of different social factors to PM2.5 concentration changes.
We calculated the influence degree of each impact factor on the annual PM2.5 of different cities, and the results are shown in Table 5. From the table, we can find that the main social factors affecting PM2.5 are different for different cities. Among them, for Bayannur, except for per capita GDP (PGDP, q = 0.045), other factors have a very high degree of explanation. However, in Baotou, the per capita GDP (PGDP) is highly explanatory, followed by the urban built-up area. In Ordos, the most explanatory factors are the urban built-up area (UBA), heat supply (HS), and permanent population (PP). In Ulanqab, the most explanatory factors are the proportion of secondary industry (SIP), heat supply (HS), per capita GDP (PGDP), and permanent population (PP). In Hohhot, the most explanatory factors are the number of units of industrial enterprises (NIE), urban built-up area (UBA), permanent population (PP), and annual gas supply (AGS). This is related to the development of different cities and pillar industries.
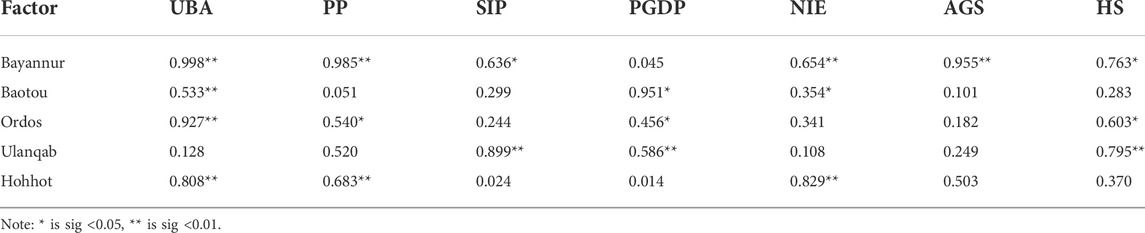
TABLE 5. Explanation Degree of Different Social Factors to PM2.5 Concentration Changes in different cities.
We choose this time period and build the model month by month. Although there are only three distinct years for a month, we have 50 data for modeling for each year, for a total of 150 modeling data for each month. Increasing the year can make the model generalize better, but at the same time too many variables and data can lead to degraded computing performance and data redundancy. So we chose this typical time period. On the other hand, 2016–2018 is the final stage to complete the action plan for air pollution prevention and control.
The central area of Inner Mongolia is cold and dry in winter, consumes a large amount of coal (Zheng et al., 2018), and increases the number of car trips, which increases the concentration of PM2.5 in the air, so the PM2.5 in winter is extremely high. In summer, there is more rain, which has a certain purification effect on pollutants in the air. The vegetation coverage in summer also reaches the highest level, so the concentration of PM2.5 in summer is low (Junyan Yang et al., 2020). In spring and autumn, it is windy and there is more sand and dust in the air (Gao et al., 2018). Especially in spring, when sandstorms are reported, PM2.5 is also high. This is basically consistent with our previous results.
The surface of the alluvial plain of the Yellow River is flat and the terrain is open. Except that the roughness of the surface affects the atmospheric turbulence near the ground, the air flow does not have much interference (Zhuorui Wei et al., 2021). Under normal circumstances, pollutants will diffuse according to the Gaussian diffusion model (Tee et al., 2020). As the Yin Mountains, which run east-west and have an altitude of more than 1000 m along the Yellow Plain, are distributed to the north of the Yellow River, which prevents the diffusion of pollutants from strong winds. Therefore, the concentration of air pollutants in the northern part of Ordos and the southern part of Bayannur is slightly higher.
The most important factor affecting PM2.5 concentration in central Inner Mongolia from 2016 to 2018 was the urban built-up areas. In other words, urbanization was the main factor affecting PM2.5 pollution in central Inner Mongolia during this period. There are a certain number of industrial parks in the urban areas of central Inner Mongolia, and the growth rate of green area is not enough to offset the growth rate affected by urban development. In addition, car ownership is high in this area, and car emissions can also cause pollution (Khuzestani et al., 2017). Therefore, in the process of urbanization, we must pay attention to the prevention and control of air pollution, and plan the urban layout according to the different economic and natural conditions of each city. The number of permanent residents and per capita GDP are also important influencing factors of PM2.5 pollution. In the process of economic development, we must pay attention to pollution prevention and control, appropriately adjust the industrial structure, and develop public transportation.
Heat supply is an extremely important factor influencing PM2.5 pollution in winter and spring in central Inner Mongolia. The peak heating period in this area is from October of the current year to the beginning of May of the following year, and the heating period is as long as 6 months. Air pollution is mainly concentrated in spring and winter. At the turn of spring and summer, the pollution will continue to reduce. When the autumn and winter alternate, the pollution will increase again. The burning of a large amount of coal during the heating process in winter is the main reason for the increase of air pollution in winter (Khuzestani et al., 2017; Khuzestani et al., 2018). Therefore, the government should actively and orderly promote new energy, rationally and effectively use clean energy, reduce the use of coal, and look for alternatives such as electricity and natural gas.
In this paper, the central region of Inner Mongolia was selected as the study area, and the factor with the greatest correlation with monthly PM2.5 concentration from 2016 to 2018 was selected from multiple factors to establish a GWR model and invert the spatial distribution data of PM2.5 concentration from 2016 to 2018. In this study, the spatial and temporal (annual, seasonal, and monthly) spatial distribution characteristics of PM2.5 concentration in cities of central Inner Mongolia were analyzed, and the impact on PM2.5 concentration was analyzed from the aspects of economic development, urbanization, industrialization and energy. The results of this paper provide a theoretical basis for air pollution monitoring, management and prevention in central Inner Mongolia.
This study investigated the temporal and spatial distribution characteristics of PM2.5 concentration in central Inner Mongolia from 2016 to 2018 and the impact of social and economic factors on it. First, a geographically weighted regression model considering the heterogeneity of time and space was established to describe the time and space pattern of PM2.5 concentration in the study area. Then we used geographic detectors to determine the impact of socio-economic factors on PM2.5. The main conclusions of this study include:
1. There is significant temporal and spatial heterogeneity between PM2.5 concentration and the selected auxiliary variables. The established model can better estimate the spatial distribution of PM2.5 concentration in the study area. The variation of the monthly mean correlation coefficient R in the verification parameters is relatively stable, between 0.58–0.66.
2. PM2.5 concentration in central Inner Mongolia showed significant temporal and spatial changes. The annual mean PM2.5 concentration along the Yellow River Basin is the highest in the study area. Although the PM2.5 concentration increased first and then decreased, it was still higher than the China national quality standard. Therefore, further reducing the PM2.5 concentration is still a huge challenge.
3. Urban built-up area, permanent population and per capita GDP are the key factors affecting the temporal and spatial distribution of PM2.5 concentration in the study area. In addition, the influencing factors of PM2.5 concentration changes in different seasons are inconsistent. In winter and spring, heat supply is also an extremely important factor.
The raw data supporting the conclusion of this article will be made available by the authors, without undue reservation.
JW: Model construction, sub-analysis of results; investigation; validation; writing-original draft; writing-review and editing. DL: Conceptualization; Methods; writing-review and editing. XX: Conceptualization; data management; results analysis; investigation; Software. JM: Writing-review and editing; LH: Writing-review and editing.
This research is funded by the National Natural Science Foundation of China (No. 42067013), the Program for Young Talents of Science and Technology in Universities of Inner Mongolia Autonomous Region (No. NJYT-19-A18), and the China Scholarship Council Study Abroad Program.
Authors would like to thank the China Environmental Monitoring Station for the daily mean PM2.5 concentration value stations data set, the MODIS AOD/NDVI data released by NASA, and the ERA-Interim climate data released by the European Center for Mid-range Weather Forecast. Authors are grateful for the funding support of the Youth Science and Technology Leading Talents Project of Higher Education Institutions in Inner Mongolia Autonomous Region. Authors sincerely thank the reviewers and journal editors for their pertinent comments and valuable suggestions.
The authors declare that the research was conducted in the absence of any commercial or financial relationships that could be construed as a potential conflict of interest.
All claims expressed in this article are solely those of the authors and do not necessarily represent those of their affiliated organizations, or those of the publisher, the editors and the reviewers. Any product that may be evaluated in this article, or claim that may be made by its manufacturer, is not guaranteed or endorsed by the publisher.
The Supplementary Material for this article can be found online at: https://www.frontiersin.org/articles/10.3389/fenvs.2022.893437/full#supplementary-material
Analitis, A., Barratt, B., Green, D., Beddows, A., Samoli, E., Schwartz, J., et al. (2020). Prediction of PM2.5 concentrations at the locations of monitoring sites measuring PM10 and NOx, using generalized additive models and machine learning methods: A case study in london. Atmos. Environ. 240 (6), 117757. doi:10.1016/j.atmosenv.2020.117757
Bai, M., Hao, R., Li, X., Di, R., Yang, J., and Liu, H. (2010). Variation characteristics and prediction methods of heating period in Inner Mongolia. Meteorol. Sci. Technol., 38 (06), 709–714. doi:10.19517/j.1671-6345.2010.06.009
Bai, L., Wang, J., Ma, X., and Lu, H. (2018). Air pollution forecasts: An overview. Int. J. Environ. Res. Public Health 15 (4), 780. doi:10.3390/ijerph15040780
Casallas, A., Ferro, C., Celis, N., Guevara-Luna, M. A., Mogollon-Sotelo, C., Guevara-Luna, F. A., et al. (2021). Long short-term memory artificial neural network approach to forecast meteorology and PM2.5 local variables in Bogota, Colombia. Model. Earth Syst. Environ 09, 1–14. doi:10.1007/s40808-021-01274-6
Engel-Cox, J., Holloman, C., Coutant, B., and Hoff, R. (2004). Qualitative and quantitative evaluation of MODIS satellite sensor data for regional and urban scale air quality. Atmos. Environ. 38, 2495–2509. doi:10.1016/j.atmosenv.2004.01.039
Esworthy, R. (2014). Air quality: EPA'S 2013 changes to the particulate matter (PM) standard, 157–208.
Gao, J., Wang, K., Wang, Y., Liu, S., Zhu, C., Hao, J., et al. (2018). Temporal-spatial characteristics and source apportionment of PM2.5 as well as its associated chemical species in the Beijing-Tianjin-Hebei region of China. Environ. Pollut. 233, 714–724. doi:10.1016/j.envpol.2017.10.123
Gao, W., Zhu, L., Ma, Z., Gao, Q., Yu, X., Wu, S., et al. (2021). Particulate matter trends and quantification of the spring sand-dust contribution in Hohhot, Inner Mongolia, from 2013 to 2017. Atmos. Ocean. Sci. Lett. 14 (2), 100036. doi:10.1016/j.aosl.2021.100036
Guan, W.-J., Zheng, X.-Y., Chung, K. F., and Zhong, N.-S. (2016). Impact of air pollution on the burden of chronic respiratory diseases in China: Time for urgent action. Lancet 388 (10054), 1939–1951. doi:10.1016/S0140-6736(16)31597-5
Guo, Y., and Wu, T. (2011). Analysis on the economic development of Hubao'e urban agglomeration and its intergovernmental relations. J. Finance Econ. Theory 17 (03), 98–103. doi:10.3969/j.issn.1004-5295.2011.03.021
Haijun, Z., Xiu, W., Tao, L., Xingjun, Z., and Feng, H. (2020). Air pollution characteristics of xilinhot in 2019. J. Inn. Mong. Normal Univ. Sci. Ed. 49 (06), 475–482. doi:10.3969/j.issn.1001-8735.2020.06.002
He, Q. Q., and Huang, B. (2018a). Satellite-based high-resolution PM2.5 estimation over the Beijing-Tianjin-Hebei region of China using an improved geographically and temporally weighted regression model. Environ. Pollut. 236, 1027–1037. doi:10.1016/j.envpol.2018.01.053
He, Q. Q., and Huang, B. (2018b). Satellite-based mapping of daily high-resolution ground PM2.5 in China via space-time regression modeling. Remote Sens. Environ. 206, 72–83. doi:10.1016/j.rse.2017.12.018
Hu, X., Waller, L. A., Al-Hamdan, M. Z., Crosson, W. L., Estes, M. G., Estes, S. M., et al. (2013). Estimating ground-level PM2.5 concentrations in the southeastern US using geographically weighted regression. Environ. Res. 121, 1–10. doi:10.1016/j.envres.2012.11.003
Jain, S., Presto, A. A., and Zimmerman, N. (2021). Spatial modeling of daily PM2.5, NO2, and CO concentrations measured by a low-cost sensor network: Comparison of linear, machine learning, and hybrid land use models. Environ. Sci. Technol. 55 (13), 8631–8641. doi:10.1021/acs.est.1c02653
Joseph, S., and Agustí, P. (2021). Compositional spatio-temporal PM2.5 modelling in wildfires. Atmosphere 12, 1309. doi:10.3390/atmos12101309
Juliette, R.-P., Perdrix, E., Sobanska, S., and Bremard, C. (2008). PM10 air quality variations in an urbanized and industrialized harbor. Atmos. Environ. 42 (31), 7274–7283. doi:10.1016/j.atmosenv.2008.07.005
Junyan Yang, J., Shi, B., Shi, Y., Marvin, S., Zheng, Y., and Xia, G. (2020). Air pollution dispersal in high density urban areas: Research on the triadic relation of wind, air pollution, and urban form. Sustain. Cities Soc. 54, 101941. doi:10.1016/j.scs.2019.101941
Khuzestani, R. B., Schauer, J. J., Wei, Y., Zhang, L., Cai, T., Zhang, Y., et al. (2017). Quantification of the sources of long-range transport of PM2.5 pollution in the Ordos region, Inner Mongolia, China. Environ. Pollut. 229, 1019–1031. doi:10.1016/j.envpol.2017.07.093
Khuzestani, R. B., Schauer, J. J., Shang, J., Cai, T., Fang, D., Wei, Y., et al. (2018). Source apportionments of PM2.5 organic carbon during the elevated pollution episodes in the Ordos region, Inner Mongolia, China. Environ. Sci. Pollut. Res. 25 (13), 13159–13172. doi:10.1007/s11356-018-1514-4
Kong, L., Tan, Q., Feng, M., Qu, Y., An, J., Liu, X., et al. (2020). Investigating the characteristics and source analyses of PM2.5 seasonal variations in Chengdu, Southwest China. Chemosphere 243, 125267. doi:10.1016/j.chemosphere.2019.125267
Lin, C., Li, Y., Yuan, Z., Lau, A. K. H., Li, C., and Fung, J. C. H. (2015). Using satellite remote sensing data to estimate the high-resolution distribution of ground-level PM2.5. Remote Sens. Environ. 156, 117–128. doi:10.1016/j.rse.2014.09.015
Liu, J. (2002). Integrate into “great beijing” and develop inner Mongolia. North. Econ. 01 (06), 10–11.
Liu, Q., Yang, Y., and Liu, H. (2020). Spatiotemporal evolution characteristics of air pollution degree of in 366 cities of China. Arid. Land Geogr. 43 (03), 820–830. doi:10.12118/j.issn.1000-6060.2020.03.28
Liu, N., Zou, B., Li, S. X., Zhang, H. H., and Qin, K. (2021). Prediction of PM2.5 concentrations at unsampled points using multiscale geographically and temporally weighted regression. Environ. Pollut. 284, 117116. doi:10.1016/j.envpol.2021.117116
Liu, G., Sun, S., Zou, C., Wang, B., Wu, L., and Mao, H. (2022). Air pollutant emissions from on-road vehicles and their control in Inner Mongolia, China. Energy 238, 121724. doi:10.1016/j.energy.2021.121724
Lv, W., and Li, L. (2018). PM2.5 pollution characteristics in main observation stations in hubei and the impact analysis of meteorological factors. Ecol. Environ. Sci. 27 (11), 2073–2080. doi:10.16258/j.cnki.1674-5906.2018.11.013
Meng, X., Wu, Y., Pan, Z., Wang, H., Yin, G., and Zhao, H. (2019). Seasonal characteristics and particle-size distributions of particulate air pollutants in Urumqi. Int. J. Environ. Res. Public Health 16 (3), 396. doi:10.3390/ijerph16030396
Miao Zhang, M., Shi, L., Ma, X., Zhao, Y., and Gao, L. (2021). Study on comprehensive assessment of environmental impact of air pollution. Sustainability 13 (2), 476. doi:10.3390/su13020476
Mirzaei, M., Amanollahi, J., and Tzanis, C. G. (2019). Evaluation of linear, nonlinear, and hybrid models for predicting PM2.5 based on a GTWR model and MODIS AOD data. Air Qual. Atmos. Health 12 (10), 1215–1224. doi:10.1007/s11869-019-00739-z
Ouyang, H., Tang, X., Kumar, R., Zhang, R., Brasseur, G., Churchill, B., et al. (2022). Toward better and healthier air quality: Implementation of WHO 2021 global air quality Guidelines in asia. Bull. Am. Meteorol. Soc. 103, E1696–E1703. doi:10.1175/bams-d-22-0040.1
Qian Yang, Q., Yuan, Q., Li, T., and Yue, L. (2020). Mapping PM2. 5 concentration at high resolution using a cascade random forest based downscaling model: Evaluation and application. J. Clean. Prod. 277, 123887. doi:10.1016/j.jclepro.2020.123887
Qiu, X., Duan, L., Cai, S., Yu, Q., Wang, S., Chai, F., et al. (2017). Effect of current emission abatement strategies on air quality improvement in China: A case study of Baotou, a typical industrial city in inner Mongolia. J. Environ. Sci. 57, 383–390. doi:10.1016/j.jes.2016.12.014
Rupakheti, D., Yin, X., Rupakheti, M., Zhang, Q., Li, P., Rai, M., et al. (2021). Spatio-temporal characteristics of air pollutants over Xinjiang, northwestern China. Environ. Pollut. 268, 115907. doi:10.1016/j.envpol.2020.115907
Song, W., Jia, H., Huang, J., and Zhang, Y. (2014). A satellite-based geographically weighted regression model for regional PM2.5 estimation over the Pearl River Delta region in China. Remote Sens. Environ. 154, 1–7. doi:10.1016/j.rse.2014.08.008
Sui, M. (2019). Impact and feedback of air pollution on climate change. Resour. Econ. Environ. Prot. 01 (07), 43. doi:10.3969/j.issn.1673-2251.2019.07.051
Tee, C., Ng, E. Y. K., and Xu, G. (2020). Analysis of transport methodologies for pollutant dispersion modelling in urban environments. J. Environ. Chem. Eng. 8 (4), 103937. doi:10.1016/j.jece.2020.103937
Tørseth, K., Aas, W., Breivik, K., Fjaeraa, A., Fiebig, M., Hjellbrekke, A., et al. (2012). Introduction to the European Monitoring and Evaluation Programme (EMEP) and observed atmospheric composition change during 1972–2009. Atmos. Chem. Phys. 12, 5447–5481. doi:10.5194/acp-12-5447-2012
Utari, N. I., Srinadi, I. G. A., and Susilawati, M. (2019). Model geographically weighted regression (GWR) faktor-faktor yang memengaruhi kecelakaan lalu lintas di provinsi bali. E-Jurnal Mat. 8, 140. doi:10.24843/MTK.2019.v08.i02.p245
Vo, T. T. T., Wu, C.-Z., and Lee, I.-T. (2020). Potential effects of noxious chemical-containing fine particulate matter on oral health through reactive oxygen species-mediated oxidative stress: Promising clues. Biochem. Pharmacol. 182 (2), 114286. doi:10.1016/j.bcp.2020.114286
Wang, J., and Xu, C. (2017). Geodetector: Principle and prospective, 72, 116–134. doi:10.11821/dlxb201701010
Wang, Z., Wu, T., Che, F., Wang, S., Zhou, Y., Qian, X., et al. (2010). Comparison between domestic and international ambient air quality standards. Res. Environ. Sci. 23 (03), 253–260. doi:10.13198/j.res.2010.03.7.wangzsh.001
Wang, L., Xiong, Q., Wu, G., Gautam, A., Jiang, J., Liu, S., et al. (2019). Spatio-temporal variation characteristics of PM2.5 in the beijing-tianjin-hebei region, China, from 2013 to 2018. Int. J. Environ. Res. Public Health 16 (21), 4276–76. doi:10.3390/ijerph16214276
Wang, W., Zhang, L., Zhao, J., Qi, M., and Chen, F. (2020). The effect of socioeconomic factors on spatiotemporal patterns of PM2.5 concentration in beijing–tianjin–hebei region and surrounding areas. Int. J. Environ. Res. Public Health 17, 3014. doi:10.3390/ijerph17093014
Wei, Q., Zhang, L., Duan, W., and Zhen, Z. (2019). Global and geographically and temporally weighted regression models for modeling PM2.5 in heilongjiang, China from 2015 to 2018. Int. J. Environ. Res. Public Health 16 (24), 5107. doi:10.3390/ijerph16245107
Whitby, K. T., Husar, R., and Liu, B. Y. H. (1972). The aerosol size distribution of los angeles smog. J. Colloid Interface Sci. 39, 177–204. doi:10.1016/0021-9797(72)90153-1
Wu, Z., Zhang, X., and Wu, M. (2015). Mitigating construction dust pollution: State of the art and the way forward. J. Clean. Prod. 112 (01), 1658–1666. doi:10.1016/j.jclepro.2015.01.015
Xiao, Q., Ma, Z., Li, S., and Liu, Y. (2015). The impact of winter heating on air pollution in China. PloS one 10, e0117311. doi:10.1371/journal.pone.0117311
Xin Zhang, X., Fan, Y., Wei, S., Wang, H., and Zhang, J. (2021). Spatiotemporal distribution of PM2.5 and ItsCorrelation with other air pollutants in WinterDuring 2016∼2018 in xi’an, China. Pol. J. Environ. Stud. 30 (2), 1457–1464. doi:10.15244/pjoes/124755
Yan, H. (2012). Research on the influence of air pollution on ecological environment and countermeasures. Mod. Agric. 01 (03), 95–96. doi:10.3969/j.issn.1008-0708.2012.03.087
Yang, J., Zhao, T., Cheng, X., Ren, Z., Meng, L., He, Q., et al. (2021). Temporal and spatial variations of sandstorm and the related meteorological influences over northern China from 2000 to 2019. Acta Sci. Circumstantiae 41 (08), 2966–2975. doi:10.13671/j.hjkxxb.2021.0234
Yang, W., and Jiang, X. (2020). Interannual characteristics of fine particulate matter in North China and its relationship with land use and land cover change. Environ. Sci. 41 (07), 2995–3003. doi:10.13227/j.hjkx.201911079
Yuan Wei, Y., Li, Z., Zhang, Y., Chen, C., Xie, Y., Lv, Y., et al. (2021). Derivation of PM10 mass concentration from advanced satellite retrieval products based on a semi-empirical physical approach. Remote Sens. Environ. 256 (16), 112319. doi:10.1016/j.rse.2021.112319
Zhai, L., Li, S., Zou, B., Sang, H., Fang, X., and Xu, S. (2018). An improved geographically weighted regression model for PM 2.5 concentration estimation in large areas. Atmos. Environ. 181 (03), 145–154. doi:10.1016/j.atmosenv.2018.03.017
Zhang, D., and Li, W. (2020). Analysis on the progress of urban air pollution research. Technol. Innovation Appl. 01 (19), 79–80+83.
Zhao, Z., Xi, H., Russo, A., Du, H., Gong, Y., Xiang, J., et al. (2019). The influence of multi-scale Atmospheric circulation on severe haze events in autumn and winter in Shanghai, China. Sustainability 11 (21), 5979. doi:10.3390/su11215979
Zheng, C., Zhao, C., Li, Y., Wu, X., Zhang, K., Gao, J., et al. (2018). Spatial and temporal distribution of NO2 and SO2 in Inner Mongolia urban agglomeration obtained from satellite remote sensing and ground observations. Atmos. Environ. 188, 50–59. doi:10.1016/j.atmosenv.2018.06.029
Zhou, C., Wei, G., Zheng, H., Russo, A., Li, C., Du, H., et al. (2019). Effects of potential recirculation on air quality in coastal cities in the Yangtze River Delta. Sci. Total Environ. 651, 12–23. doi:10.1016/j.scitotenv.2018.08.423
Keywords: central inner Mongolia, PM2.5 concentrations, geographically weighted regression, geographic detector, pollution prevention and control
Citation: Wang J, Liu D, Xu X, Ma J and Han L (2022) Analysis of the temporal and spatial pattern of air pollution and the heterogeneity of its influencing factors in central Inner Mongolia from 2016 to 2018. Front. Environ. Sci. 10:893437. doi: 10.3389/fenvs.2022.893437
Received: 10 March 2022; Accepted: 05 August 2022;
Published: 31 August 2022.
Edited by:
Junke Zhang, Southwest Jiaotong University, ChinaReviewed by:
Ana Cristina Russo, University of Lisbon, PortugalCopyright © 2022 Wang, Liu, Xu, Ma and Han. This is an open-access article distributed under the terms of the Creative Commons Attribution License (CC BY). The use, distribution or reproduction in other forums is permitted, provided the original author(s) and the copyright owner(s) are credited and that the original publication in this journal is cited, in accordance with accepted academic practice. No use, distribution or reproduction is permitted which does not comply with these terms.
*Correspondence: Dongwei Liu, bGl1ZHdAaW11LmVkdS5jbg==
Disclaimer: All claims expressed in this article are solely those of the authors and do not necessarily represent those of their affiliated organizations, or those of the publisher, the editors and the reviewers. Any product that may be evaluated in this article or claim that may be made by its manufacturer is not guaranteed or endorsed by the publisher.
Research integrity at Frontiers
Learn more about the work of our research integrity team to safeguard the quality of each article we publish.