 Claire C. Treat
 Miriam C. Jones
 Jay Alder3
95% of researchers rate our articles as excellent or good
Learn more about the work of our research integrity team to safeguard the quality of each article we publish.
Find out more
ORIGINAL RESEARCH article
Front. Environ. Sci. , 31 May 2022
Sec. Atmosphere and Climate
Volume 10 - 2022 | https://doi.org/10.3389/fenvs.2022.892925
This article is part of the Research Topic Permafrost Environment Changes in a Warming Climate View all 12 articles
Soil carbon (C) in permafrost peatlands is vulnerable to decomposition with thaw under a warming climate. The amount and form of C loss likely depends on the site hydrology following permafrost thaw, but antecedent conditions during peat accumulation are also likely important. We test the role of differing hydrologic conditions on rates of peat accumulation, permafrost formation, and response to warming at an Arctic tundra fen using a process-based model of peatland dynamics in wet and dry landscape settings that persist from peat initiation in the mid-Holocene through future simulations to 2100 CE and 2300 CE. Climate conditions for both the wet and dry landscape settings are driven by the same downscaled TraCE-21ka transient paleoclimate simulations and CCSM4 RCP8.5 climate drivers. The landscape setting controlled the rates of peat accumulation, permafrost formation and the response to climatic warming and permafrost thaw. The dry landscape scenario had high rates of initial peat accumulation (11.7 ± 3.4 mm decade−1) and rapid permafrost aggradation but similar total C stocks as the wet landscape scenario. The wet landscape scenario was more resilient to 21st century warming temperatures than the dry landscape scenario and showed 60% smaller C losses and 70% more new net peat C additions by 2100 CE. Differences in the modeled responses indicate the largest effect is related to the landscape setting and basin hydrology due to permafrost controls on decomposition, suggesting an important sensitivity to changing runoff patterns. These subtle hydrological effects will be difficult to capture at circumpolar scales but are important for the carbon balance of permafrost peatlands under future climate warming.
Soils in the permafrost region store large amounts of soil carbon (C), an estimated 1,015–1,035 Pg C (Hugelius et al., 2014; Mishra et al., 2021). Nearly 20% of this soil C can be found in permafrost peatlands, wetlands with thick organic soils and high organic matter concentration, which store 185 ± 70 Pg C (Hugelius et al., 2020). These peatlands have accumulated thick organic soils over millennia due to higher rates of vegetation productivity than decomposition. The formation and presence of permafrost in peatlands, or ground that has remained frozen for more than 2 years (Brown et al., 2001, revised 2001), effectively stops decomposition of organic material frozen in the permafrost peat. In some regions, particularly in regions with continuous permafrost, permafrost aggradation and peat accumulation can go hand in hand, limiting decomposition before peat is incorporated into permafrost. These relatively undecomposed peat profiles can indicate syngenetic permafrost formation along with distinct ice structures within the permafrost peat (Kanevskiy et al., 2014), while in more southern sites, epigenetic permafrost formed substantially after peat deposition (Treat and Jones, 2018). The formation of epigenetic permafrost in peatlands is controlled by climate at the time of permafrost formation (Zoltai, 1995), while the spatial distribution of permafrost in peatlands with discontinuous, isolated, and sporadic permafrost is likely related to the hydrology. A case study from Western Canada found that the spatial distribution of permafrost in peatlands was likely controlled by regional hydrologic patterns, including runoff within wetlands and their watersheds (Quinton et al., 2009). Thus, both climate and hydrology are key drivers of the spatial and temporal distribution of permafrost.
Exactly what factors contribute to the differences in peat accumulation rates under permafrost conditions during the Holocene is unclear. In an earlier large synthesis of peat accumulation rates, both the difference in the timing of permafrost aggradation (i.e., epigenetic or syngenetic) and the spatial distribution of permafrost affected the apparent peat accumulation rates (Treat et al., 2016a). In tundra sites within the continuous permafrost zone, apparent peat accumulation rates varied widely after permafrost aggradation (25%–75% quantile range: 14.9–111.0 g C m−2 yr−1). In sites with warmer, epigenetic permafrost within the discontinuous permafrost zone, the apparent peat accumulation rates since permafrost aggradation were not as variable as in tundra but were 20%–40% lower than comparable permafrost-free fens and bogs. Some northern peat cores also showed very high rates of peat accumulation in the early to mid-Holocene during their initial phase of peat accumulation (Lavoie and Richard, 2000; Jones and Yu, 2010). These high rates of peat accumulation were hypothesized to be driven by enhanced productivity due to high seasonality and solar insolation during the early Holocene (Jones and Yu, 2010). Given the wide range and high rates of peat accumulation found in tundra sites, we hypothesized that syngenetic permafrost formation could be another mechanism for high rates of peat accumulation due to the limited decomposition that occurs with rapid incorporation into the permafrost, as has been suggested in boreal sites (Jones et al., 2017; Manies et al., 2021). However, the conditions that cause this the rapid incorporation of peat into permafrost are unclear.
The rates and amount of carbon that could potentially be released with permafrost thaw are highly uncertain (Schuur et al., 2015; McGuire et al., 2018). Field studies in thawed permafrost peatlands in Southwestern Alaska show that C losses following permafrost thaw can be large, as much as 30% of old peat C stocks (Jones et al., 2017). However, earlier modeling of permafrost peatlands in Western Canada showed that permafrost peatland C was relatively resilient to 21st century warming, with C losses <5% of the old C in peat (Treat et al., 2021). One hypothesis to explain the difference between the outcomes is related to permafrost history, where sites with syngenetic permafrost have relatively undecomposed organic matter that is vulnerable to decomposition when the peat is thawed whereas sites with epigenetic permafrost have undergone more decomposition and the peat is less vulnerable when it thaws (Treat et al., 2014; Manies et al., 2021).
Given that the spatial distribution of permafrost can be controlled by regional hydrology (Quinton et al., 2009) and that we observed a strong sensitivity of the peat profile at a high Arctic site to the model parameterization representing the regional hydrology in our earlier work (Treat et al., 2021), we also hypothesized that the rapid rates of peat accumulation in permafrost could be driven by the site hydrology and whether the peatland was relatively dry or wet. The objective of this study was to test the effects of hydrology on rates and timing of peat accumulation and vulnerability to permafrost thaw. Specifically, we tested the parameter representing the relative amount of water a peatland retains, the balance between the water inputs from the surrounding watershed and the runoff to downstream areas, which can differ across the landscape due to watershed characteristics and regional hydrology (Woo and Young, 2006). We used a process-based model to simulate peatland development in a permafrost peatland in the Canadian Arctic. Simulations ran from peatland initiation at the site in 6,620 BP to present day and projections for 21st century climate warming. We used two contrasting water table scenarios that were driven by the model parameterization representing the regional hydrology, including the water inputs from the surrounding watershed and the runoff to downstream areas. Note that precipitation in both scenarios was the same. Finally, we compared the resulting differences in peat accumulation, permafrost aggradation, and the response to climatic warming between the two scenarios and as well as to field observations.
Thelon-Kazan Peatland (TKP) was selected as a site for an earlier modeling study using a climatic gradient through Western-Central Canada (Treat et al., 2021). In that study, we discovered divergent peat profiles at TKP depending on the parameterization for the hydrological landscape setting. Here, we are exploring those different patterns to develop a more general hypothesis or possible explanation about peat/permafrost dynamics in contrasting hydrological and landscape settings, rather than trying to recreate the C accumulation dynamics at TKP. TKP is located in the Canadian Arctic, approximately 400 km north of treeline in the continuous permafrost zone (66° 27.07′ N, 104° 50.08′ W), where the mean annual air temperature was −11.3°C and mean annual precipitation was 272 mm (Station Baker Lake A 1980–2010; https://climate.weather.gc.ca/climate_normals/; accessed 12 December 2019). The TKP peatland is a fen with high-centered polygonal features and an active layer thickness of 30–40 cm, where peat cores were described by Vardy et al. (2005); Vardy et al. (2000). The manually digitized data from TKP were included in an earlier synthesis (Treat et al., 2016a) and used in an earlier modeling effort (Treat et al., 2021). Three cores were taken at TKP using monolith extraction in the surface soil and motor-driven CRREL Permafrost augers at some point prior to 1998; the exact timing of core collection is unknown. Here we focus on core TK1P2 (also called TKP-2). The TK1P2 core was collected from the center of a high-center polygon and accumulated 193 cm of peat since 6,620 cal. BP (basal age: 5820 ± 70 14C BP; WAT-3066). The peat core (TK1P2) was mainly composed of Cyperaceae with mosses, lichens, and dwarf shrubs in the surface 35 cm (Vardy et al., 2000; Vardy et al., 2005). Data available from the TKP cores includes bulk density, carbon or organic matter content, radiocarbon dates, and plant macrofossil analysis. The data from TKP are available for download (doi: 10.1594/PANGAEA.863697; Treat et al., 2016b); the dataset key (Variable: Auth. Site.CoreID) for TKP is VAR-TKP-01.
We used HPM-Arctic (Treat et al., 2021), which couples a carbon-hydrologic model for peatlands (Frolking et al., 2010) with the Geophysical Institute Permafrost Lab soil thermal model GIPL2 (Marchenko et al., 2008). HPM-Arctic simulates peat formation since initiation to present and into the future, also generating time series of active layer thickness and age of the peat at the bottom of the active layer. HPM-Arctic has been tested and implemented for a transect of peatland sites across western Canada, including TKP (Treat et al., 2021). The model code, parameters, and climate driver data are available from: https://doi.org/10.5281/zenodo.4647666; derivation of parameters and climate drivers is described below.
Briefly, HPM simulates the development of a peat profile over millennia, from initiation, using an annual litter cohort approach with three major plant types (shrubs, herbaceous taxa, and mosses). In HPM-Arctic, the changes in vegetation and NPP are driven primarily by changes in water table depth, following the original HPM formulation (Frolking et al., 2010). Changes in water table can be driven either by external climate forcings (precipitation vs. ET), or by internal peat dynamics, including peat accumulation. NPP temperature sensitivity was modeled as a Q10 function, with a Q10 value of 1.8, based on an empirical relationship between mean annual air temperatures and above-ground net primary productivity for mosses, vascular plants, and trees that was developed for a transect of peatland sites in boreal Manitoba, Canada (Camill et al., 2001). CO2 concentration impacts on productivity are not accounted for in HPM.
Each year’s annual litter input is aggregated into a litter cohort and tracked as it becomes buried and decomposed through the millennia of the simulation. HPM tracks the fraction of total plant litter inputs (above- and below-ground) remaining in annual peat cohorts through the entire profile. This fraction modifies the initial peat litter quality, so that under the same environmental conditions, peat that has lost half its mass to decomposition will decompose at half the rate of fresh peat (Clymo, 1992; Frolking et al., 2001). Decomposition rates are dynamic and dependent on plant litter types (e.g., species-specific decomposition rates), water table or water content, and soil temperature. HPM simulates the water-filled pore space of the unsaturated peat water filled pore space, based on peat bulk density and distance above the water table. In that zone, there is an optimum WFPS for decomposition, with rates falling for drier and wetter peat. Full anoxia occurs some distance below the simulated water table for several reasons: the actual water table is more dynamic than monthly time step simulations, oxygen and other terminal electron acceptors can be delivered to the peat in groundwater flow (much greater for fen than bog), and precipitation water, and also diffuse into the deeper peat from the underlying subsoil or the atmosphere. HPM simplifies these complex phenomena by specifying an exponential decline in the anoxia multiplier on decomposition from its value at the water table to a minimum value, following the original HPM formulation (Frolking et al., 2010). This decline is parameterized to happen much more abruptly in bog than fen conditions.
When decomposing peat becomes frozen into permafrost, it stops decomposing until permafrost thaw, preserving the quality of the peat at freeze-up, which affects the rate of decomposition at thaw. Active layer thickness, updated annually, is determined by identifying the soil depth immediately above where the temperature remains below 0°C for 2 years continuously, in accordance to the definition of permafrost (Harris et al., 1988). HPM-Arctic uses a simple “old-new” carbon tracking algorithm, whereby after a specified year all moss, sedge, and shrub plant litter gets labeled as “new,” so that its accumulation as peat and loss through decomposition can be tracked separately from the older peat derived from plant litter inputs prior to the specified year. The year 2015 C.E. is defined in the model as both present-day and the boundary between new (future) and old (past) carbon inputs.
Some site-specific calibrations were done for several model parameters to capture variability (often not quantified) related to individual watershed and site characteristics (Table 1). Peat initiation often occurs in a local topographic low, receiving run-on from the surrounding watershed; as the peat accumulates and the peat surface rises, it can shift to a local topographic high point, and shed water (run off) rather than receive it (Charman, 2002). The site-specific model parameters include the accumulating peat height at which this shift from run-on to run-off occurred (Hrun-on/off) along with a constant scaling factor, and the peat height when initial fen-type vegetation transitioned to bog-type vegetation (HFBT). When the peat height exceeds the site-specific HFBT, the peatland transitions from a fen to a bog, which involves a decrease in annual NPP to a varying degree (Rydin and Jeglum, 2006) modeled with a site specific fractional parameter (FNPP-bog). With greater lateral hydrological inflow, and therefore a shorter water residence time in the saturated zone, fen conditions are assigned a longer scale length (persistence of partial anoxia below the water table) to a full anoxia impact on decomposition rate. This is modeled with an anoxia scale length parameter (Frolking et al., 2010), which controls how far/quickly reduced electron acceptors are replenished below the water table. This affects peat decomposition rates below the water table. Frozen peat decomposition rates are set to zero (also for seasonal winter frost), while decomposition persists in the seasonally-thawed surface active layer.
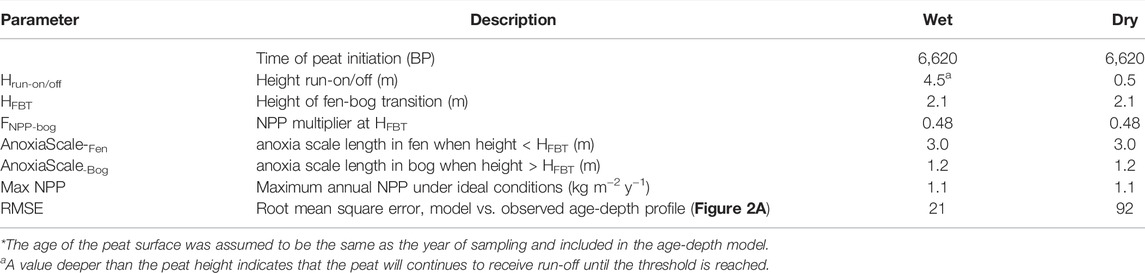
TABLE 1. Model parameterization used in HPM-Arctic for the wet and dry landscape scenarios at Thelon-Kazan Peatland (TKP).
Site-specific parameter values were determined from a combination of observations and/or optimization routines (Table 1; Treat et al., 2021). The parameter HFBT was determined by trial and error from the final peat height and observations of the height of the fen-to-bog transitions (HFBT) in the site core profile; the model parameter HFBT generally was higher than in the observations. Hrun-on/off was determined by trial and error when the difference between the final modeled peat height and observed peat height reached <10 cm, as well as the macrofossil composition compared with the dominant modeled PFTs, which indicated relative water table position over time (e.g., dry or wet). The other three parameters (FNPP-bog, and anoxia scale lengths for fen and bog) were determined from minimizing the root mean squared error between the observed and modeled age-depth profiles, where the age of the peat surface was assumed to be the year of sampling. At TKP, the parameterization used results from earlier model runs at Ennadai Lake, a polygonal permafrost peatland site in NW Territories (c.f. Treat et al., 2021) and generalized parameters for temperate and boreal peatlands (Frolking et al., 2010) due to the limited number of radiocarbon dates (e.g., Figure 2), which limited the number of tunable model parameters (under constraint problem). However, the study goal was not to find the closest agreement to a particular peat core at TKP, but to test a hypothesis about how local hydrology (wet/dry) in a permafrost setting can impact peat accumulation rates and carbon loss upon thaw.
For calculating organic matter stocks and C stocks, model output (mass of peat) was multiplied by mean values determined from a synthesis of over 10,000 peat layers spanning the pan-Arctic permafrost region (Treat et al., 2016a). The conversion factor from model peat mass to organic matter (OM) was 0.924 g OM g−1 peat. The conversion factor from organic matter to carbon was 0.495 gC g−1 OM. While this assumption does introduce some uncertainty into the model results for predictions of future carbon losses, these are likely not the major sources of uncertainty in predicting future C loss as other processes, including changes in landscape hydrology in permafrost regions, are less well known and have larger impacts (Quinton et al., 2010).
The two landscape scenarios at TKP used identical climate drivers, initiation times, vegetation parameters, and most site-specific model parameters (Table 1). We created two model scenarios, dry and wet landscape position, by varying a single site-specific model parameter, Hrun-on/off (Table 1), which is the height of the peat when it begins to shed water, exerting a strong control on the water table level and soil moisture. The dry landscape scenario used Hrun-on/off = 0.5 m, which meant that the peat height quickly crossed the threshold to generate runoff, i.e., peat accumulation caused the site to become a local high point in the landscape, and so the peat profile became relatively dry. The wet landscape scenario used Hrun-on/off = 4.5 m, a peat height that was not reached during the simulation, ensuring a relatively wet peat profile throughout the simulation. While HPM-Arctic does not simulate a surface energy balance, both scenarios are driven by identical climate forcings and modeled active layer depths are consistent with recent meta-analysis results (Clayton et al., 2021). Secondly, an earlier study showed relatively small differences in net radiation among different tundra sites without standing water, relative to sites with standing water, within the same region (Rouse et al., 2000); mean annual water table in these two landscape scenarios is below the peat surface, meaning that there is no standing water and that the net radiation absorbed by the sites is similar.
We utilize the TraCE-21ka transient paleoclimate simulations (Liu et al., 2009: https: //www. earthsystemgrid. org/project/trace.html) to drive HPM-Arctic with monthly temperature and precipitation from 8,000 B.P. to 1990 CE (8 Kyr timeseries). The continuous TraCE-21ka simulations include time-dependent changes in atmospheric greenhouse gases, insolation, and paleogeography as sea level rises from the melting of the large northern hemisphere ice sheets. Monthly temperature and precipitation time series for TKP were extracted from the 3.75° × ∼3.75° climate model grid by bilinear interpolation and then bias-corrected using contemporary regional climate data. To obtain timeseries of temperature for input to HPM-Arctic, we computed anomalies of the 8 Kyr time series to the TraCE-21ka 1950–1990 CE mean and applied the anomalies additively to a modern observed gridded data set (CRU TS v3.32; Harris et al., 2014) using the same base period. The 8 kyr precipitation timeseries was derived by applying the ratio of the 8 Kyr precipitation to the 1950–1990 CE mean as a scaler to the CRU data. As with the TraCE-21ka data, the CRU grid (0.5° × 0.5°) was interpolated to our site locations.
To continue the 8 Kyr timeseries into the future, we adopt the CCSM4 RCP8.5 simulation from the Coupled Model Intercomparison Project Phase 5 (CMIP5; Taylor et al., 2012). The RCP8.5 scenario was chosen as an end-member or upper bound to capture the greatest projected changes in temperature. CCSM4 (Gent et al., 2011) is the successor to the CCSM3 model used in the TraCE-21ka simulations, and so was chosen for model consistency. While focusing on one model projection is a limitation, CCSM4 also has an transient climate response (the response to a 1% yr−1 doubling of atmospheric CO2) of 1.8°C, which is the same as the CMIP5 ensemble multi-model mean of 1.8°C (Flato et al., 2013), giving us confidence the projected temperature changes at our sites are not unreasonable relative to the full CMIP5 ensemble. To extract projected time series at the peatland site locations, we use the same process of bilinear interpolation from the CCSM4 grid (0.9° × 1.25°) and applying CRU bias correction using the 1950–1990 CE climatology period. In our analysis and results below, HPM-Arctic is driven by TraCE-21ka output prior to 1990 CE and CCSM4 afterwards. The RCP8.5 simulations span 2005 through 2100 CE. To capture the effects of new equilibrium climate conditions at 2100 on the relatively slow processes of peat accumulation and loss, we extended RCP8.5 from 2100 for an additional 200 years by randomly sampling full years from the final 25 years of the simulation (2076–2100 CE) using the R command “sample” (replace = T). The modeled climate drivers are shown in Supplementary Figure S1.
All statistical analyses were conducted using R statistical software (Team, 2008). Errors represent standard deviation. In order to compare modeled C losses with observations, we used the peat C stock in 2015 CE, and the results from old/new C tracker in 2100 CE and 2300 CE. Net C loss (or gain) was calculated from the difference in total C stocks in 2015 and 2100 CE or 2300 CE; new C additions and old C losses were calculated relative to the stocks in 2015.
The model of peat development for TKP under wet and dry landscape settings produced divergent peat water table and active layer depths (Figure 1), and vegetation species composition (Table 2) despite using the same climatic drivers (Supplementary Figure S1). Simulated peat depths between the wet and dry scenarios in the present day show that 1.9 m accumulated in the wet scenario and 2.8 m in the dry scenario (Figure 1; Table 2). The water table in the wet scenario remained near the surface (mean: 3 ± 2 cm depth) throughout the simulation (Figure 1A), while the water table in the dry scenario was deeper (mean: 31 ± 9 cm depth, Figure 1B). The timing of peat and permafrost development also differed between the wet and dry scenarios. Modeled active layer depths in the present day were <50 cm in the dry scenario and >80 cm in the wet scenario (Table 2). Present-day vegetation differed between the two scenarios, with shrubs having the highest NPP in the dry scenario and herbaceous species (e.g., sedges) having the highest NPP in the wet scenario (Table 2).
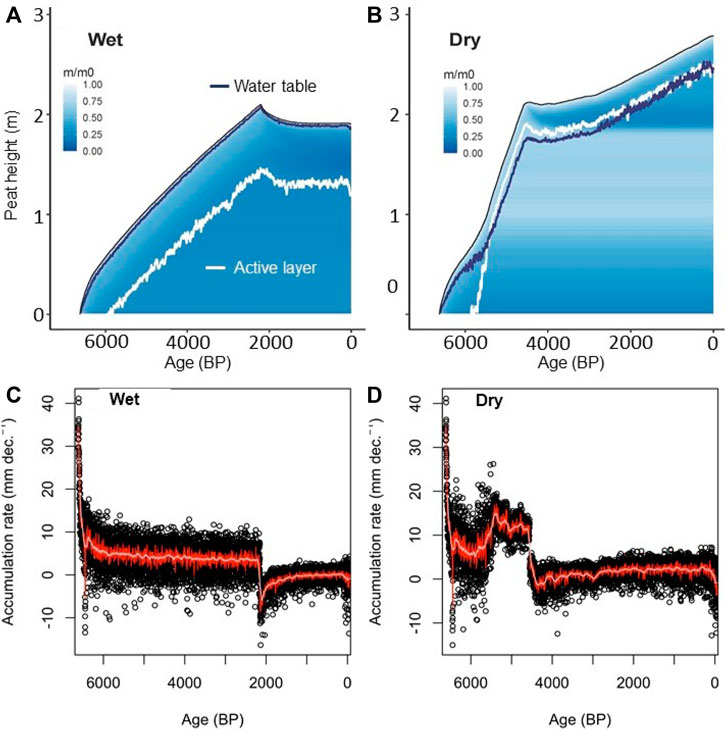
FIGURE 1. Time series of peat profiles at TKP with two different values of model parameter for the peat height when run-on switches to run-off (Hrun-on/off): (A) Hrun-on/off = 4.5 results in a wetter peat profile with a water table (blue line) near the peat surface; (B) Hrun-on/off = 0.5 results in a drier peat profile and an unsaturated (dry) active layer (white line); m/m0 represents the peat litter cohort mass remaining, high values indicating relatively undecomposed peat; (C) Modeled peat accumulation rates for the wet landscape scenario (black circles), as well as smoothed rates using decadal (red) and centennial (gray) filters; (D) Modeled peat accumulation rates for the dry landscape scenario (black circles), as well as smoothed rates using decadal (red) and centennial (gray) smoothing. All other parameters and climate drivers were the same between the two simulations.
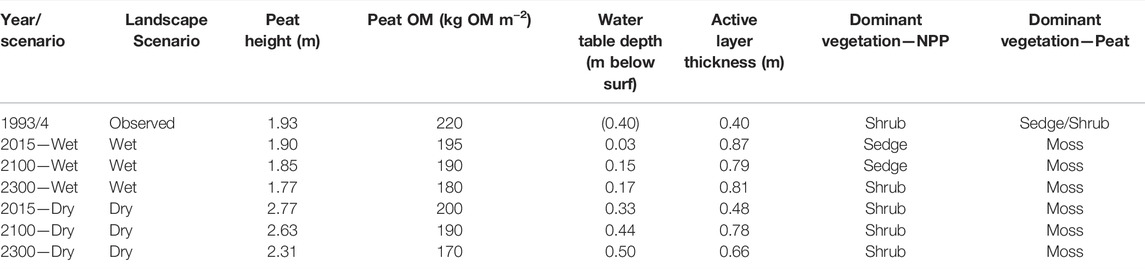
TABLE 2. Field observations and model results for present day (2015: means of 2006–2015 CE) and future scenarios, including 2100 (means of 2091–2100 CE) and 2300 (means of 2291–2300 CE) for peat height, peat organic matter (OM) stocks, water table depth, maximum annual active layer thickness, and dominant vegetation types, both by productivity (e.g., mean decadal NPP of surface vegetation) and the dominant type preserved in the peat core record.
In the wet landscape scenario, permafrost aggraded in the peat profile after 5900 BP, about 700 years into the simulation (prior to that time, permafrost was present in the underlying mineral soil). Peat deposited after 3100 BP remained in the active layer throughout the simulation (Supplementary Figure S2). Modeled, decadal-smoothed rates of peat accumulation for the wet scenario ranged from −8.7–11.5 mm decade−1 (Figure 1C). The peat accumulation rates differed dramatically before (4.3 ± 3.5 mm decade−1) and after (<0 mm decade−1) the fen-bog transition at 2150 BP (Figure 1C) due to declining vegetation (litter) productivity.
In the dry landscape scenario, the modeled water table dropped well below the surface after the initial period of peat initiation and remained deeper throughout the simulation (Figure 1B). Permafrost aggraded in the peat profile approximately 200 years later in the dry scenario than the wet scenario, after 5700 BP. Subsequently, both peat and peat in the permafrost aggraded rapidly, with more than 1 m of peat added in the next 1,150 years (Figure 1B). Mean peat accumulation rates were 11.7 ± 3.4 mm per decade during this period (5700 BP–4550 BP), and the residence time of the peat in the active layer was <200 years before being incorporated into the rapidly aggrading permafrost in the peat profile (Supplementary Figure S2). During this period of rapid peat and permafrost aggradation, mean NPP in the dry landscape scenario was 54 g Cm−2 y−1, while in the wet scenario it was 84 g Cm−2 y−1. The more rapid rates of incorporation of peat into the permafrost resulted in relatively little decomposition with, a mean of 52% of the original peat mass remaining in the permafrost peat (Figure 1). The active layer remained comparatively shallow throughout (Figure 1B). After the modeled fen-bog transition at 4550 BP, the peat accumulation decreased to a mean rate of 1.4 ± 2.1 mm decade−1 (Figure 1D) and the residence time in the active layer increased.
Differences in peat depth between the dry and wet landscape scenarios at TKP (Figures 1A,B) resulted in age-depth profiles that differed between these two landscape settings (Figure 2A). The age-depth profile for the wet scenario was a better fit to the observations at TKP than the dry scenario (Figure 2A; RMSE = 21 for wet vs. 92 for dry), as was the organic matter density below 0.5 m depth (Figure 2B), suggesting that the wet scenario more accurately reflects the development at TKP. The difference in peat thickness between the two scenarios (1.9 m in the wet scenario vs. 2.8 m in the dry scenario) reflects the significant difference in the organic matter densities of the two simulated profiles (Figures 1, 2B). However, neither modeling scenario captures the high density of organic matter observed in the surface 0–0.5 m of the peat core, though the wet scenario does have higher bulk density around 0.5 m than deeper in the profile (Figure 2B). The combined effect of the differences in thickness and the difference in organic matter density between the wet and dry scenarios resulted in relatively small differences (3%) in organic matter stocks (wet: 195 kg OM m−2, dry: 200 kg OM m−2). Therefore, in permafrost peats, the peat height or peat depth should not be used to predict C stocks (Table 2). This result points to the challenge of predicting peat carbon or organic matter stocks in permafrost soils using peat depth (Hugelius et al., 2020) as both results from this study (Table 2) and that study show little correlation between peat depth and C stock. Similarly, gap-filling carbon density for determination of peatland C stocks in permafrost peatlands (i.e., Nichols and Peteet, 2019) is also problematic (Figure 2B; Table 2), which is also compounded by the relatively high variability in bulk density found across tundra permafrost peats (coefficient of variation = 130%; Treat et al., 2016a).
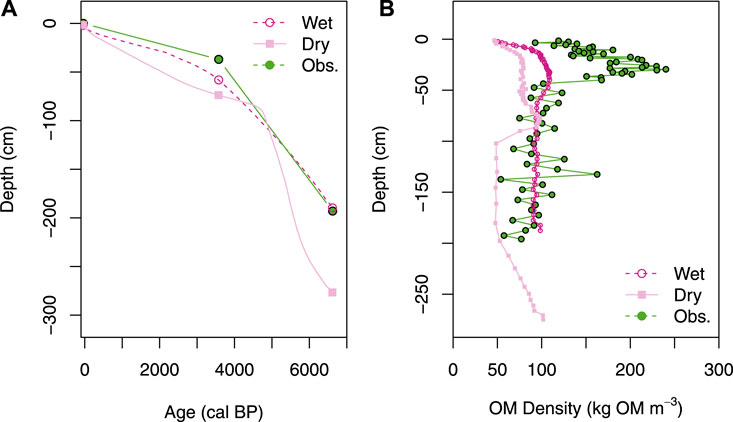
FIGURE 2. Depth profiles for TKP for modeled scenarios (wet, dry landscapes) and observations (Obs.). (A) Modeled age-depth profiles (light pink and dark pink) are continuous with circles corresponding to the ages of the observations, while the green line connecting the observations is a linear interpolation between the three observed points. (B) Modeled and observed organic matter density with depth.
The RCP 8.5 driven HPM-Arctic simulations at TKP under wet and dry landscape settings for the future resulted in substantially different outcomes at 2100 CE for peat temperatures and permafrost, hydrology, vegetation, and carbon cycle, despite having the same climatic drivers. By 2100 CE, transient warming projected under RCP 8.5 increased mean annual air temperature from −11.3°C to −4.4°C. Despite the strong warming, permafrost remained in the peat profile (Figure 3). Warmer temperatures increased evapotranspiration, which combined with gradual thawing of permafrost increased the depths to the perched water table (Table 2). The changes in water table shifted the modeled species composition, while the warmer air temperature increased modeled NPP (Figure 4). Along with warming temperatures, the changes in water table, active layer thickness, increased decomposition as well as net primary productivity altered the peat profiles and C balance by 2100 (Figures 5, 6).
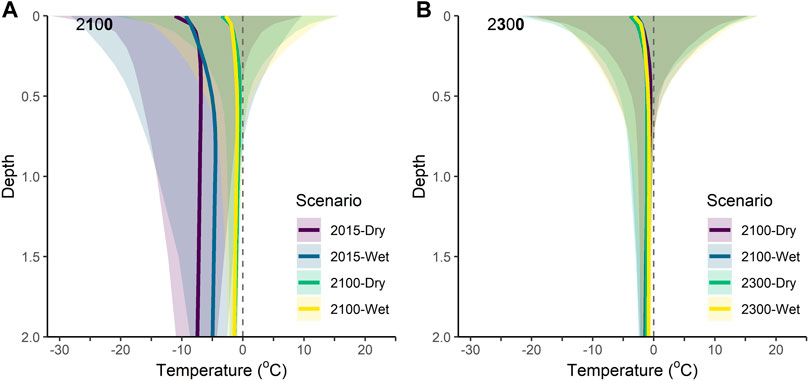
FIGURE 3. Distribution of modeled peat temperatures at TKP for Dry and Wet Landscape scenarios for time periods: (A) 2015 (mean from 2006 to 2015) and 2100 (mean from 2091 to 2100); (B) 2100 (mean from 2091 to 2100) and 2300 (mean from 2291 to 2300). Heavy lines represent the mean annual peat temperatures, while the shaded areas represent the temperature range between the mean minimum annual and mean maximum annual temperature over the periods of interest.
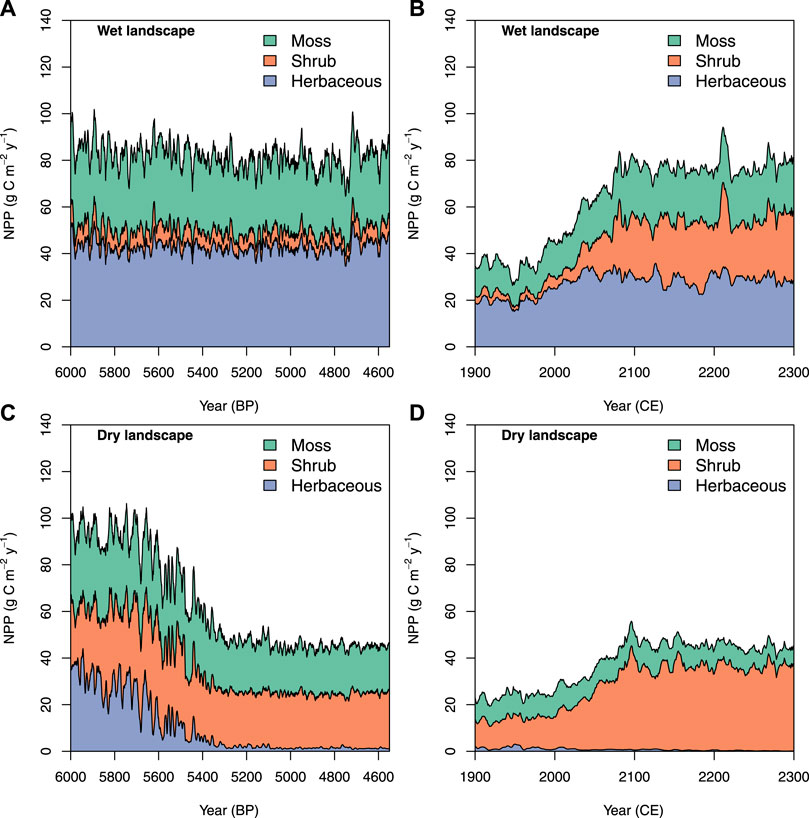
FIGURE 4. Modeled net primary productivity for moss, shrub, and herb plant functional types in the wet (top) and dry (bottom) landscape scenarios for two time periods: 6,000 BP–4,550 BP (left) and between 1900 and 2300 CE (right). (A) Wet landscape scenario, 6000 - 4550 BP; (B) Wet landscape scenario, 1900 - 2300 CE; (C) Dry landscape scenario, 6000 - 4550 BP; (D) Dry landscape scenario, 1900 - 2300 CE.
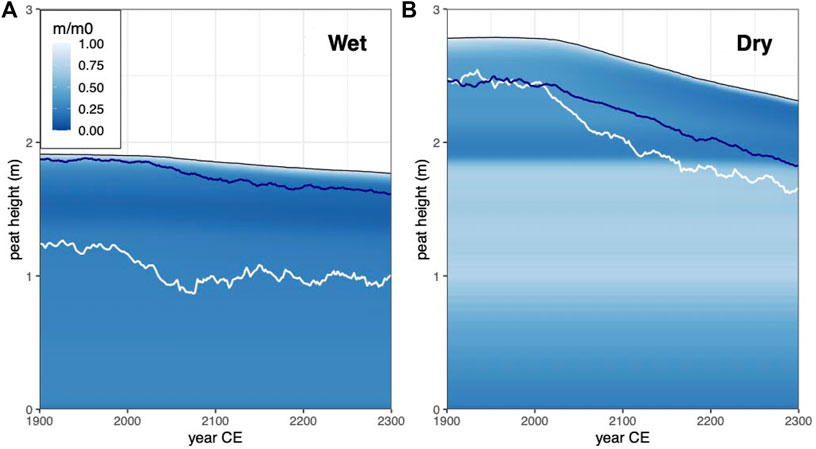
FIGURE 5. Future projections of peat profiles at TKP under RCP8.5 using two different values of model parameter for the height when run-on switches to run-off (Hrun-on/off): (A) Hrun-on/off = 4.5 results in a wetter peat profile with a water table (blue line) near the peat surface; (B) Hrun-on/off = 0.5 results in a drier peat profile and an unsaturated active layer. All other parameters and climate drivers were the same between the two simulations. The white line represents top of permafrost; m/m0 represents the peat litter cohort mass remaining, high values indicating relatively undecomposed peat.
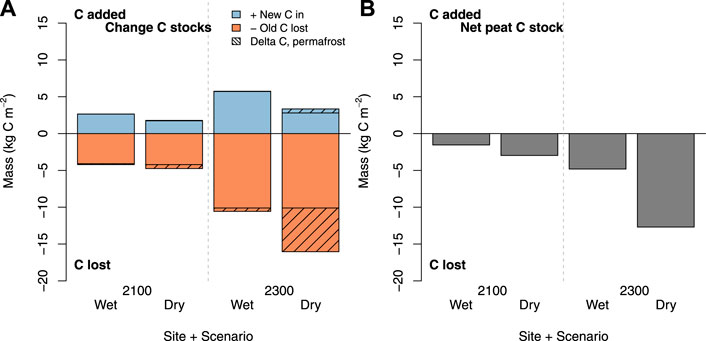
FIGURE 6. Simplified peat profile diagrams for changes in C stock for the two landscape scenarios (Wet, Dry) in 2100 CE and 2300 CE relative to 2015 CE. (A) Changes in C stocks, including new peat C added (blue) and old peat C lost (orange). The amount of new peat added or old peat lost from permafrost is indicated by the black diagonal stripes. New C additions and old carbon losses are defined as peat deposited before 2015 (old) or after 2015 (new). (B) Net change in peat C stocks in the two landscape scenarios for the two time periods. All scenarios showed a net peat C loss.
Under the assumption that 21st century warming stabilized between 2100 and 2300 CE, the peat temperatures at TKP differed little between 2100 and 2300 CE in the two scenarios, and were still cold enough to maintain permafrost (Figure 3B). However, active layer thickness decreased by roughly 10 cm between 2100 and 2300 in both scenarios (Table 2), as the decrease in peat height (5–30 cm) due to net peat loss (decomposition) exceeded the gradual thawing at the top of the permafrost peat (Figure 5). Still, an additional ∼10 cm of permafrost peat thawed in both scenarios between 2100 and 2300. Net C losses by 2300 were larger than in 2100 as the increase in NPP and net peat accumulation were smaller than the decomposition of the old carbon (Figure 6). These C losses represented a small to moderate fraction of total peat C stocks which is in rough agreement with other high Arctic cold and wet sites (Elberling et al., 2013). Overall, these findings agree with earlier studies that projected larger permafrost C losses at 2300 than 2100, and show that these net losses are dependent on both new C sequestration in the soil and old permafrost C losses (Figure 6).
By 2100, warmer soil temperatures resulted in increased peat decomposition as well as thawing of the top permafrost. The peat loss resulted in lower total peat height, which actually decreased the modeled active layer thickness from 0.9 to 0.8 m (Figure 5). Changes in the active layer thickness, along with increased evapotranspiration, resulted in a ∼12 cm deeper water table (Table 2). NPP increased 70% by 2100 relative to 2015, with the shrub share of productivity increasing from <10% to 30% (Figure 4A). In both 2015 and 2100, NPP was ∼50% larger in the wet than the dry scenario due to productivity of mosses and herbaceous species. Despite a decrease in the total peat height, only a small net loss of peat from the active layer was indicated by the relatively constant value of m/m0 at a particular peat height above the active layer (Figure 5A). New peat C accumulations from net primary productivity offset more than 60% of old C loss (defined as peat C accumulated before 2015), resulting in a net C loss in the wet scenario of −1.6 kg Cm−2 by 2100 (Figure 6).
The relatively stable forcing air temperature between 2100 CE and 2300 CE resulted in no significant change in NPP in the wet scenario. Decomposition of old peat in the active layer continued due to warmer temperatures, resulting in projected net C losses of −5 kg Cm−2 by 2300 CE (Figure 6). Little C was lost from the permafrost in the wet scenario (<0.4 kg Cm−2). The total old C losses represented a small fraction (5%) of total peat C stocks by 2300 CE.
Between 2015 and 2100, peats below 0.3 m warmed more in the dry than the wet landscape scenario (Figure 3). The modeled active layer thickness increased from 0.5 to 0.8 m by 2100 (Figure 5) and the water table depth increased by ∼12 cm. NPP increased by 80% and was primarily driven by increased NPP in shrubs, while NPP of mosses and herbaceous species declined (Figure 4B). Modeled peat loss occurred in the active layer over a longer time period between 2000 and 2300 (Figure 5B), but subsidence was not strong enough to result in an increase in the water table level relative to the surface (Table 2; Figure 5). 21st century warming and drying related to lower water table resulted in most of the active layer peat further decomposing (darkening of active layer peat in Figure 5B). This resulted in a net decrease in peat height of >0.1 m (Figure 5B) as the increased decomposition resulted in both net peat loss and an increase in bulk density of the remaining peat in the active layer (2015 mean: 75 kg OM m−3; 2100 mean: 90 kg OM m−3). Despite thawing of more than 40 cm of permafrost peat (Figure 5B), only −0.5 kg Cm−2 was lost from newly thawed permafrost peat by 2100, representing 15% of net C loss (Figure 6). The smaller NPP (Figure 4B) along with enhanced decomposition due to warmer, drier conditions (Figure 5B), led to smaller net accumulation of new peat, which offset only 35% of the already larger losses of old C (Figure 6). The projected net C loss in the dry scenario was −3.0 kg Cm−2 by 2100, nearly double the losses in the wet scenario.
The relatively stable forcing air temperature between 2100 CE and 2300 CE resulted in a 20% decrease in NPP in the dry scenario as the water table continued to drop (Figures 4, 5; Table 2). Projected net C losses were −13 kg Cm−2 by 2300, which represents 15% of the total peat C stock. Strong net losses of old permafrost C (−6 kg Cm−2) represented ∼40% of the net C loss by 2300.
In this modeling study, an important result was that permafrost formation and stability was strongly influenced by the parameter that represents the regional hydrology and the wetland connectivity to the watershed, Hrun-on/off (Figure 1). Specifically, Hrun-on/off represents the height of the peat when the peatland stops receiving run-on from the surrounding landscape and begins to shed water via run-off, as occurs in domed bogs (Charman, 2002). While the Hrun-on/off parameter was important for maintaining a shallow water table level, for example representing wetlands that are still connected to the surrounding watershed (Woo and Young, 2006), it also controlled rates of peat accumulation through feedbacks between the water table position and the peat thermal properties, which influenced the thickness of the active layer and ultimately decomposition rates. Peat accumulation results from rates of productivity exceeding rates of decomposition. During the period of exceptional high peat accumulation rates between peat initiation in 5700 BP to 4550 BP (Figure 1D), NPP in the wet landscape was on average 50% greater than the dry landscape NPP (Figures 4A,C), yet Figure 1D shows that peat accumulation rates are >2.5 times larger for this dry landscape scenario. Since the differences in peat accumulation that can be attributed to differences in productivity would favor the wet scenario, the observed difference must be due to slower rates of decomposition.
In peatlands, hydrology controls the decomposition rates through two mechanisms: oxygen availability (the standard peat situation of saturation and slow decomposition) and peat thermodynamics. Peat thermodynamics controls soil temperature and therefore, permafrost formation and active layer thickness. Permafrost formation and active layer thickness, in turn, controls decomposition rates, which are very low to negligible in permafrost (Schädel et al., 2016). In the dry landscape scenario during rapid peat accumulation, these effects on thermodynamics (i.e., shallower active layer) are stronger than the effects of substantially higher aerobic decomposition rates occurring in the peat acrotelm.
In this study, vertical peat accumulation was ultimately governed by the residence time of peat in the active layer, or the length of time when peat can be decomposed before it is frozen into the permafrost (Figure 1). In these permafrost systems, the active layer depth rather than acrotelm controlled decomposition in dry peats so that decomposition was limited not by the normal (in peatlands) anaerobic conditions but rather temperature limited by permafrost presence. The duration of time for decomposition (e.g., number of years with unfrozen conditions) in the active layer controlled the degree of peat decomposition, which has both a direct effect (loss of mass/material) and an indirect effect (increasing bulk density with increased humification). This effect is illustrated by contrasting patterns of peat accumulation and permafrost formation, with a higher degree of decomposition prior to permafrost preservation (Figure 1) and lower carbon loss with subsequent thaw in wetter conditions (Figure 6).
The higher degree of decomposition in the wet landscape scenario is related to the shallow water table, which results in a larger thermal mass, enhanced heat transfer to deeper peat and subsequently a deeper active layer (Figures 1, 5). In an analysis of active layer depth and soil water content data from sites across Alaska, Clayton et al. (2021) found that while active layer depth generally increased with increasing active layer soil water content, as water content in the top 12 cm of the soil increased the active layer also increased, and active layers also tended to be deeper as soils became saturated. These exceptions reflect the conditions of the TKP wet scenario. With this deeper active layer, the residence time for a peat cohort within the active layer (transit time from the peat surface to the permafrost surface) was about 1,000 ± 100 years or more (Supplementary Figure S2). By then the peat was highly decomposed, had lost most of its original litter mass (mean: ∼73% mass loss), and the organic matter density was near the maximum, resulting in less peat thickness per unit mass of peat and a shallower peat profile (Figure 2B), and relatively low rates of peat accumulation (overall: 2.9 mm decade−1; Figure 1C).
In contrast, when the peatland began to shed water earlier in its development, the drier peat, deeper water table, and resultingly shallow active layer led ultimately to deeper peat with lower organic matter density (Figures 1, 2). These results show that higher peat accumulation and preservation can occur with a deep water table and dry peat surface, which are usually associated with low rates of peat accumulation such as those found in permafrost palsas and bogs (Treat et al., 2016a). Notably, the rapid peat accumulation rates simulated during c.5700–4550 BP were not due to years of very high accumulation (i.e., >2 mm y−1 or 20 mm decade−1), but rather no years of decomposition that exceeded litter input. In contrast, negative accumulation years were common during other periods during the dry scenario and the entire wet scenario (Figures 1C,D). These results illustrate an important role for the decomposition of older peat (roughly 200–800 years in this case) found in the deeper active layer and overall C balance of the peatlands more generally.
Contrasts between wet and dry landscape scenarios (Figure 1) present a possible explanation for how rapid rates of peat accumulation could occur as a result of shallow and relatively rapid permafrost formation in dry peat. This rapid permafrost aggradation coupled with a shallow active layer provides an alternative, or additional, explanation to the hypothesis that high rates of peat accumulation are driven primarily by enhanced seasonality attributed to solar insolation in the early Holocene (Lavoie and Richard, 2000; Jones and Yu, 2010). In a core, the rapid peat accumulation in permafrost would appear as well-preserved, relatively undecomposed peat at depth; unfortunately, the profile description from TKP is not detailed enough to determine whether this is observed in-situ but this seems unlikely given the relatively good agreement between the TKP core and the wet scenario (Figure 2; Table 1). Future work could focus on testing this hypothesis.
Other Arctic peat deposits support the hypothesis for rapid peat accumulation under dry permafrost conditions. Peat cores collected in a polar desert (1980–2010 MAAT: −17.1°C; Canadian Climate Normals, Environment Canada, Alert Station) on Northern Ellesmere Island, Canada at southern Piper Pass show extensive (>3 m thick) peat deposits that formed on the edges of steep banks during the mid-Holocene (LaFarge-England et al., 1991). High peat accumulation rates of 12–38 mm decade−1 are associated with well-preserved plant macrofossils, indicating the rapid incorporation of peat into permafrost before it decomposes (syngenetic permafrost). The species assemblage indicates periods of dominant xeric moss species followed by soligeneous fen mosses and vascular plant species. These dry, well-drained conditions supported peat formation primarily through snowmelt water inputs, which enabled vegetation and moss growth, and the rapid incorporation of this material into permafrost prior to decomposition, similar to the dry model scenario (Figures 1B, 5B).
Permafrost C vulnerability and resilience to warming in these simulations was determined by both the water table position (related to the landscape setting and regional hydrology) and the legacy of the peat profiles themselves. In the future scenario in the dry landscape setting, warming soil temperatures (Figure 3) released the temperature control on decomposition rates, which were multiplied by aerobic conditions in the peat acrotelm (Figure 5). The legacy effect of previous decomposition also affected the vulnerability: the lower degree of decomposition in peat currently residing at the top of the permafrost in the dry landscape setting (Figure 5), when combined with a strong increase in peat temperature (Figure 3), increases the peat vulnerability to decomposition with permafrost thaw (Figure 6). Similar results have been shown in incubations of permafrost peat, where poorly decomposed peat in the permafrost is decomposed at similar rates to peats from the active layer (Treat et al., 2014). The dry conditions also decrease the resilience of these peatlands through lower rates of productivity (Figure 4), which are unable to offset losses of peat C (Figure 6), ultimately leading to substantially higher predicted net C loss, e.g., higher C vulnerability with permafrost thaw than in the wet landscape scenario (Figure 6). Therefore, while soil temperatures also warmed, anaerobic conditions associated with hydrology (Figure 5, high WT) and higher NPP (Figure 4; driven by less drought stress) led to lower net C losses (Figure 6).
Under wetter conditions, more humified peat accumulated more slowly due to a longer residence time in the active layer (Figure 1, Supplementary Figure S2), but then was more resilient against C loss in future scenarios (Figure 6). This was due to increases in vegetation productivity enabled by sufficient moisture (Figure 4) and smaller decomposition peat losses (Figure 5).
We note that the model simulations presented here have some limitations to assessing permafrost vulnerability: they currently do not include abrupt permafrost thaw, which will likely affect ice-rich permafrost peatlands (Olefeldt et al., 2016) and strongly alter ecosystem function and C exchange (Turetsky et al., 2020). If abrupt thaw results in a water table closer to the surface, this could potentially enhance vegetation productivity similar to the outcome in the wet landscape scenario (e.g., Camill et al., 2001: Figure 4) which might offset more of the peat C losses (Figure 6). Changes to the regional hydrology in the future due to permafrost thaw have a key role in the future vulnerability but are very difficult to predict (Quinton et al., 2010).
Some field studies in Alaska have shown substantial differences in the observed peat C dynamics after permafrost thaw that could be explained by timing of permafrost aggradation and peat accumulation demonstrated by the modeling scenarios. In Southwestern Alaska, permafrost peatland sites at Innoko and Koyukuk showed evidence of syngenetic permafrost aggradation within the peat (Jones et al., 2017; O'Donnell et al., 2012). At the APEX Bog site in interior Alaska, permafrost aggraded millennia after peat accumulation (e.g., epigenetic permafrost; Manies et al., 2021). Following permafrost thaw, substantially less carbon was lost from the epigenetic permafrost site than the syngenetic sites that accumulated peat and permafrost simultaneously (Jones et al., 2017; Manies et al., 2021). In the modeled scenarios, rapid permafrost accumulation in the dry scenario (e.g., syngenetic formation) showed carbon losses with warming that were nearly twice that of the wet scenario (Figure 6), where the longer residence time in a non-frozen state allowed for greater decomposition and a less labile carbon source upon thaw (Figure 5). While the context differs from the modeled scenario presented here both in terms of permafrost history (significantly longer permafrost-free conditions at the epigenetic site in the chronosequence) and permafrost thaw (abrupt thaw instead of active layer deepening), these model results provide a plausible explanation for these differing vulnerabilities of these permafrost peatlands.
The main result shown here is that wet and dry landscape settings can result in different peat accumulation histories and peat qualities, even in the same climate setting (Figure 1). If the active layer depth is shallow (dry landscape scenario), peat is less degraded before freezing into the permafrost and so is more susceptible to enhanced decomposition upon permafrost thaw. Because the wet scenario experienced greater decomposition prior to making it into the permafrost, less of it decomposes following thaw. Both peat accumulation history and peat quality have implications for peat C loss in future warming scenarios (Figures 5, 6) due to both permafrost thaw and also legacy effects. To simulate this in a model requires permafrost dynamics (common to many models) and peat stratigraphy, i.e., resolving the peat quality (degree of humification or decomposition) down the peat profile into the permafrost. This probably does not necessarily require annual litter cohorts as used in HPM-Arctic, but a single or just a few peat pools would probably not characterize the peat quality accurately enough.
Very few models simulate peat accumulation over millennia in the permafrost zone. This is a complex task for most earth system models as only a few incorporate peatlands into their land surface schemes (Kleinen et al., 2012; Largeron et al., 2018; Qiu et al., 2018; Chaudhary et al., 2020), and millennial length earth system model simulations are computationally costly. Often, the peatlands are initialized using datasets for timing and peatland extent. Here, we show that key parameters for determining carbon vulnerability and feedbacks, such as peat thickness, bulk density, and humification, must be considered and may vary depending on permafrost history. Some of these important uncertainty factors may be quantifiable from the global peat core databases (Loisel et al., 2014; Treat et al., 2016a; Treat et al., 2016b), but this may require details that many researchers may not have included their analyses. A first step would be to determine whether the hypothesis presented here (dry landscape setting, presence of permafrost, and shallow active-layer depth coincident with rapid peat accumulation) can be evaluated with existing peat core data, and if so, to determine whether these conditions can be associated with landscape topography and climate conditions in a way that provides some predictive power for peat initialization.
Furthermore, it is important to keep in mind that future peat vulnerability to climate change is related to several factors: thaw rate, subsequent water table dynamics, and nature of thawing peat (i.e., susceptibility to further decomposition, which may depend on both the inherent tissue lability of the plants comprising the peat and the degree of humification upon freezing into the permafrost. While this study only addresses this final point, we show that decomposition processes (i.e., degree of decomposition and litter quality) are quite important for both peat accumulation rates and post-thaw carbon losses.
Ultimately, the differences in past C accumulation rates and future C losses between these wet and dry landscape setting scenarios were driven by the model parameterization representing the regional hydrology, including the water inputs from the surrounding watershed and the runoff to downstream areas. By demonstrating the differences in peat profiles between the wet and dry scenarios using the same climate drivers, as well as an inter-site comparison between two sites with contrasting hydrology (TKP and southern Piper Pass), these results suggest that permafrost behavior and peat profiles are strongly dependent on landscape characteristics controlling hydrology (Woo and Young, 2006). The regional hydrology and wetland basin characteristics subsequently determined both peat accumulation history and future changes in peat organic matter stocks with permafrost thaw and on-going warming. These findings point to the importance of considering regional hydrology and wetland basin characteristics due to their controls on wetland hydrology, which will likely be a major control on the response of permafrost carbon in peatlands to warming and permafrost thaw. This study highlights the limitations for accurately predicting changes in C balance in response to permafrost thaw without careful hydrologic assessments. This presents a significant challenge for global-scale models and future emphasis would be better placed on improving hydrologic assessments at local to regional scales.
The datasets presented in this study can be found in online repositories. The names of the repository/repositories and accession number(s) can be found below: The observations used for model validation can be accessed (https://doi.org/10.1594/PANGAEA.863697); the dataset key (Variable: Auth.Site.CoreID) for TKP is VAR-TKP-01. The model code, parameters, and climate driver data are available from: https://doi.org/10.5281/zenodo.4647666.
CT and SF designed the study and performed the model experiments. JA provided the climate driver data. CT, MJ, and SF analysed and interpreted the data and wrote the paper with input from all authors.
This study was supported by the United States National Science Foundation (#1802825, CT and SF), ERC-H2020 #851181 FluxWIN (CT), the Helmholtz Impulse Initiative and Networking Fund (CT), the Fulbright Finland and Saastamoinen Foundations (SF), USGS Climate and Land-use Change R&D Program (JA and MJ).
The authors declare that the research was conducted in the absence of any commercial or financial relationships that could be construed as a potential conflict of interest.
All claims expressed in this article are solely those of the authors and do not necessarily represent those of their affiliated organizations, or those of the publisher, the editors and the reviewers. Any product that may be evaluated in this article, or claim that may be made by its manufacturer, is not guaranteed or endorsed by the publisher.
We thank Lesleigh Anderson, Steve Hostetler, and two reviewers for constructive comments on this manuscript. We acknowledge earlier field work and analysis done by SR Vardy and BG Warner at Thelon-Kazan Peatlands, Nunavut, Canada.
The Supplementary Material for this article can be found online at: https://www.frontiersin.org/articles/10.3389/fenvs.2022.892925/full#supplementary-material
Brown, J., Ferrians, O. J., Heginbottom, J. A., and Melnikov, E. S. (1998, revised 2001). Circum-Arctic Map of Permafrost and Ground-Ice Conditions. Boulder, CO: National Snow and Ice Data Center/World Data Center for Glaciology, Digital Media.
Camill, P., Lynch, J. A., Clark, J. S., Adams, J. B., and Jordan, B. (2001). Changes in Biomass, Aboveground Net Primary Production, and Peat Accumulation Following Permafrost Thaw in the Boreal Peatlands of Manitoba, Canada. Ecosystems 4 (5), 461–478. doi:10.1007/s10021-001-0022-3
Chaudhary, N., Westermann, S., Lamba, S., Shurpali, N., Sannel, A. B. K., Schurgers, G., et al. (2020). Modelling Past and Future Peatland Carbon Dynamics across the pan‐Arctic. Glob. Change Biol. 26 (7), 4119–4133. doi:10.1111/gcb.15099
Clayton, L. K., Schaefer, K., Battaglia, M. J., Bourgeau-Chavez, L., Chen, J., Chen, R. H., et al. (2021). Active Layer Thickness as a Function of Soil Water Content. Environ. Res. Lett. 16 (5), 055028. doi:10.1088/1748-9326/abfa4c
Elberling, B., Michelsen, A., Schädel, C., Schuur, E. A. G., Christiansen, H. H., Berg, L., et al. (2013). Long-term CO2 Production Following Permafrost Thaw. Nat. Clim. Change 3 (10), 890–894. doi:10.1038/nclimate1955
Flato, G. M., Marotzke, J., and Abiodun, B. (2013). “Evaluation of Climate Models,” in Climate Change 2013: The Physical Science Basis. Contribution of Working Group I to the Fifth Assess- Ment Report of the Intergovernmental Panel on Climate Change. T. F. Stocker, D. Qin, G-K. Plattner, M. Allen, S. Boschung, J. Nauelset al. (Cambridge, UK: Cambridge University Press), 741–866.
Frolking, S., Roulet, N. T., Tuittila, E., Bubier, J. L., Quillet, A., Talbot, J., et al. (2010). A New Model of Holocene Peatland Net Primary Production, Decomposition, Water Balance, and Peat Accumulation. Earth Syst. Dynam. 1 (1), 115–167. doi:10.5194/esd-1-1-2010
Frolking, S., Roulet, N. T., Moore, T. R., Richard, P. J. H., Lavoie, M., and Muller, S. D. (2001). Modeling Northern Peatland Decomposition and Peat Accumulation. Ecosystems 4 (5), 479–498. doi:10.1007/s10021-001-0105-1
Gent, P. R., Danabasoglu, G., Donner, L. J., Holland, M. M., Hunke, E. C., Jayne, S. R., et al. (2011). The Community Climate System Model Version 4. J. Clim. 24 (19), 4973–4991. doi:10.1175/2011jcli4083.1
Harris, I., Jones, P. D., Osborn, T. J., and Lister, D. H. (2014). Updated High-Resolution Grids of Monthly Climatic Observations - the CRU TS3.10 Dataset. Int. J. Climatol. 34 (3), 623–642. doi:10.1002/joc.3711
Harris, S. A., French, H. M., Heginbottom, J. A., Johnston, G. H., Ladanyi, B., Sego, D. C., et al. (1988).Glossary of Permafrost and Related Ground-Ice Terms. Technical Memorandum No. 142. Ottawa, CA: National Research Council of Canada, 154.
Hugelius, G., Loisel, J., Chadburn, S., Jackson, R. B., Jones, M., MacDonald, G., et al. (2020). Large Stocks of Peatland Carbon and Nitrogen Are Vulnerable to Permafrost Thaw. Proc. Natl. Acad. Sci. 117 (34), 20438–20446. doi:10.1073/pnas.1916387117.201916387
Hugelius, G., Strauss, J., Zubrzycki, S., Harden, J. W., Schuur, E. A. G., Ping, C.-L., et al. (2014). Estimated Stocks of Circumpolar Permafrost Carbon with Quantified Uncertainty Ranges and Identified Data Gaps. Biogeosciences 11 (23), 6573–6593. doi:10.5194/bg-11-6573-2014
Jones, M. C., Harden, J., O'Donnell, J., Manies, K., Jorgenson, T., Treat, C., et al. (2017). Rapid Carbon Loss and Slow Recovery Following Permafrost Thaw in Boreal Peatlands. Glob. Change Biol. 23 (3), 1109–1127. doi:10.1111/gcb.13403
Jones, M. C., and Yu, Z. (2010). Rapid Deglacial and Early Holocene Expansion of Peatlands in Alaska. Proc. Natl. Acad. Sci. 107 (16), 7347–7352. doi:10.1073/pnas.0911387107
Kanevskiy, M., Jorgenson, T., Shur, Y., O'Donnell, J. A., Harden, J. W., Zhuang, Q., et al. (2014). Cryostratigraphy and Permafrost Evolution in the Lacustrine Lowlands of West-Central Alaska. Permafr. Periglac. Process. 25 (1), 14–34. doi:10.1002/ppp.1800.n/a-n/a
Kleinen, T., Brovkin, V., and Schuldt, R. J. (2012). A Dynamic Model of Wetland Extent and Peat Accumulation: Results for the Holocene. Biogeosciences 9 (1), 235–248. doi:10.5194/bg-9-235-2012
LaFarge-England, C., Vitt, D. H., and England, J. (1991). Holocene Soligenous Fens on a High Arctic Fault Block, Northern Ellesmere Island (82 Degrees N), N.W.T., Canada. Arct. Alp. Res. 23 (1), 80–98. doi:10.2307/1551441
Largeron, C., Krinner, G., Ciais, P., and Brutel-Vuilmet, C. (2018). Implementing Northern Peatlands in a Global Land Surface Model: Description and Evaluation in the ORCHIDEE High-Latitude Version Model (ORC-HL-PEAT). Geosci. Model Dev. 11 (8), 3279–3297. doi:10.5194/gmd-11-3279-2018
Lavoie, M., and Richard, P. J. (2000). The Role of Climate on the Developmental History of Frontenac Peatland, Southern Quebec. Can. J. Bot. 78, 668–684. doi:10.1139/b00-043
Liu, Z., Otto-Bliesner, B. L., He, F., Brady, E. C., Tomas, R., Clark, P. U., et al. (2009). Transient Simulation of Last Deglaciation with a New Mechanism for Bølling-Allerød Warming. Science 325 (5938), 310–314. doi:10.1126/science.1171041
Loisel, J., Yu, Z., Beilman, D. W., Camill, P., Alm, J., Amesbury, M. J., et al. (2014). A Database and Synthesis of Northern Peatland Soil Properties and Holocene Carbon and Nitrogen Accumulation. Holocene 24 (9), 1028–1042. doi:10.1177/0959683614538073
Manies, K. L., Jones, M. C., Waldrop, M. P., Leewis, M. C., Fuller, C., Cornman, R. S., et al. (2021). Influence of Permafrost Type and Site History on Losses of Permafrost Carbon after Thaw. J. Geophys. Res. Biogeosciences 126 (11), e2021JG006396. doi:10.1029/2021jg006396
Marchenko, S., Romanovsky, V., and Tipenko, G. (2008). “Numerical Modeling of Spatial Permafrost Dynamics in Alaska,” in Ninth International Conference On Permafrost. Fairbanks, AK. Editors D. L. Kane, and K. M. Hinkel (Fairbanks, AK, United States: Institute of Northern Engineering, University of Alaska Fairbanks), 1125–1130.
McGuire, A. D., Lawrence, D. M., Koven, C., Clein, J. S., Burke, E., Chen, G., et al. (2018). Dependence of the Evolution of Carbon Dynamics in the Northern Permafrost Region on the Trajectory of Climate Change. Proc. Natl. Acad. Sci. 115, 3882–3887. doi:10.1073/pnas.1719903115
Mishra, U., Hugelius, G., Shelef, E., Yang, Y., Strauss, J., Lupachev, A., et al. (2021). Spatial Heterogeneity and Environmental Predictors of Permafrost Region Soil Organic Carbon Stocks. Sci. Adv. 7 (9), eaaz5236. doi:10.1126/sciadv.aaz5236
Nichols, J. E., and Peteet, D. M. (2019). Rapid Expansion of Northern Peatlands and Doubled Estimate of Carbon Storage. Nat. Geosci. 12 (11), 917–921. doi:10.1038/s41561-019-0454-z
O'Donnell, J. A., Jorgenson, M. T., Harden, J. W., David McGuire, A., Kanevskiy, M. Z., and Wickland, K. P. (2012). The Effects of Permafrost Thaw on Soil Hydrologic, Thermal, and Carbon Dynamics in an Alaskan Peatland. Ecosystems 15, 213–229. doi:10.1007/s10021-011-9504-0
Olefeldt, D., Goswami, S., Grosse, G., Hayes, D., Hugelius, G., Kuhry, P., et al. (2016). Circumpolar Distribution and Carbon Storage of Thermokarst Landscapes. Nat. Commun. 7, 13043. doi:10.1038/ncomms13043
Qiu, C., Zhu, D., Ciais, P., Guenet, B., Krinner, G., Peng, S., et al. (2018). ORCHIDEE-PEAT (Revision 4596), a Model for Northern Peatland CO2, Water, and Energy Fluxes on Daily to Annual Scales. Geosci. Model Dev. 11 (2), 497–519. doi:10.5194/gmd-11-497-2018
Quinton, W. L., Hayashi, M., and Chasmer, L. E. (2009). Peatland Hydrology of Discontinuous Permafrost in the Northwest Territories: Overview and Synthesis. Can. Water Resour. J. 34 (4), 311–328. doi:10.4296/cwrj3404311
Quinton, W. L., Hayashi, M., and Chasmer, L. E. (2010). Permafrost-thaw-induced Land-Cover Change in the Canadian Subarctic: Implications for Water Resources. Hydrol. Process. 25, 152–158. doi:10.1002/hyp.7894
Rouse, W. R., Lafleur, P. M., and Griffis, T. J. (2000). Controls on Energy and Carbon Fluxes from Select High-Latitude Terrestrial Surfaces. Phys. Geogr. 21 (4), 345–367. doi:10.1080/02723646.2000.10642714
Rydin, H., and Jeglum, J. K. (2006). Biology of Peatlands. Oxford, UNITED KINGDOM: Oxford University Press.
Schädel, C., Bader, M. K. F., Schuur, E. A. G., Biasi, C., Bracho, R., Čapek, P., et al. (2016). Potential Carbon Emissions Dominated by Carbon Dioxide from Thawed Permafrost Soils. Nat. Clim. Change 6 (10), 950–953. doi:10.1038/nclimate3054
Schuur, E. A. G., McGuire, A. D., Schädel, C., Grosse, G., Harden, J. W., Hayes, D. J., et al. (2015). Climate Change and the Permafrost Carbon Feedback. Nature 520 (7546), 171–179. doi:10.1038/nature14338
Taylor, K. E., Stouffer, R. J., and Meehl, G. A. (2012). An Overview of CMIP5 and the Experiment Design. Bull. Am. Meteorological Soc. 93 (4), 485–498. doi:10.1175/bams-d-11-00094.1
R Development Core Team (2008). R: A Language and Environment for Statistical Computing. Vienna, Austria: R Foundation for Statistical Computing.
Treat, C. C., Jones, M. C., Alder, J., Britta, A., Sannel, K., Camill, P., et al. (2021). Predicted Vulnerability of Carbon in Permafrost Peatlands with Future Climate Change and Permafrost Thaw in Western Canada. J. Geophys. Res. 126, e2020JG005872. doi:10.1029/2020jg005872
Treat, C. C., Jones, M. C., Camill, P., Gallego‐Sala, A., Garneau, M., Harden, J. W., et al. (2016a). Effects of Permafrost Aggradation on Peat Properties as Determined from a pan‐Arctic Synthesis of Plant Macrofossils. J. Geophys. Res. Biogeosci. 121 (1), 78–94. doi:10.1002/2015jg003061
Treat, C. C., Jones, M. C., Camill, P., Gallego‐Sala, A., Garneau, M., Harden, J. W., et al. (2016b). Data supplement to: Effects of Permafrost Aggradation on Peat Properties as Determined from a pan‐Arctic Synthesis of Plant Macrofossils. J. Geophys. Res. Biogeosciences 121 (1), 78–94. doi:10.1002/2015JG003061.PANGAEA
Treat, C. C., and Jones, M. C. (2018). Near-surface Permafrost Aggradation in Northern Hemisphere Peatlands Shows Regional and Global Trends during the Past 6000 Years. Holocene 28 (6), 998–1010. doi:10.1177/0959683617752858
Treat, C. C., Wollheim, W. M., Varner, R. K., Grandy, A. S., Talbot, J., and Frolking, S. (2014). Temperature and Peat Type Control CO 2 and CH 4 Production in Alaskan Permafrost Peats. Glob. Change Biol. 20 (8), 2674–2686. doi:10.1111/gcb.12572
Turetsky, M. R., Abbott, B. W., Jones, M. C., Anthony, K. W., Olefeldt, D., Schuur, E. A. G., et al. (2020). Carbon Release through Abrupt Permafrost Thaw. Nat. Geosci. 13 (2), 138–143. doi:10.1038/s41561-019-0526-0
Vardy, S. R., Warner, B. G., Turunen, J., and Aravena, R. (2000). Carbon Accumulation in Permafrost Peatlands in the Northwest Territories and Nunavut, Canada. Holocene 10 (2), 273–280. doi:10.1191/095968300671749538
Vardy, S., Warner, B., and Asada, T. (2005). Holocene Environmental Change in Two Polygonal Peatlands, South-Central Nunavut, Canada. Boreas 34 (3), 324–334. doi:10.1080/03009480510013033
Woo, M. K., and Young, K. L. (2006). High Arctic Wetlands: Their Occurrence, Hydrological Characteristics and Sustainability. J. Hydrology 320 (3-4), 432–450. doi:10.1016/j.jhydrol.2005.07.025
Keywords: permafrost, peatlands and wetlands, tundra, peat accumulation, Holocene, ecological modeling
Citation: Treat CC, Jones MC, Alder J and Frolking S (2022) Hydrologic Controls on Peat Permafrost and Carbon Processes: New Insights From Past and Future Modeling. Front. Environ. Sci. 10:892925. doi: 10.3389/fenvs.2022.892925
Received: 09 March 2022; Accepted: 05 May 2022;
Published: 31 May 2022.
Edited by:
Xiaodong Wu, Chinese Academy of Sciences (CAS), ChinaReviewed by:
Kuang-Yu Chang, Berkeley Lab (DOE), United StatesCopyright © 2022 Treat, Jones, Alder and Frolking. This is an open-access article distributed under the terms of the Creative Commons Attribution License (CC BY). The use, distribution or reproduction in other forums is permitted, provided the original author(s) and the copyright owner(s) are credited and that the original publication in this journal is cited, in accordance with accepted academic practice. No use, distribution or reproduction is permitted which does not comply with these terms.
*Correspondence: Claire C. Treat, Q2xhaXJlLnRyZWF0QGF3aS5kZQ==
Disclaimer: All claims expressed in this article are solely those of the authors and do not necessarily represent those of their affiliated organizations, or those of the publisher, the editors and the reviewers. Any product that may be evaluated in this article or claim that may be made by its manufacturer is not guaranteed or endorsed by the publisher.
Research integrity at Frontiers
Learn more about the work of our research integrity team to safeguard the quality of each article we publish.