 Mingshun Xiang1,2†
 Jin Yang1,2*
 Wenheng Li1
 Yueting Song3
 Chunjian Wang1,2
 Yan Liu1,2
 Mengli Liu1
 Yuxiang Tan1
- 1College of Tourism and Urban-Rural Planning, Chengdu University of Technology, Chengdu, China
- 2Research Center for Human Geography of Tibetan Plateau and its Eastern Slope, Chengdu University of Technology, Chengdu, China
- 3School of Earth Sciences, China University of Geosciences, Wuhan, China
Being closely related to ecosystem services, land use changes can affect ecosystem service functions by acting on ecosystem patterns and its processes, thus having impact on regional sustainable development. Taking the Western Sichuan Plateau as the study area based on land use data from 1990 to 2020, the CA-Markov model was employed to predict the land use pattern under natural change scenarios, and the improved InVEST model and equivalent method were used to evaluate the ecosystem services in the study area from two different perspectives, as to analyze the evolution trend. The results show that: 1) From 1990 to 2020, the carbon storage in the Western Sichuan Plateau showed a fluctuating increase, with an average annual increase of 3.17 × 10⁷ t, of which the total contribution rate of woodland and grassland to the total carbon storage exceeded 95%. In recent 30 years, the carbon storage of the Western Sichuan Plateau has little spatial variation, with the increase and decrease regions accounting for less than 5% with overall sporadically dots-like distribution. 2) Ecosystem Service Value (ESV) increased by 1.36 × 10¹⁰ yuan in the past 30 years, which was similar to carbon storage and showed a wave-like increase; the contribution rate of woodland to the total ESV of the study area was more than 68%, occupying the dominant position. ESV was generally stable in the past 30 years, and the area with significant changes accounted for less than 9%, mainly located in the northeast and southwest of the study area. 3) In the next 10 years, under the current ecological protection measures, the carbon storage and ESV of the Western Sichuan Plateau will increase by 5.3980 × 10⁷ t and 2.4087 × 10⁹ yuan compared with that of 2020, indicating a positive development of ecosystem service function. This study results provides a scientific basis for the adjustment of land use structure and the management decision of ecological environment protection in the Western Sichuan Plateau.
1 Introduction
Land is the material foundation of human production and life, and is the closest part between human and nature (Ye and Zhang, 2008; Zhang et al., 2021). As an important component and driving factor of global ecological environment change (Zhang et al., 2021), land use change comprehensively reflects the interaction process of various factors within the terrestrial ecosystem, has great significance in regional ecosystem service function, and is one of the important factors affecting human survival and development. With the continuous change of land use pattern, regional ecosystem service function will also change accordingly.
Ecosystem service function, which refers to the benefits that people get from the ecosystem through material flow and energy flow, is an important function of the ecosystem on the external environment (Costanza et al., 2014). Costanza et al. (1997) are the first to identify the theory and method of calculating ESV globally. In recent years, Xie et al. (2015) modified the estimation method proposed by Costanza based on the reality of China, put forward the ESV evaluation equivalence system, and constructed a dynamic evaluation method of terrestrial ecosystem value in China based on the equivalent factor approach of unit area value. The equivalent factor approach of unit area value has been greatly applied in the dynamic monitoring and evaluation of ecosystems such as urban ecosystem (Dai et al., 2021), wetland ecosystem (Zhou et al., 2020), watershed ecosystem (Temesgen et al., 2018), and farmland ecosystem (Fang et al., 2017).
At the same time, the carbon sink capacity of terrestrial ecosystems plays a leading role in the global carbon cycle, atmospheric CO2 absorption and global climate change (Houghton, 2003). There is a response relationship between carbon storage and land use change, and land use change is usually accompanied by a large amount of carbon exchange (Vizaino-Brawvo et al., 2020). Therefore, studying ecosystem service function from carbon storage has become a new perspective. Until now, the research method of ecosystem service carbon storage based on InVEST model and the ecosystem service function evaluation method combined with the CA-Markov model have also been widely used (He et al., 2016; Jiang et al., 2017; Li et al., 2021). Its research fields mainly include the relationship between land use change and carbon density in watershed (Zhao et al., 2019), carbon storage change caused by urban expansion and simulation prediction (Firozjaei et al., 2019), ESV change and ecological function improvement model in mountainous areas (He et al., 2021), and spatiotemporal change characteristics of ecological restoration projects and carbon storage in plateau areas (Li et al., 2021). According to relevant research results, the InVEST model requires little data and runs fast. It can master the spatial distribution and dynamic change of carbon storage from spatiotemporal scale, reflect the relationship between land use change and carbon storage, and realize the dynamic evaluation of ecological service function (Hou et al., 2018).
As early studies on ecosystem service function are mostly focused on the present and the past, there are fewer simulation predictions for the future (Liu et al., 2021), which provided insufficient support for ecological environmental protection and management. The artificial neural network (Li and Yeh, 2005; Lei et al., 2012), CLUE-S (Zhang et al., 2014; Tian and Ren, 2012), SLEUTH (Nigussie and Altunkaynak, 2016; Nigussie and Altunkaynak, 2019), CA-Markov (Liu et al., 2019; Wang et al., 2020; Matlhodi et al., 2021) and other prediction models is applied in the study of land use evolution, especially CA-Markov model that predicts the change trend of land use in the future based on land use transfer matrix and land use data. The CA-Markov model can not only effectively simulate spatial change in land use, but also improve the prediction accuracy of land use type transformation, which overcomes the shortcomings of traditional land evolution simulation models (Zhang et al., 2017) and greatly promotes the prediction study of ecosystem service function evolution. Gaglio et al. (2019) evaluated the ecosystem service function of Paul do Boquilobo in 1967, 1990 and 2015, and further simulated and evaluated the ecosystem service function under two different situations of “high productivity agriculture” and “complete natural vegetation coverage” in 2050. Liu et al. (2021) used InVEST model and CA-Markov model to predict and analyze the spatiotemporal change and evolution trends of carbon storage in Shule River Basin, and considered that the growth of grassland, cropland and woodland area was the main reason for the increase of regional carbon storage. Gao et al. (2021) estimated the change of ESV based on the land use data of Shijiazhuang City in 1988, 1998, 2008 and 2018, and simulated the change of ESV in 2030 under three different situations by using CA-Markov, so as to provide scientific guidance for the construction of urban network. Gashaw et al. (2018) estimated land use land cover (LULC) change and its impact on ESV of Andassa Watershed of the Upper Blue Nile Basin, and predicted ESV change from 2018 to 2045, which provides a basis for the decision-making of regional ecological protection.
In recent years, great importance was attached to ecosystem service researches which yielded solid outcomes. However, a majority of researches was only evaluated from ESV, lacking effective comparison of multiple methods, resulting in relatively single outcomes, and significantly fewer researches on the ecological service function of alpine plateau area. The Western Sichuan Plateau is Located at the southeastern edge of Qinghai-Tibet Plateau, which is a typically eco-environment fragile and climatically sensitive area in China. It is also an important ecological barrier and water conservation area in the upper reaches of Yangtze River and Yellow River, and has a significant ecological status (Wu et al., 2021; Zhong et al., 2021). Facing the combined impact of climate change, natural disasters and human activities, ecosystem service function in the Western Sichuan Plateau have changed significantly, but the temporal and spatial differences are still unclear. In this context, this paper chooses the Western Sichuan Plateau as the study area and introduces CA-Markov model to predict the land use types in 2030. Based on the improvement of the unit area value equivalent factor method and InVEST model, the temporal and spatial evolution characteristics of the ecological service function in the study area were compared and analyzed from the perspectives of ESV and carbon storage, as to analyze the possible future ecological environment issues and find the key prevention and control area. The research results are conducive to understand the evolution characteristics and future development trend of the ecosystem in the Western Sichuan Plateau, provide theoretical basis for the rational utilization of land resources and the protection of ecological environment, and promote ecological protection and regional high-quality development in ecologically fragile areas.
2 Overview and Research Methods of the Study Area
2.1 Overview of the Study Area
With an area of about 2.59 × 10⁵ km2, the Western Sichuan Plateau (27.11°–34.31°N and 97.36°–104.62°E) is located in the transition zone between Qinghai-Tibet Plateau and Sichuan Basin, including 31 counties under the jurisdiction of Garze Tibetan Autonomous Prefecture and Aba Tibetan and Qiang Autonomous Prefecture, and Muli County, Yanyuan County, and part of Mianning County of Liangshan Yi Autonomous Prefecture. As a part of the ecological barrier of the Qinghai-Tibet Plateau, the Western Sichuan Plateau has outstanding ecological functions such as water conservation, soil and water conservation, biodiversity maintenance and climate regulation, so it is also one of the hotspots of biodiversity protection in the world. With the elevation ranging from 780 to 7556 m and large topographic fluctuations, the study area is dominated by high mountain valleys and high mountain plateaus. With annual precipitation about 556.8–730 mm and temperature about 9.01–10.5°C, the climate in the study area is subtropical plateau monsoon climate with obvious geographical differences. The study area is rich in water resources, including the Yalong River, Dadu River, Min River, and other important river systems in the upper reaches of the Yangtze River, and the Baihe River, Heihe river and other river systems of the Yellow River (Figure 1). The main vegetation types are alpine meadow, shrub, coniferous forest, broad-leaved forest, etc., which makes the study area the most coniferous forest types in China. The main types of soil are plateau meadow soil, dark brown soil, brown soil, cold frozen soil, and cinnamon soil, and these five types account for more than 85% of the total area of the study area.
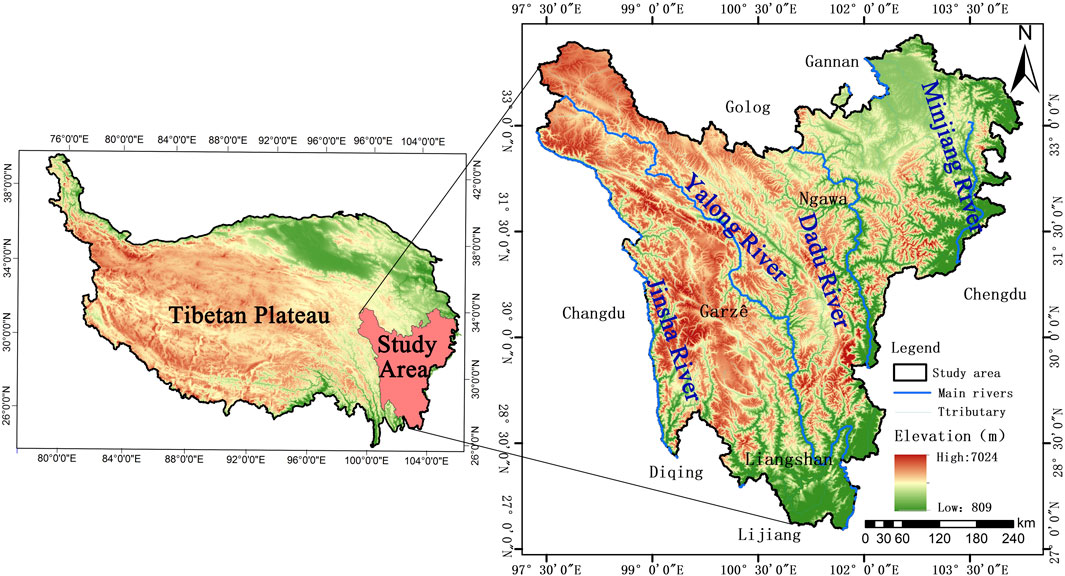
FIGURE 1. Location of the study area.
2.2 Data Sources and Processing
The land use remote sensing monitoring data, administrative boundary data and geological disaster vector data were obtained from Resources and Environmental Science and Data Center (http://www.resdc.cn/). The spatial resolution of land use remote sensing monitoring data is 30 m × 30 m, including six first-level classification and 26 second-level classification. The first-level classification includes cropland, woodland, grassland, water body, built-up land, and unused land. The accuracy of remote sensing classification is not less than 95% for cropland and built-up land, not less than 90% for grassland, woodland, and water body, and not less than 85% for unused land, which meets the need of the research. After pre-processing such as merging, cropping and reclassification, the land use classification maps for seven periods of 1990, 1995, 2000, 2005, 2010, 2015 and 2020 were obtained. The geological disaster data with 12,192 geological disasters in number covered the period from 1990 to 2020. By making combined analysis with both ESV and carbon storage layers, the impact of geological disasters on ecosystem service function was estimated.
The DEM data were obtained from the Geospatial Data Cloud (http://www.gscloud.cn/) with a spatial resolution of 30 m × 30 m. The Qinghai-Tibetan Plateau boundary data were collected from the Global Change Research Data Publishing and Repository (http://www.geodoi.ac.cn/WebCn/Default.aspx). Data of carbon density of different land types were obtained from Chinese Ecosystem Research Network Data Center (http://www.nesdc.org.cn/). Meteorological data such as rainfall and temperature came from China Climate Bulletin (http://zwgk.cma.gov.cn/). Social and economic data such as grain output per unit area and sown area of crops mainly came from China Statistical Yearbook and Sichuan Statistical Yearbook, while grain price came from Sichuan Grain Network (http://www.scgrain.com/). All the data were entered into GIS geodatabase after preprocessing.
2.3 Research Method
2.3.1 Evaluation of Ecosystem Service
Costanza et al. (1997) clarified the principles and methods of evaluating the value of ecosystem service, and then Xie et al. (2003) proposed the Chinese Ecological Service Value Equivalent Factor Approach based on the research of Costanza. This study is based on the ESV equivalent table per unit area proposed by Xie et al. (2015). China’s average grain output per unit area in 2020 was kg·hm−2, while the average grain output in the Western Sichuan Plateau was 3,422.53 kg·hm−2, and the average price of grain crops was 2,670 yuan·hm−2. Since the economic value provided by the natural ecosystem is one seventh of the economic value of food output service provided by the existing cropland per unit area, the economic value of the ESV equivalent factor of the Western Sichuan Plateau after modified is determined as 1,305.45 yuan·hm−2, and then the ESV per unit area of the Western Sichuan Plateau was obtained (Table 1).
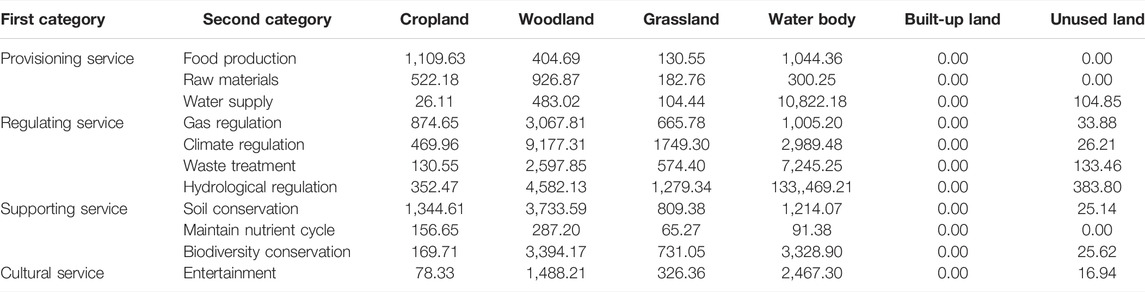
TABLE 1. Average ESV of per—hectare of land in the Western Sichuan plateau (yuan·hm−2).
The formula for calculating the value of ecosystem services in the study area is:
Where ESV represents the ESV (yuan); S represents the area (hectares) of land use type i in the study area, and VC represents the ESV coefficient (yuan·hm−2) per unit area of the ecosystem type i.
2.3.2 Carbon Storage Evaluation Based on INVEST Model
The carbon storage model of the InVEST model divides the carbon storage of the ecosystem into four basic carbon pools, namely above-ground carbon, underground carbon, soil carbon, dead organic matter carbon. The carbon exchange between different carbon pools in terrestrial ecosystems and the atmosphere is shown in Figure 2 (InVEST 3.2.0 User’s guide).
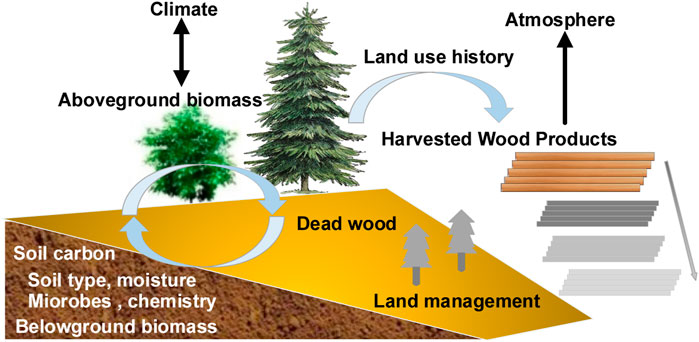
FIGURE 2. Carbon exchange between carbon pool and the atmosphere.
The calculation formula of total carbon storage in the Western Sichuan Plateau is as follows:
Where Ctotal is the total carbon storage; Cabove is the above-ground carbon storage; Cbelow is the underground carbon storage; Csoil is the soil carbon storage, and Cdead is the dead organic matter carbon storage.
Based on the carbon density and land use data of different land use type, the carbon storage of each land use type in the Western Sichuan Plateau is calculated by the formula:
Where i is the average carbon density of each land use, and Ai is the area of this land used.
The carbon density data of different land use types in this study were obtained from the shared date of the National Ecological Science Data Center and some documents (Chen et al., 2002; Li et al., 2003; Xie et al., 2004; Chuai et al., 2013; Zhang et al., 2018). Since the carbon density data were collected from the results of studies in different parts of China, the selected documents should be close to or be similar to the study area as far as possible to avoid excessive data gap. At the same time, the carbon density varies with climate, soil properties and land use (Fu et al., 2019), so the carbon density should be modified according to the climate characteristics and land use types of the Western Sichuan Plateau. Existing research results show that the carbon density is positively correlated with annual precipitation and weakly correlated with annual average temperature. The quantitative expression of the relationship between carbon density and temperature and precipitation is as follows (Raich and Nadelhoffer, 1989; Giardina and Ryan., 2000; Chen et al., 2007; Alam et al., 2013).
Where CSP is the soil carbon density (kg.m−2) based on the annual precipitation; CBP is the biomass carbon density (kg.m−2) based on the annual precipitation; CBT is the biomass carbon density (kg.m−2) based on annual average temperature; P is the average annual precipitation (mm), and T is the annual average temperature (°C). In the past 30 years, the average annual temperature of China and the Western Sichuan Plateau was 9.0 and 6.3 °C, and the average annual precipitation was 643.50 and 812.65 mm respectively. The product of the carbon density data of the reference documents and the modified indices is the carbon density data of the Western Sichuan Plateau.
The modified formula of carbon density in the Western Sichuan Plateau is as follows:
Where KBP is the modified indices of precipitation factor in biomass carbon density; KBT is the modified indices of temperature factor; C′BP and C″BP are the biomass carbon density obtained from annual precipitation in the Western Sichuan Plateau and the whole country respectively. C′BT and C″BT are the biomass carbon density obtained from annual average temperature; C′SP and C″SP are the soil carbon density data obtained from annual average temperature; KB and KS are the biomass carbon density modified indices and soil carbon density modified indices respectively. The carbon density values of each land use type after modified in the Western Sichuan Plateau are shown in Table 2.
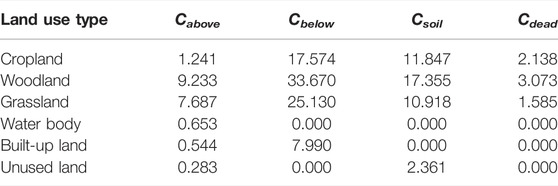
TABLE 2. Carbon density values of different land use types in the Western Sichuan plateau (t·hm−2).
2.3.3 CA-Markov Model
CA-Markov model, the main tool to simulate Land-Use and Land-Cover Change (LUCC) (Sang et al., 2010), combines Cellular Automata (CA) and Markov model and uses transition probability matrix to simulate the change of land use over time. Markov model simulates the matrix of land use change over time by calculating the probability of land use transfer in the first and second phases for predicting the subsequent changes on this basis (Zhao et al., 2019). The calculation formula is as follows (Nasehi et al., 2019):
Where St, and St + 1 is the land use state during t and t + 1 respectively; Pij is the transition probability matrix, and n is the land use type.
CA model can simulate the spatiotemporal evolution of land use, can reflect the local interaction of system evolutionary dynamics (Wang et al., 2021) and simulate random, nonlinear, and spatial change trends. This makes up for the failure of Markov model to identify the spatial variability of land use (Wickramasuriya et al., 2009). CA model is represented as follows:
Where s is the set of finite and discrete states of the cell; f is the conversion rule function of the cell state; N is the neighborhood of each cell; t and t + 1 are two different moments.
The year 2010 was taken as the starting timefor prediction to simulate the land use situation in the study area in 2030, and Kappa coefficients were used to test the simulation results. Using CROSSTAB model IDRISR 17.0, the Kappa coefficients of 2010 are 0.929, indicating good simulation effect (Liu et al., 2021; Yang et al., 2021) and the verified CA-Markov can be used to predict land use in 2030.
Combined with The Regional Ecological Construction and Environmental Protection Plan of The Qinghai-Tibet Plateau (2011–2030), we took the year 2010 as the starting time for prediction, thus the data to land use in 2020 was calculated. By comparison the prediction results and the actual data to land use in 2020, we concluded that the Kappa coefficients were 0.929, indicating that the simulation result was working well (Liu et al., 2021; Yang et al., 2021). On this basis, the data to land use in 2030 was worked out with taking the year 2020 as the starting time for prediction. All predictions conducted are based on natural variation scenarios, without limiting factors.
2.3.4 Analysis Method for Changes in Ecological Service Functions
This study uses exploratory spatial analysis to reveal the spatial agglomeration types and autocorrelation of ecosystem service function changes in the Western Sichuan Plateau. The global Moran’s I is used for global autocorrelation measurement and examination, and its calculation formula is as follows (Lei et al., 2020):
Where n is the number of grids; xi and xj are the attribute values of grid i and j respectively; x is the average value of attributes; wij is the spatial weight matrix. If Moran’s I is significantly positive, it indicates that there is a spatial positive correlation of ESV; otherwise, there is a spatial negative correlation; when Moran’s I is 0, it indicates random distribution.
Kernel density was used to estimate the spatial clustering of ecological service change in different periods. The higher the kernel density value, the greater the intensity of regional changes and the more obvious the clustering characteristics (Liu et al., 2015).
Where f (x,y) is the density estimation at the location (x, y); n is the number of ecological service function change points; x−Xi is the distance between the location and the i-th observation location, and h is the bandwidth.
3 Results and Analysis
3.1 Change Characteristics of Land Use in the Study Area From 1990 to 2020
The data to land use in western Sichuan Plateau from 1990 to 2020 was shown in Figure 3.
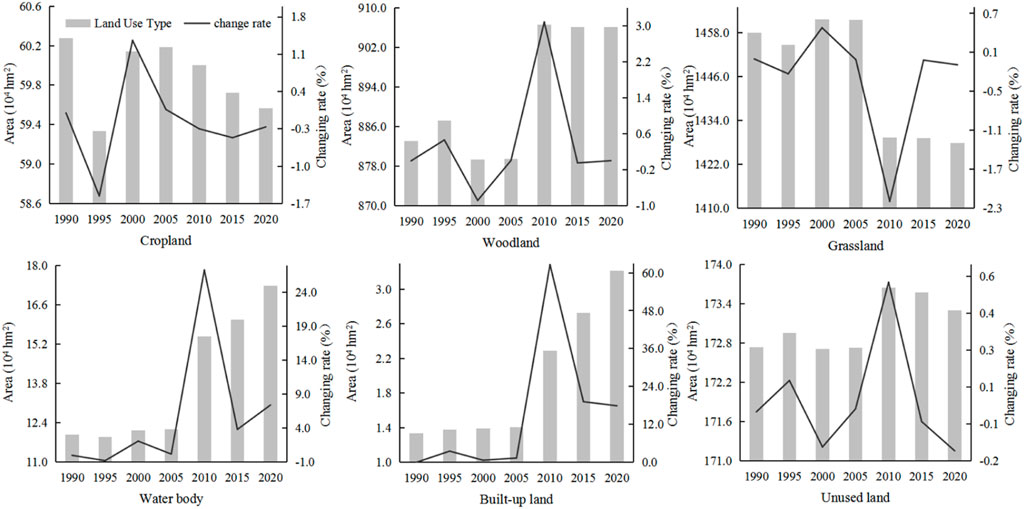
FIGURE 3. Land use of the Western Sichuan Plateau from 1990 to 2020.
From 1990 to 2020, grassland occupied more than 55% of the study area. While woodland area followed, accounting for about 44%. The coverage rate of unused land, cropland, water body and built-up land was relatively low, accounting for less than 10% of the study area. Throughout the past three decades years, the area of each region changed to varying degrees, with the biggest change in the area of the built-up land which increased by 141.38%. Then, the water body area continued to rise, with a cumulative increase of 44.11%. Woodland and unused land reflected a fluctuating rise, with the largest increase occurring from 2005 to 2010. The area of cropland and grassland decreased by 1.17 and 2.06%, respectively. Cropland area dropped significantly from 1990 to 1995, and grassland area from 2005 to 2010. In general, the continuous increase area of built-up land and water body was witnessed as the result of population growth and extensive human activities. By implementing policy of returning farmland to forest and protecting natural forest, the area of woodland continued to rise. At the same time, geological disasters and human activities led to some grassland degradation, and increased area of unused land.
3.2 Spatiotemporal Change Characteristics of Carbon Storage in the Study Area From 1990 to 2020
3.2.1 Overall Change Characteristics of Carbon Storage
The carbon storage of the Western Sichuan Plateau from 1990 to 2020 were calculated respectively, and the carbon storage of different land use types and total carbon storage of the study area in each year are shown in Table 3.
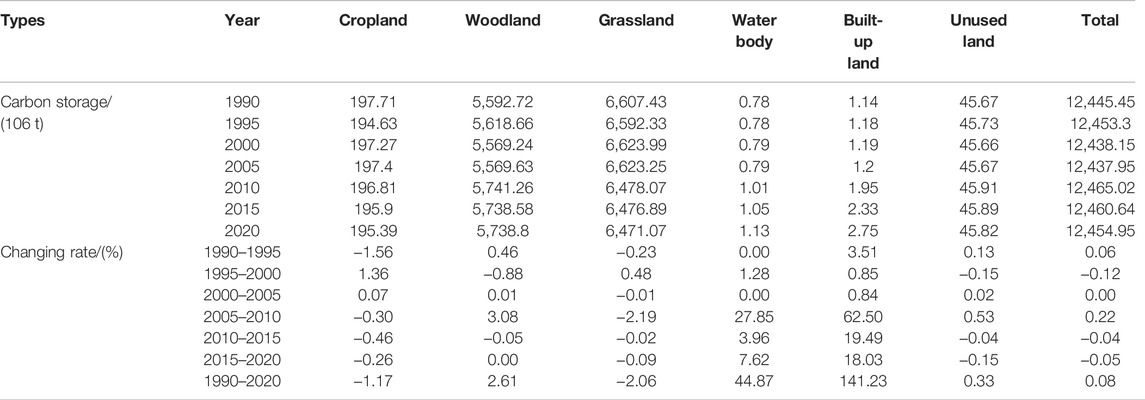
TABLE 3. Carbon storage of the Western Sichuan Plateau from 1990 to 2020.
As shown in Table 3, the carbon storage of the Western Sichuan Plateau from 1990 to 2020 is 1.2445 × 10¹⁰ t, 1.2453 × 10¹⁰ t, 1.2438 × 10¹⁰ t, 1.2438 × 10¹⁰ t, 1.2465 × 10¹⁰ t, 1.2461 × 10¹⁰ t, 1.2455 × 10¹⁰ t respectively, increased 3.1666 × 10⁷ t per year on average. Among them, the carbon storage slowly increased from 1990 to 1995, slightly decreased from 1995 to 2005, increased relatively more from 2005 to 2010, and slowly decreased from 2010 to 2020, showing a fluctuating increasing trend of “increase-decrease-increase-decrease”.
From the perspective of land use types, the carbon storage of different land use types in different periods of the Western Sichuan Plateau has little change. In general, the carbon storage of woodland, water body, built-up land and unused land increased, among which the carbon storage of water body and built-up land increased significantly; the carbon storage of cropland and grassland decreased by 1.17 and 2.06% respectively in 2020 compared with 1990. In terms of the contribution of different land use types to the total carbon storage, the contribution rate is grassland, woodland, cropland, unused land, built-up land and water in a descending order. Woodland and grassland account for 34 and 56% of the total area of the study area respectively, and their carbon storage accounts for 45 and 53% of the total carbon storage, which are the main carbon pools in the study area.
From Table 3, it can be seen that the correlation between the total carbon storage and above-ground biological carbon storage is not significant in the Western Sichuan plateau. The main reason is that this area is dominated by grassland and woodland, and the high altitude, cold climate and relatively low precipitation prevent crops and forest grasses from fixing carbon on the ground for a long time due to withering and dying, resulting in insignificant correlation between above-ground carbon storage and total carbon due to depletion. The underground biological carbon storage, soil carbon storage and dead organic matter carbon are all significant positive correlation with total carbon stock. In conclusion, woodland and grassland represent the main carbon pools. That to say, the increase and decrease in the coverage of the two types of land serve as the main reason for the changes of regional carbon storage.
3.2.2 Spatiotemporal Change Characteristics of Carbon Storage
From the perspective of the spatial pattern of carbon storage in the Western Sichuan Plateau (Figure 4), there is no obvious difference in the spatial distribution of carbon storage from 1990 to 2020, and high carbon storage is distributed throughout the whole area. The carbon storage of the Yalong River, Dadu River and Min River is obviously high, which is closely related to the rich water resources and high forest coverage in this area. Areas with low carbon storage are sporadically distributed in the middle, west and north of the study area in the shape of dot and strip, mainly because water body and unused land occupy a relatively high proportion.
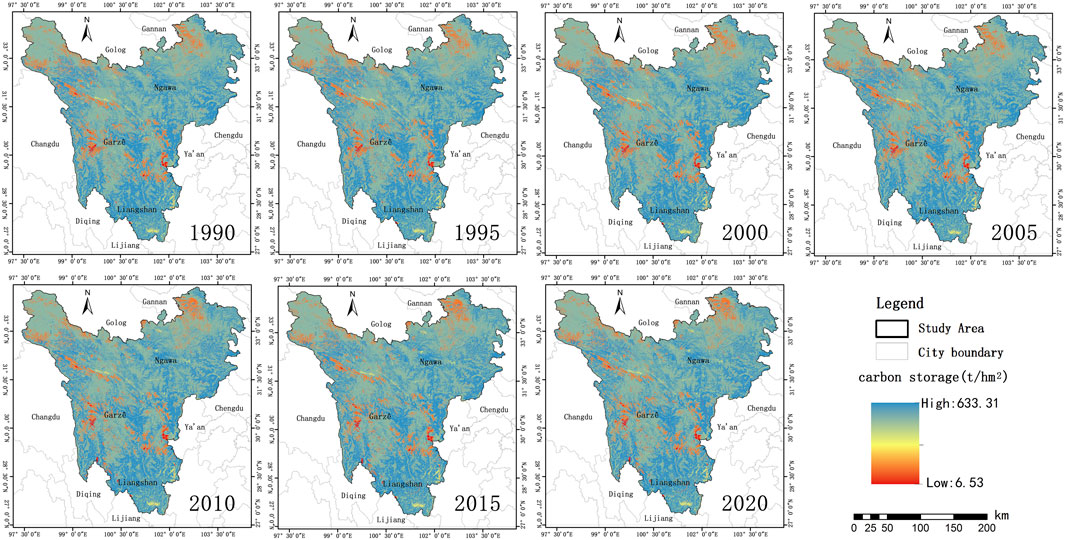
FIGURE 4. Temporal and spatial distribution of carbon storage during 1990–2020.
In order to further reflect the spatial change of carbon storage in the Western Sichuan Plateau from 1990 to 2020, the two periods of carbon storage distribution map in 2020 and 1990 were raster processed, with a raster size of 30 × 30 m. The Map Algebra tool of Arcgis was used to calculate the change of each raster. The carbon storage change value greater than 5% is defined as the increase region, the carbon storage change value less than −5% is defined as the decrease region, and the carbon storage change value between −5 and 5% is defined as no change region.
From Figure 5, it can be seen that the carbon storage in most areas of the Western Sichuan Plateau remained basically unchanged from 1990 to 2020. Statistics showed that the no change region is 2.3617 × 10⁷ hm2, accounting for 91.28% of the total area; the decrease region is 1.0439 × 10⁶ hm2, accounting for 4.03% of the total area; the increased area is 1.2131 × 10⁶ hm2, accounting for 4.69% of the total area. From the perspective of spatial distribution, the decrease and increase regions are scattered. The decrease regions are relatively concentrated in 10 counties such as Zoige County, Hongyuan County, Songpan County, Wenchuan County and Xiangcheng County, mainly because the carbon storage is reduced due to grassland degradation caused by climate change, mountain disasters and human activities (Liu et al., 2020). Areas with relatively concentrated increase of carbon storage are mainly located in Litang County, Daofu County, Sertar County and other counties, which are closely related to the benefits generated by the natural forest protection project.
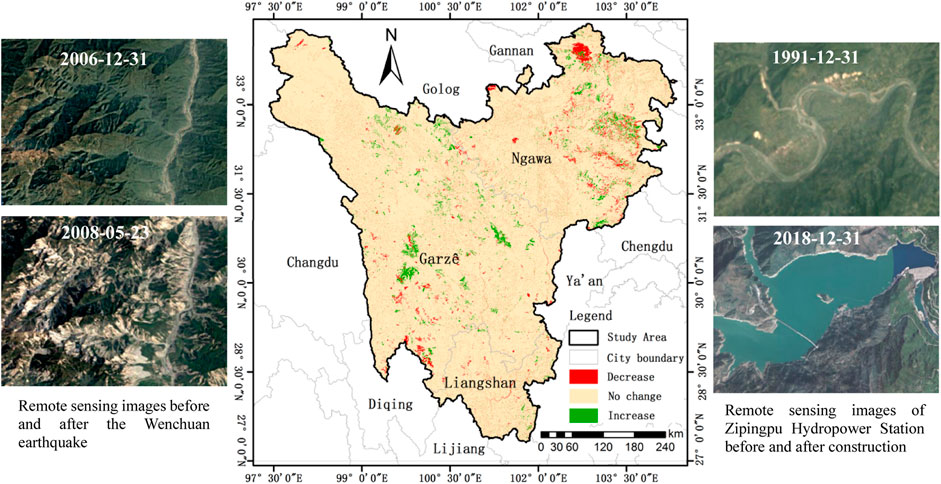
FIGURE 5. Spatial distribution changes of carbon storage during 1990–2020.
3.3 Spatiotemporal Change Characteristics of ESV in the Study Area From 1990 to 2020
3.3.1 Overall Change Characteristics of Ecological Service Value
Combining the land use data of the Western Sichuan Plateau, the ESV was calculated, and the ESV of different land use types from 1990 to 2020 were obtained (Table 4).
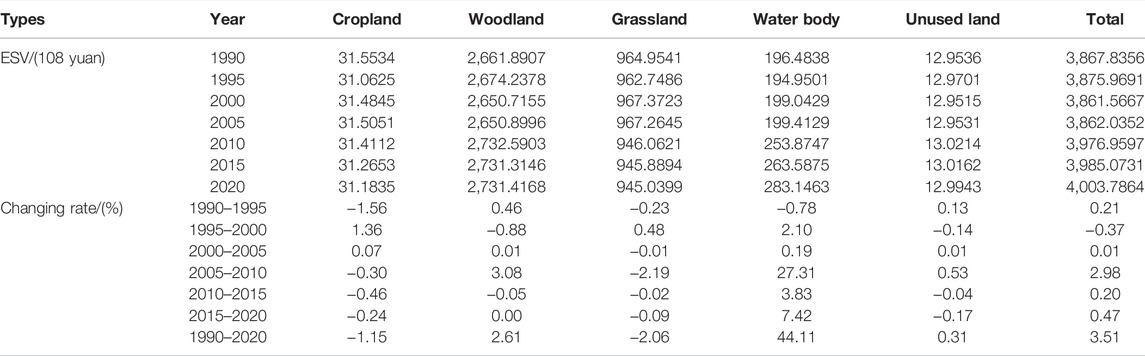
TABLE 4. ESV change of the Western Sichuan Plateau during 1990–2020.
From Table 4, it can be seen that the ESV of the Western Sichuan Plateau from 1990 to 2020 is 3,867.8356 × 108 yuan, 3,875.9691 × 108 yuan, 3,861.5667 × 108 yuan, 3,862.0352 × 108 yuan, 3,976.9597 × 108 yuan, 3,985.0731 × 108 yuan, 4,003.7864 × 108 yuan. With an increase of 135.9509 × 10⁸ yuan (3.29%) and an average annual increase of 4.5317 × 10⁸ yuan, the overall change of carbon storage in the Western Sichuan Plateau during the 30 years is not significant. From the trend of ESV changes, ESV increased slowly from 1990 to 1995, decreased slowly from 1995 to 2005, increased significantly from 2005 to 2010, and slowed down the increase trend from 2010 to 2020, presenting a fluctuation of “increase-decrease-increase” fluctuation state on the whole.
In terms of land use types, the ESV of different land use types in the Western Sichuan Plateau changed little in different periods. In general, the ESV of woodland, water body and unused land increased, and the increase trend of water body was the most obvious. The ESV of water body increased by 44.11% during the 30 years, which is partly related to the hydropower plant construction activities carried out in the Min River, Yalong River and Dadu River during the period. The ESV of cropland and grassland decreased slightly, decreasing by 1.15 and 2.06% respectively, which is related to the continuous expansion of built-up land during the period. From the perspective of the contribution of different land use types to regional ESV, the contribution rate of different land use types is woodland, grassland, water body, cropland and unused land in descending order, of which the woodland with a contribution rate of more than 68% is the main component of ESV in the study area. In summary, the service structure of the Western Sichuan Plateau remained generally stable. The varying coverage of water body and woodland is the most important cause for the change of regional ESV and spatial difference.
Among the second-level ecological service function value, the ecological service function value per unit area from low to high is nutrient cycle maintenance, raw material production, food production, aesthetic landscape, gas regulation, soil conservation, biodiversity, environmental purification, water supply, climate regulation and hydrological regulation, and the value of the following function from low to high is: nutrient cycle maintenance, food production, water supply, raw material production, aesthetic landscape, environmental purification, gas regulation, biodiversity, soil conservation, hydrological regulation and climate regulation. The structure of various service functions is basically stable from 1990 to 2020 (Figure 6). Among the first-level ecological service function value, the value of provisioning service is 16,161.8836 yuan/hm2; the value of regulating service is 170,808.0298 yuan/hm2; the value of supporting service is 15,376.7448 yuan/hm2, and the value of cultural service is 4,377.1408 yuan/hm2. The total value ratio of the four first-level ecological service functions was basically maintained at 6: 65: 23: 5, and the regulation service took an obvious advantage, indicating that ecological protection is the focus of the study area.
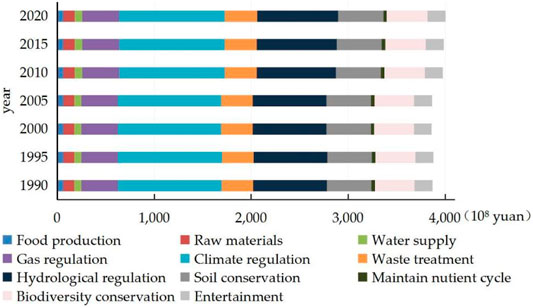
FIGURE 6. Structure comparison of secondary types of ESV during 1990–2020.
3.3.2 Spatial Change Characteristics of Ecological Service Value
From the perspective of spatial pattern of ESV (Figure 7), the spatial distribution characteristics of ESV are similar to carbon storage, showing the characteristics of “high in the south and low in the north” and “high in the east and low in the west”. The main reasons for the overall low ESV are the high altitude and cold climate in the north, and the main land use types are grassland and unused land. While in the east and south, the climate is relatively warm and humid and the main land use types are woodland and cropland. At the same time, the Min River, Dadu River, Yalong River and Jinshajiang River are the main rivers within the territory, which flow from north to south or southeast, so the ESV in the south and east is relatively high. From the perspective of time dimension, there is no significant difference in ESV between 1990 and 2020. The ecological advantages in the south and east still persist, and the regulating capacity of the ecosystem continues to be enhanced, indicating that the conservation and management of public welfare forests, natural forests and grassland resources implemented over the years show good ecological effects. In order to further identify the spatial differentiation characteristics of ESV in the Western Sichuan Plateau from 1990 to 2020, the distribution maps of ESV in 2020 and 1990 were raster processed and the raster size was 30 × 30 m to calculate the changes of ESV in each raster. The ESV change value greater than 5% is defined as the increase region, less than −5% is defined as the decrease region, and the ESV change value between −5 and 5% is defined as no change region.
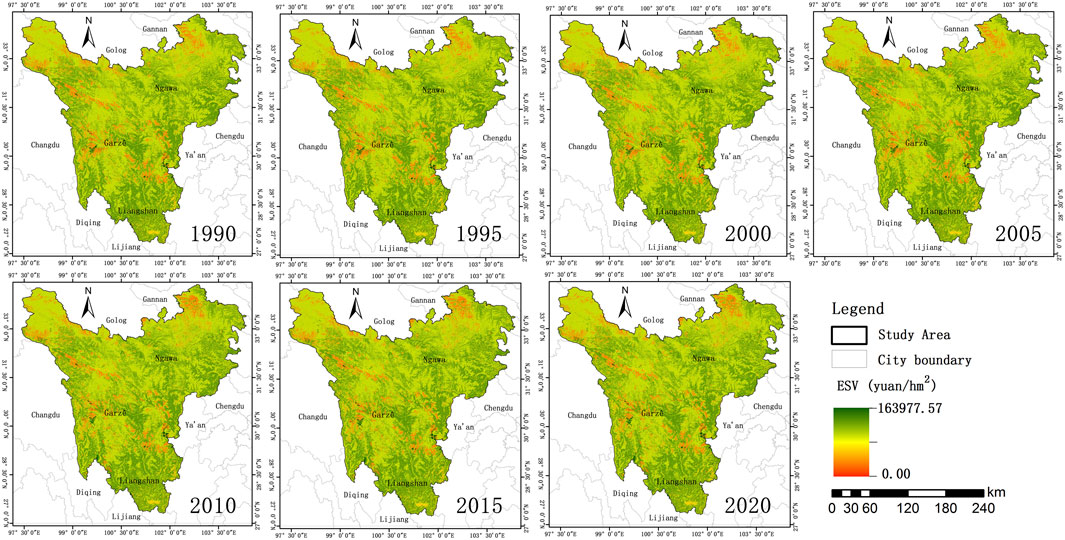
FIGURE 7. The spatial distribution of ESV during 2006–2020.
From Figure 8, it can be seen that there is no change of ESV in most areas of the Western Sichuan Plateau from 1990 to 2020, indicating that the Western Sichuan Plateau ecosystem is generally stable.
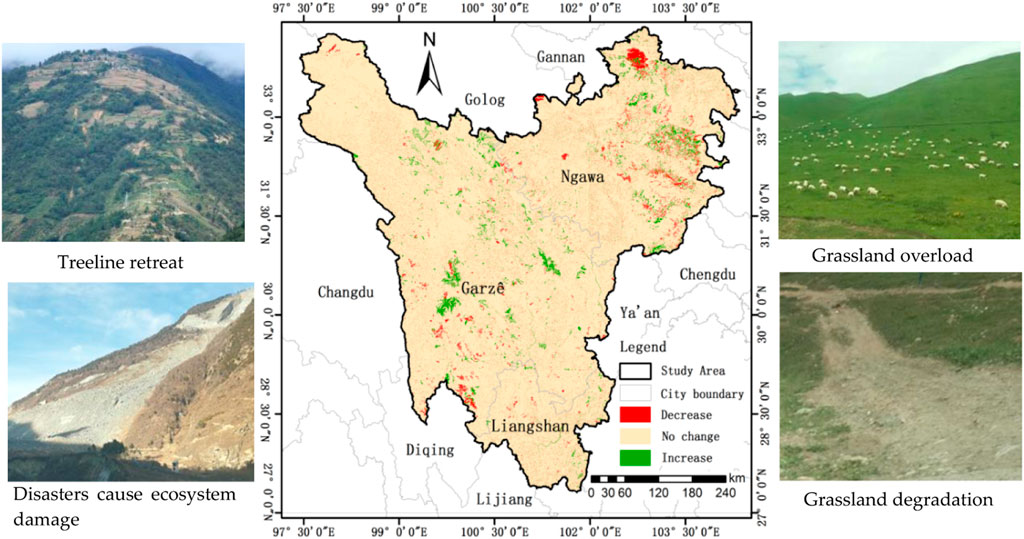
FIGURE 8. Spatial distribution changes of ESV during 1990–2020.
Statistics show that the no change region is 2.3617 × 10⁷ hm2, accounting for 91.28% of the total area; the decrease region is 9.9269 × 10⁵ hm2, accounting for 3.84% of the total area; and the increase region is 1.2644 × 10⁶ hm2, accounting for 4.89% of the total area. Areas in decrease region are sporadically distributed like dots, and the relatively concentrated areas are mainly located in the northeast and southwest of the study area. The main reason for the decrease of ESV in the northeast is that the over-loading rate of grassland was high before 2016, and the ecological function of some wetland and plateau lakes was degraded due to overgrazing. At the same time, the Min River Basin is densely covered with deep-cut alpine landforms, ravines and frequent natural disasters, especially the Wenchuan earthquake has caused serious damage to the regional ecological environment. The main reason for the decrease in the southwest is the early woodland degradation. Although major ecological projects such as returning farmland to forest and natural forest protection were actively implemented in the early stage, the problems such as low quality of forest system and low efficiency of forest ecological function were still prominent. Other sporadic reduction areas are mainly caused by the expansion of built-up land and human activities. The areas where ESV increases are mainly located in Litang County in the East and Daofu County in the middle, which is closely related to the increasing woodland area in these areas.
3.4 Simulation and Prediction of Ecosystem Service Function in the Western Sichuan Plateau in 2030
3.4.1 Land Use Changes of the Western Sichuan Plateau in 2030
Using the CA-Markov model in IDRISSI 17.0 to predict the land use of the western Sichuan plateau in 2030 under natural change scenario, and conclude the changes of different land use from 2020 to 2030. The result was displayed in Table 5.

TABLE 5. Land use of the western Sichuan plateau from 2020 to 2030.
From Table 5, under the natural change scenario, the area of woodland and built-up land will be further increased from 2020 to 2030, by 2.68 and 0.26% respectively. However, area of cropland, grassland, water body and unused land decreased to varying degrees, particularly the area of grassland and unused land, all of which covered more than 1% of the study area. In terms of transformation, the increased area of built-up land mainly came from cropland, while grassland, water body and unused land were mainly transformed into woodland.
3.4.2 Carbon Storage Changes of the Western Sichuan Plateau in 2030
The carbon storage of the Western Sichuan Plateau in 2030 was calculated respectively. Different land use types, the total carbon storage of the study area and the change rate of carbon storage from 2020 to 2030 are shown in Table 6.

TABLE 6. Carbon storage of the western Sichuan plateau from 2020 to 2030.
From Table 6, it can be seen that the carbon storage of the Western Sichuan Plateau in 2030 is 1.2509 × 10¹⁰ t, and the carbon storage increases by 5.2895 × 10⁷ t in 10 years, with an average increase of 5.2895 × 10⁶ t per year, indicating that the carbon storage of the Western Sichuan Plateau is increasing under the background of natural change. In terms of land use types, the carbon storage of cropland, grassland, water body and unused land decreased slightly, while the carbon storage change of built-up land was not obvious, and the carbon storage of woodland increased significantly, which is the main reason for the increase of total carbon storage in the study area from 2020 to 2030.
From the carbon storage spatial distribution of the Western Sichuan Plateau (Figure 9), the spatial pattern of carbon storage in 2030 does not change much compared with the period from 1990 to 2020. The high carbon storage areas are still distributed throughout the whole area, while the low carbon storage areas are distributed in the central, western and northern parts of the study area in a dotted and banded pattern.
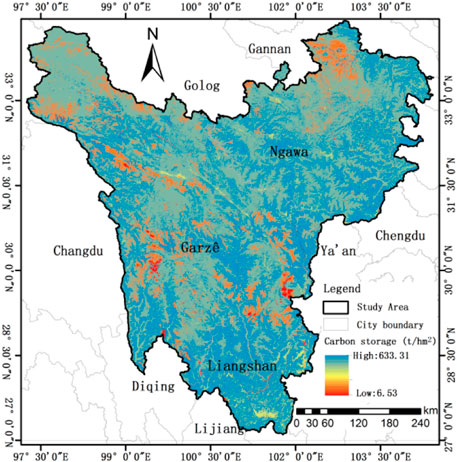
FIGURE 9. Temporal and spatial distribution of carbon storage in 2030.
The carbon storage distribution map in 2030 was raster processed to calculate the change of each raster from 2020 to 2030. The carbon storage change value greater than 5% is defined as the increase region, less than −5% is defined as the decrease region, and the carbon storage change value between −5 and 5% is defined as no change region. From 2020 to 2030, the decrease region of carbon storage in the Western Sichuan Plateau will be 291.19 ha; the increase region will be 21,518.12 ha and no region will be 25,851,760.68 ha. The Moran’s I for calculating the spatial change of carbon storage in the Western Sichuan Plateau at the grid scale is 0.3423 and the value of p < 0.001, indicating that there is a positive correlation in the spatial change of carbon storage and a certain regional distribution in space.
From the perspective of the spatial pattern of carbon storage change (Figure 10), the increase region of carbon storage is concentrated in Ruoergai County and Hongyuan County in the northeast, and a small amount distributed in Seda County and Shiqu County in the northwest. The decrease region is relatively few and the agglomeration characteristic is not obvious. The main reason lies in that with the conducted desertification control project and the implementation of ecological conservation policy in the study area, the desertification issue in Ruoergai County, Hongyuan County, Shiqu County and other key control areas has been significantly addressed. Going forward, the carbon storage capacity of the study area will continue to be enhanced in the future because of the current policies and treatment measures.
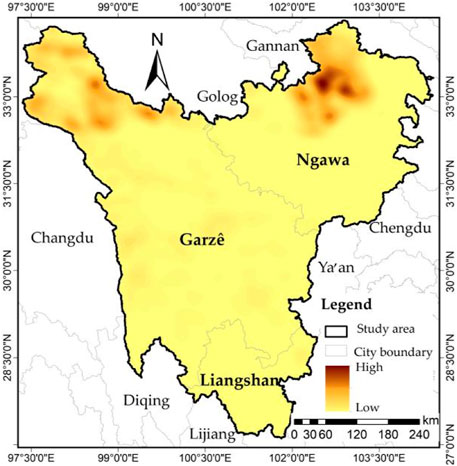
FIGURE 10. Density distribution changes of carbon storage during 2020–2030.
3.4.3 ESV Change of the Western Sichuan Plateau in 2030
The ESV of the Western Sichuan Plateau in 2030 was calculated respectively. For different land use types, the total ESV of the study area and the change rate of ESV from 2020 to 2030 are shown in Table 7.

TABLE 7. Ecological service value and changes of the Western Sichuan Plateau in 2030.
From Table 7, it can be seen that the ESV of the Western Sichuan Plateau in 2030 is 4,027.8733 × 108 yuan, and the ESV increased by 24.0869 × 10⁸ yuan during the period from 2020 to 2030, with an increase of 0.43% and an average annual increase of 2.4087 × 10⁸ yuan, indicating that the ESV in the Western Sichuan Plateau shows an increasing trend under the natural change situation.
From the perspective of the spatial distribution of ESV in the Western Sichuan Plateau (Figure 11), the spatial pattern of ESV in 2030 has little change compared with the period from 1990 to 2020. Areas with high ESV is still distributed in the whole region, while areas with low ESV are distributed in the central, western and northeastern part of the study area in a pattern of block and band.
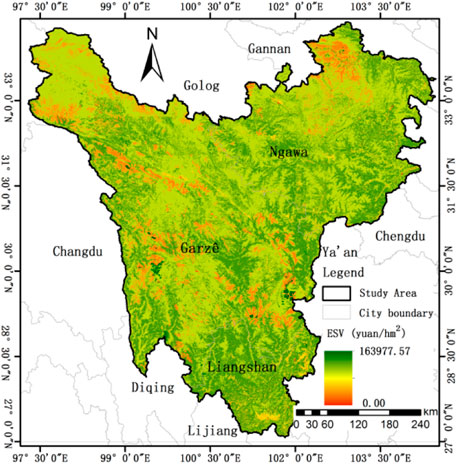
FIGURE 11. The spatial distribution of ESV in 2030.
The ESV distribution map in 2030 was raster processed to calculate the change of each raster from 2020 to 2030. The ESV change value greater than 5% is defined as the increase region, less than −5% is defined as the decrease region, and the ESV change value between −5 and 5% is defined as the no change region. From 2020 to 2030, the decrease region of ESV in the Western Sichuan Plateau will be 293.56 ha, while the increase region will be 263,085.13 ha, and no change region will be 25,610,191.3 ha. The Moran’s I for calculating the spatial change of ESV in the Western Sichuan Plateau at the grid scale is 0.3779, the value of p < 0.001, indicating that there is a positive correlation in the spatial change of ESV and a certain regional distribution in space. From the perspective of the spatial pattern of ESV change (Figure 12), the increase region of ESV is concentrated in Ruoergai County and Jiuzhaigou County in the northeast, Shiqu County in the in the northwest and Mianning County, Muli County and Yanyuan County in the south. The decrease area is relatively low, with a point distribution and not obvious agglomeration characteristics. From 2020 to 2030, the increased area of woodland in Jiuzhaigou County, Ruoergai County, Shiqu County and other regions is relatively large. While the contribution from woodland to ESV is much greater than that to carbon storage, which serves as the main reason for the slight difference between the regional spatial pattern of ESV and carbon storage.
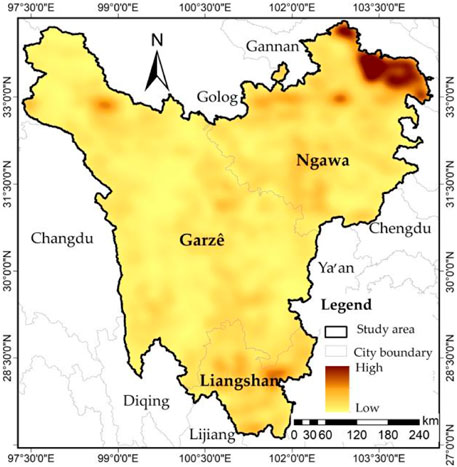
FIGURE 12. Density distribution changes of ESV during 2020–2030.
4 Discussion
Unlike previous works, this study is based on the improved InVEST model and the ESV equivalent factor model of Xie Gaodi to study the ecosystem service function of the Western Sichuan Plateau from carbon storage and ESV and predict their change trends, which will be helpful to improve the accuracy of evaluation results and the practicality of the research results.
From 1990 to 2020, the carbon storage of the Western Sichuan Plateau showed a fluctuating trend of “slow increase-rapid decrease-rapid increase-slow decrease”, including two periods of dramatic changes from 1995 to 2000 and from 2005 to 2010. From 1995 to 2000, the carbon storage decreased by 3.0315 × 10⁶ t annually, which was related to the decrease of forest area and the continuous increase of bare land area caused by long-term logging activities. According to relevant studies, more than 3.5 × 10⁷ m of timber was cut in the Dadu River and Yalong River basins of the study area between 1958 and the end of the 20th century (Zhou, 2000). From 2005 to 2010, the average annual increase of carbon storage was 5.4150 × 10⁶ t. Thanks to the implementation of Natural Forest Protection Regulations of Sichuan Province and the Natural Forest Protection Project in 2000, the interference and destruction of ecological system caused by human activities were reduced and forest resources were protected (Lai and Yang, 2018), so that the period from 2005 to 2010 has shown good ecological benefits. It shows that the ecological environmental protection measures, such as close hillsides to facilitate afforestation and return the grain plots to forestry and grass, can effectively promote the restoration and rehabilitation of the regional ecological environment by reducing the disturbance of human activities to the study area.
From 1990 to 2020, the overall trend of ESV is increasing, which can be divided into four stages: “slow increase—slow decrease—rapid increase—slow increase”. Similar to the trend of carbon storage change, the two time periods with large changes are 1995–2000 and 2005–2010, but the trend is different after 2010. The overall increase of ESV in the study area from 1990 to 2020 is consistent with the conclusion of relevant studies. Jiang et al. (2020) found that ESV of the Qinghai-Tibet Plateau increased by 2.26% in the past 25 years, mainly due to the large expansion of rivers and lakes and the reduction of bare land and glacier snow cover. The increase of rivers and plateau lakes contributes greatly to the increase of regional ESV, but the carbon storage capacity of water body is very weak, which is one of the reasons for the inconsistent development trend of carbon storage and ESV after 2010.
From 1990 to 2020, the spatial change of carbon storage and ESV in the study area is consistent. The increase region is mainly located in the middle and east of the study area, while the decrease region is mainly located in the northeast and southwest, which are mainly affected by land cover change. Relevant studies have shown that the land use type and degree in the Western Sichuan Plateau have a great impact on carbon storage and ESV (Gascogine et al., 2011; Yang et al., 2014). Over the past few decades, cover changes in Ruoergai County, Jiuzhaigou County and Maoxian County in the northeast and Litang County in the southwest of the Western Sichuan Plateau have shown an overall decreasing trend (Zheng et al., 2020). At the same time, from 1990 to 2020, the population of the study area increased by 714,600 human settlements continued to expand, and production activities such as grazing intensified. As a result, the area of built-up land and water body (mainly the increase in water storage area caused by power stations) increased by 141.38 and 44.11% respectively. Centralized grazing near the settlement intensifies grassland degradation, while the West Sichuan Plateau has a low temperature, low accumulated temperature and long recovery cycle after the destruction of grassland and woodland (Zhang et al., 2020).
The CA-Markov model was used to predict the land use of the Western Sichuan Plateau in 2030. In line with the current development trend, the carbon storage and ESV in the study area will increase by 2.4807 × 10⁶ t and 5.3980 × 10⁹ yuan respectively in the next decade, indicating an overall positive development of ecological environment. The main reason for the enhancement of ecosystem services was that land was developed to woodland. It indicates that strengthening the construction of key ecological function areas and biodiversity protection in the Western Sichuan Plateau, enhancing the protection and management of public welfare forests, natural forests and grassland resources, promoting the rehabilitation of sandy land, degraded alpine wetlands and river wetlands and the restoration degraded grasslands will consolidate and enhance the functional benefits of the ecosystem in the Western Sichuan Plateau.
5 Conclusion
In this study, the CA-Markov model was employed to predict the land use pattern under natural change scenarios, and the improved InVEST model and equivalent method were used to evaluate the ecosystem services in the study area from two different perspectives. From 1990 to 2020, the carbon stock of the western Sichuan Plateau showed an overall fluctuating increase. While it reflected relatively dramatic during 1995–2000 and 2005–2010. The contribution rate to total carbon storage in the study area arranged from high to low: grassland, woodland, cropland, unused land, built-up land and water body. The spatial carbon storage change in the past three decades hasn’t changed much in Western Sichuan Plateau. The changed areas are scattered and dotted in general, and relatively concentrated in the east and southwest.
In the past three decades, the ESV increases are similar to carbon stocks, showing an overall wave-like increase trend. The ESV in 2005–2010 and 2015–2020 showed relatively dramatic changes due to water body, and was slightly different from the change trend of carbon storage. The contribution to regional ESV arranges from high to low: woodland, grassland, water body, cropland, unused land and built-up land. Woodland is the land with the highest contribution rate. From the spatial distribution of ESV, the overall spatial characteristics are “high in the south and the east but low in the north and the west”. Areas with relatively obvious changes, mainly located in the northeast and southwest of the study area, are caused by human activities and natural disasters.
Ecosystem services in the western Sichuan plateau present positive growth under current ecological conservation measures. To pursue a high-standard regional development, efforts must be intensified to stay regional ecological conservation above the red line, reasonably control the coverage area of built-up land and keep ecosystem stable.
This paper discussed the changing characteristics of ecosystem services in the Western Sichuan Plateau from two perspectives, further investigation is necessary. The simulation accuracy of LUCC needs to be further enhanced in light of the actual conditions and limiting factors in the study area. The carbon density value should also be verified with measured data to provide data basis for accurate estimation of carbon storage.
Data Availability Statement
The original contributions presented in the study are included in the article/Supplementary Material, further inquiries can be directed to the corresponding author.
Author Contributions
Research design and analysis: MX and JY; Experiment: WL; Manuscript: MX and YS; Investigation and validation: CW; Data curation: YL; Supported the data preparation: ML; Interpretation of the results: YT. All authors have read and agreed to the published version of the manuscript.
Funding
This research was funded by the National Natural Science Foundation of China (No. 42071232), Supported by Sichuan Science and Technology Program (Nos 2020YFS0308, 2020YFS0309) and Open Foundation of the Research Center for Human Geography of Tibetan Plateau and Its Eastern Slope (Chengdu University of Technology).
Conflict of Interest
The authors declare that the research was conducted in the absence of any commercial or financial relationships that could be construed as a potential conflict of interest.
Publisher’s Note
All claims expressed in this article are solely those of the authors and do not necessarily represent those of their affiliated organizations, or those of the publisher, the editors and the reviewers. Any product that may be evaluated in this article, or claim that may be made by its manufacturer, is not guaranteed or endorsed by the publisher.
Acknowledgments
The authors would like to thank the reviewers for their valuable suggestions on the manuscript.
References
Alam, S. A., Starr, M., and Clark, B. J. F. (2013). Tree Biomass and Soil Organic Carbon Densities across the Sudanese woodland savannah: A Regional Carbon Sequestration Study. J. Arid Environments 89, 67–76. doi:10.1016/j.jaridenv.2012.10.002
Chen, L., Liu, G., and Li, H. (2002). Estimating Net Primary Productivity of Terrestrial Vegetation in China Using Remote Sensing. Natl. Remote Sensing Bull. 6 (2), 129–135. doi:10.1088/1009-1963/11/5/313
Chen, G., Yang, Y., Liu, L., Li, X., Zhao, Y., and Yuan, Y. (2007). Research Review on Total below Ground Carbon Allocation in Forest Ecosystems. J. Subtropical Resour. Environ. 2 (01), 34–42. doi:10.1007/s11461-007-0044-x
Chuai, X., Huang, X., Lai, L., Wang, W., Peng, J., and Zhao, R. (2013). Land Use Structure Optimization Based on Carbon Storage in Several Regional Terrestrial Ecosystems across China. Environ. Sci. Pol. 25, 50–61. doi:10.1016/j.envsci.2012.05.005
Costanza, R., d'Arge, R., de Groot, R., Farber, S., Grasso, M., Hannon, B., et al. (1997). The Value of the World's Ecosystem Services and Natural Capital. Nature 387 (6630), 253–260. doi:10.1038/387253a0
Costanza, R., de Groot, R., Sutton, P., van der Ploeg, S., Anderson, S. J., Kubiszewski, I., et al. (2014). Changes in the Global Value of Ecosystem Services. Glob. Environ. Change 26, 152–158. doi:10.1016/j.gloenvcha.2014.04.002
Dai, X., Johnson, B. A., Luo, P., Yang, K., Dong, L., Wang, Q., et al. (2021). Estimation of Urban Ecosystem Services Value: A Case Study of Chengdu, Southwestern China. Remote Sensing 13 (2), 207. doi:10.3390/RS13020207
Fang, F., Feng, J., Li, F., and Peng, S. (2017). Impacts of the north Migration of China's rice Production on its Ecosystem Service Value during the Last Three Decades (1980-2014). J. Integr. Agric. 16 (01), 76–84. CNKI:SUN:ZGNX.0.2017-01-009. doi:10.1016/s2095-3119(16)61360-6
Firozjaei, M. K., Sedighi, A., Argany, M., Jelokhani-Niaraki, M., and Arsanjani, J. J. (2019). A Geographical Direction-Based Approach for Capturing the Local Variation of Urban Expansion in the Application of CA-Markov Model. Cities 93, 120–135. doi:10.1016/j.cities.2019.05.001
Fu, Q., Xu, L., Zheng, H., and Chen, J. (2019). Spatiotemporal Dynamics of Carbon Storage in Response to Urbanization: A Case Study in the Su-Xi-Chang Region, China. Processes 7 (11), 836–854. doi:10.3390/pr7110836
Gaglio, M., Aschonitis, V., Pieretti, L., Santos, L., Gissi, E., Castaldelli, G., et al. (2019). Modelling Past, Present and Future Ecosystem Services Supply in a Protected Floodplain under Land Use and Climate Changes. Ecol. Model. 403, 23–34. doi:10.1016/j.ecolmodel.2019.04.019
Gao, X., Wang, J., Li, C., Shen, W., Song, Z., Nie, C., et al. (2021). Land Use Change Simulation and Spatial Analysis of Ecosystem Service Value in Shijiazhuang under Multi-Scenarios. Environ. Sci. Pollut. Res. 28 (24), 31043–31058. doi:10.1007/s11356-021-12826-9
Gascoigne, W. R., Hoag, D., Koontz, L., Tangen, B. A., Shaffer, T. L., and Gleason, R. A. (2011). Valuing Ecosystem and Economic Services across Land-Use Scenarios in the Prairie Pothole Region of the Dakotas, USA. Ecol. Econ. 70 (10), 1715–1725. doi:10.1016/j.ecolecon.2011.04.010
Gashaw, T., Tulu, T., Argaw, M., Worqlul, A. W., Tolessa, T., and Kindu, M. (2018). Estimating the Impacts of Land Use/land Cover Changes on Ecosystem Service Values: The Case of the Andassa Watershed in the Upper Blue Nile basin of Ethiopia. Ecosystem Serv. 31, 219–228. doi:10.1016/j.ecoser.2018.05.001
Giardina, C. P., and Ryan, M. G. (2000). Evidence that Decomposition Rates of Organic Carbon in mineral Soil Do Not Vary with Temperature. Nature 404 (6780), 858–861. doi:10.1038/35009076
He, C., Zhang, D., Huang, Q., and Zhao, Y. (2016). Assessing the Potential Impacts of Urban Expansion on Regional Carbon Storage by Linking the LUSD-Urban and InVEST Models. Environ. Model. Softw. 75, 44–58. doi:10.1016/j.envsoft.2015.09.015
He, F., Jin, J., Zhang, H., and Yuan, L. (2021). The Change of Ecological Service Value and the Promotion Mode of Ecological Function in Mountain Development Using InVEST Model. Arab J. Geosci. 14 (6), 510. doi:10.1007/s12517-021-06869-y
Hou, H., Dai, E., and Zhang, M. (2018). A Review on InVEST Model for the Evaluation of Ecosystem Service Function. J. Capital Normal Univ. (Natural Sci. Edition) 39 (4), 62–67. doi:10.19789/j.1004-9398.2018.04.012
Houghton, R. A. (2003). Revised Estimates of the Annual Net Flux of Carbon to the Atmosphere from Changes in Land Use and Land Management 1850-2000. Tellus B 55 (2), 378–390. doi:10.1034/j.1600-0889.2003.01450.x
Jiang, W., Deng, Y., Tang, Z., Lei, X., and Chen, Z. (2017). Modelling the Potential Impacts of Urban Ecosystem Changes on Carbon Storage under Different Scenarios by Linking the CLUE-S and the InVEST Models. Ecol. Model. 345, 30–40. doi:10.1016/j.ecolmodel.2016.12.002
Jiang, W., Lü, Y., Liu, Y., and Gao, W. (2020). Ecosystem Service Value of the Qinghai-Tibet Plateau Significantly Increased during 25 Years. Ecosystem Serv. 44, 101146. doi:10.1016/j.ecoser.2020.101146
Lai, J., and Yang, W. (2018). Dynamic Changes of Vegetation Cover in Natural forest Area of Western Sichuan in Recent 29 Years Based on RS. Remote Sensing Land Resour. 30 (4), 132–138. doi:10.6046/gtzyyg.2018.04.20
Lei, W., Yang, W., and University, P. (2012). An ANN-CA Modeling Method for Land Cover Change in the Karst Area of China: A Case Study of Maotiao River Basin. Acta Scientiarum Naturalium Universitatis Pekinensis 48 (1), 111–122. doi:10.13209/j.0479-8023.2012.015
Lei, J., Chen, Z., Chen, X., Li, Y., and Wu, T. (2020). Spatio-temporal Changes of Land Use and Ecosystem Services Value in Hainan Island from 1980 to 2018. Acta Ecologica Sinica 40 (14), 4760–4773. doi:10.1111/j.1538-4632.1995.tb00338.x
Li, X., and Yeh, A. (2005). Cellular Automata for Simulating Complex Land Use Systems Using Neural Networks. Geographical Res. 24 (1), 19–27. doi:10.3321/j.issn:1000-0585.2005.01.003
Li, K., Wang, S., and Cao, M. (2003). Carbon Stocks of Soil and Vegetation in China. Scientia Sinica(Terrae). 33 (1), 72–80. CNKI:SUN:JDXK.0.2003-01-007.
Li, K., Cao, J., Adamowski, J. F., Biswas, A., Zhou, J., Liu, Y., et al. (2021). Assessing the Effects of Ecological Engineering on Spatiotemporal Dynamics of Carbon Storage from 2000 to 2016 in the Loess Plateau Area Using the InVEST Model: A Case Study in Huining County, China. Environ. Dev. 39, 100641. doi:10.1016/j.envdev.2021.100641
Liu, Y., Wang, Y., Peng, J., Yuan, Y., Ma, J., and Wei, H. (2015). Selection of Different Clustering Algorithms for Settlement Landscape Aggregation in Suburb. Scientla Geogr. Aphica Sinica 35 (6), 674–682. doi:10.1016/j.chnaes.2015.06.005
Liu, J., Ren, H., Wang, X., Shirazi, Z., and Quan, B. (2019). Measuring and Predicting Urban Expansion in the Angkor Region of Cambodia. Remote Sensing 11 (17), 2064–2084. doi:10.3390/rs11172064
Liu, M., Zhang, Z., Sun, J., Wang, Y., Wang, J., Tsunekawa, A., et al. (2020). One-year Grazing Exclusion Remarkably Restores Degraded alpine Meadow at Zoige, Eastern Tibetan Plateau. Glob. Ecol. Conservation 22, e00951. doi:10.1016/j.gecco.2020.e00951
Liu, Y., Zhang, J., Zhou, D., Ma, J., Dang, R., Ma, J., et al. (2021). Temporal and Spatial Variation of Carbon Storage in the Shule River Basin Based on InVEST Model. Acta Eco Sin 41 (10), 4052–4065. doi:10.5846/stxb201911152452
Matlhodi, B., Kenabatho, P. K., Parida, B. P., and Maphanyane, J. G. (2021). Analysis of the Future Land Use Land Cover Changes in the Gaborone Dam Catchment Using CA-Markov Model: Implications on Water Resources. Remote Sensing 13 (13), 2427. doi:10.3390/RS13132427
Nasehi, S., Imanpour namin, A., and Salehi, E. (2019). Simulation of Land Cover Changes in Urban Area Using CA-MARKOV Model (Case Study: Zone 2 in Tehran, Iran). Model. Earth Syst. Environ. 5 (1), 193–202. doi:10.1007/s40808-018-0527-9
Nigussie, T. A., and Altunkaynak, A. (2016). Assessing the Hydrological Response of Ayamama Watershed from Urbanization Predicted under Various Landuse Policy Scenarios. Water Resour. Manage. 30 (10), 3427–3441. doi:10.1007/s11269-016-1360-4
Nigussie, T. A., and Altunkaynak, A. (2019). Modeling the Effect of Urbanization on Flood Risk in Ayamama Watershed, Istanbul, Turkey, Using the MIKE 21 FM Model. Nat. Hazards 99 (2), 1031–1047. doi:10.1007/s11069-019-03794-y
Raich, J. W., and Nadelhoffer, K. J. (1989). Belowground Carbon Allocation in Forest Ecosystems: Global Trends. Ecology 70 (5), 1346–1354. doi:10.2307/1938194
Sang, L., Zhang, C., Yang, J., Zhu, D., and Yun, W. (2010). Simulation of Land Use Spatial Pattern of Towns and Villages Based on CA–Markov Model. Math. Comp. Model. 54 (3), 938–943. doi:10.1016/j.mcm.2010.11.019
Temesgen, H., Wu, W., Shi, X., Yirsaw, E., Bekele, B., and Kindu, M. (2018). Variation in Ecosystem Service Values in an Agroforestry Dominated Landscape in Ethiopia: Implications for Land Use and Conservation Policy. Sustainability 10 (4), 1126. doi:10.3390/su10041126
Tian, Y., and Ren, Z. (2012). Land Use Change Simulations in Loess Hilly Areas Based on CLUE-S Model: A Case Study in Xianyang Loess Tableland Areas of Shaanxi Province. Prog. Geog. 31 (9), 1224–1234. doi:10.11820/dlkxjz.2012.09.014
Vizcaíno-Bravo, Q., Williams-Linera, G., and Asbjornsen, H. (2020). Biodiversity and Carbon Storage Are Correlated along a Land Use Intensity Gradient in a Tropical Montane forest Watershed, Mexico. Basic Appl. Ecol. 44, 24–34. doi:10.1016/j.baae.2019.12.004
Wang, R., Hou, H., Murayama, Y., and Derdouri, A. (2020). Spatiotemporal Analysis of Land Use/Cover Patterns and Their Relationship with Land Surface Temperature in Nanjing, China. Remote Sensing 12 (3), 440. doi:10.3390/rs12030440
Wang, Q. H., Kalantar-Zadeh, K., Kis, A., Coleman, J. N., and Strano, M. S. (2021). Electronics and Optoelectronics of Two-Dimensional Transition Metal Dichalcogenides. Nat. Nanotechnol 7 (11), 699–712. doi:10.1038/nnano.2012.193
Wickramasuriya, R. C., Bregt, A. K., van Delden, H., and Hagen-Zanker, A. (2009). The Dynamics of Shifting Cultivation Captured in an Extended Constrained Cellular Automata Land Use Model. Ecol. Model. 220 (18), 2302–2309. doi:10.1016/j.ecolmodel.2009.05.021
Wu, L., Wang, H., Shao, H., and Zhou, S. (2021). Spatiotemporal Pattern of Vegetation and its Response to Climate Change in the Western Sichuan Plateau. Res. Soil Water Conservation 28 (1), 171–178. doi:10.13869/j.cnki.rswc.20200722.001
Xie, G., Lu, C., Leng, Y., Zheng, D., and Li, S. (2003). Ecological Assets Valuation of the Tibetan Plateau. J. Nat. Resour. 18 (2), 189–196. doi:10.11849/zrzyxb.2003.02.010
Xie, X., Sun, B., Zhou, H., Li, Z., and Li, A. (2004). Estimation and Spatial Distribution of Soil Organic Carbon Density and Content in China. Acta Pedologica Sinica 41 (1), 35–43. doi:10.11766/trxb200301140106
Xie, G., Zhang, C., Zhang, L., Chen, W., and Li, S. (2015). Improvement of the Evaluation Method for Ecosystem Service Value Based on Per Unit Area. J. Nat. Resour. 30 (08), 1243–1254. doi:10.11849/zrzyxb.2015.08.001
Yang, S., Li, T., Gan, Y., Wang, Y., Ji, L., Song, Z., et al. (2014). Impact of Different Use Patterns and Degrees of Grassland Use on Vegetation Carbon Storage in the Aba Grassl and Pastoral Area. Acta Prataculturae Sinica 23 (3), 325–332. doi:10.11686/cyxb20140338
Yang, J., Xie, B., and Zhang, D. (2021). Spatio-temporal Evolution of Carbon Stocks in the Yellow River Basin Based on in VEST and CA-Markov Models. Chin. J. Eco-Agriculture 29 (6), 1018–1029. doi:10.13930/j.cnki.cjea.200746
Ye, Y., and Zhang, J. (2008). Impact of Land-Use Changes on the Ecosystem Service Value in Guangzhou City. Ecologic Sci. 27 (02), 119–123. CNKI:SUN:STKX.0.2008-02-014.
Zhang, G., Guhathakurta, S., Lee, S., Moore, A., and Yan, L. (2014). Grid-Based Land-Use Composition and Configuration Optimization for Watershed Stormwater Management. Water Resour. Manage. 28 (10), 2867–2883. doi:10.1007/s11269-014-0642-y
Zhang, X., Zhou, Q., Wang, Z., and Wang, F. (2017). Simulation and Prediction of Land Use Change in Three Gorges Reservoir Area Based on MCE-CA-Markov. Trans. Chin. Soc. Agric. Eng. 33 (19), 268–277. doi:10.11975/j.issn.1002-6819.2017.19.035
Zhang, J., Li, M., Ao, Z., Deng, M., Yang, C., and Wu, Y. (2018). Estimation of Soil Organic Carbon Storage of Terrestrial Ecosystem in Arid Western China. J. Arid Land Resour. Enviroment 32 (09), 132–137. doi:10.13448/j.cnki.jalre.2018.280
Zhang, J., Cui, X., Wang, Y., Gongbuzeren Zhuang, M., and Ji, B. (2020). Ecological Consequence of Nomad Settlement Policy in the Pasture Area of Qinghai-Tibetan Plateau: From Plant and Soil Perspectives. J. Environ. Manage. 260, 110114. doi:10.1016/j.jenvman.2020.110114
Zhang, J., Li, Q., Wu, X., Zhang, C., Wang, J., and Wu, G. (2021). Evolution of the Ecosystem Services Value and Carrying Capacity in the Guangdong-Hong Kong-Macao Greater Bay Area Based on Land Use Changes. Acta Eco Sin 41 (21), 1–12. doi:10.5846/stxb202007141841
Zhao, M., He, Z., Du, J., Chen, L., Lin, P., and Fang, S. (2019). Assessing the Effects of Ecological Engineering on Carbon Storage by Linking the CA-Markov and InVEST Models. Ecol. Indicators 98, 29–38. doi:10.1016/j.ecolind.2018.10.052
Zheng, Y., Yang, W., and Liu, C. (2020). Dynamic Monitoring and Driving Force Analysis of Vegetation Cover Change in Western Sichuan Plateau in Recent 20 Years. Remote Sensing Tech. Appl. 35 (6), 1447–1456. doi:10.11873/j.issn.1004-0323.2020.6.1447
Zhong, D., Sun, M., Zhang, Y., Yu, W., and Yang, C. (2021). Spatio - Temporal Variation and Influencing Factors of Snow Cover in WestSichuan Plateau from 2001 to 2020. J. Arid Land Resour. Environ. 35 (11), 111–118. doi:10.13448/j.cnki.jalre.2021.305
Zhou, J., Wu, J., and Gong, Y. (2020). Valuing Wetland Ecosystem Services Based on Benefit Transfer: A Meta-Analysis of China Wetland Studies. J. Clean. Prod. 276, 122988. doi:10.1016/j.jclepro.2020.122988
Zhou, X. (2000). Policy Choices for Backward Development—Investigation and Thinking on the Economic and Social Conditions After the Implementation of the Natural Forest Logging Ban in Ganzi Prefecture, Sichuan Province (Part 2). J. Southwest Univ. Nationalities (Philosophy Soc. Sciences) 21 (8), 1–7.
Keywords: land use change, CA-Markov model, Western Sichuan Plateau, carbon storage, ecosystem service value
Citation: Xiang M, Yang J, Li W, Song Y, Wang C, Liu Y, Liu M and Tan Y (2022) Spatiotemporal Evolution and Simulation Prediction of Ecosystem Service Function in the Western Sichuan Plateau Based on Land Use Changes. Front. Environ. Sci. 10:890580. doi: 10.3389/fenvs.2022.890580
Received: 06 March 2022; Accepted: 24 March 2022;
Published: 29 April 2022.
Edited by:
Yongsheng Wang, Institute of Geographic Sciences and Natural Resources Research (CAS), ChinaReviewed by:
Li Peng, Sichuan Normal University, ChinaEnxiang Cai, Henan Agricultural University, China
Copyright © 2022 Xiang, Yang, Li, Song, Wang, Liu, Liu and Tan. This is an open-access article distributed under the terms of the Creative Commons Attribution License (CC BY). The use, distribution or reproduction in other forums is permitted, provided the original author(s) and the copyright owner(s) are credited and that the original publication in this journal is cited, in accordance with accepted academic practice. No use, distribution or reproduction is permitted which does not comply with these terms.
*Correspondence: Jin Yang, eWFuZ2o4ODcyQDE2My5jb20=
†ORCID: Mingshun Xiang, orcid.org/0000-0002-3156-4808