
94% of researchers rate our articles as excellent or good
Learn more about the work of our research integrity team to safeguard the quality of each article we publish.
Find out more
ORIGINAL RESEARCH article
Front. Environ. Sci., 26 April 2022
Sec. Atmosphere and Climate
Volume 10 - 2022 | https://doi.org/10.3389/fenvs.2022.890514
This article is part of the Research TopicAir Pollution Remote Sensing and the Subsequent Interactions with Ecology on Regional ScalesView all 31 articles
 Ying Wang1
 Yongqing Bai2*Xiefei Zhi1*
 Kai Wu3
 Tianliang Zhao1Yue Zhou2Jie Xiong2Shoupeng Zhu4Wen Zhou2Weiyang Hu1Ling Zhang1Kai Meng5
The regional transport of air pollutants has been identified as a critical factor that affects air quality over downwind receptor areas; however, the regional transport patterns for air pollution episodes remain poorly understood. In this study, we identified two distinct patterns of regional transport: rapid transit transport (RTT) and stationary accumulation transport (SAT), both of which induced severe PM2.5 pollution episodes in central China during 2015–2020. The differences and similarities between the two regional transport patterns of air pollution were characterized by their influencing meteorological factors. Similar meteorological conditions trigger the RTT and SAT, with a high-PM2.5 concentration air mass from the upstream regions transported to the Twain-Hu Basin (THB) by the strong northerly winds with a southward advance of cold air mass. The average rate of increase in the PM2.5 concentration of the RTT (12.5 μg/m3/h) is more than that of the SAT (5.7 μg/m3/h). However, meteorological conditions evolved differently in RTT and SAT. For RTT with the fast passage of cold air, the THB is located behind the strong cold front during the later stage, and these events rapidly ended owing to the northerly winds and wet scavenging of precipitation. For SAT with the slow cold air accumulation, the THB is mainly occupied by a weak high-pressure system with low wind speeds, strong descending airflow, and a low atmospheric boundary layer height, trapping the air pollutants accumulated in the THB and resulting in persistent heavy pollution incidents. This study provides new insights into the meteorological mechanism underlying the formation of severe air pollution episodes over a receptor region owing to the regional transport patterns of air pollutants.
In China, air pollution, specifically elevated PM2.5, due to rapid urbanization and industrial processes has become a serious public concern over the last few decades (Wu et al., 2013; Miao et al., 2017). Research on regional aerosol pollution over megacities and major city clusters has attracted considerable attention because of the detrimental effects of particulate matter on human health (Chan and Yao, 2008; Yan et al., 2019; Gu et al., 2021; Wu et al., 2021). Although strict anthropogenic emission regulation policies have been implemented since 2013, episodes with elevated PM2.5 concentrations have been frequently observed, especially in winter (Wei et al., 2017; Wu et al., 2017).
Atmospheric circulation and weather systems have been widely reported to have significant effects on the occurrence of severe PM2.5 episodes (Wu et al., 2016; Miao et al., 2017; Guo et al., 2019). The weakening of the near-surface East Asian winter monsoons and East Asian trough is a key reason for the frequent occurrence of haze in the North China Plain, which is generally linked to weak surface winds and high relative humidity and is conducive to the formation and accumulation of air pollutants (Niu et al., 2010; Cai et al., 2017). Weak cold air masses and stagnant weather conditions have also been considered the main reasons for the heavy haze in Eastern China in January 2013 (Zhang et al., 2014). The planetary boundary layer height (PBLH) plays a significant role in the formation and development of heavy haze (Quan et al., 2013; Zhao et al., 2013). A strong temperature inversion and downward airflow in the planetary boundary layer (PBL) can cause air pollutants to accumulate in shallow layers (Zhao et al., 2013), leading to heavy pollution events. The reduction in the PBLH and turbulent vertical mixing in the PBL are significantly related to an increase in primary pollutants in Europe (Fallmann, 2016). The PM2.5 and the PBLH form a positive feedback loop for serious pollution events in megacities; the heat flux is significantly reduced because of the influence of haze, which inhibits the development of the PBL to some extent, and the restricted development of PBL further weakens the diffusion of air pollutants, eventually resulting in serious pollution incidents (Liu et al., 2019; Quan et al., 2013; Wenjie Zhang et al., 2019).
Regional transport plays a significant role in the formation and evolution of air pollution episodes, as well as the air quality over the receptor regions (Xiong et al., 2021; Bai et al., 2022; Shen et al., 2022). The measured concentrations of particulate matter in the metropolitan areas of South America have been caused predominantly by long-range transport (Diaz Resquin et al., 2018). Research on the Beijing–Tianjin–Hebei region found that in addition to the influence of the emission source intensity and chemical component formation, air quality is significantly affected by aerosol pollutants emitted from surrounding provinces (e.g., Shandong and Henan), which can be transported to the Beijing–Tianjin–Hebei region through transregional transport (Guo et al., 2013; Zhang et al., 2015). Ji et al. (2018) found that the transport of pollution from Hebei, Shandong, Anhui, and other regions to Hangzhou in Zhejiang Province could exceed 60% during the G20 period. Driven by regional transport, fine particulate matter in central Chile has increased by 13–15% on average (Lapere et al., 2021). The Pearl River Delta contributes an average of 56.5% of the PM2.5 transported by northerly winds that contribute to increased PM2.5 concentrations during a heavy haze event (Chen et al., 2019).
Studies have investigated the formation mechanism of severe PM2.5 and explored effective regulations for mitigating PM2.5 pollution in China, primarily focusing on the North China Plain (NCP), Yangtze River Delta (YRD), Pearl River Delta (PRD), and Sichuan Basin (SCB) (Cao et al., 2012; Wang et al., 2021; Wu et al., 2019; Yang et al., 2020; Lei Zhang et al., 2019). However, little attention has been paid to the middle reaches of the Yangtze River, especially the Twain-Hu Basin (THB) (Figure 1A). The dominant synoptic patterns have been classified as heavy PM2.5 in the THB region of central China from 2013 to 2018 (Yan et al., 2021). Strong northerly winds influenced by the East Asian winter monsoons transport high concentrations of air pollutants downstream from the upper reaches of Hebei and Henan, resulting in heavy pollution incidents in the THB (Bai et al., 2021; Hu et al., 2021; Shen et al., 2021). Governed by non-stagnant conditions with strong near-surface winds, unstable atmospheric structures, and non-temperature inversions, severe PM2.5 pollution episodes in the THB have been aggravated by regional transport (Yu et al., 2020; Zhou et al., 2022). Xiangyang (XY), Jingmen (JM), and Jingzhou (JZ) (Figure 1B), which are in the northwest of THB, are characterized by flat terrain adjoining the eastern slope of the Daba and Wushan Mountains, and the routes of the three cities have been identified as typical regional transport corridors in the THB (Huang et al., 2020). Under the influence of the East Asian winter monsoons, air pollutants in the upwind areas (such as the NCP and YRD) are transported to the THB (Figure 1C). This unique geographical location forms major corridors for the regional transport of air pollutants in China (Zhou et al., 2019; Hu et al., 2021), causing the THB to be a key receptor region of air pollutants (Yu et al., 2020; Bai et al., 2021; Shen et al., 2021). Although heavy PM2.5 transport events in the THB have been analyzed, most studies have been limited to case studies that have not considered the differences and similarities among the transport pollution events and features of the influencing meteorological factors during different stages and patterns. Moreover, this information can be used to improve the understanding of the transport mechanisms during different patterns in the THB and provide a reference guide for governmental decision-making.
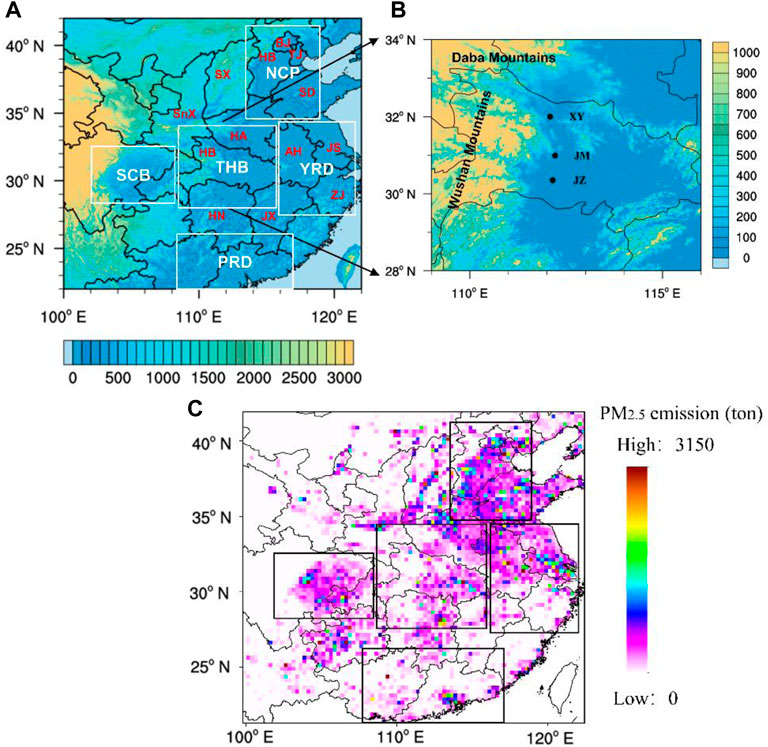
FIGURE 1. (A) Terrain height (m) of central and eastern China with the locations of provinces. The regions of NCP, PRD, YRD, SCB, and THB are outlined approximately with a white frame. (B) Terrain height (m) of the THB and surrounding areas with the location of cities of XY, JM, and JZ (black dots). (C) Distribution of PM2.5 emissions from anthropogenic sources in central and eastern China (2017 winter averaged).
In this study, we used the ERA5 reanalysis dataset, ambient measurements of PM2.5, and ground-level meteorological observations to identify two typical regional transport patterns of PM2.5 and investigated the evolution processes for each typical PM2.5 episode in the THB in central China. The remainder of this article is organized as follows. Section 2 presents the data and the methods used in this study. The identified severe PM2.5 episodes are investigated in Section 3.1. The impact of the meteorological mechanisms on the heavy PM2.5 pollution process for RTT and SAT is discussed in Section 3.2.
The hourly PM2.5 concentrations over central–eastern China during winter (December to March of the following year) from 2015 to 2020 were obtained from the National Air Quality Monitoring Network operated by the Ministry of Ecology and Environment of China (http://www.mee.gov.cn). The ambient PM2.5 concentrations were measured by using the tapered element oscillating microbalance method and the β absorption method by using a TEOM Series 1400a Ambient Particulate Monitor.
The ground-level observations of meteorological parameters, namely, air temperature, wind speed, wind direction, and precipitation, were obtained every hour from the China Meteorological Data Service Centre (http://data.cma.cn/).
In addition, the ERA5 global reanalysis dataset with a horizontal resolution of 0.25° × 0.25° was adopted to resolve the spatial limitations of the ground meteorological data. The key parameters of ERA5 used in this study were air temperature at 2 m, wind speed at 10 m, sea-level pressure, PBLH, vertical velocity, and potential pseudo-equivalent temperature. The ERA5 dataset is the fifth atmospheric reanalysis product of global climate developed by the European Centre for Medium-Range Weather Forecasts and has been widely used in weather and climate studies because of its fine spatial resolution (31-km grid spacing) and high temporal resolution (hourly analysis fields). The PBLH is a crucial meteorological parameter for air quality analysis. Compared with other reanalysis products, such as JRA-55 and MERRA-2, ERA5 has been recognized as the most promising product for PBLH measurements, with an estimated deviation of approximately 130 m, as compared to measurements using radiosondes released during daytime (Bao and Zhang, 2019; Guo et al., 2021; Huang et al., 2021).
Changes in the local meteorological conditions have an important relationship with the evolution of episodes of heavy pollution. The atmospheric thermal factors related to temperature, humidity, and atmospheric stratification stability have a considerable impact on heavy pollution (Ning et al., 2018). We selected the pseudo-equivalent potential temperature difference (
where
Wind strength and boundary layer dynamics are critical meteorological factors that affect the horizontal and vertical diffusion of air pollutants, respectively (Zhang et al., 2014). We used the product of the PBLH and wind speed to determine the ventilation coefficient (VC) (Nair et al., 2007; Hou et al., 2018; Moreira et al., 2020), which is considered a robust indicator of the atmospheric transport and diffusion capability. The wind field data and PBLH were adopted from the ERA5 data. The VC was calculated as follows:
where
When the THB regional transport corridor comprises XY, JM, and JZ (Figure 1), two or all three cities achieve severe PM2.5, with the daily average concentration exceeding 150 μg/m3; this situation can be defined as a heavy PM2.5. Thus, we selected 46 heavy air pollution episodes that occurred in the winters of 2015–2020.
Additionally, when a severe PM2.5 episode occurred accompanied by a north–south (28°N–34°N) pressure gradient (NSPG) larger than 2 hPa and a regional (28°N–34°N, 112°E–114°E) averaged northerly wind (NW) higher than 1.5 m/s, which favor the transport of PM2.5 from upwind northern sources to downwind THB areas, this episode can be classified as a regional transport type. Accordingly, 27 severe PM2.5 episodes were selected as the regional transport type, accounting for 58.7% of all severe episodes. The mean values of NSPG and NW are 3.8 hPa and 2.1 m/s, respectively, which are relatively higher than those of the remaining 19 heavy PM2.5 episodes of 0.2 hPa and 1.1 m/s, respectively.
To understand the characteristics of regional PM2.5, we defined the situation with short-term burst growth and rapid dissipation of heavy pollution accompanied by strong NWs as “rapid transit transport (RTT).” The situation of the triggering and growth stage is accompanied by a strong NW, while the PM2.5 peak maintenance stage is accompanied by a decrease in wind speed, which is defined as “stationary accumulation transport (SAT).”
The RTT and SAT episodes had similar transport features during the early growth stage of PM2.5, and the variation tendency of the meteorological parameters differed during the peak and maintenance stages. Thus, we identified RTTs by using the criteria of the peak maintenance stage accompanied by an NSPG larger than 3 hPa and NW exceeding 2.5 m/s. When the maintenance stage was characterized by an NSPG of less than 2 hPa and NW below 1.5 m/s, this episode was classified as SAT. Twelve RTT episodes and six SAT episodes were selected, accounting for 44.4 and 22.2% of the regional transport types, respectively. In Figure 2A, the NSPG and NW for RTT are significantly larger than those for SAT, with the mean NSPG and NW values reaching 6.4 hPa and 3.2 m/s, as opposed to −0.11 and 0.8 m/s for SAT. Therefore, investigating the features and meteorological parameters of the RTT and SAT on PM2.5 has provided a profound understanding of the formation mechanism of heavy PM2.5 pollution over the THB.
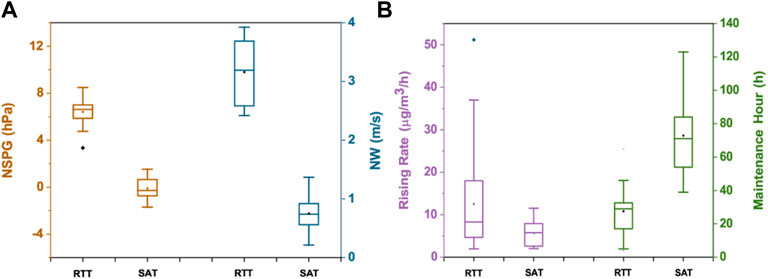
FIGURE 2. (A) Boxplot of the NSPR (left) and NW (right) of six episodes for RTT and twelve episodes for SAT; (B) boxplot of the rising rate of PM2.5 concentrations (left) and time duration (right) of severe PM2.5 pollution maintenance stage of twelve episodes for RTT and six episodes for SAT in transport corridor cities: XY, JM, and JZ in the THB. The diamond beyond the box plot denotes the abnormal value.
Figure 2B shows the rate of increase in the PM2.5 during the early growth stage and the maintenance hours of the two patterns. The early growth stage is defined by the duration between the lowest PM2.5 and the peak over the period of a sustained increase. The maintenance stage of each episode was defined as the duration during which the PM2.5 concentrations continuously exceeded 150 μg/m3. Notably, the increasing rate of PM2.5, as shown in Figure 2B (Supplementary Figure S1), is defined by the peak PM2.5 concentration minus the moderate pollution level of 115 μg/m3 (light pollution level 75 μg/m3), then divided by the duration of the sustained increase. We observed that the northern aerosol particles can be quickly advected to the THB by strong northern wind fields in the RTT, and the mean rate of increase reached 12.5 (7.5) μg/m3/h, with the rate of increase greater than 5.7 (4.1) μg/m3/h for SAT. Notably, the rate for moderate pollution is higher than that for light pollution. Additionally, although the rate of increase in the PM2.5 concentration for the SAT is relatively slower than that of the RTT, the maintenance stage of the SAT is longer, and the mean duration could reach 72.8 h, which is significantly longer than the 27.5 h of RTT. Furthermore, several events had a SAT duration of over 80 h, usually resulting in long-lasting pollution over the THB.
Six typical RTT and SAT heavy pollution processes (Supplementary Tables S1, S2) were selected and used to analyze the influence of the boundary layer meteorological conditions at different stages of local PM2.5, including the triggering, maintenance, and dissipation stages, in the THB. Three typical RTT heavy pollution processes are presented in Figures 3A,C,E (Supplementary Figure S2A, C, E are the other three processes of RTT), demonstrating that the early rapid growth stage of PM2.5, corresponding to the strong NW, was favorable for the rapid horizontal transport of aerosol particles from the north (Li et al., 2013), resulting in the explosive growth of PM2.5 pollutants in the THB. The peak PM2.5 and heavy pollution maintenance stage are also followed by good transport conditions with strong NW fields. Specifically, during the first episodes (Figure 2A), the peak PM2.5 concentrations reached 300 μg/m3 within 6 h, indicating an explosive increase in PM2.5 levels within a short period. Further strengthening of the NW and increased PBLH are conducive to atmospheric diffusion conditions, especially the mean rainfall intensity (0.62 mm/h) and mean total rainfall (9.3 mm), which are responsible for the wet removal of PM2.5 (Zhou et al., 2020). This typical transport pattern is RTT, which can be summarized as being affected predominantly by relatively strong cold air and NWs, corresponding to the rapid growth and spread of pollution in the THB. As the northerly winds further strengthen and wet scavenging occurs, the air pollution level can drop rapidly.
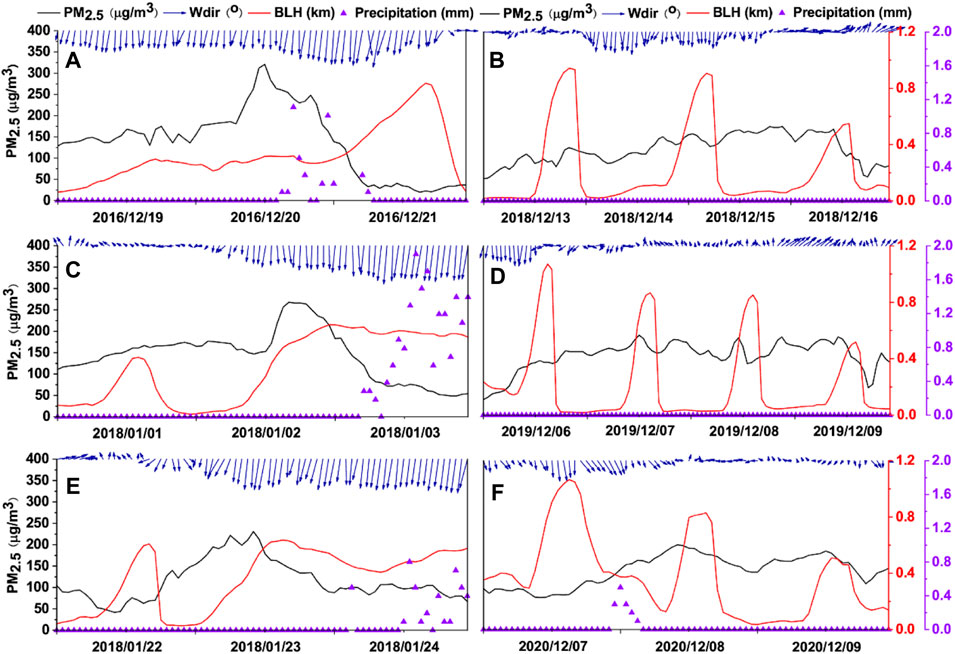
FIGURE 3. Temporal changes in PM2.5 concentration (black lines), PBLH (red lines), wind directions at 10 m (Wdir, vectors), and precipitation (purple triangles) were observed at JM in the THB. (A,C,E) Left column represents the three cases of RTT. (B,D,F) Right column represents the three cases of SAT.
Figures 3B,D, and F present three typical SAT heavy pollution episodes (Supplementary Figure S2B, D, and F present the other three episodes of SAT), showing that the increase in the PM2.5 level was generally accompanied by an increase in wind speed. During the PM2.5 concentration peak and heavy pollution maintenance stage, the wind speed and PBLH significantly decreased, leading to meteorological conditions that were unfavorable for the horizontal transport and vertical mixing of aerosol particles in the boundary layer (Zhu et al., 2010). The PM2.5 transported from upwind regions was trapped and gradually accumulated over the THB under stagnant weather conditions (Kang et al., 2019).
The typical features of SAT differ from those of RTT. Notably, at first, the prevalence of northerly winds deteriorates the air quality over the THB, and subsequently, THB experiences a relatively stable and stagnant stage accompanied by weak wind and low PBLH. The key features of the SAT are a long duration (Supplementary Table S2), low PBLH, and poor diffusion capacity, which are conducive to the accumulation of precursors and formation of secondary pollutants (Huang et al., 2014; Gao et al., 2015). The typical transport features in this pattern imply that the severe PM2.5 episodes in the THB are affected not only by local emissions but also by the transboundary transport of PM2.5 that originates from surrounding regions.
An increase in VC contributes to a decrease in PM2.5, which leads to air quality improvement (Lu et al., 2012; Xu et al., 2015; Sujatha et al., 2016). However, it may not fit the transport pollution type, in which the occurrence of heavy pollution episodes is usually accompanied by good ventilation, bringing air pollutants from long-distance areas (Hou et al., 2018). As shown in Figure 4, PM2.5 concentrations in the RTT (Figure 4A) and SAT (Figure 4B) were positively correlated with the VC during the early growth stage. The correlation coefficients between VC and PM2.5 reach 0.46 and 0.40 for the RTT and SAT, respectively, and both pass the significance test of α = 0.01. A larger VC is beneficial to the inflow of PM2.5, indicating that transport is the trigger mechanism for RTT and SAT episodes.
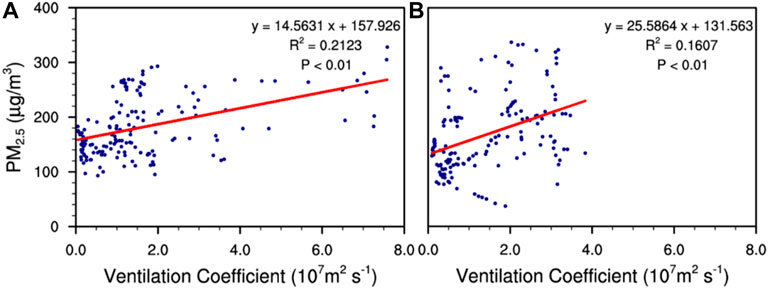
FIGURE 4. Correlations of the surface PM2.5 concentration to the ventilation coefficient (107m2s−1) over the region (112–114°E and 30.5–31°N) averaged in the early growth stage of six typical episodes for (A) RTT and (B) SAT in JM, respectively; the early growth stage of all patterns indicates the correlations are significant at 99%.
Persistent heavy pollution events are influenced by synoptic circulation. Variations in the synoptic circulation play a primary role in modulating the day-to-day variations in air pollutants. The features in each evolution stage were determined by synthesizing PM2.5 and the surface synoptic circulations of six typical RTT (Supplementary Table S1) cases and six typical SAT (Supplementary Table S2) cases on the day before transport (first day), the day of transport (second day), and the day after transport (third day) (Figure 5). The THB was controlled by the regional low-pressure equalization field on the first day of the RTT, which had the noticeable characteristic of static wind (Figure 5A). In the spatial distribution of VC, the first day of RTT in the THB indicated that the advection and diffusion conditions were relatively poor (Supplementary Figure S3A). The local pollution level was low because local pollution emissions in the THB were relatively low at that time. However, the PM2.5 concentrations in the NCP were relatively high, and the local PM2.5 concentrations exceeded 200 μg/m3. As shown in Figure 5B, the atmospheric circulation was adjusted on the second day of regional transport. The atmospheric diffusion conditions improved significantly, especially in the XY–JM–JZ transport corridor in the THB, and its upwind areas appeared as high-value centers of the VC (Supplementary Figure S3B). The THB was located at the bottom rear of the ground high-pressure system such that there was an evident zonal pressure gradient, and the wind speed in the THB, including the upstream areas, increased significantly. The cold air dominated by NWs carried the upstream PM2.5 southward rapidly, causing heavy pollution incidents in the THB; the PM2.5 concentration decreased in the upstream area, demonstrating that the temporal and spatial changes in the PM2.5 concentrations have a distinct cross-regional transport trend, and this transport is encouraged by NWs. On the third day of RTT, the influence of strong winds in the THB area continued, and the height of the PBL increased significantly (Figure 2). This caused atmospheric diffusion conditions to be sustained (Supplementary Figure S3C) and significantly affected the removal of PM2.5.
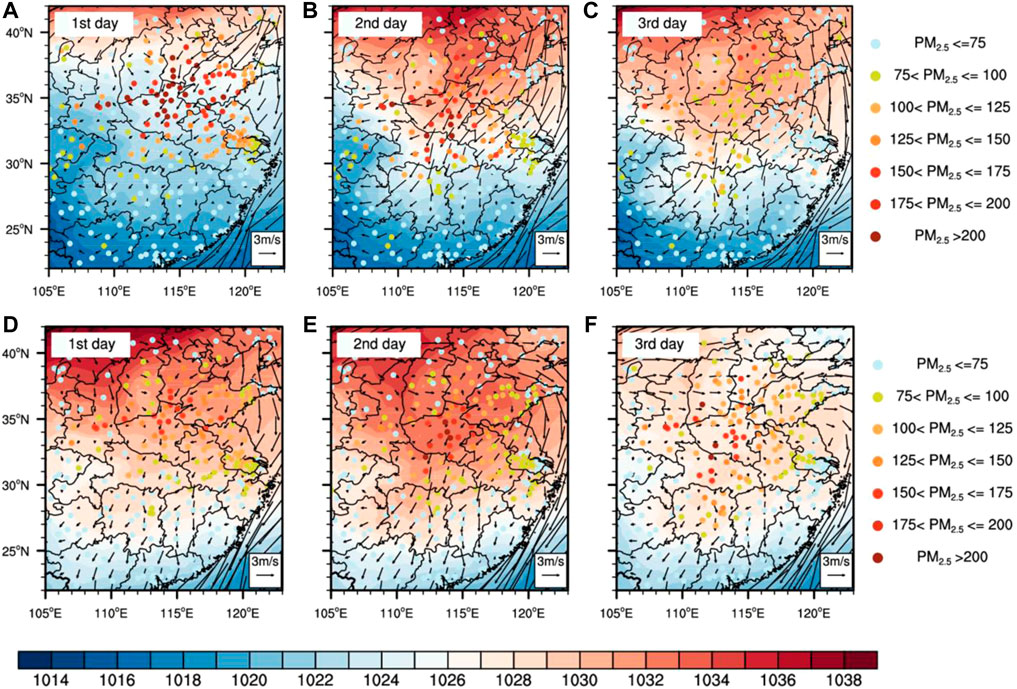
FIGURE 5. Distributions of daily surface PM2.5 concentrations (μg/m3) observed at the sites (colored dots), daily sea-level air pressure (hPa, color contours), and daily 10 m horizontal wind vectors (arrow) of ERA5-Land during the heavy air pollution averaged over six severe PM2.5 episodes of the top row (A,B,C) RTT and bottom row (D,E,F) SAT.
The early stage of SAT was similar to that of RTT. The regional diffusion conditions during the early stage were poor, and heavy pollution was primarily concentrated in the NCP (Supplementary Figure S3D, Figure 5D). The advection and diffusion conditions were relatively good on the day of transport in the THB, and the upstream high-concentration pollutants were transported to the THB by the northerly wind of the East Asian winter monsoons (Supplementary Figures S3E, 5E). However, during the maintenance stage (Figure 5F), the circulation evolved into a static stability pattern controlled by high pressure, and the wind speed decreased. The pollutant diffusion capacity in the horizontal and vertical directions weakened in the THB (Supplementary Figure S3F); the air pollutants were not easily diluted and diffused, resulting in PM2.5 remaining in the area, which aggravated the accumulation of local pollution. The PM2.5 concentrations of SAT are the result of the combined effects of local and regional sources, and transport is the predominant reason for reaching the peak.
Figure 6 depicts the evolution of the 925 hPa geopotential height and air temperature anomalies during the pollution processes. The results indicate that the 925 hPa synoptic circulation evolution is similar to that of the ground. In addition, on the first day of the RTT, positive air temperature anomalies appeared over the THB (Figure 6A). However, on the second day, the intensity of the southward cold air strengthened, and the air temperature anomalies in the THB reached −3°C to −2°C (Figure 6B); notably, the gradient of the geopotential strengthened, and the abnormal northeasterly wind carried upstream aerosol particles to the THB. The northern cold temperatures and high pressure were the greatest on the third day. Strong and deep cold air continued to sweep southward across the THB, and the air temperature anomalies reached −5°C to −3°C (Figure 6C). At this time, the intrusion of strong cold air could easily cause convective instability, and the local precipitation generated had a significant effect on the removal of PM2.5.
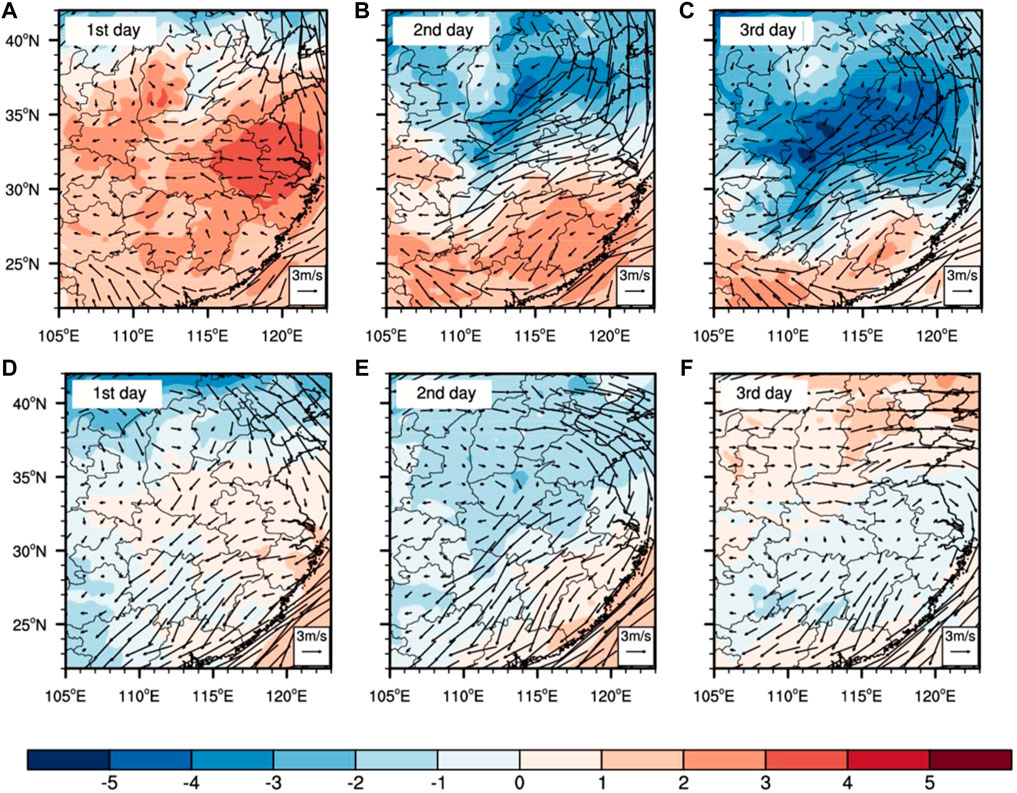
FIGURE 6. Spatial distributions of 925 hPa air temperature anomalies (color contours; K) and mean wind vectors(arrow) during the heavy air pollution process averaged over six severe PM2.5 episodes of the top row (A,B,C) RTT and bottom row (D,E,F) SAT.
The SAT was also affected by the southward cold air on the second day but was relatively weak; the air temperature anomalies in the THB were −2 to 0°C (Figure 6E), and the relatively strong northeast wind in front of the high-pressure circulation drove the transport of PM2.5 from the north to the THB. On the third day, the cold air weakened and dissipated, the upstream cold high pressure continued to move southward, and the THB was controlled by high-pressure circulation (Figure 6F). This high-pressure weather type is conducive to the retention of aerosol particles, such that they remain and accumulate over central China (Yan et al., 2021). Moreover, the influence of atmospheric diffusion conditions on the subsidence airflow induced by the weak northern high pressure requires attention (Supplementary Figure S4A). The descending motion in the low troposphere limited the development of the PBLH (Supplementary Figure S4B), which inhibited the vertical transport of PM2.5.
To characterize the vertical structures of regional PM2.5 transport during the two transport pollution patterns, Figure 7 shows a vertical profile of the average air temperature anomalies and wind vectors along 112°E–114°E during the heavy air pollution process (synthesis of average images of six typical RTT and SAT cases).
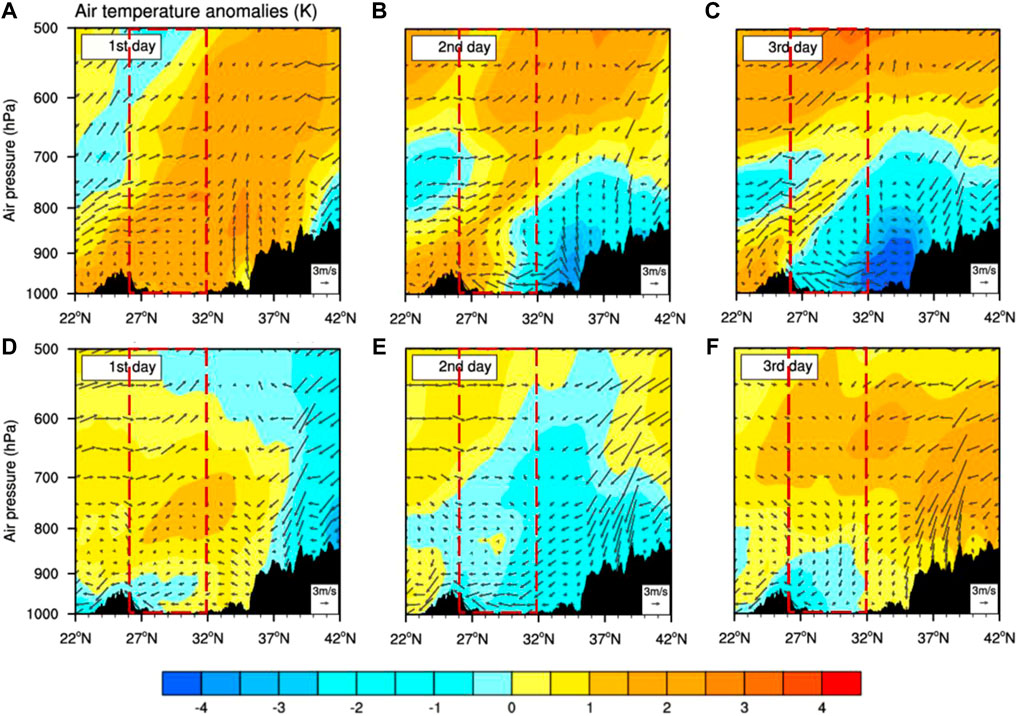
FIGURE 7. Vertical (height-latitude) cross sections of air temperature anomalies (color contours; °C), wind vectors (arrow), and terrain (black shades) along the 112°E–114°E averaged during the heavy air pollution process averaged over six severe PM2.5 episodes of the top row (A,B,C) RTT and bottom row (D,E,F) SAT. Red dotted frames denote the locations of the THB. Notably, the vertical speed of wind vectors is multiplied by -40 for the illustration of vertical circulation.
The positive air temperature anomalies mainly covered the THB on the first day of the RTT (Figure 7A). On the second day, the cold-air mass within the PBL began to penetrate southward and was embedded at the bottom of the warm air mass, leading to a rapid decrease in the air temperature at the low level of the THB (Figure 7B). There was a distinct dense contoured area in the pseudo-equivalent potential temperature profile, which tilted toward the cold air with height, indicating a substantial cold front over the THB (Supplementary Figure S5). Because of the invasion of the cold front, the warm air mass was uplifted and maintained, and the stable stratification in the front zone in the vertical direction inhibited the diffusion of air pollutants (Figure 7B). The cold front invasion persisted on the third day, leading to a further decrease in the air temperature (Figure 7C). Additionally, the passage of the cold front was conducive to precipitation. Therefore, the heavy PM2.5 pollution ended because of the lasting, strong northerly airflow diffusion and wet scavenging by the precipitation induced by the cold front.
To investigate the key factor for the decreasing PM2.5 concentrations of RTT, we determined the correlation coefficient between the observed surface PM2.5 concentrations and the VC and precipitation during the later stage (Figure 8A). Figure 8A indicates that the correlations between the VC and PM2.5 concentrations were negative and passed the 99% significance test (p < 0.01), and the decrease in PM2.5 was primarily due to the outflow of air pollutants by the strong prevalence of the northeasterly wind, which is closely related to the dispersion of air pollutants. Additionally, the surface PM2.5 concentrations and precipitation had negative correlations and passed the 95% significance test (p < 0.05), indicating that precipitation was a significant factor in the removal of PM2.5. In conclusion, good ventilation conditions and wet scavenging led to a decrease in PM2.5 during the RTT events.
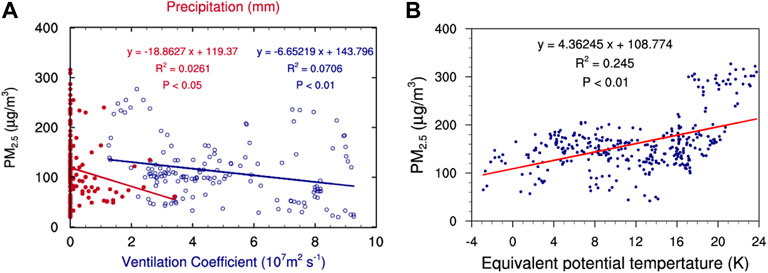
FIGURE 8. Correlation of surface PM2.5 concentration to precipitation (red solid circle) in JM in the later stage of (A) RTT, where the correlations are significant at 95%; correlations of surface PM2.5 concentration to ventilation coefficient (blue hollow circle, 107m2s−1) over the region (112–114°E and 30.5–31°N) averaged in the later stage of (A) RTT, where the correlations are significant at 99%; correlation of surface PM2.5 concentration to the difference in pseudo-equivalent potential temperature between the 700 hPa and 1,000 hPa (
Figure 7E indicates that on the second day of SAT, the northerly winds strengthened in the low troposphere over the THB and were controlled by a wide range of weak cold air. However, on the third day (Figure 7F), owing to the south-moving weak high-pressure control of the THB, the wind fields in the low troposphere gradually weakened, and the sinking airflow caused by the high pressure caused the troposphere to warm (Zhao et al., 2013; Wu et al., 2017). The atmospheric stratification of the middle and high levels was stable and often had air temperature inversions, inhibiting the vertical diffusion of air pollutants and aggravating the rapid accumulation of PM2.5. In addition, the topography of the southern THB has a weakening effect on the diffusion of PM2.5, resulting in persistent pollution over central China.
We selected the pseudo-equivalent potential temperature difference (700–1,000 hPa,
Growing evidence has identified the dominant role of the regional transport of PM2.5 and its precursors from upstream regions in the formation of severe PM2.5 episodes over the THB (Lu et al., 2019; Hu et al., 2021; Shen et al., 2021; Bai et al., 2022). Thus, we identified two typical transport patterns, RTT and SAT, and analyzed the evolutionary features and meteorological mechanisms of the two patterns. The SAT in central China is similar to the heavy pollution in the NCP, which has instances of both the pollution transport stage (TS) and the cumulative stage (CS) during a heavy aerosol pollution episode (Liu et al., 2019; Zhong et al., 2018; Wenjie Zhang et al., 2019; Zhong et al., 2019). However, the formation and evolutionary mechanisms of the episodes in the two regions were different. For the NCP regions, the early stage of pollution already has unfavorable meteorological conditions, including a stable regional air mass and high condensation rate of water vapor (Zhong et al., 2018). The initial stage of SAT in central China emphasizes the dynamic driving function of cold air and strong NWs on the transport of PM2.5. In addition, during the CS, the two-way feedback mechanism (turbulence weakening and decrease in PBLH) of aerosol accumulation and unfavorable meteorological conditions is emphasized in the NCP, resulting in the occurrence of the explosive growth of PM2.5 during this period (Wenjie Zhang et al., 2019); the presence of heavy PM2.5 pollution in central China emphasizes that local meteorological conditions tend to be stable and stagnant due to the evolution of the atmospheric circulation, especially the inhibition effect of the northern, weak, cold high-pressure downdraft on the PBLH and dynamic vertical diffusion conditions, which are conducive to the retention and accumulation of upwind area pollutants. Many pollution processes conducted in central China have the same feature of slow PM2.5 accumulation during the CS, which differs substantially from the explosive growth of PM2.5 in the NCP during the CS. The contribution of the two-way feedback mechanism of SAT during the CS in central China on the accumulation of local PM2.5 concentration requires a quantitative evaluation in future research.
In this study, by integrating multiple observations and reanalysis data, two typical types of severe PM2.5 episodes induced by the regional transport of PM2.5 over central and eastern China were distinguished, with distinct patterns driven by changes in the synoptic patterns and meteorological conditions (Figure 9). This could provide a more comprehensive understanding of the meteorological formation of severe air pollution episodes over a receptor region in the regional transport of air pollutants.
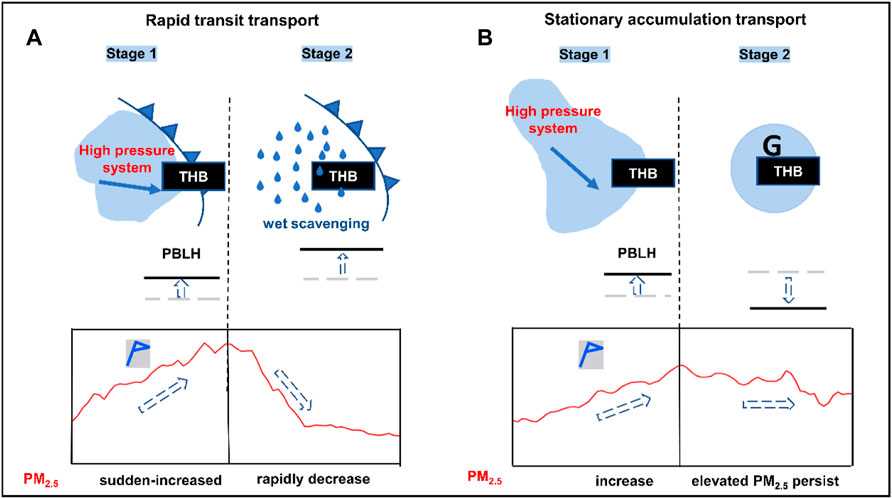
FIGURE 9. Diagram of meteorological mechanism on regional PM2.5 transport with the typical patterns of (A) RTT and (B) SAT driving the PM2.5 concentration changes (bottom line graphs) for heavy air pollution over the THB revealed in this study.
The meteorological conditions triggering RTT and SAT episodes were similar to the invasion of cold air from strong northern winds, resulting in the rapid growth of PM2.5 concentrations in the THB. Although the transport patterns were similar, their specific evolutionary patterns were different. The RTT episodes are characterized by explosive growth in PM2.5, with the rate of the increase from moderate to severe pollution levels reaching 12.5 μg/m3/h, and the duration of severe pollution is short, with an average time of approximately 27.5 h. By contrast, the rate of increase in PM2.5 for the SAT episodes was lower than that of RTT, with a rate of 5.7 μg/m3/h, and the duration of heavy pollution was much longer than that of RTT, with an average value of 72.8 h.
For the RTT pattern, the THB is affected by the invasion of a strong cold front during the early stage, creating favorable meteorological conditions for regional PM2.5 pollution, with a rising boundary layer height and strong cold air owing to the north westerlies. Moreover, the stable vertical stratification in the free troposphere could prevent PM2.5 from escaping outward, restricting the vertical diffusion of abundant aerosol particles within the PBL. Strong northerly winds and precipitation after the cold front have a considerable effect on the removal of PM2.5.
In the SAT pattern, the THB is at the bottom of the northern weak cold high-pressure system during the early stage, and a wide range of weak cold air moves southward. During the later stage, the THB is mainly controlled by the southward advance of a weak high-pressure system, which generates a uniform pressure field, weak wind speed, and strong descending airflow in the lower troposphere, facilitating the accumulation of PM2.5. Owing to the high-pressure downdraft, the troposphere is warmed significantly, and the PBLH is strongly reduced, restricting the high-concentration pollutants from upstream to the lower PBL. Strong stable stratifications contribute significantly to aggravating heavy air pollution during the later stage of SAT events.
Based on the investigation of the heavy PM2.5 transport episodes over the THB area, this study reveals the synergetic mechanism of regional PM2.5 concentrations, atmospheric circulation, atmospheric thermal conditions, and dynamic factors in two distinct transport patterns. Further exploration would focus on comprehensive modeling to assess the relative contributions of the physical and chemical processes of PM2.5 for heavy-pollution episodes with different patterns of regional transport.
Publicly available datasets were analyzed in this study. These data can be found at: https://www.ecmwf.int/en/forecasts/datasets/reanalysis-datasets/era5.
YW: conceptualization, methodology, investigation, writing‐original draft, and writing‐review and editing. YB: conceptualization, methodology, funding acquisition, writing‐review and editing, and supervision. XZ: conceptualization, writing‐review and editing, and supervision. KW: conceptualization, data curation, and resources. TZ, YZ, JX, SZ, WZ, WH, LZ, and KM were involved in the scientific interpretation and discussion. All authors provided commentary on the study.
This research has been supported by the National Natural Science Foundation of China (grant nos. 42075186 and 41830965) and the special project “The impact of weather conditions on the spread of pandemic influenza virus (2020xtzx004)” from the Collaborative Innovation Center on Forecast and Evaluation of Meteorological Disasters, Nanjing University of Information Science and Technology.
The authors declare that the research was conducted in the absence of any commercial or financial relationships that could be construed as a potential conflict of interest.
All claims expressed in this article are solely those of the authors and do not necessarily represent those of their affiliated organizations, or those of the publisher, the editors, and the reviewers. Any product that may be evaluated in this article, or claim that may be made by its manufacturer, is not guaranteed or endorsed by the publisher.
The authors thank the MEIC team from Tsinghua University for providing the multiscale emission inventory of China (MEIC).
The Supplementary Material for this article can be found online at: https://www.frontiersin.org/articles/10.3389/fenvs.2022.890514/full#supplementary-material
Supplementary Figure S1 | Boxplot of the rising rate of PM2.5 concentrations from the light pollution (75 μg/m3) to heavy pollution (150 μg/m3) of 12 episodes for RTT and six episodes for SAT in transport corridor cities: XY, JM, and JZ in the THB.
Supplementary Figure S2 | Temporal changes in PM2.5 concentration (black lines), PBLH (red lines), wind directions at 10 m (Wdir, vectors), and precipitation (purple triangles) were observed at JM in the THB. (A,C,E) The left column represents the other three cases of RTT, and (B,D,F) the right column represents the other three cases of SAT.
Supplementary Figure S3 | Spatial distributions of VC (107 m2s-1) during the heavy air pollution process averaged over six severe pollution episodes of (top row; A,B,C) RTT and (bottom row; D,E,F) SAT.
Supplementary Figure S4 | Spatial distributions of (A) 850 hPa vertical velocity (color contours; Pa/s); (B) PBLH anomalies (color contours; m) on the 3rd day of the heavy air pollution process averaged over six severe PM2.5 episodes of SAT.
Supplementary Figure S5 | Vertical (height-latitude) cross-sections of pseudo-equivalent potential temperature (color lines; K) and terrain (black shades) along 112°E–114°E averaged on the 2nd day of the heavy air pollution process averaged over six severe PM2.5 episodes of RTT. Red dotted frames denote the locations of the front zone.
Supplementary Table S1 | Overview of six heavy PM2.5 episodes with the pattern RTT.
Supplementary Table S2 | Overview of six heavy PM2.5 episodes with the pattern SAT.
Bai, Y.-Q., Wang, Y., Kong, S.-F., Zhao, T.-L., Zhi, X.-F., Zheng, H., et al. (2021). Modelling the Effect of Local and Regional Emissions on PM2.5 Concentrations in Wuhan, China during the COVID-19 Lockdown. Adv. Clim. Change Res. 12, 871–880. doi:10.1016/j.accre.2021.09.013
Bai, Y., Zhao, T., Hu, W., Zhou, Y., Xiong, J., Wang, Y., et al. (2022). Meteorological Mechanism of Regional PM2.5 Transport Building a Receptor Region for Heavy Air Pollution over Central China. Sci. Total Environ. 808, 151951. doi:10.1016/j.scitotenv.2021.151951
Bao, X., and Zhang, F. (2019). How Accurate Are Modern Atmospheric Reanalyses for the Data-Sparse Tibetan Plateau Region? J. Clim. 32, 7153–7172. doi:10.1175/JCLI-D-18-0705.1
Cai, W., Li, K., Liao, H., Wang, H., and Wu, L. (2017). Weather Conditions Conducive to Beijing Severe Haze More Frequent under Climate Change. Nat. Clim Change 7, 257–262. doi:10.1038/nclimate3249
Cao, J.-J., Shen, Z.-X., Chow, J. C., Watson, J. G., Lee, S.-C., Tie, X.-X., et al. (2012). Winter and Summer PM 2.5 Chemical Compositions in Fourteen Chinese Cities. J. Air Waste Manage. Assoc. 62, 1214–1226. doi:10.1080/10962247.2012.701193
Chan, C. K., and Yao, X. (2008). Air Pollution in Mega Cities in China. Atmos. Environ. 42, 1–42. doi:10.1016/j.atmosenv.2007.09.003
Chen, Q., Sheng, L., Gao, Y., Miao, Y., Hai, S., Gao, S., et al. (2019). The Effects of the Trans-regional Transport of PM2.5 on a Heavy Haze Event in the Pearl River Delta in January 2015. Atmosphere 10, 237. doi:10.3390/atmos10050237
Diaz Resquin, M., Santágata, D., Gallardo, L., Gómez, D., Rössler, C., and Dawidowski, L. (2018). Local and Remote Black Carbon Sources in the Metropolitan Area of Buenos Aires. Atmos. Environ. 182, 105–114. doi:10.1016/j.atmosenv.2018.03.018
Fallmann, J. (2016). Secondary Effects of Urban Heat Island Mitigation Measures on Air Quality. Atmos. Environ. 125, 199–211. doi:10.1016/j.atmosenv.2015.10.094
Gao, J., Tian, H., Cheng, K., Lu, L., Zheng, M., Wang, S., et al. (2015). The Variation of Chemical Characteristics of PM2.5 and PM10 and Formation Causes during Two Haze Pollution Events in Urban Beijing, China. Atmos. Environ. 107, 1–8. doi:10.1016/j.atmosenv.2015.02.022
Gu, S., Guenther, A., and Faiola, C. (2021). Effects of Anthropogenic and Biogenic Volatile Organic Compounds on Los Angeles Air Quality. Environ. Sci. Technol. 55, 12191–12201. doi:10.1021/acs.est.1c01481
Guo, J., Niu, T., Wang, F., Deng, M., and Wang, Y. (2013). Integration of Multi-Source Measurements to Monitor Sand-Dust Storms over North China: A Case Study. Acta Meteorol. Sin 27, 566–576. doi:10.1007/s13351-013-0409-z
Guo, J., Li, Y., Cohen, J. B., Li, J., Chen, D., Xu, H., et al. (2019). Shift in the Temporal Trend of Boundary Layer Height in China Using Long‐Term (1979–2016) Radiosonde Data. Geophys. Res. Lett. 46, 6080–6089. doi:10.1029/2019GL082666
Guo, J., Zhang, J., Yang, K., Liao, H., Zhang, S., Huang, K., et al. (2021). Investigation of Near-Global Daytime Boundary Layer Height Using High-Resolution Radiosondes: First Results and Comparison with ERA5, MERRA-2, JRA-55, and NCEP-2 Reanalyses. Atmos. Chem. Phys. 21, 17079–17097. doi:10.5194/acp-21-17079-2021
Hou, X., Fei, D., Kang, H., Zhang, Y., and Gao, J. (2018). Seasonal Statistical Analysis of the Impact of Meteorological Factors on fine Particle Pollution in China in 2013-2017. Nat. Hazards 93, 677–698. doi:10.1007/s11069-018-3315-y
Hu, W., Zhao, T., Bai, Y., Kong, S., Xiong, J., Sun, X., et al. (2021). Importance of Regional PM2.5 Transport and Precipitation Washout in Heavy Air Pollution in the Twain-Hu Basin over Central China: Observational Analysis and WRF-Chem Simulation. Sci. Total Environ. 758, 143710. doi:10.1016/j.scitotenv.2020.143710
Huang, R.-J., Zhang, Y., Bozzetti, C., Ho, K.-F., Cao, J.-J., Han, Y., et al. (2014). High Secondary Aerosol Contribution to Particulate Pollution during Haze Events in China. Nature 514, 218–222. doi:10.1038/nature13774
Huang, Y., Ji, Y., Zhu, Z., Zhang, T., Gong, W., Xia, X., et al. (2020). Satellite-based Spatiotemporal Trends of Ambient PM2.5 Concentrations and Influential Factors in Hubei, Central China. Atmos. Res. 241, 104929. doi:10.1016/j.atmosres.2020.104929
Huang, J., Yin, J., Wang, M., He, Q., Guo, J., Zhang, J., et al. (2021). Evaluation of Five Reanalysis Products with Radiosonde Observations over the Central Taklimakan Desert during Summer. Earth Space Sci. 8. doi:10.1029/2021EA001707
Ji, Y., Qin, X., Wang, B., Xu, J., Shen, J., Chen, J., et al. (2018). Counteractive Effects of Regional Transport and Emission Control on the Formation of fine Particles: a Case Study during the Hangzhou G20 summit. Atmos. Chem. Phys. 18, 13581–13600. doi:10.5194/acp-18-13581-2018
Kang, H., Zhu, B., Gao, J., He, Y., Wang, H., Su, J., et al. (2019). Potential Impacts of Cold Frontal Passage on Air Quality over the Yangtze River Delta, China. Atmos. Chem. Phys. 19, 3673–3685. doi:10.5194/acp-19-3673-2019
Lapere, R., Menut, L., Mailler, S., and Huneeus, N. (2021). Seasonal Variation in Atmospheric Pollutants Transport in central Chile: Dynamics and Consequences. Atmos. Chem. Phys. 21, 6431–6454. doi:10.5194/acp-21-6431-2021
Li, J., Wang, Z., Huang, H., Hu, M., Meng, F., Sun, Y., et al. (2013). Assessing the Effects of Trans-boundary Aerosol Transport between Various City Clusters on Regional Haze Episodes in spring over East China. Tellus B: Chem. Phys. Meteorol. 65, 20052. doi:10.3402/tellusb.v65i0.20052
Lin, X., Wu, W., Han, M., Liu, T., Wu, X., and Liu, A. (2016). Cause Comparison Analysis of Different Fallen Area of Heavy Rain Caused by Typhoon landing in Northeast Fujian. J. Nat. Disasters 25, 48–55. doi:10.13577/j.jnd.2016.0406
Liu, L., Zhang, X., Zhong, J., Wang, J., and Yang, Y. (2019). The 'two-Way Feedback Mechanism' between Unfavorable Meteorological Conditions and Cumulative PM2.5 Mass Existing in Polluted Areas South of Beijing. Atmos. Environ. 208, 1–9. doi:10.1016/j.atmosenv.2019.02.050
Lu, C., Deng, Q.-h., Liu, W.-w., Huang, B.-l., and Shi, L.-z. (2012). Characteristics of Ventilation Coefficient and its Impact on Urban Air Pollution. J. Cent. South. Univ. Technol. 19, 615–622. doi:10.1007/s11771-012-1047-9
Lu, M., Tang, X., Wang, Z., Wu, L., Chen, X., Liang, S., et al. (2019). Investigating the Transport Mechanism of PM2.5 Pollution during January 2014 in Wuhan, Central China. Adv. Atmos. Sci. 36, 1217–1234. doi:10.1007/s00376-019-8260-5
Miao, Y., Guo, J., Liu, S., Liu, H., Zhang, G., Yan, Y., et al. (2017). Relay Transport of Aerosols to Beijing-Tianjin-Hebei Region by Multi-Scale Atmospheric Circulations. Atmos. Environ. 165, 35–45. doi:10.1016/j.atmosenv.2017.06.032
Moreira, G. d. A., Guerrero-Rascado, J. L., Bravo-Aranda, J. A., Foyo-Moreno, I., Cazorla, A., Alados, I., et al. (2020). Study of the Planetary Boundary Layer Height in an Urban Environment Using a Combination of Microwave Radiometer and Ceilometer. Atmos. Res. 240, 104932. doi:10.1016/j.atmosres.2020.104932
Nair, V. S., Moorthy, K. K., Alappattu, D. P., Kunhikrishnan, P. K., George, S., Nair, P. R., et al. (2007). Wintertime Aerosol Characteristics over the Indo‐Gangetic Plain (IGP): Impacts of Local Boundary Layer Processes and Long‐range Transport. J. Geophys. Res. 112, 2006JD008099. doi:10.1029/2006JD008099
Ning, G., Wang, S., Yim, S. H. L., Li, J., Hu, Y., Shang, Z., et al. (2018). Impact of Low-Pressure Systems on winter Heavy Air Pollution in the Northwest Sichuan Basin, China. Atmos. Chem. Phys. 18, 13601–13615. doi:10.5194/acp-18-13601-2018
Niu, F., Li, Z., Li, C., Lee, K.-H., and Wang, M. (2010). Increase of Wintertime Fog in China: Potential Impacts of Weakening of the Eastern Asian Monsoon Circulation and Increasing Aerosol Loading. J. Geophys. Res. 115, D00K20. doi:10.1029/2009JD013484
Quan, J., Gao, Y., Zhang, Q., Tie, X., Cao, J., Han, S., et al. (2013). Evolution of Planetary Boundary Layer under Different Weather Conditions, and its Impact on Aerosol Concentrations. Particuology 11, 34–40. doi:10.1016/j.partic.2012.04.005
RenHe, Z., Li, Q., and Zhang, R. (2014). Meteorological Conditions for the Persistent Severe Fog and Haze Event over Eastern China in January 2013. Sci. China Earth Sci. 57, 26–35. doi:10.1007/s11430-013-4774-3
Shen, L., Hu, W., Zhao, T., Bai, Y., Wang, H., Kong, S., et al. (2021). Changes in the Distribution Pattern of PM2.5 Pollution over Central China. Remote Sens. 13, 4855. doi:10.3390/rs13234855
Shen, L., Zhao, T., Liu, J., Wang, H., Bai, Y., Kong, S., et al. (2022). Regional Transport Patterns for Heavy PM2.5 Pollution Driven by strong Cold Airflows in Twain-Hu Basin, Central China. Atmos. Environ. 269, 118847. doi:10.1016/j.atmosenv.2021.118847
Sujatha, P., Mahalakshmi, D. V., Ramiz, A., Rao, P. V. N., and Naidu, C. V. (2016). Ventilation Coefficient and Boundary Layer Height Impact on Urban Air Quality. Cogent Environ. Sci. 2, 1125284. doi:10.1080/23311843.2015.1125284
Wang, K., Tong, Y., Gao, J., Gao, C., Wu, K., Yue, T., et al. (2021). Impacts of LULC, FDDA, Topo-Wind and UCM Schemes on WRF-CMAQ over the Beijing-Tianjin-Hebei Region, China. Atmos. Pollut. Res. 12, 292–304. doi:10.1016/j.apr.2020.11.011
Wei, Y., Li, J., Wang, Z.-F., Chen, H.-S., Wu, Q.-Z., Li, J.-J., et al. (2017). Trends of Surface PM 2.5 over Beijing–Tianjin–Hebei in 2013–2015 and Their Causes: Emission Controls vs. Meteorological Conditions. Atmos. Oceanic Sci. Lett. 10, 276–283. doi:10.1080/16742834.2017.1315631
Zhang, W., Zhang, X., Zhong, J., Wang, Y., Wang, J., Zhao, Y., et al. (2019). The Effects of the "Two-Way Feedback Mechanism" on the Maintenance of Persistent Heavy Aerosol Pollution over Areas with Relatively Light Aerosol Pollution in Northwest China. Sci. Total Environ. 688, 642–652. doi:10.1016/j.scitotenv.2019.06.295
Wu, D., Fung, J. C. H., Yao, T., and Lau, A. K. H. (2013). A Study of Control Policy in the Pearl River Delta Region by Using the Particulate Matter Source Apportionment Method. Atmos. Environ. 76, 147–161. doi:10.1016/j.atmosenv.2012.11.069
Wu, G., Li, Z., Fu, C., Zhang, X., Zhang, R., Zhang, R., et al. (2016). Advances in Studying Interactions between Aerosols and Monsoon in China. Sci. China Earth Sci. 59, 1–16. doi:10.1007/s11430-015-5198-z
Wu, P., Ding, Y., and Liu, Y. (2017). Atmospheric Circulation and Dynamic Mechanism for Persistent Haze Events in the Beijing-Tianjin-Hebei Region. Adv. Atmos. Sci. 34, 429–440. doi:10.1007/s00376-016-6158-z
Wu, K., Kang, P., Tie, X., Gu, S., Zhang, X., Wen, X., et al. (2019). Evolution and Assessment of the Atmospheric Composition in Hangzhou and its Surrounding Areas during the G20 Summit. Aerosol Air Qual. Res. 9, 2757–2769. doi:10.4209/aaqr.2018.12.0481
Wu, K., Zhu, S., Liu, Y., Wang, H., Yang, X., Liu, L., et al. (2021). Modeling Ammonia and its Uptake by Secondary Organic Aerosol over China. Geophys. Res. Atmos. 126. doi:10.1029/2020JD034109
Xiong, J., Bai, Y., Zhao, T., Kong, S., and Hu, W. (2021). Impact of Inter-regional Transport in a Low-Emission Scenario on PM2.5 in Hubei Province, Central China. Atmosphere 12, 250. doi:10.3390/atmos12020250
Xu, J., Yan, F., Xie, Y., Wang, F., Wu, J., and Fu, Q. (2015). Impact of Meteorological Conditions on a Nine-Day Particulate Matter Pollution Event Observed in December 2013, Shanghai, China. Particuology 20, 69–79. doi:10.1016/j.partic.2014.09.001
Yan, S., Zhu, B., and Kang, H. (2019). Long‐Term Fog Variation and its Impact Factors over Polluted Regions of East China. J. Geophys. Res. Atmos. 124, 1741–1754. doi:10.1029/2018JD029389
Yan, Y., Zhou, Y., Kong, S., Lin, J., Wu, J., Zheng, H., et al. (2021). Effectiveness of Emission Control in Reducing PM2.5 Pollution in central China during winter Haze Episodes under Various Potential Synoptic Controls. Atmos. Chem. Phys. 21, 3143–3162. doi:10.5194/acp-21-3143-2021
Yang, X., Lu, Y., Zhu, X., He, J., Jiang, Q., Wu, K., et al. (2020). Formation and Evolution Mechanisms of Severe Haze Pollution in the Sichuan Basin, Southwest China. Aerosol Air Qual. Res. 20, 2557–2567. doi:10.4209/aaqr.2020.04.0173
Yu, C., Zhao, T., Bai, Y., Zhang, L., Kong, S., Yu, X., et al. (2020). Heavy Air Pollution with a Unique “Non-stagnant” Atmospheric Boundary Layer in the Yangtze River Middle basin Aggravated by Regional Transport of PM2.5 over China. Atmos. Chem. Phys. 20, 7217–7230. doi:10.5194/acp-20-7217-2020
Zhang, R., Wang, G., Guo, S., Zamora, M. L., Ying, Q., Lin, Y., et al. (2015). Formation of Urban Fine Particulate Matter. Chem. Rev. 115, 3803–3855. doi:10.1021/acs.chemrev.5b00067
Zhang, L., Guo, X., Zhao, T., Gong, S., Xu, X., Li, Y., et al. (2019). A Modelling Study of the Terrain Effects on Haze Pollution in the Sichuan Basin. Atmos. Environ. 196, 77–85. doi:10.1016/j.atmosenv.2018.10.007
Zhao, X. J., Zhao, P. S., Xu, J., Meng, W., Pu, W. W., Dong, F., et al. (2013). Analysis of a winter Regional Haze Event and its Formation Mechanism in the North China Plain. Atmos. Chem. Phys. 13, 5685–5696. doi:10.5194/acp-13-5685-2013
Zhong, J., Zhang, X., Wang, Y., Liu, C., and Dong, Y. (2018). Heavy Aerosol Pollution Episodes in winter Beijing Enhanced by Radiative Cooling Effects of Aerosols. Atmos. Res. 209, 59–64. doi:10.1016/j.atmosres.2018.03.011
Zhong, J., Zhang, X., Wang, Y., Wang, J., Shen, X., Zhang, H., et al. (2019). The Two-Way Feedback Mechanism between Unfavorable Meteorological Conditions and Cumulative Aerosol Pollution in Various Haze Regions of China. Atmos. Chem. Phys. 19, 3287–3306. doi:10.5194/acp-19-3287-2019
Zhou, Y., Bai, Y., Yue, Y., Lü, J., Chen, S., and Xiao, H. (2019). Characteristics of the Factors Influencing Transportation and Accumulation Processes during a Persistent Pollution Event in the Middle Reaches of the Yangtze River, China. Atmos. Pollut. Res. 10, 1420–1434. doi:10.1016/j.apr.2019.03.014
Zhou, Y., Yue, Y., Bai, Y., and Zhang, L. (2020). Effects of Rainfall on PM2.5 and PM10 in the Middle Reaches of the Yangtze River. Adv. Meteorol. 2020, 1–10. doi:10.1155/2020/2398146
Zhou, Y., Guo, J., Zhao, T., Lv, J., Bai, Y., Wang, C., et al. (2022). Roles of Atmospheric Turbulence and Stratification in a Regional Pollution Transport Event in the Middle Reaches of the Yangtze River. Earth Space Sci. 9. doi:10.1029/2021EA002062
Keywords: heavy air pollution, Twain-Hu Basin, regional PM2.5 transport, meteorological drivers, atmospheric vertical structure
Citation: Wang Y, Bai Y, Zhi X, Wu K, Zhao T, Zhou Y, Xiong J, Zhu S, Zhou W, Hu W, Zhang L and Meng K (2022) Two Typical Patterns of Regional PM2.5 Transport for Heavy Air Pollution Over Central China: Rapid Transit Transport and Stationary Accumulation Transport. Front. Environ. Sci. 10:890514. doi: 10.3389/fenvs.2022.890514
Received: 06 March 2022; Accepted: 25 March 2022;
Published: 26 April 2022.
Edited by:
Xinyao Xie, Institute of Mountain Hazards and Environment (CAS), ChinaCopyright © 2022 Wang, Bai, Zhi, Wu, Zhao, Zhou, Xiong, Zhu, Zhou, Hu, Zhang and Meng. This is an open-access article distributed under the terms of the Creative Commons Attribution License (CC BY). The use, distribution or reproduction in other forums is permitted, provided the original author(s) and the copyright owner(s) are credited and that the original publication in this journal is cited, in accordance with accepted academic practice. No use, distribution or reproduction is permitted which does not comply with these terms.
*Correspondence: Yongqing Bai, MjAwN2J5cUAxNjMuY29t; Xiefei Zhi, emhpQG51aXN0LmVkdS5jbg==
Disclaimer: All claims expressed in this article are solely those of the authors and do not necessarily represent those of their affiliated organizations, or those of the publisher, the editors and the reviewers. Any product that may be evaluated in this article or claim that may be made by its manufacturer is not guaranteed or endorsed by the publisher.
Research integrity at Frontiers
Learn more about the work of our research integrity team to safeguard the quality of each article we publish.