 Xiangwen Gong
 Xuyang Wang
 Yuqiang Li
 Lei Ma3,4
- 1Northwest Institute of Eco-Environment and Resources, Chinese Academy of Sciences, Lanzhou, China
- 2School of Resources and Environment, University of Chinese Academy of Sciences, Beijing, China
- 3Observation and Research Station of Ecological Restoration for Chongqing Typical Mining Areas, Ministry of Natural Resources, Chongqing Institute of Geology and Mineral Resources, Chongqing, China
- 4Wansheng Mining Area Ecological Environment Protection and Restoration of Chongqing Observation and Research Station, Chongqing Institute of Geology and Mineral Resources, Chongqing, China
- 5Naiman Desertification Research Station, Northwest Institute of Eco-Environment and Resources, Chinese Academy of Sciences, Tongliao, China
The Qinghai-Tibet Plateau (QTP), also known as the Earth’s “third pole,” is sensitive to climate change due to its extensive areas at high elevation, which are presently dominated by snow and ice. Based on daily observations from 1960 to 2016 at 94 meteorological stations, we quantified and compared changes in climate extremes on China’s QTP using 16 extreme temperature indices and 11 extreme precipitation indices, which calculated using colder (1961–1990) and warmer (1988–2016) base periods, respectively. The study showed that when a warmer base period is used, the trend magnitude of the cold temperature indices is amplified, while the trend magnitude of the warm temperature indices and the percentile-based precipitation indices are diminished. The regionally averaged temperature index trends were consistent with global warming, namely warmth indices such as the number of warm days, warm nights, summer days, and tropical nights all showed significant increases. However, the cold indices, such as the number of cool days, cool nights, ice days, and frost days, decreased significantly. The number of frost days and ice days decreased the fastest (3.9 and 2.9 days/decade, respectively), while the length of the growing season increased the fastest (2.9 days/decade). The warming trend strengthened with increasing latitude, and the occurrences of daytime extreme temperature events increased with increasing longitude. In addition, cold temperature events increased in frequency and intensity at high elevations, while warm temperature events decreased. We also found that average monthly maximum 1-day precipitation and maximum consecutive 5-day precipitation increased by 0.1 and 0.3 mm per decade, respectively. Extreme precipitation occurrences were more common in places with low latitudes and high longitudes. The strengthening Subtropical High Area (SHA) and Subtropical High Intensity (SHI), Westward movement of Subtropical High Western Ridge Point (SHW) have contributed to the changes in climate extremes on the Qinghai-Tibet Plateau. The study’s findings will provide a more comprehensive reference for predicting the occurrence of extreme events and improving the region’s disaster prevention capability.
1 Introduction
Global warming has become an indisputable fact. The sixth assessment report released by the Intergovernmental Panel on Climate Change (IPCC) stated that the global average surface air temperature observed from 2010 to 2019 increased by 1.06°C (with a range from 0.88 to 1.21°C) compared to the period from 1850 to 1900 (Eyring et al., 2021). It is generally believed that changes in the frequency or intensity of extreme weather and climate events would have greater impacts on both human society and natural systems than changes in the mean climate variables (Patz et al., 2005; McMichael et al., 2006; Thornton et al., 2014). According to the IPCC (2022), human-induced climate change, including more frequent and intense extreme events, has caused widespread adverse impacts and related losses and damages to nature and people, beyond natural climate variability. The rise in weather and climate extremes has led to some irreversible impacts as natural and human systems are pushed beyond their ability to adapt.
To improve this understanding, increasing attention has focused on the changes of temperature and precipitation extremes around the world. On a global scale, it has been confirmed that changes in climatic extremes impacted a considerable amount of the global geographical area during the second half of the 20th century (Frich et al., 2002). As a result of the warming, during the 20th century, there were widespread dramatic shifts in temperature extremes, especially for indices derived from the daily minimum temperature. Simultaneously, extreme precipitation changes revealed a widespread and considerable rise, but they were less geographically consistent than temperature increases (Alexander et al., 2006). In addition, changes in temperature extremes differed between paired urban and non-urban sites at a global scale, changes in extreme precipitation indices for matched urban and non-urban stations indicated no substantial distinction (Mishra et al., 2015).
Various regional research on temperature and precipitation extreme indices have been carried out in various areas, including the Central and South America (Aguilar et al., 2005; Haylock et al., 2006; Skansi et al., 2013), Europe (Klein Tank and Können, 2003), Asia-Pacific region (Griffiths et al., 2005), the Arabian Peninsula (Alsarmi and Washington, 2014), Africa (New et al., 2006; Dike et al., 2020), Central and South Asia (Klein Tank et al., 2006), and Georgia (Keggenhoff et al., 2014). These findings provide strong evidence that global warming is the primary factor causing significant changes in temperature and precipitation extremes, and the changes showed large regional variability because the magnitude and characteristics of climate change vary across geographically diverse regions. Extreme precipitation indices, such as the intensity and frequency of extreme precipitation events or the number of days with extreme precipitation and heavy precipitation events, have increased significantly in recent decades in the United States (Karl et al., 1995; Karl et al., 1996; Griffiths and Bradley 2007; Pryor et al., 2009), central India (Goswami et al., 2006), Japan (Iwashima and Yamamoto, 1993), southern Africa (Mason et al., 1999), and Bulgaria (Bocheva et al., 2009). However, extreme precipitation events have decreased in Germany (Tromel and Schonwiese, 2007), Poland (Lupikasza, 2009), and the Iberian Peninsula (Rodrigo, 2009). Thus, regional differences in temperature and precipitation extremes have been observed, implying an urgent need to improve regional studies of spatial and temporal trends in extreme climate events based on field observations.
In China, various regional studies on severe temperature and precipitation indices have been undertaken, and the results showed that global warming was generating major changes in temperature and precipitation extremes. These results generally showed that extreme cold indices, such as the number of frost days, cold days, and cold nights, have decreased in frequency and intensity, while warmth indices, such as the number of summer days, warm days, and warm nights, have increased, with varying magnitudes across China’s diverse regions (Li et al., 2011; Zhen and Li, 2014; Guan et al., 2015; Zhong et al., 2017). In northeastern, northwestern, and central China, the numbers of extreme precipitation events have declined, but have increased in northern, southwestern, and southern China (Lu et al., 2014; Li et al., 2015; Sun et al., 2016). All these variables showed regional disparities in change, demonstrating the need and practicality of researching the response to catastrophic climate events from a regional viewpoint (You et al., 2011). Unfortunately, the IPCC Assessment Report (Houghton et al., 2001) stated that China is a data-poor region, making it difficult to describe global precipitation trends from 1976 to 1999. As a result, providing more regional analysis for climate extremes and covering a longer period is becoming increasingly important.
The Qinghai-Tibet Plateau (QTP) is a giant Chinese geomorphological unit, and lies at the highest elevation of any plateau in the world. It has a unique natural environment and high spatial differentiation. The tectonic uplift of the plateau has profoundly affected the evolution of its natural environment and of adjacent areas, and climate change on the plateau is closely related to global environmental changes (Zheng, 1999). Therefore, the QTP is a “global climatic change’s driver and amplifier” (Pan and Li, 1996) and “the best natural laboratory for unified research on global change and Earth system science” (Bi, 1997). In recent years, a series of studies have been carried out on the QTP, focusing on the climate dynamic characteristics. For example, Liu and Chen (2000) examined station surface air temperature records and discovered that the majority of the QTP has warmed statistically since the mid-1950s. Wang et al. (2008) found that surface air temperature on the QTP increased by about 1.8°C during 1960–2007, or 0.36°C per decade. Li and Chi (2014) evaluated the thermal comfort and its changes in the QTP over the last 50 years using the physiological equivalent temperature, and revealed that annual cumulative number of thermally favorable days has been increasing, and that of cold stress has been reducing. Zhang et al. (2016) reported that showed QTP shows warm wet climate change dominated by temperature and humidity increase during 1971–2010. Wang et al. (2017) found that annual temperature on the QTP increased at a 0.42°C decade−1 rate from 1979 to 2012, with a 0.48°C decade−1 increase in the winter. Warming has clearly occurred over the QTP in recent decades, and the rate of warming on the QTP exceeds the averages for the Northern Hemisphere and the same latitudinal zone (Liu and Chen, 2000).
In comparison, extreme climate events on the QTP have not been widely studied, especially in terms of the regional variation of temperature and precipitation extremes and its change mechanism across the entire study area. A few extreme temperature studies have been conducted on the QTP, for example, You et al. (2008) reported that during 1961–2005 in the eastern and central QTP, the regional occurrence of extreme warm days and nights has increased by 1.26 and 2.54 days decade−1, and cold days and nights decreased by −0.85 and −2.38 days decade−1, respectively. Cuo et al. (2013) found that during 1957–2009 the mean minimum and maximum temperatures in the northern part of the QTP increased by 0.04 and 0.03°C year−1, respectively. Wang et al. (2013) confirmed that during 1973–2011 most warm-related indices of temperature extremes increase while cold-related indices show opposite trends over the western QTP. Ding et al. (2018) investigated the spatiotemporal distributions of 10 temperature extremes over the major river basins on the QTP from 1963 to 2015, and discovered that the warming rates of annual temperature extremes do not appear to be strongly influenced by elevation on the QTP. These studies concentrated on the QTP’s sub-regions, but because of the different time periods and datasets used, it is difficult to infer regional variations in temperature extremes from these studies. Furthermore, research on the temporal and spatial dynamics of precipitation extremes in this region is lacking.
The World Meteorological Organization Commission for Climatology’s Expert Team on Climate Change Detection, Monitoring, and Indicators, as well as the Climate Variability and Predictability project, have developed a set of indices (Peterson et al., 2001) that serve as a common guideline for regional climate analysis. The aim of this study is to use field-measured values of these indices to gain a better knowledge of recent changes in climate severe event variability, severity, frequency, and duration across the entire QTP. To do so, we analyzed temperature and precipitation extreme indices based on data from numerous meteorological stations in the region. We hypothesized that both temperature and precipitation extreme indices on the plateau would show significant long-term trends, and that these trends would exhibit spatial variation related to variations in the plateau’s geographic characteristics, and the temporal variations are mainly associated with atmospheric circulation patterns.
2 Data and Methods
2.1 Study Area
We defined the boundary of the QTP based on the system for defining China’s physical and geographical regions (Zheng, 1996). The plateau is situated in southwestern China (Figure 1), where it covers an area of 2,603,431 km2. The elevation is generally greater than 4,000 m. The plateau is surrounded by high and extensive mountain ranges interlaced with valleys and basins. The northwest is generally cold and dry, while the southeast is warm and wet. Across the entire QTP, the annual average temperature ranging from −5.6 to 17.6°C across the region, and the temperature difference between day and night ranges from 14 to 17°C. The precipitation distribution is uneven, with annual precipitation averaging more than 2000 mm in the southeast and approximately 17.6 mm in the northwest (Zhang et al., 2017). The annual average wind speed is generally greater than 3.0 m s−1 in the northwest, with more than 50 gale days (i.e., a wind speed ≥17 m s−1) annually (Li et al., 2001).
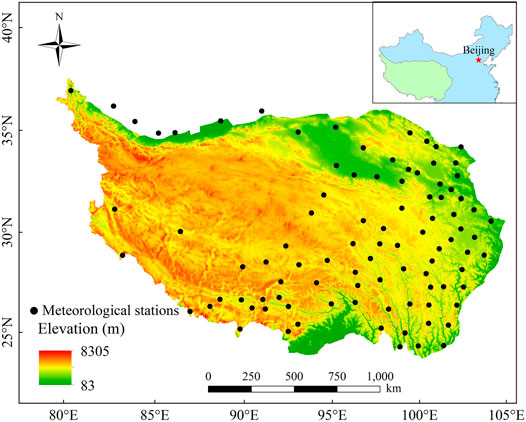
FIGURE 1. Study area and the distribution of meteorological stations. A total of 89 meteorological stations were located within the Qinghai-Tibet Plateau, and 5 stations were in areas surrounding the plateau.
2.2 Data and Quality Control
We collected quality-controlled meteorological data from 94 meteorological stations over the QTP, including daily maximum and minimum temperatures, as well as daily precipitation (Figure 1). The National Climate Center of the China Meteorological Administration (http://data.cma.cn) provided the data from 1960 to 2016 (the most recent data available) was obtained. Due to strict quality control, it includes: 1) Climatic limit value or allowable value check, 2) station extreme value check, 3) internal consistency check between timing value, daily average and daily extreme value, 4) time consistency check, 5) space Consistency check, 6) manual verification and correction, the quality and integrity of the data set are greatly improved. To further ensure data quality, 1) we replaced all missing values with an internal format recognized by the R statistical software (i.e., NA, for not available), and 2) replaced all unreasonable values with NA. Unreasonable values include 1) a daily rainfall that was less than 0 mm and 2) a daily minimum temperature that was higher than the daily maximum temperature. We also found outliers in daily maximum and minimum temperatures, which we characterized as daily values that were outside of a range specified as n times the standard deviation (STD) of that day’s value. In this study, we defined that threshold as the mean plus or minus 5 STD based on the criteria used in previous studies (Rusticucci and Barrucand, 2004; Haylock et al., 2008; Croitoru and Piticar, 2013).
Non-climatic effects such as weather station relocation, land use changes, instrument adjustments, and observational hours can all have an impact on observed climate data (Peterson et al., 1998; Aguilar et al., 2003). These effects cause inhomogeneity, resulting in a shift in the mean of a time series, which can lead to first order autoregressive errors. To detect and adjust first-order autoregressive errors produced by shifts, we utilized version 4 of the RHtests program created by Wang and Feng at the Climate Research Branch of the Meteorological Service of Canada (http://etccdi.pacificclimate.org/software.shtml). The penalized maximum t test (Wang et al., 2007) and the penalized maximal F test (Wang, 2008b) were used in the RHtests package, which are incorporated in a recursive testing algorithm that adjusts empirically for an autocorrelation with a lag of –1 (if any) in the time series (Wang, 2008a). The default parameters in RHtests packages were used to detect and adjust for a whole data series in each station at the 0.05 significance level. RHtests packages can detect possible single or multiple change-points in a time series, and confirmed step changes can be adjusted (Wang et al., 2013). Once a possible change has been identified, the metadata (including documented station relocation and instrument update) should be checked to identify any potentially valid explanations. Notably, a homogenous time series that is well correlated with the base series may be used as a reference series. When a homogenous reference series is not available, the RHtestsV4 package can detect changepoints. However, the results are less reliable and require further investigation. Data homogenization should not be performed automatically without the use of a reference series (i.e., without intensive manual analysis of the statistical test results). Furthermore, because the time series being tested may have a zero trend or a linear trend over the entire period of record. The problem of uneven distribution of false alarm rate and detection power is also greatly alleviated by using empirical penalty functions. As a result, RHtestsV4 (and RHtestsV3 and RHtestsV2) outperforms RHtestsV0.95, which did not account for autocorrelation and did not address the problem of uneven distribution of false alarm rate and detection power (Wang et al., 2007; Wang, 2008b).
2.3 Index Calculations
The climatic extreme indices were computed using the RClimDex program created by Xuebin Zhang and Feng Yang of the Canadian Meteorological Service (Zhang and Yang, 2004). To investigate the problematic impact of using a different base period (colder 1961–1990 vs. warmer 1988–2016) on the extreme temperature and precipitation indices, as well as the corresponding trend magnitude. The current study’s extreme indices (16 temperature and 11 precipitation indices; Table 1) were calculated using two different base periods for comparison. The first base period was the 1961–1990 standard normal period (WMO, 2017). The second base period lasted from 1988 to 2016. The first base period represents a relatively cold period, whereas the second base period represents a significantly warmer period (Yosef et al., 2021). In recent years, these indices have been widely applied to assess variations in temperature and precipitation extremes for different regions of the world (Croitoru et al., 2016; Filahi et al., 2016; Sun et al., 2016; Supari et al., 2017; Gbode et al., 2019). Table 1 provides a brief description of each index. Based on how the temperature indices are computed, they can be further grouped into four categories (Croitoru and Piticar, 2013; Wang et al., 2018). The absolute indices are defined based on a fixed threshold for the recorded temperature, and comprise the number of summer days (SU), frost days (FD), ice days (ID), and tropical nights (TR). The percentile-based threshold indices comprise the number of cool nights (TN10p), cool days (TX10p), warm nights (TN90p), warm days (TX90p), warm and cold spell durations (WSDI and CSDI), which were identified using percentile-based thresholds (with values of 10 and 90% for the lower and upper bounds, respectively). The extremal indices comprise indices computed based on the absolute values observed in the area without taking any thresholds into account: the monthly maximum value of the daily maximum temperature (TXx), monthly maximum value of daily minimum temperature (TNx), monthly minimum value of the daily maximum temperature (TXn), and monthly minimum value of daily minimum temperature (TNn). The last category extremes include the growing season length (GSL) and diurnal temperature range (DTR). The precipitation indices are divided into 2 percentile, 3 thresholds, 2 durations, 2 extremal values, and 2 additional indices, with 1 dry index and 10 wet indices (Powell and Keim, 2015).
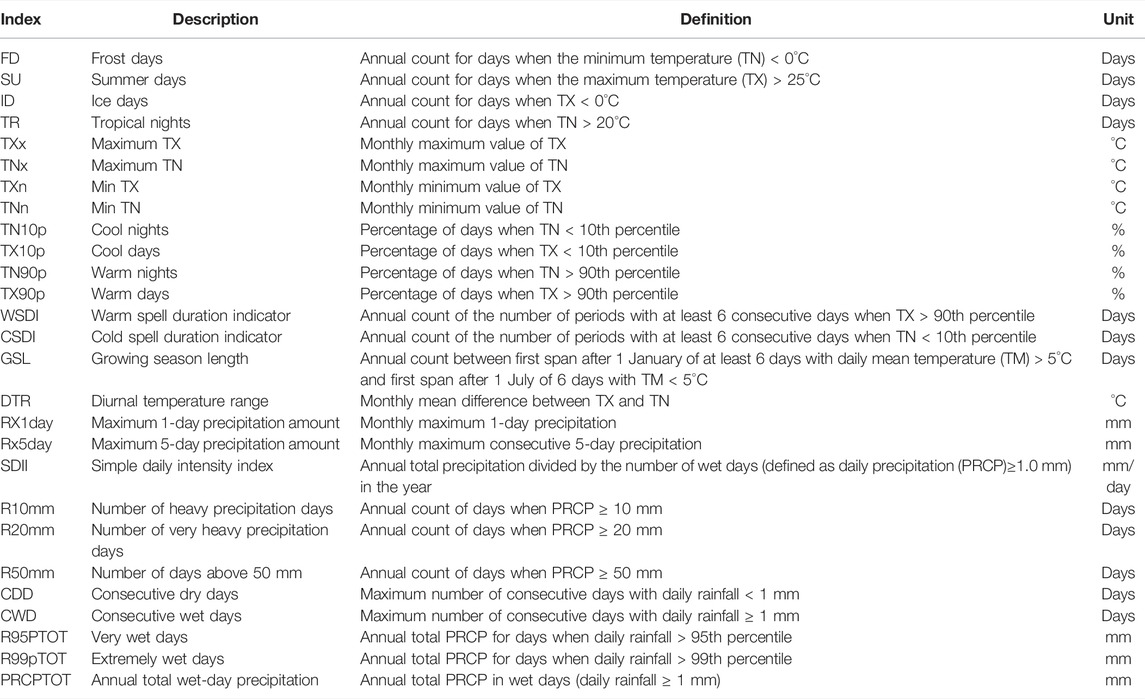
TABLE 1. List of the temperature and precipitation indices used in this study, which were defined by the Expert Team on Climate Change Detection and Indices (http://etccdi.pacificclimate.org/list_27_indices.shtml).
2.4 Atmospheric Circulation Patterns
The monthly Arctic Oscillation (AO), North Atlantic Oscillation (NAO), Southern Oscillation Index (SOI), and Pacific Decadal Oscillation (PDO) data from 1960 to 2016 were available from the National Oceanic and Atmospheric Administration (http://www.esrl.noaa.gov/psd/data/climateindices/list/). In addition, the monthly West Pacific Subtropical High Index (WPSHI), including the Subtropical High Area (SHA) index, Subtropical High Intensity (SHI) index, Subtropical High Ridge Line (SHR) index, and Subtropical High Western Ridge Point (SHW) index, which obtained from the Climate Diagnostics and Prediction Division, National Climate Center, China Meteorological Administration (http://cmdp.ncc-cma.net/Monitoring/). SHW and SHR indicate the location and direction of Western Ridge Point and Ridge Line. When the Western Ridge Point is located further east, the SHW will increase; and when the Subtropical High Ridge Line is located further north, the SHR will increase.
2.5 Analytical Methods
Time series data is often influenced by previous observations. When data is not random and influenced by autocorrelation, modified Mann-Kendall (MMK) tests may be used for trend detction studies. Hamed and Rao (1998) have proposed a variance correction approach to address the issue of serial correlation in trend analysis. Data are initially detrended and the effective sample size is calculated using the ranks of significant serial correlation coefficients which are then used to correct the inflated (or deflated) variance of the test statistic. Therefore, the MMK test was performed to analyze the time series trends for the climate indices at each meteorological station in this study, and the magnitude of the trends was calculated using the Sen’s slope estimator (Sen, 1968). A trend is considered significant if it is statistically significant at the 5% level. This trend analysis was conducted using Hamed and Rao Modified MK Test in python package “pyMannKendall” (Hussain and Mahmud, 2019). To characterize the spatial pattern of trends in the climatic indices, we utilized the data visualization in version 10.3 of the ArcMap software (http://www.esri.com). We employed Spearman’s correlation coefficient to find significant relationships among the extremal variables. Partial correlation coefficient was used to detect significant relationships between extreme climate events and geographic attributes (latitude, longitude, and elevation). Furthermore, regional averages for each index were computed to summarize the long-term changes observed in QTP (1960–2016). The regional averaged temperature and perception indices were calculated by taking the unweighted mean of the indices at each station.
3 Results and Discussion
3.1 Trends in Extreme Temperature Events
3.1.1 Temporal Trends for Temperature Extremes
On the QTP, the regionally averaged annual occurrence of cold indices, including the numbers of cool days (TX10p), cool nights (TN10p), ice days (ID), and frost days (FD) decreased significantly (p < 0.001), at rates of 1.0, 1.5, 2.7, and 3.9 days per decade, respectively (Figure 2), with the trend was strongest for TN10p (Z = −7.39). In contrast, the numbers of warm days (TX90p), warm nights (TN90p), summer days (SU), and tropical nights (TR) grew significantly (p < 0.001) at rates of 1.1, 1.6, 1.4, and 0.3 days per decade, respectively. The most significant increase (Z = 6.64) was seen in TN90p. Figure 2 shows the changes in the regionally averaged annual occurrence of temperature extremes when they are derived from the two base periods, 1961–1990 (colder) versus 1988–2016 (warmer). We found significant differences in the percentile-based threshold indices (including TN10p, TX10p, TN90p, TX90p, WSDI, and CSDI) calculated using two base periods, but no differences in the other temperature extremes. Specially, the indices defined by a threshold less than 10th percentile (TX10p, TN10p, CSDI) were larger when a warmer base period (1988–2016) was used rather than a colder base period (1961–1990), whereas the 90th percentile indices were the opposite. Furthermore, it was found that the trend magnitude of the cold indices (TX10p, TN10p, CSDI) is amplified while the trend magnitude of the warm indices (TX90p, TN90p) is diminished when a warmer base period is used. For example, the regional averaged trend for CSDI was 1.3 days per decade versus 1.1 days per decade when warmer (1988–2016) and colder (1961–1990) base periods were used, respectively. The change rate of the TX90p was 0.9% per decade versus 1.1% per decade based on warmer (1988–2016) and colder (1961–1990) periods. Klein Tank et al. (2009) stated that when estimating the changes in the indices over time, the choice of another normal period (e.g., 1971–2000) has only a minor impact on the results. This claim is consistent with the findings of Yosef et al. (2019), who found that percentiles from the base periods 1961–1990 and 1971–2000 have a similar impact on trend magnitude of order. This assertion, however, does not hold in a rapidly changing (non-stationary climate) world with a clear and continuing warming trend. Our results showed that the choice of base period has a significant effect on the magnitude of the slope, namely when a warmer base period is used, the trend magnitude of the 10th percentile-based indices is amplified, while the trend magnitude of the 90th percentile-based indices is reduced. This mainly attributed to the presence of continuous global warming, deriving percentiles from a distribution shifted to the right results in higher thresholds that must be met. As a result, when the 10th percentile was derived from a recent warmer (e.g., 1988–2017) base period, the threshold (absolute) values were higher than when the 10th percentile was derived from a colder (1961–1990) base period, resulting in a stronger (steeper) trend magnitude. This was contrast to when the 10th percentiles were calculated using the 1961–1990 base period. In the last two decades, exceeding the thresholds derived from that distribution has become quite rare. As a result, the slope was more gentle in this case. The 90th percentile, which was derived from a warmer base period, showed the opposite trend. In this case, the threshold values were higher than in the cooler past, reducing the frequency with which these high thresholds were exceeded in the past and now (Yosef et al., 2021).
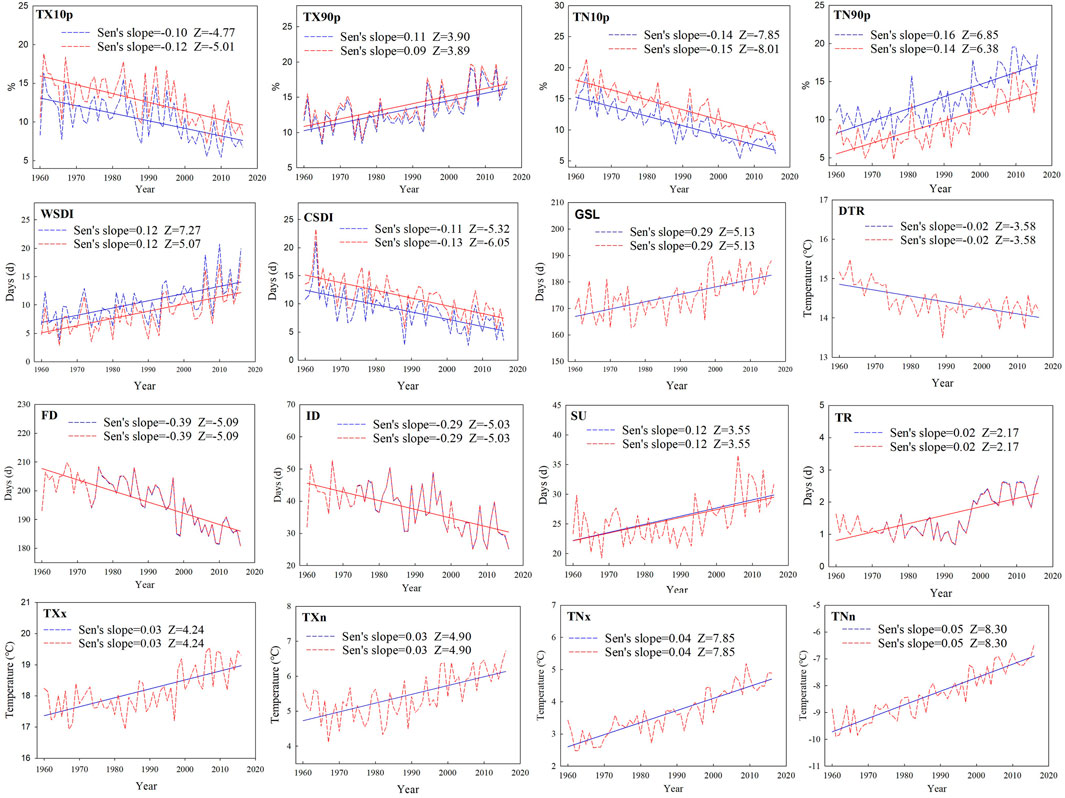
FIGURE 2. Regionally averaged time series for the extreme temperature indices on the Qinghai-Tibet Plateau from 1960 to 2016. The indices are defined in Table 1. The red and blue dashed lines represent the different base periods of which the percentiles were derived, 1988–2016 (warmer) and 1961–1990 (colder) respectively. Solid red and blue lines denote the linear trends for both base periods.
From 1960 to 2016, the cold temperature indices in the QTP generally exhibited significant decreasing trends, whereas the warm temperature indices showed significant growing trends. Similar findings have been seen in Europe (Klein Tank and Können, 2003), Central and South America (Aguilar et al., 2005), and Africa (New et al., 2006; Gbode et al., 2019). The cold extremes (FD and ID) showed stronger trends (larger slope and Z values) than the warm extremities (SU and TR), suggesting unequal changes in the lower and upper tail extremities resulting in temperature variation, which was inconsistent with studies in Europe (Klein Tank and Können, 2003; Moberg et al., 2006) and Middle East countries (Zhang et al., 2005), but this finding was in agreement with earlier studies in the Yellow River Basin (Wang et al., 2012), the Loess Plateau (Sun et al., 2016), and northern China (Wang et al., 2018), demonstrating that warming since 1960 was caused by decreases of the cold extremes rather than increases of the warm extremes. The warmest day (TXx), warmest night (TNx), coldest day (TXn), and coldest night (TNn) extremal indices all indicated substantial warming trends, at rates of 0.30, 0.40, 0.30, and 0.50°C per decade (p < 0.001), and the trend was strongest for TNn (Z = 8.30). Trends in the night-time indices (TN10p, TN90p, TNx, and TNn) were stronger (larger Z scores) than those of their corresponding daytime indices (TX10p, TX90p, TXx and TXn), demonstrating that nocturnal warming contributed more to the overall warming process than daylight warming (Manton et al., 2001; Peterson et al., 2002; Griffiths et al., 2005; Klein Tank et al., 2006; Revadekar et al., 2013; Yan et al., 2014). In addition, for the variability extremes, both the average the diurnal temperature range (DTR) and the cold spell duration (CSDI) demonstrated clear downward patterns. However, the growing season length (GSL) and warm spell duration (WSDI) increased significantly. The change rate of GSL in the QTP was lower than the average value for the Yarlung Tsangpo River Basin (4.33 days/decade; Liu et al., 2019) and Loess Plateau (3.16 days/decade; Sun et al., 2016), but larger than those in northwestern China (2.74 days/decade; Song et al., 2015), the Yangtze River Basin (0.23 days/decade; Wang et al., 2014), and the Yunnan-Guizhou Plateau (0.12 days/decade; Li et al., 2012a).
The main factors influencing extreme temperatures were thought to be anthropogenic forcing and climatic natural variability (Hegerl et al., 2004). According to Kiktev et al. (2003), increasing greenhouse gas emissions played a significant role in the climate model’s simulation of extreme weather. By analyzing the trends of extremes in different underlying surfaces, Zhou and Ren (2011) discovered that urbanization had an impact on a series of extreme temperature indices in north China. Urbanization accelerated the downward trend in cold index series (frost days, cool nights, and cool days) and the upward trend in warm indices related to minimum temperature (summer days and warm nights). The causes of warming in temperature extremes in QTP, on the other hand, should be investigated further.
3.1.2 Spatial Trends for Temperature Extremes
To gain a better understanding of the spatial variation for temperature extremes, we mapped the spatial patterns of the annual trends based on the Sen’s slopes at each 94 meteorological stations throughout and around the QTP (Figure 3). These trends are significant at a 95% confidence level (i.e., p ≤ 0.05). During the period from 1961 to 2016, no change in TR (93.62%) within the QTP was found (Sen’s slope = 0), and only 5 stations on the northern edge showed a significant increasing trend. The cold indices (FD, TN10p, TX10p, ID, CSDI) showed significant (p < 0.05) decreasing trends in the QTP, and the corresponding significantly decreased stations accounted for 93.62, 92.55, 90.43, 67.02, and 63.83%. However, the overall warming indices (TN90p, TX90p, WSDI, SU) showed significant increase trends in the whole study area, and the proportion of stations with significant increase were 92.55, 72.34, 67.02, and 56.38%. Similarly, the extremal indices (TNx, TNn, TXx, TXn) showed significant increase trends in most areas of the study area, and the proportions of stations with significant increase were 100, 95.74, 94.68, and 90.43%. In addition, the proportion of stations with significantly increased GSL and DTR accounted for 70.21 and 52.13%, respectively.
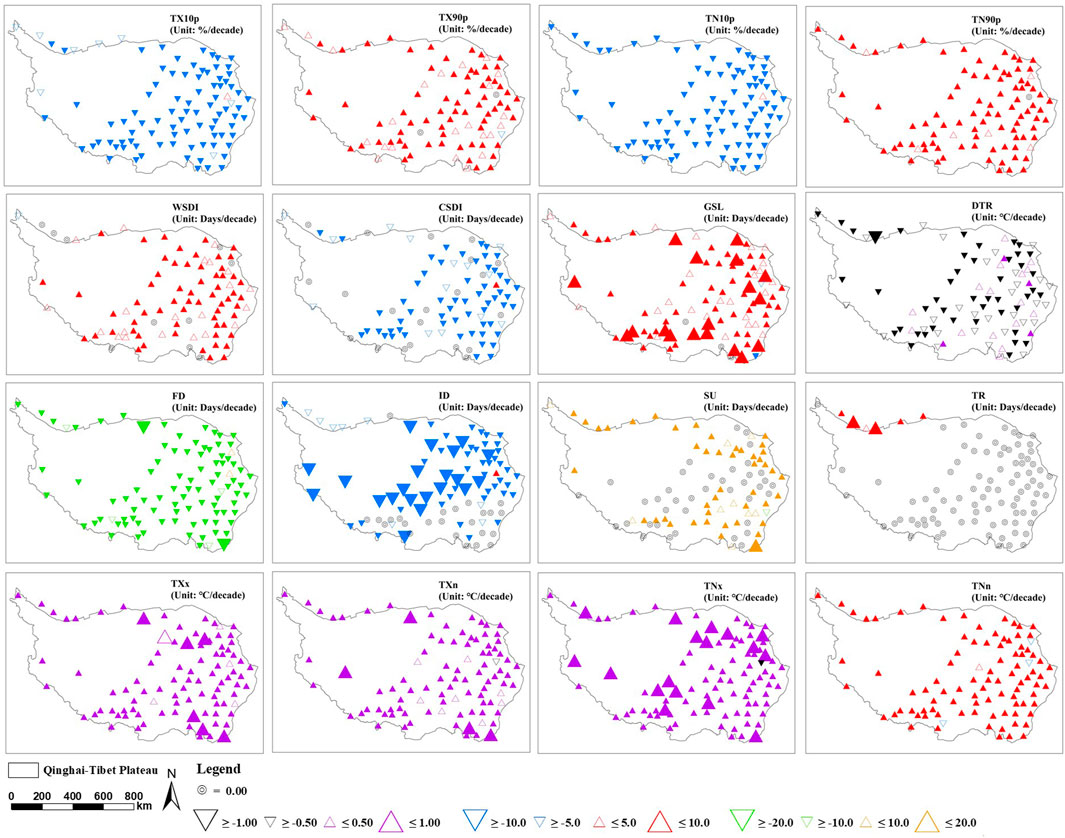
FIGURE 3. Spatial pattern of the trends for temperature indices from the 94 meteorological stations in the Qinghai-Tibet Plateau from 1960 to 2016 (base period from 1961–1990). Table 1 shows the definitions of the indices. The spatial distribution of the indices trends was represented using upward facing triangles for positive and downward facing triangles for negative trends. Different sizes of triangles indicate different magnitudes of trends. Filled triangles represent statistically significant at 95% level, i.e., p < 0.05. Double circles denote no trend. Notes: Black (−1.00 ≤ Slope <0.00), Blue (−10.0 ≤ Slope <0.00), Green (−20.0 ≤ Slope <0.00); Purple (0.00 < Slope ≤1.00), Red (0.00 < Slope ≤10.00), Orange (0.00 < Slope ≤20.00, PRCPTOT >20.0).
3.1.3 Correlations Among the Temperature Indices
The relationships among the extreme-temperature indices are illustrated in the correlation matrix (Table 2), there were significant correlations in numerous different temperature indices. For the absolute indices (FD, ID, SU, TR) and relative indices (TX10p, TX90p, TN10p, TN90p), significant positive correlations were discovered between the warmth and cold indices. Each warmth index, on the other hand, was negatively associated with each cold index. This is in line with the previous findings, which revealed that cold indices were trending downwards while warmth indices were trending upwards. Furthermore, significant negative correlations were found between the cold absolute indices (FD and ID) and the extremal indices (TXx, TXn, TNx, and TNn), but significant positive correlations were found between the warmth absolute indices (SU and TR) and the extremal indices (TXx, TXn, TNx, and TNn). GSL and WSDI had a large negative relationship with FD and ID, but a significant positive relationship with SU and TR, which was consistent with previous studies (Lin et al., 2017; Wang et al., 2018).
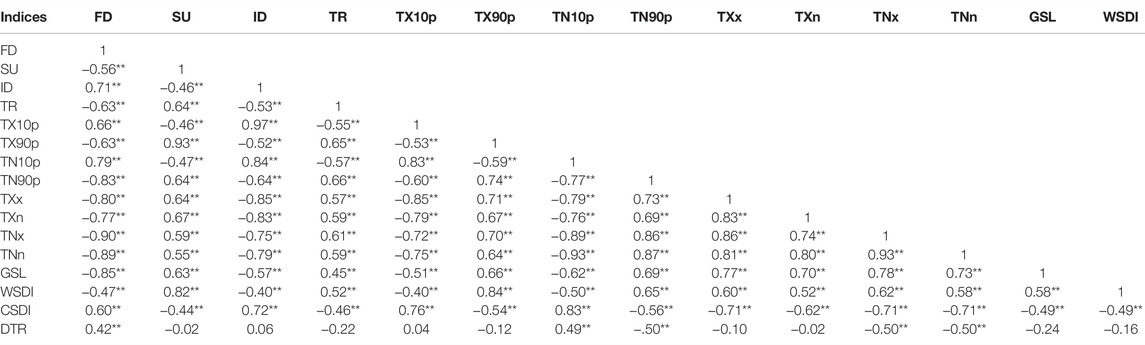
TABLE 2. The correlation matrix (Spearman’s correlation coefficient) for the relationships among the extreme-temperature indices in the Qinghai-Tibet Plateau from 1960 to 2016. Note: ** represents significance at p < 0.01. All other values are not significant. Index names are defined in Table 1.
3.2 Trends for Extreme Precipitation Events
3.2.1 Temporal Trends for Precipitation Extremes
As shown in Figure 4, the extreme precipitation indices calculated using the warmer base period (1988–2016) were all lower than those computed using the colder base period (1961–1990), except for the CDD. For most extreme precipitation indices, using a different base period (colder or warmer) changed the intercept without influencing the slope. However, our analyses showed that percentile-based precipitation indices (e.g., days with daily rainfall >95th and 99th percentile) are particularly susceptible to the problematic use of different base periods. The regional averaged trend for R99pTOT increased by 0.5 days per decade versus 0.04 days per decade when colder (1961–1990) and warmer (1988–2016) base periods were used, respectively, indicating that the trend magnitude of the percentile-based precipitation indices (R95pTOT and R99pTOT) is diminished when a warmer base period is used.
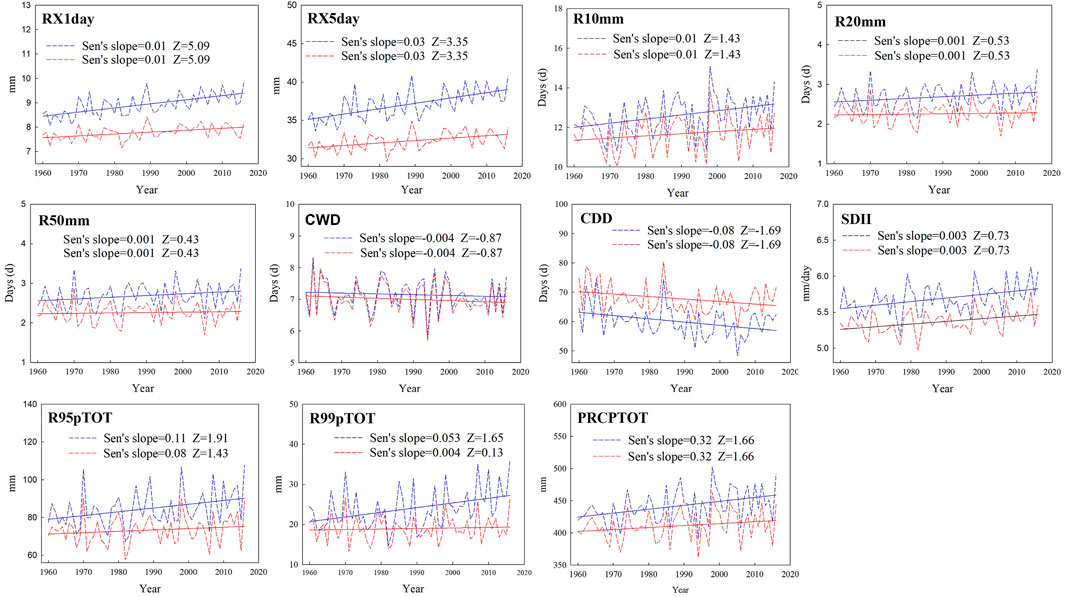
FIGURE 4. Regionally averaged series for the extreme precipitation indices on the Qinghai-Tibet Plateau from 1960 to 2016. Table 1 shows the definitions of the indices. The red and blue dashed lines represent the different base periods of which the percentiles were derived, 1988–2016 (warmer) and 1961–1990 (colder) respectively. Solid red and blue lines denote the linear trends for both base periods.
The regionally averaged monthly maximum 1-day precipitation (RX1day) and maximum consecutive 5-day precipitation (RX5day) increased significantly, at rates of 0.1 and 0.3 mm per decade, respectively. RX1day had the strongest trend during the study period (Z = 5.09), but PRCPTOT had the steepest slope (3.2 mm/decade). The rate of change for RX5day (0.3 mm/decade) was higher than that in the Yunnan-Guizhou plateau (0.03 mm/decade; Li et al., 2012a), northeastern China (0.13 mm/decade; Song et al., 2015), but lower than those in northwestern China (0.85 mm/decade), for China as a whole (1.90 mm/decade; You et al., 2011), and at a global scale (0.55 mm/decade; Alexander et al., 2006). In addition, the rate of rise in annual total precipitation (PRCPTOT) in this study (3.2 mm/decade) was higher than those in northeastern China (1.65 mm/decade; Song et al., 2015), China’s Loess Plateau (1.50 mm/decade; Sun et al., 2016), and China’s Yangtze River (1.90 mm/decade; Wang et al., 2014), but lower than in the Guinea coast of Nigeria (8.03 mm/decade; Gbode et al., 2019), Romania (4.14 mm/decade; Croitoru et al., 2016), Georgia (7.9 mm/decade; Keggenhoff et al., 2014), and on a global scale (10.59 mm/decade; Alexander et al., 2006). Notably, PRCPTOT showed a negative trend in Indonesia (−4.30 mm/decade; Supari et al., 2017), contrary to our research trend.
3.2.2 Spatial Trends for Precipitation Extremes
In most regions of the QTP from 1960 to 2016, the extreme precipitation indices exhibited increasing trends, as seen in Figure 5. The significant increasing trend (p < 0.05) of extreme precipitation index (R10mm, R50mm, RX5day, RX1day, R95pTOT) was mainly distributed in the northeast of QTP, and the stations accounted for 20.21, 20.21, 19.15, 18.09 and 15.96%, respectively. PRCPTOT showed a significant increasing trend (p < 0.05), accounting for 23.4% of the total sites, mainly distributed in the northeast and southwest of the QTP. In contrast, CDD decreased in most areas, especially in the high-elevation area of the central west, while CWD decreased significantly (p < 0.05) in the eastern part of the QTP, accounting for 10.64% of the total stations. At the same time, the extreme precipitation index (R99pTOT, R20mm, CWD, R10mm, R50mm) of more than 50% stations remained unchanged (Sen’s slope = 0), with a proportion of 93.62, 90.43, 81.91, 56.38 and 56.38%, respectively.
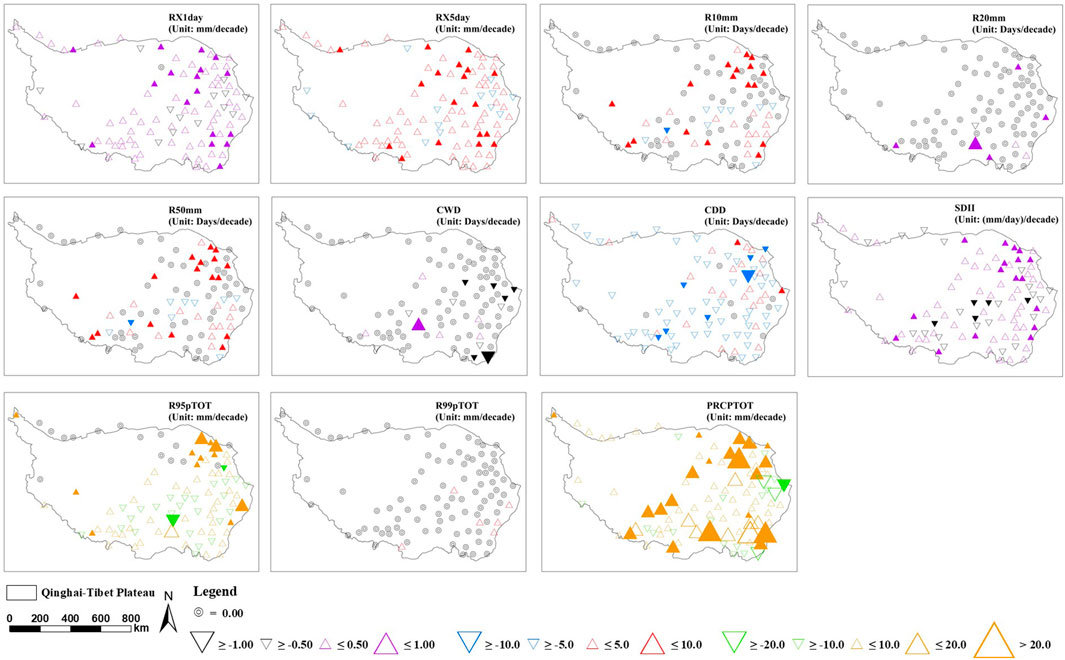
FIGURE 5. Spatial pattern of the trends for precipitation indices from the 94 meteorological stations in the Qinghai-Tibet Plateau from 1960 to 2016 (base period from 1961–1990). Table 1 shows the definitions of the indices. The spatial distribution of the indices trends was represented using upward facing triangles for positive and downward facing triangles for negative trends. Different sizes of triangles indicate different magnitudes of trends. Filled triangles represent statistically significant at 95% level, i.e., p < 0.05. Double circles denote no trend. Black (−1.00 ≤ Slope <0.00), Blue (−10.0 ≤ Slope <0.00), Green (−20.0 ≤ Slope <0.00); Purple (0.00 < Slope ≤1.00), Red (0.00 < Slope ≤10.00), Orange (0.00 < Slope ≤20.00, PRCPTOT >20.0).
3.2.3 Correlations Among the Precipitation Indices
As shown in Table 3, we discovered strong positive relationships between the annual total precipitation (PRCPTOT, daily precipitation >1 mm) and all the other extreme precipitation indices except R50 mm (not significant) and the consecutive dry days (CDD, r = −0.24). The Spearman’s correlation coefficients were greater than 0.50 for the relationships between the PRCPTOT and several of the extreme precipitation indices: the monthly maximum 1-day precipitation (RX1day), maximum consecutive 5-day precipitation (RX5day), heavy precipitation (R10mm), very heavy precipitation (R20mm), simple daily intensity index (SDII), and annual precipitation on very wet days (R95pTOT). Most of the extreme precipitation indices had substantial positive associations, although there were negative correlations between consecutive dry days (CDD) and the precipitation indices. This confirmed our previous research results for China as a whole (Wang et al., 2020).
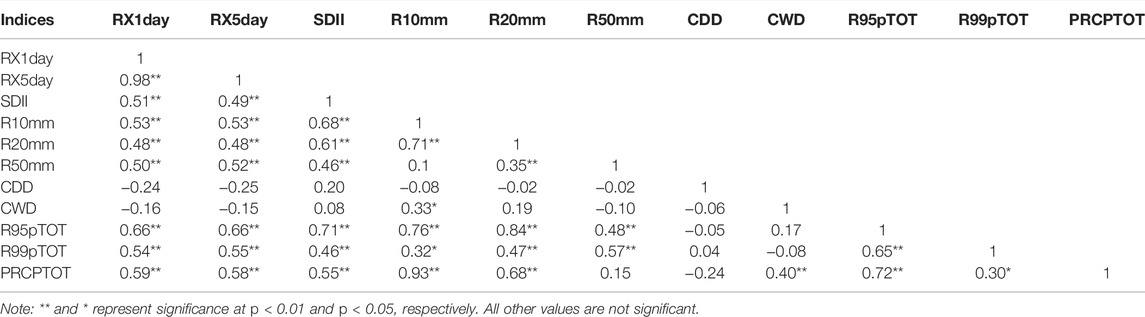
TABLE 3. The correlation matrix (Spearman’s correlation coefficient) for the relationships among the extreme- precipitation indices in the Qinghai-Tibet Plateau from 1960 to 2016. Index names are defined in Table 1.
3.3 Relationships Between Extreme Temperature Events and Geographic Factors
The temperature extremes showed a lot of variety across space. We looked at the relationships between extreme temperature events and the latitude, longitude, and elevation of each meteorological station to figure out what was causing the varied trends in different regions (Table 4). The sun incidence angle is affected by latitude, and the distribution of energy across the Earth’s surface is influenced as a result. In general, Higher latitude places get less heat due to a lower sun incidence angle, resulting in colder temperatures. In contrast, lower latitudes have greater temperatures because more solar energy is intercepted. Warming trends are particularly visible in the northern hemisphere at high latitudes (Serreze et al., 2000). In the present study, the absolute indices (FD, ID, SU, TR) showed a substantial positive relationship with latitude, whereas the extremal indices for the warmest day (TXn, TNn) revealed negative correlations with latitude, showing that the magnitude of daily extreme temperature incidents would diminish with increasing latitude. The relative warmth indices (TX10p and TN10p) showed positive correlations with latitude, although the correlation was only significant for TX10p, whereas the relative cold indices (TX90p and TN90p) both showed significant negative correlations. This suggests that as latitude increased, the warming trend grew more pronounced, which is consistent with prior study in the Yangtze River Basin (Guan et al., 2015) and the Chinese Hengduan Mountains (Li et al., 2012a; Li et al., 2012b). Furthermore, two of the variability extremes (CSDI and DTR) showed significant positive correlations with latitude, whereas GSL was not significantly correlated with latitude.
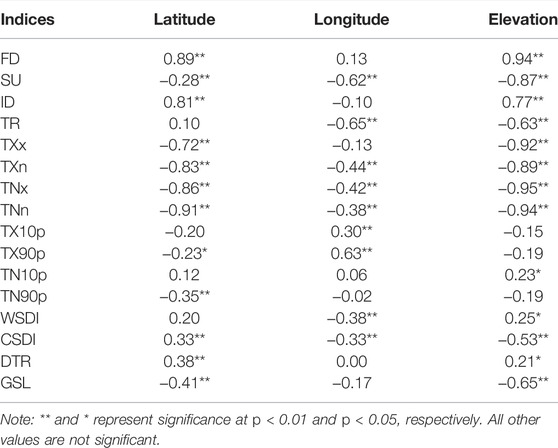
TABLE 4. Partial correlation coefficient between the temperature extremes from 1960 to 2016 and the latitude, longitude, and elevation of the measurement sites in the Qinghai-Tibet Plateau. Index names are defined in Table 1.
Longitude influences regional climate change through impacting water and energy transfer between coastal regions (including southwestern areas such as the Indian Ocean and northern areas such as the Arctic Ocean) and China’s inland areas (Zhong et al., 2017). In current study, two of the absolute indices (SU and TR) and two of the variability extremes (WSDI and CSDI) showed significant negative correlations with longitude, whereas two of the relative warmth indices (TX10p and TX90p) were significantly positively correlated with longitude, indicating that the occurrence of daytime extreme temperature events would become more common as longitude increased.
Elevation influences regional climate change by determining the vertical distribution of energy and water. In current study, only one of the cold indices (FD) showed a significant (p < 0.01) positive correlation with elevation, whereas both warmth indices (SU and TR) showed significant negative correlations with elevation (p < 0.05). This meant that cold temperature episodes became more frequent and intense at higher elevations, whereas warm temperature events became less frequent and intense. The indices for the warmest day (TXx), warmest night (TNx), coldest day (TXn), and coldest night (TNn) all had significant negative associations with elevation (p < 0.05), indicating that the frequency of daily extreme temperature events would decrease as elevation was increased. In addition, the warm spell duration (WSDI) increased significantly with increasing elevation, whereas the cold spell duration (CSDI) and growing season length (GSL) both decreased with increasing elevation.
3.4 Relationships Between Extreme Precipitation Events and Geographic Factors
We also looked at the links between extreme precipitation events and latitude, longitude, and elevation (Table 5). There were strong negative associations between latitude and all the precipitation metrics, with the exception of a substantial positive association for the number of dry days in a row (CDD). This suggests that extreme precipitation events were more common at low latitudes, probably owing mainly to the greater precipitation due to the proximity of low-latitude areas to moist coastal areas in eastern China and orographic effects created by the southern mountains. Longitude showed the opposite effect on extreme precipitation events, with strong positive correlations between all precipitation indices and longitude, except for CDD (with a significant negative correlation) and R50mm showing a nonsignificant correlation (Table 5). It is possible that this is because locations with a greater longitude are closer to the coast, where the moisture supply is much greater than in dry regions farther to the west. This also confirmed our previous research results across China (Wang et al., 2020). We found no significant correlations between the precipitation indexes and elevation, possibly because of the negative interaction between elevation and proximity to moisture sources.
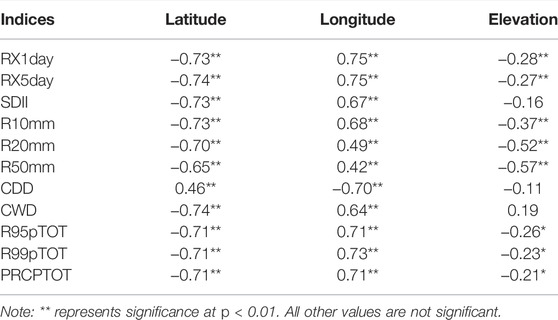
TABLE 5. Partial correlation coefficient between precipitation extremes from 1960 to 2016 and the latitude, longitude, and elevation of the measurement sites in the Qinghai-Tibet Plateau. Index names are defined in Table 1.
3.5 Relationships Between Temperature Extremes and Atmospheric Circulation Patterns
As an important component of East Asian monsoon, the West Pacific Subtropical High (WPSH) has a significant impact on temperature and precipitation in China (Zhao and Wang, 2017). Zhong et al. (2017) found that the Northern Hemisphere Subtropical High area and intensity indices showed positive correlations with the warm indices and extreme indices, while showed the reverse relationship with the cold indices. Sun et al. (2016) also found that the SHI strongly influences warm/cold extremes and contributes significantly to climate changes in the Loess Plateau. Table 6 shows the correlations between temperature extremes and atmospheric circulation patterns. The warming trends in the temperature extremes on the QTP were closely related with the WPSHI, which represents a large-scale anticyclonic circulation identified as one of the dominant components of the East Asian summer monsoon climate system, accounting for roughly one-quarter of the Northern Hemisphere surface in summer (Huang et al., 2014). The Subtropical High Intensity (SHI) and Subtropical High Area (SHA) showed significant positive correlations with warmth indices (TX90p, TN90p, SU, TR, WSDI), extremal indices (TXx, TXn, TNx, TNn) and the growing season length, whereas SHI and SHA showed significant negative correlations with cold indices (TX10p, TN10p, FD, ID, CSDI). The correlations between the Subtropical High Western Ridge Point (SHW) and temperature extremes showed the opposite responses. When the SHW moves northward, the cold events were likely to increase significantly, whereas the warming events were likely to decrease significantly on the Qinghai-Tibet Plateau. Furthermore, the WPSH is linked to the warming trend by extending the length of the growing season. These findings suggest that the WPSH has a strong influence on warm/cold extremes and contributes significantly to QTP climate change.
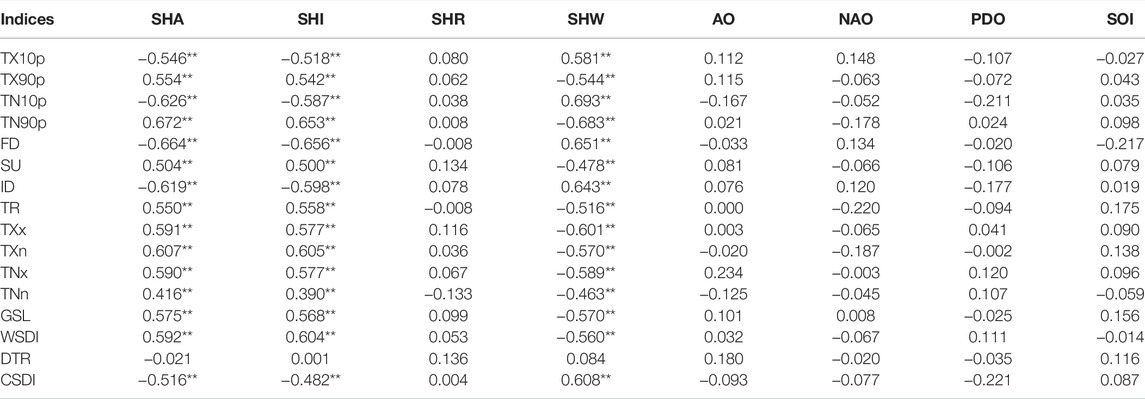
TABLE 6. Correlations (Pearson’s r) between temperature extremes and atmospheric circulation patterns.
The Arctic Oscillation (AO) is a major controlling factor in Northern Hemisphere climate variability, as well as the strength of the East Asian winter monsoon and the Siberian higher-pressure system (You et al., 2013). In this study, the AO was shown to be less sensitive to changes in climate extremes on the QTP. Similar findings were discovered on China’s Loess Plateau (Sun et al., 2016). One possible explanation for this correlation is a decrease in the intensity of the Asian winter monsoon.
3.6 Relationships Between Precipitation Extremes and Atmospheric Circulation Patterns
As shown in Table 7, SHI and SHA had positive correlations with all the extreme precipitation indices, except for the reverse relationship with CDD, indicating that the frequency and intensity of extreme precipitation events increased with increasing intensity and area of the West Pacific Subtropical High. On the contrary, SHW had negative correlations with all the extreme precipitation indices, except for positive correlations with CWD and CDD. This indicates that when the SHW moves westward, extreme precipitation events are likely to increase significantly, whereas the extreme precipitation events would decrease if SHW moves eastward.
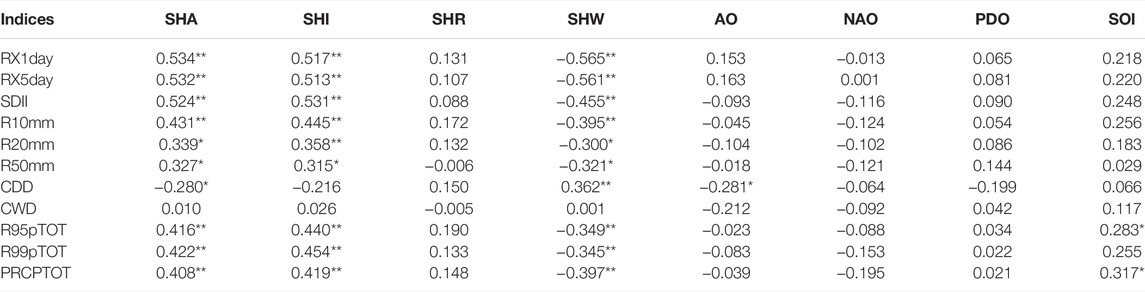
TABLE 7. Correlations (Pearson’s r) between precipitation extremes and atmospheric circulation patterns.
4 Conclusion
In this study, we quantified and compared changes in climate extremes on China’s QTP from 1960 to 2016 using 16 extreme temperature indices and 11 extreme precipitation indices, which calculated using colder (1961–1990) and warmer (1988–2016) base periods, respectively. When a warmer base period is used, the trend magnitude of the cold temperature indices is amplified while the trend magnitude of the warm temperature indices and the percentile-based precipitation indices are diminished. As a result, using a recent warmer base period may lead to the incorrect conclusion, misrepresenting the actual changes to global climate.
The temperature indices’ regionally averaged trends were consistent with the consequences of global warming. During the study period, the warmth indices, which included the numbers of warm days, warm nights, summer days, and tropical nights, showed considerably increasing trends. In contrast, the cold indices, such as the numbers of cool days, cool nights, ice days, and frost days, declined dramatically. Furthermore, within the same time period, the extreme daily indices, such as the warmest day, warmest night, coldest day, and coldest night, all showed substantial upward trends. The relative warmth indices tended to show positive correlations with latitude, whereas the relative cold indices tended to show negative correlations, suggesting that the warming trend became more pronounced as latitude increased. The relative daytime indices were significantly positively correlated with longitude, indicating that the occurrences of daytime extreme temperature events would increase with increasing longitude. In addition, at high elevations, the frequency and intensity of cold temperature occurrences increased, while warm temperature events showed the opposite tendency. The total annual precipitation and extreme precipitation events showed increasing trends from 1960 to 2016, except for the numbers of consecutive dry and wet days. Furthermore, the extreme precipitation events were more frequent at lower latitudes and higher longitudes, but there was no relationship with elevation. These results confirmed our hypotheses that monitoring of temperatures and precipitation on the QTP would show trends consistent with global warming, and would reveal significant spatial variation in these trends. The West Pacific Subtropical High Index (WPSHI), such as the Subtropical High Area (SHA), Subtropical High Intensity (SHI), and Subtropical High Western Ridge Point (SHW) strongly influence temperature and precipitation extremes. The strengthening SHA and SHI, Westward movement of SHW have contributed to the changes in climate extremes on the Qinghai-Tibet Plateau.
Despite the large number of monitoring stations, coverage of the study area was not optimal, particularly for the large gap in coverage in the northwestern plateau. Adding stations in this region or finding ways to use satellite data to monitor these remote areas would mitigate this problem. Furthermore, due to the atmospheric circulation change is an important mechanism effecting the heat and moisture transportation in this region, The current study mainly focuses on the impact mechanism of atmospheric circulation patterns on extreme climate change. Other factors, such as cloud amount, surface coverage, human-induced urbanization may also impact the climate extremes. Therefore, more detailed studies are still needed to understand the internal regime of change in extreme climate events on the QTP.
Data Availability Statement
The raw data supporting the conclusion of this article will be made available by the authors, without undue reservation.
Author Contributions
The corresponding author presented the overall idea for this manuscript XW, XG, and YL planned and designed the experiments, data processing, analysis and interpretation, as well as authoring the manuscript. LM, ML, and HS contributed resources to the project.
Funding
This research was supported by the Second Tibetan Plateau Scientific Expedition and Research (STEP) program (Grant No. 2019QZKK0305), and the National Natural Science Foundation of China (grant Nos. 32001214, 41807525 and 31971466).
Conflict of Interest
The authors declare that the research was conducted in the absence of any commercial or financial relationships that could be construed as a potential conflict of interest.
Publisher’s Note
All claims expressed in this article are solely those of the authors and do not necessarily represent those of their affiliated organizations, or those of the publisher, the editors and the reviewers. Any product that may be evaluated in this article, or claim that may be made by its manufacturer, is not guaranteed or endorsed by the publisher.
References
Aguilar, E., Auer, I., Brunet, M., Peterson, T. C., and Wieringa, J. (2003). Guidelines on Climate Metadata and Homogenization. WMO/TD No. 1186. Geneva, Switzerland: World Meteorological Organization.
Aguilar, E., Peterson, T. C., Obando, P. R., Frutos, R., Retana, J. A., Solera, M., et al. (2005). Changes in Precipitation and Temperature Extremes in Central America and Northern South America, 1961-2003. J. Geophys. Res. 110, D23107. doi:10.1029/2005JD006119
Alexander, L. V., Zhang, X., Peterson, T. C., Caesar, J., Gleason, B., Klein Tank, A. M. G., et al. (2006). Global Observed Changes in Daily Climate Extremes of Temperature and Precipitation. J. Geophys. Res. 111, D05109. doi:10.1029/2005JD006290
Alsarmi, S. H., and Washington, R. (2014). Changes in Climate Extremes in the Arabian Peninsula: Analysis of Daily Data. Int. J. Climatol. 34 (5), 1329–1345. doi:10.1002/joc.3772
Bi, S. (1997). A Best Laboratory of the Universal Research for the Earth’s Global Change and Earth System Science—The Qinghai-Tibet Plateau. Syst. Eng. Theory Pract. 17 (5), 72–77. (In Chinese).
Bocheva, L., Marinova, T., Simeonov, P., and Gospodinov, I. (2009). Variability and Trends of Extreme Precipitation Events Over Bulgaria (1961-2005). Atmos. Res. 93, 490–497. doi:10.1016/j.atmosres.2008.10.025
Croitoru, A.-E., Piticar, A., and Burada, D. C. (2016). Changes in Precipitation Extremes in Romania. Quat. Int. 415, 325–335. doi:10.1016/j.quaint.2015.07.028
Croitoru, A.-E., and Piticar, A. (2013). Changes in Daily Extreme Temperatures in the Extra-Carpathians Regions of Romania. Int. J. Climatol. 33, 1987–2001. doi:10.1002/joc.3567
Cuo, L., Zhang, Y., Wang, Q., Zhang, L., Zhou, B., Hao, Z., et al. (2013). Climate Change on the Northern Tibetan Plateau during 1957-2009: Spatial Patterns and Possible Mechanisms. J. Clim. 26 (1), 85–109. doi:10.1175/JCLI-D-11-00738.1
Dike, V. N., Lin, Z.-H., and Ibe, C. C. (2020). Intensification of Summer Rainfall Extremes over Nigeria during Recent Decades. Atmosphere 11 (10), 1084. doi:10.3390/atmos11101084
Ding, J., Cuo, L., Zhang, Y., and Zhu, F. (2018). Monthly and Annual Temperature Extremes and Their Changes on the Tibetan Plateau and its Surroundings during 1963-2015. Sci. Rep. 8 (1), 11860. doi:10.1038/s41598-018-30320-0
Eyring, V., Gillett, N. P., Achuta Rao, K. M., Barimalala, R., Barreiro Parrillo, M., Bellouin, N., et al. (2021). “Human Influence on the Climate System,” in Climate Change 2021: The Physical Science Basis. Contribution of Working Group I to the Sixth Assessment Report of the Intergovernmental Panel on Climate Change (Cambridge and New York: Cambridge University Press). In Press.
Filahi, S., Tanarhte, M., Mouhir, L., El Morhit, M., and Tramblay, Y. (2016). Trends in Indices of Daily Temperature and Precipitations Extremes in Morocco. Theor. Appl. Climatol. 124, 959–972. doi:10.1007/s00704-015-1472-4
Frich, P., Alexander, L., Della-Marta, P., Gleason, B., Haylock, M., Klein Tank, A., et al. (2002). Observed Coherent Changes in Climatic Extremes during the Second Half of the Twentieth Century. Clim. Res. 19, 193–212. doi:10.3354/cr019193
Gbode, I. E., Adeyeri, O. E., Menang, K. P., Intsiful, J. D. K., Ajayi, V. O., Omotosho, J. A., et al. (2019). Observed Changes in Climate Extremes in Nigeria. Meteorol. Appl. 26 (4), 642–654. doi:10.1002/met.1791
Goswami, B. N., Venugopal, V., Sengupta, D., Madhusoodanan, M. S., and Xavier, P. K. (2006). Increasing Trend of Extreme Rain Events Over India in a Warming Environment. Science 314, 1442–1445. doi:10.1126/science.1132027
Griffiths, G. M., Chambers, L. E., Haylock, M. R., Manton, M. J., Nicholls, N., Baek, H.-J., et al. (2005). Change in Mean Temperature as a Predictor of Extreme Temperature Change in the Asia-Pacific Region. Int. J. Climatol. 25, 1301–1330. doi:10.1002/joc.1194
Griffiths, M. L., and Bradley, R. S. (2007). Variations of Twentieth-Century Temperature and Precipitation Extreme Indicators in the Northeast United States. J. Clim. 20, 5401–5417. doi:10.1103/PhysRevB.71.22411910.1175/2007jcli1594.1
Guan, Y., Zhang, X., Zheng, F., and Wang, B. (2015). Trends and Variability of Daily Temperature Extremes during 1960-2012 in the Yangtze River Basin, China. Glob. Planet. Change 124, 79–94. doi:10.1016/j.gloplacha.2014.11.008
Hamed, K. H., and Ramachandra Rao, A. (1998). A Modified Mann-Kendall Trend Test for Autocorrelated Data. J. Hydrology 204, 182–196. doi:10.1016/S0022-1694(97)00125-X
Haylock, M. R., Hofstra, N., Klein Tank, A. M. G., Klok, E. J., Jones, P. D., and New, M. (2008). A European Daily High-Resolution Gridded Data Set of Surface Temperature and Precipitation for 1950-2006. J. Geophys. Res. 113, D20119. doi:10.1029/2008JD010201
Haylock, M. R., Peterson, T. C., Alves, L. M., Ambrizzi, T., Anunciação, Y. M. T., Baez, J., et al. (2006). Trends in Total and Extreme South American Rainfall in 1960-2000 and Links with Sea Surface Temperature. J. Clim. 19, 1490–1512. doi:10.1175/JCLI3695.1
Hegerl, G. C., Zwiers, F. W., Stott, P. A., and Kharin, V. V. (2004). Detectability of Anthropogenic Changes in Annual Temperature and Precipitation Extremes. J. Clim. 17 (19), 3683–3700. doi:10.1175/1520-0442(2004)017<3683:doacia>2.0.co;2
Houghton, J. T., Ding, Y., Griggs, D. J., Noguer, M., Linden, P. J., Dai, X., et al. (2001). “Observed Climate Variability and Change,” in Climate Change 2001: The Science of Climate Change (Cambridge, UK: Cambridge University Press), 156–159. doi:10.1038/ngeo301
Huang, Y., Wang, H., Fan, K., and Gao, Y. (2014). The Western Pacific Subtropical High after the 1970s: Westward or Eastward Shift? Clim. Dyn. 44 (7-8), 2035–2047. doi:10.1007/s00382-014-2194-5
Hussain, M., and Mahmud, I. (2019). pyMannKendall: A Python Package for Non Parametric Mann Kendall Family of Trend Tests. J. Open Source Softw. 4 (39), 1556. doi:10.21105/joss.01556
IPCC (2022). “Climate Change 2022: Impacts, Adaptation, and Vulnerability,” in Contribution of Working Group II to the Sixth Assessment Report of the Intergovernmental Panel on Climate Change. Editors H-O Pörtner, DC Roberts, M Tignor, ES Poloczanska, K Mintenbeck, A Alegríaet al. (Cambridge and New York: Cambridge University Press).
Iwashima, T., and Yamamoto, R. (1993). A Statistical Analysis of the Extreme Event: Long-Term Trend of Heavy Daily Precipitation. J. Meteorol. Soc. Jpn. 71 (5), 637–640. doi:10.2151/jmsj1965.71.5_637
Karl, T. R., Knight, R. W., Easterling, D. R., and Quayle, R. G. (1996). Indices of Climate Change for the United States. Bull. Amer. Meteor. Soc. 77 (2), 279–292. doi:10.1175/1520-0477(1996)077<0279:ioccft>2.0.co;2
Karl, T. R., Knight, R. W., and Plummer, N. (1995). Trends in High-Frequency Climate Variability in the Twentieth Century. Nature 377, 217–220. doi:10.1038/377217a0
Keggenhoff, I., Elizbarashvili, M., Amiri-Farahani, A., and King, L. (2014). Trends in Daily Temperature and Precipitation Extremes over Georgia, 1971–2010. Weather Clim. Extrem. 4, 75–85. doi:10.1016/j.wace.2014.05.001
Kiktev, D., Sexton, D. M. H., Alexander, L., and Folland, C. K. (2003). Comparison of Modeled and Observed Trends in Indices of Daily Climate Extremes. J. Clim. 16 (22), 3560–3571. doi:10.1175/1520-0442(2003)016<3560:comaot>2.0.co;2
Klein Tank, A. M. G., and Können, G. P. (2003). Trends in Indices of Daily Temperature and Precipitation Extremes in Europe, 1946-99. J. Clim. 16, 3665–3680. doi:10.1175/1520-0442(2003)016<3665:tiiodt>2.0.co;2
Klein Tank, A. M. G., Peterson, T. C., Quadir, D. A., Dorji, S., Zou, X., Tang, H., et al. (2006). Changes in Daily Temperature and Precipitation Extremes in Central and South Asia. J. Geophys. Res. 111, D16105. doi:10.1029/2005JD006316
Klein Tank, A. M. G., Zwiers, F. W., and Zhang, X. (2009). Guidelines on Analysis of Extremes in a Changing Climate in Support of Informed Decisions for Adaptation. Geneva, Switzerland: Climate data and monitoring, WCDMP-No. 72, WMO-TD No.1500.
Li, R., and Chi, X. (2014). Thermal Comfort and Tourism Climate Changes in the Qinghai-Tibet Plateau in the Last 50 Years. Theor. Appl. Climatol. 117 (3-4), 613–624. doi:10.1007/s00704-013-1027-5
Li, S., Dong, Y. X., and Dong, G. R. (2001). Sandy Desertification Problem and Sustainable Development in Qinghai-Tibet Plateau. Beijing: China Tibetology Publishing House. (in Chinese).
Li, Y.-G., He, D., Hu, J.-M., and Cao, J. (2015). Variability of Extreme Precipitation over Yunnan Province, China 1960-2012. Int. J. Climatol. 35, 245–258. doi:10.1002/joc.3977
Li, Z., He, Y., Wang, C., Wang, X., Xin, H., Zhang, W., et al. (2011). Spatial and Temporal Trends of Temperature and Precipitation during 1960-2008 at the Hengduan Mountains, China. Quat. Int. 236, 127–142. doi:10.1016/j.quaint.2010.05.017
Li, Z., He, Y., Wang, P., Theakstone, W. H., An, W., Wang, X., et al. (2012a). Changes of Daily Climate Extremes in Southwestern China during 1961-2008. Glob. Planet. Change 80-81, 255–272. doi:10.1016/j.gloplacha.2011.06.008
Li, Z., Zheng, F.-L., Liu, W.-Z., and Jiang, D.-J. (2012b). Spatially Downscaling GCMs Outputs to Project Changes in Extreme Precipitation and Temperature Events on the Loess Plateau of China during the 21st Century. Glob. Planet. Change 82-83, 65–73. doi:10.1016/j.gloplacha.2011.11.008
Lin, P., He, Z., Du, J., Chen, L., Zhu, X., and Li, J. (2017). Recent Changes in Daily Climate Extremes in an Arid Mountain Region, a Case Study in Northwestern China's Qilian Mountains. Sci. Rep. 7 (1), 2245. doi:10.1038/s41598-017-02345-4
Liu, C., Li, Y., Ji, X., Luo, X., and Zhu, M. (2019). Observed Changes in Temperature and Precipitation Extremes over the Yarlung Tsangpo River Basin during 1970-2017. Atmosphere 10, 815. doi:10.3390/atmos10120815
Liu, X., and Chen, B. (2000). Climatic Warming in the Tibetan Plateau during Recent Decades. Int. J. Climatol. 20 (14), 1729–1742. doi:10.1002/1097-0088(20001130)20:14<1729::aid-joc556>3.0.co;2-y
Lu, H., Chen, S., Guo, Y., He, Y., Xu, S., Lu, H., et al. (2014). Spatio-temporal Variation Characteristics of Extremely Heavy Precipitation Frequency over South China in the Last 50 Years. J. Trop. Meteorol. 20, 279–288. doi:10.16555/j.1006-8775.2014.03.010
Lupikasza, E. (2009). Spatial and Temporal Variability of Extreme Precipitation in Poland in the Period 1951-2006. Int. J. Climatol. 30, 991–1007. doi:10.1002/joc.1950
Manton, M. J., Della-Marta, P. M., Haylock, M. R., Hennessy, K. J., Nicholls, N., Chambers, L. E., et al. (2001). Trends in Extreme Daily Rainfall and Temperature in Southeast Asia and the South Pacific: 1961-1998. Int. J. Climatol. 21, 269–284. doi:10.1002/joc.610
Mason, S. J., Waylen, P. R., Mimmack, G. M., Rajaratnam, B., and Harrison, J. M. (1999). Changes in Extreme Rainfall Events in South Africa. Clim. Change 41 (2), 249–257. doi:10.1023/A:1005450924499
McMichael, A. J., Woodruff, R. E., and Hales, S. (2006). Climate Change and Human Health: Present and Future Risks. Lancet 367, 859–869. doi:10.1016/S0140-6736(06)68079-3
Mishra, V., Ganguly, A. R., Nijssen, B., and Lettenmaier, D. P. (2015). Changes in Observed Climate Extremes in Global Urban Areas. Environ. Res. Lett. 10 (2), 024005. doi:10.1088/1748-9326/10/2/024005
Moberg, A., Jones, P. D., Lister, D., Walther, A., Brunet, M., Jacobeit, J., et al. (2006). Indices for Daily Temperature and Precipitation Extremes in Europe Analyzed for the Period 1901-2000. J. Geophys. Res. 111, D22106. doi:10.1029/2006JD007103
New, M., Hewitson, B., Stephenson, D. B., Tsiga, A., Kruger, A., Manhique, A., et al. (2006). Evidence of Trends in Daily Climate Extremes Over Southern and West Africa. J. Geophys. Res. 111, 3007–3021. doi:10.1029/2005JD006289
Pan, B., and Li, J. (1996). Qinghai-Tibetan Plateau: a Driver and Amplifier of the Global Climatic Change. J. Lanzhou Univ. (Nat. Sci.) 32 (1), 108–115. (In Chinese). doi:10.13885/j.issn.0455-2059.1996.01.024
Patz, J. A., Campbell-Lendrum, D., Holloway, T., and Foley, J. A. (2005). Impact of Regional Climate Change on Human Health. Nature 438, 310–317. doi:10.1038/nature04188
Peterson, T. C., Easterling, D. R., Karl, T. R., Groisman, P., Nicholls, N., Plummer, N., et al. (1998). Homogeneity Adjustments Ofin Situ Atmospheric Climate Data: a Review. Int. J. Climatol. 18, 1493–1517. doi:10.1002/(sici)1097-0088(19981115)18:13<1493::aid-joc329>3.0.co;2-t
Peterson, T. C., Folland, C., and Gruza, G. (2001). Report on the Activities of the Working Group on Climate Change Detection and Related Rapporteurs 1998–2001. Report WCDMP-47, WMO-TD 1071. Geneva, Switzerland: World Meteorological Organization.
Peterson, T. C., Taylor, M. A., Demeritte, R., Duncombe, D. L., Burton, S., Thompson, F., et al. (2002). Recent Changes in Climate Extremes in the Caribbean Region. J. Geophys. Res. 107, 4601. doi:10.1029/2002JD002251
Powell, E. J., and Keim, B. D. (2015). Trends in Daily Temperature and Precipitation Extremes for the Southeastern United States: 1948-2012. J. Clim. 28, 1592–1612. doi:10.1175/JCLI-D-14-00410.1
Pryor, S. C., Howe, J. A., and Kunkel, K. E. (2009). How Spatially Coherent and Statistically Robust Are Temporal Changes in Extreme Precipitation in the Contiguous USA? Int. J. Climatol. 29, 31–45. doi:10.1002/joc.1696
Revadekar, J. V., Hameed, S., Collins, D., Manton, M., Sheikh, M., Borgaonkar, H. P., et al. (2013). Impact of Altitude and Latitude on Changes in Temperature Extremes Over South Asia during 1971-2000. Int. J. Climatol. 33, 199–209. doi:10.1002/joc.3418
Rodrigo, F. S. (2009). Changes in the Probability of Extreme Daily Precipitation Observed from 1951 to 2002 in the Iberian Peninsula. Int. J. Climatol. 30, 1512–1525. doi:10.1002/joc.1987
Rusticucci, M., and Barrucand, M. (2004). Observed Trends and Changes in Temperature Extremes Over Argentina. J. Clim. 17, 4099–4107. doi:10.1175/1520-0442(2004)017<4099:otacit>2.0.co;2
Sen, P. K. (1968). Estimates of the Regression Coefficient Based on Kendall's Tau. J. Am. Stat. Assoc. 63 (324), 1379–1389. doi:10.1080/01621459.1968.10480934
Serreze, M. C., Walsh, J. E., Chapin III, F. S., Osterkamp, T., Dyurgerov, M., Romanovsky, V., et al. (2000). Observational Evidence of Recent Change in the Northern High-Latitude Environment. Clim. Change 46, 159–207. doi:10.1023/A:1005504031923
Skansi, M. D. L. M., Brunet, M., Sigró, J., Aguilar, E., Arevalo Groening, J. A., Bentancur, O. J., et al. (2013). Warming and Wetting Signals Emerging from Analysis of Changes in Climate Extreme Indices over South America. Glob. Planet. Change 100, 295–307. doi:10.1016/j.gloplacha.2012.11.004
Song, X., Song, S., Sun, W., Mu, X., Wang, S., Li, J., et al. (2015). Recent Changes in Extreme Precipitation and Drought Over the Songhua River Basin, China, during 1960-2013. Atmos. Res. 157, 137–152. doi:10.1016/j.atmosres.2015.01.022
Sun, W., Mu, X., Song, X., Wu, D., Cheng, A., and Qiu, B. (2016). Changes in Extreme Temperature and Precipitation Events in the Loess Plateau (China) during 1960-2013 under Global Warming. Atmos. Res. 168, 33–48. doi:10.1016/j.atmosres.2015.09.001
Supari, S., Tangang, F., Juneng, L., and Aldrian, E. (2017). Observed Changes in Extreme Temperature and Precipitation over Indonesia. Int. J. Climatol. 37, 1979–1997. doi:10.1002/joc.4829
Thornton, P. K., Ericksen, P. J., Herrero, M., and Challinor, A. J. (2014). Climate Variability and Vulnerability to Climate Change: A Review. Glob. Change Biol. 20, 3313–3328. doi:10.1111/gcb.12581
Trömel, S., and Schönwiese, C.-D. (2007). Probability Change of Extreme Precipitation Observed from 1901 to 2000 in Germany. Theor. Appl. Climatol. 87 (1-4), 29–39. doi:10.1007/s00704-005-0230-4
Wang, B., Bao, Q., Hoskins, B., Wu, G., and Liu, Y. (2008). Tibetan Plateau Warming and Precipitation Changes in East Asia. Geophys. Res. Lett. 35 (14), 63–72. doi:10.1029/2008GL034330
Wang, Q., Zhang, M., Wang, S., Ma, Q., and Sun, M. (2014). Changes in Temperature Extremes in the Yangtze River Basin, 1962-2011. J. Geogr. Sci. 24 (1), 59–75. doi:10.1007/s11442-014-1073-7
Wang, S., Zhang, M., Wang, B., Sun, M., and Li, X. (2013). Recent Changes in Daily Extremes of Temperature and Precipitation Over the Western Tibetan Plateau, 1973-2011. Quat. Int. 313-314 (6), 110–117. doi:10.1016/j.quaint.2013.03.037
Wang, W., Shao, Q., Yang, T., Peng, S., Yu, Z., Taylor, J., et al. (2012). Changes in Daily Temperature and Precipitation Extremes in the Yellow River Basin, China. Stoch. Environ. Res. Risk Assess. 27 (2), 401–421. doi:10.1007/s00477-012-0615-8
Wang, X. L. (2008a). Accounting for Autocorrelation in Detecting Mean Shifts in Climate Data Series Using the Penalized Maximal T or F Test. J. Appl. Meteorol. Clim. 47, 2423–2444. doi:10.1175/2008JAMC1741.1
Wang, X., Li, Y., Chen, Y., Lian, J., Luo, Y., Niu, Y., et al. (2018). Temporal and Spatial Variation of Extreme Temperatures in an Agro-Pastoral Ecotone of Northern China from 1960 to 2016. Sci. Rep. 8, 8787. doi:10.1038/s41598-018-27066-0
Wang, X., Li, Y., Wang, M., Li, Y., Gong, X., Chen, Y., et al. (2020). Changes in Daily Extreme Temperature and Precipitation Events in Mainland China from 1960 to 2016 under Global Warming. Int. J. Climatol. 41, 1465–1483. doi:10.1002/joc.6865
Wang, X. L. (2008b). Penalized Maximal F Test for Detecting Undocumented Mean Shift without Trend Change. J. Atmos. Ocean. Tech. 25, 368–384. doi:10.1175/2007JTECHA982.1
Wang, X. L., Wen, Q. H., and Wu, Y. (2007). Penalized Maximal T Test for Detecting Undocumented Mean Change in Climate Data Series. J. Appl. Meteorol. Clim. 46, 916–931. doi:10.1175/JAM2504.1
Wang, X., Pang, G., Yang, M., and Zhao, G. (2017). Evaluation of Climate on the Tibetan Plateau Using Era-Interim Reanalysis and Gridded Observations during the Period 1979-2012. Quat. Int. 444, 76–86. doi:10.1016/j.quaint.2016.12.041
World Meteorological Organization (2017). WMO Guidelines on the Calculation of Climate Normal. Geneva, Switzerland: WMO-No. 1203.
Yan, H. M., Chen, W. N., Yang, F. X., Liu, J. Y., and Ji, Y. Z. (2014). The Spatial and Temporal Analysis of Extreme Climatic Events in Inner Mongolia during the Past 50 Years. Geogr. Res. 33, 14–22. doi:10.11821/dlyj201401002
Yosef, Y., Aguilar, E., and Alpert, P. (2019). Changes in Extreme Temperature and Precipitation Indices: Using an Innovative Daily Homogenized Database in Israel. Int. J. Climatol. 39, 5022–5045. doi:10.1002/joc.6125
Yosef, Y., Aguilar, E., and Alpert, P. (2021). Is it Possible to Fit Extreme Climate Change Indices Together Seamlessly in the Era of Accelerated Warming? Intern. J. Climatol. 41 (Suppl. 1), E952–E963. doi:10.1002/joc.6740
You, Q., Kang, S., Aguilar, E., Pepin, N., Flügel, W.-A., Yan, Y., et al. (2011). Changes in Daily Climate Extremes in China and Their Connection to the Large Scale Atmospheric Circulation during 1961-2003. Clim. Dyn. 36 (11-12), 2399–2417. doi:10.1007/s00382-009-0735-0
You, Q., Kang, S., Aguilar, E., and Yan, Y. (2008). Changes in Daily Climate Extremes in the Eastern and Central Tibetan Plateau during 1961-2005. J. Geophys. Res. 113 (D7), 1639–1647. doi:10.1029/2007jd009389
You, Q., Ren, G., Fraedrich, K., Kang, S., Ren, Y., and Wang, P. (2013). Winter Temperature Extremes in China and Their Possible Causes. Int. J. Climatol. 33 (6), 1444–1455. doi:10.1002/joc.3525
Zhang, C.-L., Li, Q., Shen, Y.-P., Zhou, N., Wang, X.-S., Li, J., et al. (2017). Monitoring of Aeolian Desertification on the Qinghai-Tibet Plateau from the 1970s to 2015 Using Landsat Images. Sci. Total Environ. 619-620, 1648–1659. doi:10.1016/j.scitotenv.2017.10.137
Zhang, X., Aguilar, E., Sensoy, S., Melkonyan, H., Tagiyeva, U., Ahmed, N., et al. (2005). Trends in Middle East Climate Extreme Indices from 1950 to 2003. J. Geophys. Res. 110, D22104. doi:10.1029/2005JD006181
Zhang, X., and Yang, F. (2004). RClimDex (1.0) User GuideClimate Research Branch. Downsview, Ontario, Canada: Environment Canada.
Zhang, Z., Han, W., Wang, J., Cai, Y., Gang, L., Cai, Z., et al. (2016). Characteristics of Climate Change and its Response in the Qinghai-Tibet Plateau during 1971-2010. J. Landsc. Res. 8 (6), 41–52. doi:10.16785/j.issn1943-989x.2016.6.011
Zhao, Z., and Wang, Y. (2017). Influence of the West Pacific Subtropical High on Surface Ozone Daily Variability in Summertime Over Eastern China. Atmos. Environ. 170, 197–204. doi:10.1016/j.atmosenv.2017.09.024
Zhen, Y., and Li, X. (2014). Recent Trends in Daily Temperature Extremes over Northeastern China (1960-2011). Quat. Int. 380-381, 35–48. doi:10.1016/j.quaint.2014.09.010
Zheng, D. (1999). A Study on the Physico-Geographical Regional System of the Tibetan Plateau. Sci. China (Ser. D) 26 (4), 336–341. (In Chinese). doi:10.13249/j.cnki.sgs.1999.04.002
Zheng, D. (1996). The System of Physico-Geographical Regions of the Qinghai-Xizang (Tibet). Plateau. Sci. China (Ser. D) 39 (4), 410–417. (In Chinese). doi:10.1144/GSL.QJEGH.1996.029.P3.08
Zhong, K., Zheng, F., WuQin, H. C., Qin, C., and Xu, X. (2017). Dynamic Changes in Temperature Extremes and Their Association with Atmospheric Circulation Patterns in the Songhua River Basin, China. Atmos. Res. 190, 77–88. doi:10.1016/j.atmosres.2017.02.012
Keywords: climate extreme indices, precipitation, temperature, atmospheric circulation, qinghai-tibet plateau
Citation: Gong X, Wang X, Li Y, Ma L, Li M and Si H (2022) Observed Changes in Extreme Temperature and Precipitation Indices on the Qinghai-Tibet Plateau, 1960–2016. Front. Environ. Sci. 10:888937. doi: 10.3389/fenvs.2022.888937
Received: 03 March 2022; Accepted: 29 April 2022;
Published: 26 May 2022.
Edited by:
Cuicui Mu, Lanzhou University, ChinaReviewed by:
Oluwafemi E. Adeyeri, City University of Hong Kong, Hong Kong SAR, ChinaPing Wang, Institute of Geographic Sciences and Natural Resources Research (CAS), China
Copyright © 2022 Gong, Wang, Li, Ma, Li and Si. This is an open-access article distributed under the terms of the Creative Commons Attribution License (CC BY). The use, distribution or reproduction in other forums is permitted, provided the original author(s) and the copyright owner(s) are credited and that the original publication in this journal is cited, in accordance with accepted academic practice. No use, distribution or reproduction is permitted which does not comply with these terms.
*Correspondence: Xuyang Wang, eHV5YW5nd2FuZ0BsemIuYWMuY24=