 Pu Niu
 Yulong Jiang3
 Yongfang Yang
- 1School of Marxism, Henan University, Kaifeng, Henan, China
- 2Research Institute of Marxism, Henan University, Kaifeng, Henan, China
- 3College of Geography and Environmental Science, Henan University, Kaifeng, Henan, China
- 4Law School of Henan University, Kaifeng, Henan, China
The farmland social-ecological system is an integral part of a regional ecological system, and uses its unique perspective to trace the evolution of vulnerability of the whole ecosystem. Based on the theory of ecosystem vulnerability, the Vulnerability Scoping Diagram (VSD) assessment framework and index system of farmland system vulnerability were constructed by using multi-factor comprehensive analysis, ArcGIS spatial analysis and a factor contribution model. We evaluate the dynamic changes and influencing factors of farmland system vulnerability in Sanmenxia City, aiming to demonstrate the ways in which this vulnerability changes. The results showed a downward trend in the vulnerability of the farmland system in the city over a period of 17 years, from 0.60 in 2000 to 0.36 in 2016. From a spatial perspective, the distribution of vulnerability is uneven in each district and county. The pattern of vulnerability changed from “high in the Middle East-low in the southwest” in 2000 to “high in the Middle East-low in the southeast” in 2016. Population growth, high-speed urbanization, intensity of farmland use, factor input intensity and other human social and economic activities, together with the implementation of regional agricultural policies, have reduced the natural risk impact on the farmland social-ecological system. This is highly significant in revealing the overall evolution process and regional ecosystem mechanisms and informs the discussion on farmland social-ecosystem vulnerability in these representative areas.
1 Introduction
Farmland is a composite social-ecological system (SES) with the highest degree of human dependence (Neset et al., 2019) and a part of the regional ecosystem (Hagenlocher et al., 2018; Lazzari et al., 2020). The study of farmland SES reveals the evolutionary rules of the overall vulnerability of ecosystems from a particular perspective (Wiréhn et al., 2017; Neset et al., 2019). In recent years, the farmland system has shown two kinds of mutually repelling, ecological service functions. One is that of significantly increasing risk to the farmland system due to disasters, extreme weather and excessive human disturbance (O´Brien et al., 2004; Bindi and Olesen, 2011), and the other is excessive food, fiber and energy production, which is continuously provided by farmland systems addressing human needs (Fischer et al., 2002; Berry et al., 2006; Kovács et al., 2017; Wiréhn, 2018), showing strong stability. In 2020, as a result of global environmental change, many regions in China suffered natural disasters in the form of floods, geological disasters, hail and typhoons. A total of 138 million people were affected throughout the year, with the affected area of crops reaching 19, 957, 700 hm2; however, the total national grain output in 2020 was 669.49 million tons, an increase of 5.65 million tons on 2019, or 0.9%, reflecting the coexistence of both the vulnerability and stability of the farmland system.
Farmland system stability relates to strategies for both food security and people’s livelihoods. To demonstrate the rules for change of farmland system vulnerability, this research addresses the following questions: What is the impact on the regional farmland system and what changes have taken place? What are the factors driving the continuous development of the farmland system? What measures do humans need to take to cope with these changes? From the perspective of regional farmland system vulnerability, using Sanmenxia (Henan Province, China) City as a typical example, this research constructed a Vulnerability Scoping Diagram (VSD) model and established an assessment indicator system for farmland system vulnerability. The research analyzed this vulnerability in three ways, in terms of exposure, sensitivity and adaptive capacity. This research is important for maintaining farmland functions and structure, promoting the sustainable development of agriculture, and maintaining the stability of the ecosystem (Walker and Salt, 2006). Meanwhile, the social-ecological system operates a cascade mechanism, and cross-scale interaction is considered to be the basis of this cascading regime transformation (Pulver et al., 2018; Rocha et al., 2018), therefore, research on the micro-scale ecosystem process provides a valuable reference for the ecosystem over a wider spatial range or a long time period and determines the dynamic process of the system (Peters et al., 2007; Ting et al., 2020).
2 Theoretical background and analytical framework
2.1 Review of studies of farmland system vulnerability
Social-ecological vulnerability is when individuals or groups in the system cannot cope with pressure interference, which affects the cascade effect of the system and the independent feedback between social and ecological components (Adger, 2000; Adger, 2006; Cinner et al., 2012; Lazzari et al., 2021). The farmland system is part of the composite SES (Wang et al., 2021). In this system, humans, land resources and the environment interact on multiple spatial and temporal scales (Liu et al., 2007; Wilson et al., 2018; Wiréhn, 2018), leading to a system with a dynamic, complex, adaptive nested structure and multiple functional characteristics, which are constantly reshaped by external factors (such as environmental, social, economic, and political changes) and internal factors (e.g., social, economic, political changes, labor availability, production inputs, and other changes in livelihood needs) (Adger, 2006; Rockenbauch and Sakdapolrak, 2017). Such interaction of internal and external factors may unexpectedly disturb the farmland SES (Li and Zander, 2019) and produce feedback effects on social and natural systems (Chen et al., 2019). Therefore, there is some urgency to solve the complexity of the various services of social-ecological, farmland systems and to understand how social and economic services respond to system interventions and the vulnerability challenges this causes, and the need for sustainable management of farmland resources (Wang, 2021).
The farmland system has the dual attributes of agricultural and land resources. The FAO (2021) and the Intergovernmental Panel on Climate Change (IPCC, 2001) pointed out that vulnerability relates to the various risks of food insecurity or malnutrition, including factors that affect people’s ability to cope with stress or change, and the degree to which natural or social systems are vulnerable or incapable of coping with the adverse effects of climate change. Existing studies have mainly focused on vulnerability in the fields of climate change and ecosystem services (Cinner et al., 2013; Thiault et al., 2017; Siegel et al., 2019). These studies were mainly concerned with the causes of farming vulnerability due to changes in land use arising from climate change (Jamir, 2013; Bennett et al., 2016) and disaster intrusion (Jinno, 1995; Brugere, 2003; Huang et al., 2012); the dimensions of analysis mainly included system exposure (Pereira, 2012), government and farmer input (Jamir, 2013), infrastructure and industrial sensitivity and other dimensions affecting ecosystem vulnerability (Speranza, 2014; Rogers, 2020), the vulnerability of farmers’ production and livelihoods (Ashley, 2000; Brugere, 2003; Tebbotha, 2019), and the vulnerability of food security and the agricultural industry (Ashley, 2000.; Xie, 2014).
Many theoretical frameworks for vulnerability research have been developed in the past decade, among which Value Sensitive Design (VSD) and Agent Differential Vulnerability (ADV) integrated vulnerability assessment frameworks are widely applied. Acosta-Michlik and Rounsevell (2012) established an ADV framework to elaborate on the complexity and dynamics of human-environmental interactions to predict the degree of ecological vulnerability in different regions. Using the VSD vulnerability framework, Jamir et al. (2013) selected evaluation indicators from exposure, sensitivity and vulnerability to evaluate the vulnerability of farmers in Nagaland, India, and classified the driving factors of this.
In summary, previous studies have been limited to large-scale land and agricultural systems, however, few studies took the farmland system (that intersects the land and agricultural systems) as the object of research. In particular, there was a lack of evaluation and analysis of farmland system vulnerability in typical regions and few studies have focused on the factors that cause this. Therefore, we aimed to reveal the disturbance mechanism of the farmland system in the face of both natural and consequent social disasters, revealing the key factors influencing the development of a more stable and improved farmland system (Salvati et al., 2011), to cultivate and maintain its adaptive capacity and to allow it to be quickly updated and reshaped after any disturbance (Armitage, 2008).
2.2 Theoretical framework
With the increase of the degree of risk and uncertainty of the farmland system, the vulnerability framework has become a useful tool for assessing SES vulnerability (Adger, 2006). VSD can address SES problems that are difficult to solve using traditional methods, such as space and time complexity, nonlinearity, feedback loops and uncertainty (Mumby et al., 2014; Pham et al., 2017), and therefore, it is widely applied in system vulnerability assessment. The ADV model focuses on predicting the future, while the VSD model is better at assessing the current situation. Based on the VSD framework proposed by Kienberger (2013), farmland system vulnerability is assessed by its exposure, sensitivity and adaptive capacity. In this section, the literature on the theoretical framework is presented, followed by an introduction to the data sources and research methods. The assessment results of typical cases are then described before the analysis of these results and final conclusions.
2.2.1 The conceptual framework of vulnerability
As shown in Figure 1, the basic framework of the VSD model consists of three dimensions: exposure, sensitivity and adaptive capacity. Exposure refers to the degree to which the system may be susceptible to damage and is generally related to the “risk” faced by the system; the degree of exposure depends on the probability of exposure to potential threats to the system and determines the degree of potential loss it faces (Turner et al., 2003; Smit and Wandel, 2006; Perry et al., 2011). Sensitivity refers to the degree of difficulty for the system to maintain normal operations when it is subjected to external disturbances (Watts and Bohle, 1993), mainly reflecting the system’s ability to resist threat; the level of sensitivity depends on the system’s stability. Systems with lower sensitivity are less likely to be affected by disturbances and are more likely to maintain normal operations (O’Brien and Leichenko, 2000; O’Brien et al., 2004). Adaptive capacity is the ability of the system to adjust its productive activities and resource management strategies in response to disturbances. It determines the actual loss of the system when it suffers damage, therefore, the lower the adaptive capacity, the lower the actual damage to the system. The system changes, adjusting its state and parameters through its own adaptive capacity and human adaptive behavior, which affects its actual state under exposure pressure and its ability to recover after damage (Folke et al., 2003; Cinner et al., 2009; Bussey et al., 2012; Bennett et al., 2014). The VSD model classifies and displays the vulnerability elements, clearly explaining the relationship between these, and builds a complete assessment framework (Adger, 2006) that provides a theoretical basis for constructing an indicator assessment system and selecting assessment indicators.
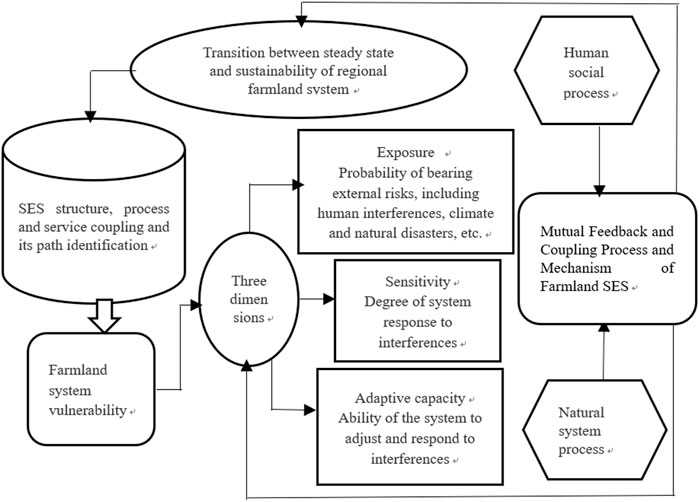
FIGURE 1. Vulnerability elements and interrelations of the farmland system.
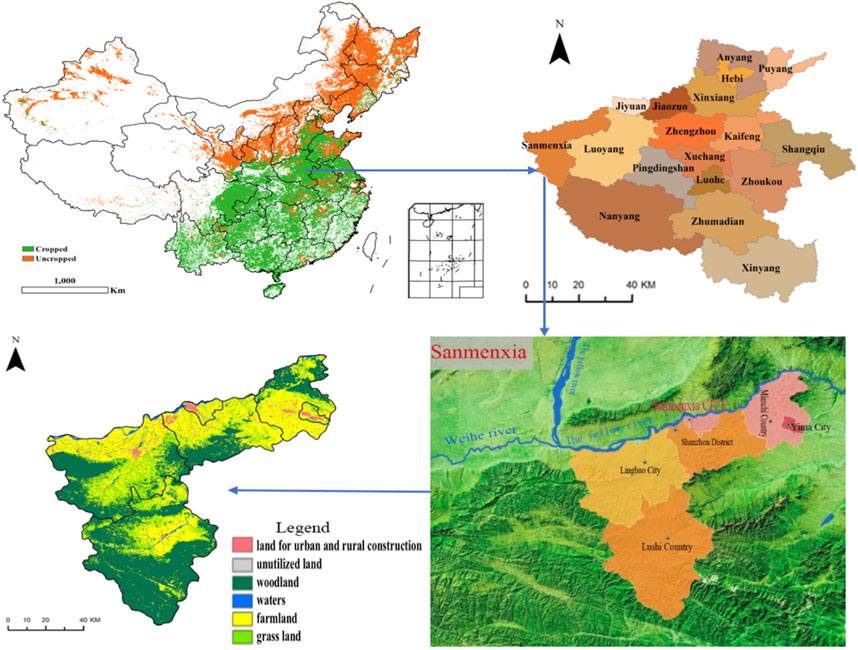
FIGURE 2. Location map of Sanmenxia City. (source from: National Earth System Science Data Center of the Chinese Academy, http:www.geodata.cn).
2.2.2 Relationship between the three dimensions of vulnerability
The vulnerability of the farmland system is the result of the dual impact of the natural environment and human activities due to the intervention of various policies such as farmland utilization, protection and restoration (Walker et al., 2004; Berkes and Ross, 2016). The impact on the natural environment mainly comes from meteorological and geological disasters such as extreme low temperature, frost, drought, and floods (Copeland et al., 2020), in terms of interference to human activity, with the feedback effect of human production and plundering of crops. Increasing crop plundering reduces the return of farmland system production, destroys farmers’ intention to retain farmland for planting, and leads to abandonment, pollution and loss of farmland system functions (Cutter, 2016; Siegel et al., 2019). If the dual impact of natural and human activities is positive, it will weaken the vulnerability of the farmland system; if it is negative, it will strengthen its vulnerability and undermine the stable operation of the system (Saja et al., 2019). The sensitivity of the farmland system is its response to exposure; the magnitude and rate of this response reflect the sensitivity degree of the farmland system to disaster intrusion (Copeland et al., 2020). Adaptive capacity captures the ability to respond to and address social and ecological changes by mitigating, coping with and recovering from the potential impact caused by a particular pressure (Thiault et al., 2019). The adaptive capacity of the farmland system can adjust and change the parameters of the potential state and determine the actual loss; the self-organization and adjustment capacity of the farmland system, policy protection and technology upgrades have improved the antagonistic ability of farmland to cope with risks (Lorenz, 2013).
3 Materials and methods
3.1 Characteristics of the study area
Covering an area of 10,496 km2, Sanmenxia City is located in the western part of Henan Province on the south bank of the Yellow River Delta and is the intersection of the eastern extension of the Qinling Mountains with Funiu Mountain, Xiong’er Mountain and Xiao Mountain. Sanmenxia City has the obvious characteristics of a transition zone. First, located at the intersection of the eastern edge of the Loess Plateau and the Yellow River Delta, it is the transition zone from the Loess Plateau to the alluvial plain. Second, located in the Qinling Mountains (Huai River transition zone), it is a transitional zone from a semi-humid to a semi-arid climate. In terms of the administrative location, Sanmenxia City borders Luoyang City to the east, Weinan to the west, Yuncheng of Shanxi Province to the north across the Yellow River and Nanyang to the south. It is the junction area of Henan, Shaanxi and Shanxi provinces. It is not only the central city of the Yellow River Golden Triangle region but is also a node city along the Belt and Road, so it has an important strategic location. Under the jurisdiction of Sanmenxia City, there are two districts and four counties, namely, Hubin District, Shanzhou District, Lingbao City, Yima City, Mianchi County, and Lushi County. In 2017, the city’s total population was 2,305,500 and regional GDP was 146.081 billion yuan, representing an increase of almost ten times that of 2000. GDP grew steadily in 2000–2018 with an annual growth rate of 13.81%.
3.2 Data source
3.2.1 Land use data
The remote sensing images of Landsat TM/ETM/OLI 30*30 m provided by the National Earth System Science Data Center of the Institute of Geographical Sciences and Resources of the Chinese Academy of Sciences were the main data source of the study. After image fusion processing, geometric correction, image enhancement and splicing, the remote sensing data of farmland in the years 2000 (Figure 3A), 2005 (Figure 3B), 2010 (Figure 3C), and 2015 (Figure 3D) were obtained using the human-computer interaction visual interpretation method. In combination with the land change survey data provided by Sanmenxia Natural Resources Bureau and the Statistical Yearbook of Sanmenxia City from 2000 to 2017, the farmland utilization data of each county and district were obtained, as shown in Table 1 and Figure 4. The number and transfer direction of farmland change in the periods 2000–2005 (Figure 4A), 2005–2010 (Figure 4B), 2010–2015 (Figure 4C), and 2000–2015 (Figure 4D) were calculated using the transfer matrix, as shown in Figure 5. Due to changes in the quantity of farmland, the per capita farmland area in Sanmenxia City in 2018 was 0.0762 ha, which was lower than the per capita quantity of 0.0853 ha in Henan Province at the end of 2016 and lower than the per capita farmland area of 0.9667 ha in the whole country.
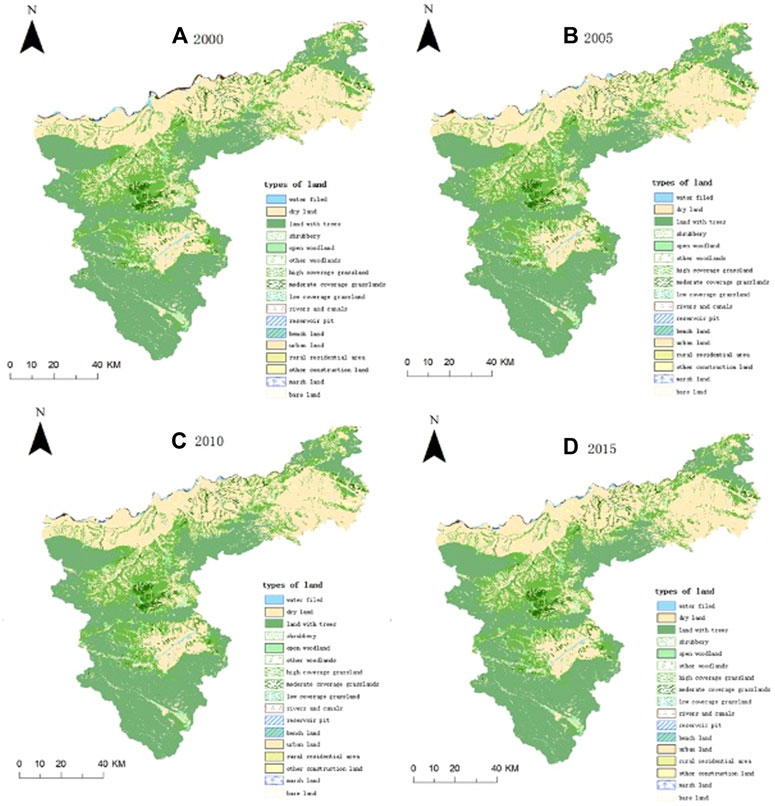
FIGURE 3. Changes in the farmland area of Sanmenxia City. (source from: Sanmenxia Natural Resources Bureau and the Statistical Yearbook of Sanmentxia City from 2000-2017).
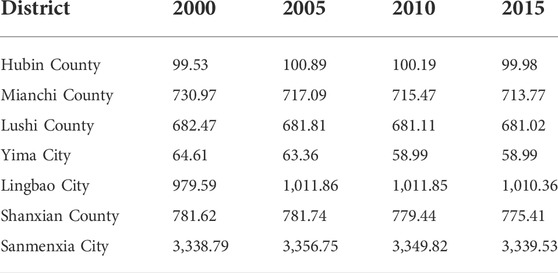
TABLE 1. Farmland area in Sanmenxia City from 2000 to 2015 Unit: hm2.
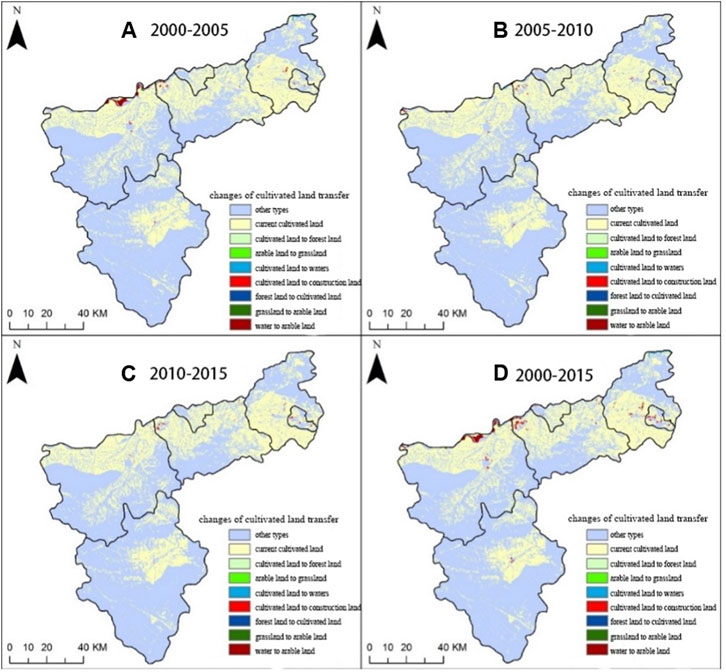
FIGURE 4. Direction of farmland transfer in Sanmenxia City.

FIGURE 5. Changes in the vulnerability of the farmland system in Sanmenxia City.
3.2.2 Data collected in the field
We went to Sanmenxia City and the districts and counties under its jurisdiction to collect data and conduct interviews. Sanmenxia Meteorological Bureau provided meteorological observation data and agricultural meteorological disaster data from various meteorological stations for the years 2000–2017. The Agriculture Bureau of Sanmenxia City and its districts and counties provided data on agricultural production, agricultural disasters and disaster prevention for this period. Farmland protection experts from the Sanmenxia Municipal Bureau of Land and Resources and the Agriculture Bureau scored each of the selected indicators.
3.2.3 Statistical data
Statistical data was obtained from the Henan Statistical Yearbook, Sanmenxia Statistical Yearbook, Sanmenxia Almanac, and statistical yearbooks of districts and counties of Sanmenxia City, the Land and Resources Bulletin, the Bulletin of Soil and Water Conservation of Henan Province, statistical bulletins, and government work reports of districts and counties of Sanmenxia City in 2000–2017.
3.3 Methods
3.3.1 Construction of the vulnerability assessment indicator system
The complexity of the farmland system itself makes it difficult to select and construct a farmland system vulnerability assessment system. Since system vulnerability is unobservable and cannot be directly measured (Carpenter, 2005), we used a combination of multiple indicators to characterize three dimensions of system vulnerability, as indicated in Table 2.
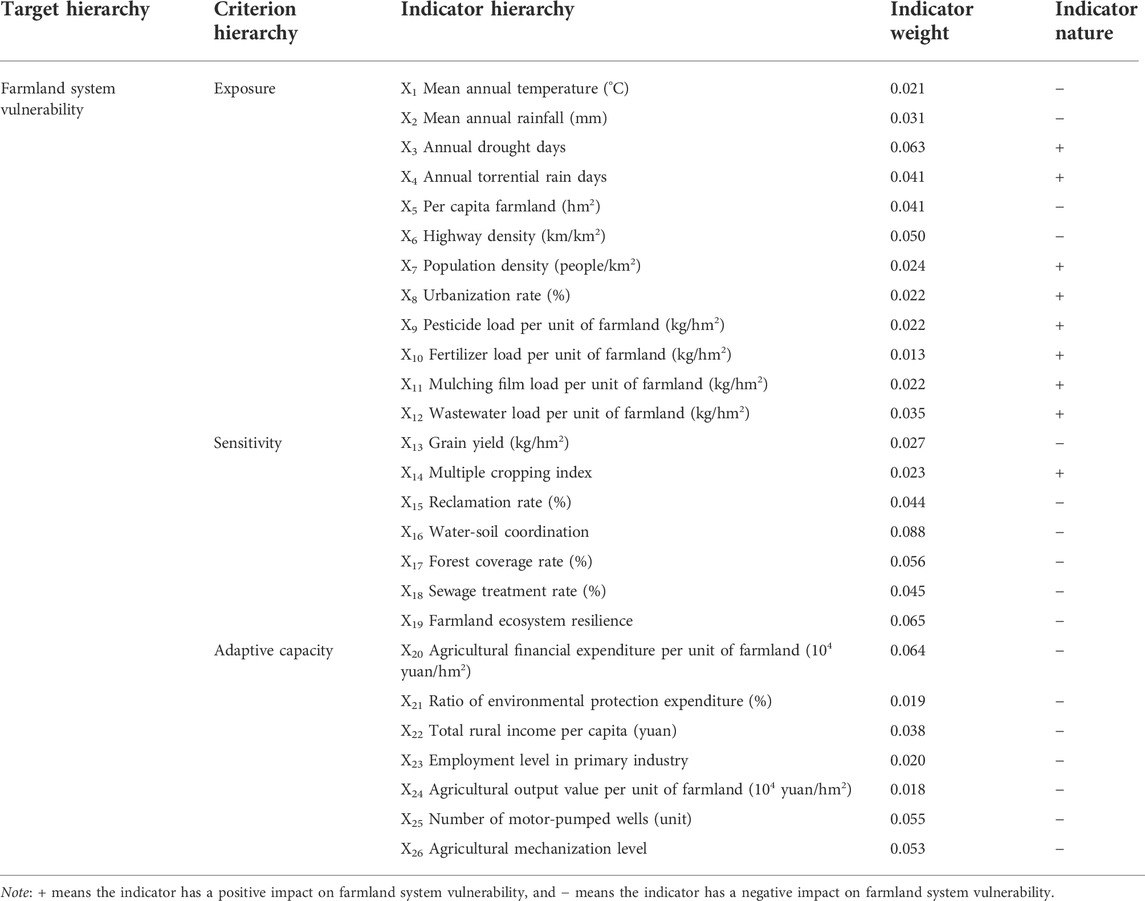
TABLE 2. Assessment indicator system for farmland system vulnerability.
3.3.1.1 Exposure
The risks faced by the farmland system mainly come from changes in the natural environment and the interference of human social activities. Mean annual temperature and annual rainfall can indicate water and thermal conditions throughout the year, and changes in temperature and precipitation have a crucial impact on crop growth. Annual drought days and torrential rain days reflect the risk probability of agro-meteorological disasters, with the former determined by the soil entropy measurement report, and the latter according to the standard of 30 mm of rainfall within 12 h and 50 mm of rainfall within 24 h. Per capita farmland reflects the change in the amount of farmland; a decrease in the amount of farmland resources threatens food security. Changes in highway density, population density and urbanization reflect the degree of stress on the farmland system caused by social and economic development. Discharge of industrial wastewater may pollute the farmland and affect environmental conditions and crop growth. In addition to the pollution of industrial wastewater, we should also pay attention to the agricultural non-point source pollution caused by the use of pesticides, fertilizers and mulching films. The more of this is used, the greater the threat of pollution to the farmland.
3.3.1.2 Sensitivity
Grain yield is an important indicator of measuring the operational status of the farmland system. The more stable the farmland system, the higher the grain yield. The multiple cropping index and reclamation rate reflect the intensity of farmland use. Insufficient use of farmland resources leads to wasted resources, while overdevelopment also leads to problems such as farmland and environmental degradation. The water-soil coordination reflects the irrigation level of the farmland, and an improvement in irrigation capacity can ensure the growth of crops. The forest coverage rate and sewage treatment rate are responses to the ecological environment and pollution threats. The expansion of vegetation coverage can preserve water and soil and improve the quality of the ecological environment. Farmland ecosystem resilience characterizes its ability to maintain the structure and pattern of the ecological environment, namely, the ability of farmland to gradually rebound and recover after disturbance (Lizhen et al., 2010).
3.3.1.3 Adaptive capacity
Financial investment in agriculture by government can reflect their efforts to improve agricultural technological innovation and progress. The proportion of financial expenditure on environmental protection reflects the degree of investment in environmental governance. The higher the degree, the better the quality of the ecological environment. Rural income per capita reflects the changes in farmers’ income, and increases can promote an improvement in farming levels. The employment level in primary industry reflects the flow of agricultural labor and changes in the industrial structure. Generally, the lower the employment level in primary industry, the less development and use of farmland resources. The number of motor-pumped wells and the general level of agricultural mechanization reflect the degree of agricultural infrastructure and mechanization. The better the farming conditions, the higher the adaptive capacity of the farmland system.
3.3.2 Assessment and classification of farmland system vulnerability
In this study, we used the composite index method to assess farmland system vulnerability. The core of this method lies in the construction of the indicator system and the determination of the weight of each indicator. The calculation model is as follows:
where VI denotes the farmland system vulnerability index, Pij is the standardized value of each vulnerability indicator factor, Wi is the weight of the ith indicator, n is the number of vulnerability indicators; the indicator value of each dimension is calculated by the value of each indicator.
With reference to previous research results and the results of Formula 1, we classified the vulnerability index of the farmland system into five levels from high to low: extreme, severe, moderate, mild and slight, as shown in Table 3. The greater the vulnerability index of the farmland system, the higher the vulnerability level.
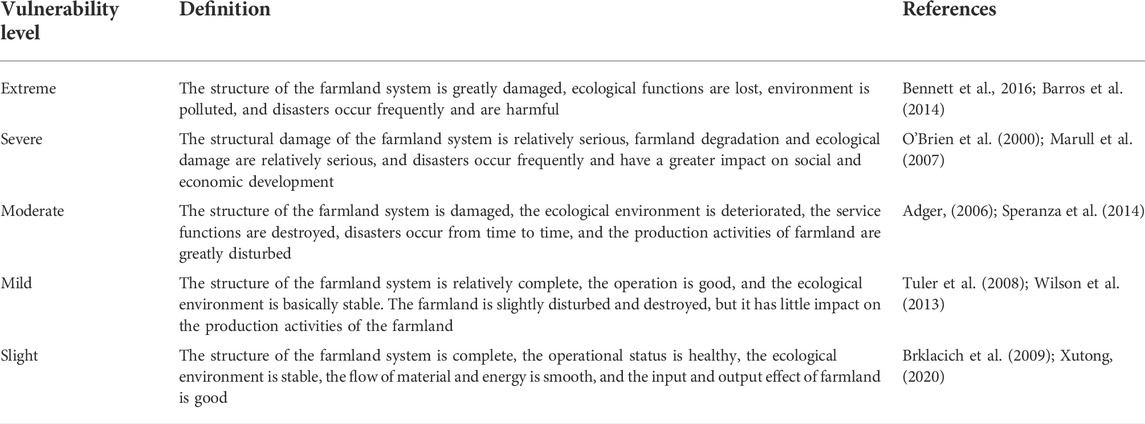
TABLE 3. Classification of farmland system vulnerability.
3.3.3 Data processing and determination of indicator weight
3.3.3.1 Data processing
Since the factors influencing farmland system vulnerability are of different units, it is necessary to standardize the data and unify the dimensions. We used the maximum and minimum method to nondimensionalize the original data. The calculation formula is as follows:
Positive indicator:
Negative indicator:
where Pij is the standardized value of the indicator, Xij is the original data of the jth indicator in the ith year, and Xmax and Xmin are the maximum and minimum values of the jth indicator.
3.3.3.2 Determination of indicator weight
In this study, we used the subjective and objective combined weighting method to determine the weight of each indicator. For objective weighting, we used the entropy method, and for subjective weighting, we used the analytic hierarchy process (AHP).
3.3.3.2.1 Entropy method
We constructed a judgment matrix and determined the weight based on the amount of information contained in the indicator data and its effect on system changes. First, if there are m indicators and n objects to be evaluated, the information entropy of the jth indicator is calculated:
where k = 1/
Next, the effect value hj of the jth indicator is calculated:
The weight Wi of the jth indicator is calculated:
where n = 1,2,3 … … ;0<
According to the above calculations, we can obtain the entropy weight of each indicator, and then determine the weight value wq of the objective weighting method.
3.3.3.2.2 Determination of factor weight value
According to the expert scoring, by calculating the maximum eigenvalue λmax of the judgment matrix and the corresponding eigenvector W, we can obtain the ranking weight of the relative importance of the factors of the same hierarchical level relative to a factor of the previous hierarchical level. The calculation steps are as follows:
Multiply the values in the matrix by rows and calculate the nth power of the product, get Wi, normalize Wi, and obtain wi;
On the basis of single level ranking, calculate the weight value of the previous level factors for the next level to finally obtain the total level of ranking. After calculating all weight vectors, test the consistency of the comparison matrix. Only the determination of the weight passing the consistency test is valid. The consistency coefficient CR < 0.1 means that the judgment matrix passes the consistency test. If it fails, the judgment matrix needs to be readjusted until it reaches the satisfactory consistency standard:
where CI denotes the consistency coefficient of the judgment matrix and RI is the average random consistency coefficient.
According to the above calculations, on the basis of passing the consistency test, we can obtain the subjective weight value Wp of each indicator.
3.3.3.2.3 Combined weighting method
The combined weighting method comprehensively considers the subjective and objective factors and integrates the indicator weights obtained by the objective and subjective weighting methods to obtain the combined weight. In this study, we took the average of the two as the combined weight as follows:
where Wq is the weight coefficient obtained by the entropy method, and Wp the weight coefficient obtained by the AHP.
3.4 Factor contribution degree model
Identifying the contribution factors influencing vulnerability can assist in further diagnosing the vulnerability mechanism. The stability of the farmland system has an inverse relationship to its vulnerability, in other words, the lower the vulnerability value, the better the operational state of the farmland system. Therefore, using the principle of contribution degree, we improved the obstacle degree model to be a factor contribution degree model, to calculate the contribution value that affects the negative state as follows:
where Di is the contribution degree indicating the degree of effect of the ith indicator on the vulnerability of the farmland system; Si is the weight of the ith indicator to the overall target; Vi is the indicator membership degree, namely, the evaluation value of the ith indicator; Ur is the contribution degree of the rth criterion to the vulnerability; Wr is the weight of the rth criterion; and Wi is the weight of the ith indicator.
4 Evaluation results of the vulnerability of the Sanmenxia City farmland system
4.1 Indicator weight results and vulnerability classification
According to the calculation results of the above Formulas 2ormulas –Formulas 12, the weights of the entropy method of Sanmenxia City and its districts and counties are shown in Table 4.
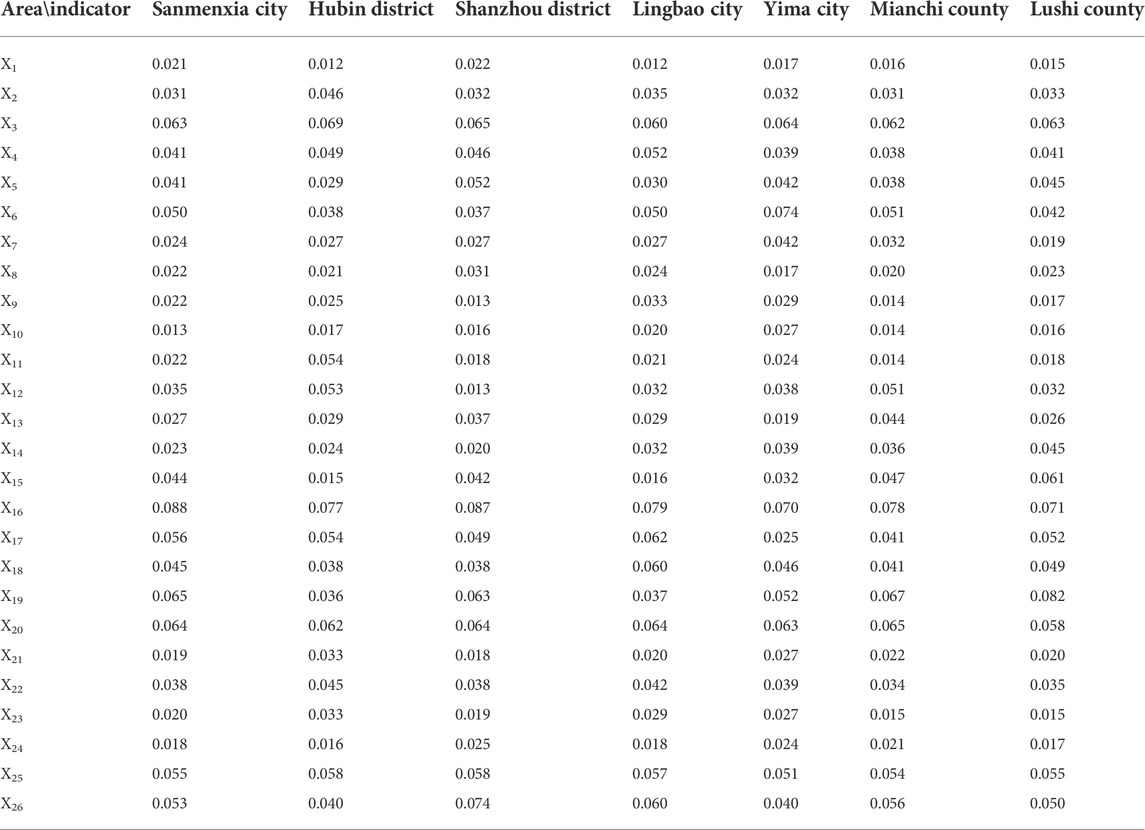
TABLE 4. Weights of indicators of farmland system vulnerability obtained by the combined weighting method.
According to the classification criteria for farmland system vulnerability assessment, we divided the vulnerability of the Sanmenxia City farmland system into five levels, as shown in Table 5.

TABLE 5. Classification of the farmland system vulnerability of Sanmenxia City.
4.2 Temporal changes in vulnerability
Using the farmland system vulnerability assessment method, we standardized the original data to obtain standardized values of the vulnerability assessment indicators of the farmland system in Sanmenxia City and its districts and counties. Then, using the vulnerability calculation formula, we calculated its vulnerability in 2000–2017, as shown in Figure 5.
From Figure 4, we can see that in 2000–2017, the overall vulnerability of the farmland system in Sanmenxia City showed a declining trend, decreasing from 0.60 to 0.36, a decrease of 39.7%, with overall vulnerability significantly declining. In 2000–2010, farmland system vulnerability showed a fluctuating downward trend as it was relatively high, and the fluctuations were large. After 2010, vulnerability gradually saw small fluctuations; during this period, the operation of the farmland system was stable, and development occurred. During the past 18 years, the vulnerability level declined from extreme to mild, indicating that the environment has improved greatly, with increases in both its sustainability and resilience.
4.2.1 Changes in exposure
Farmland system exposure characterizes the degree to which farmland is disturbed by external factors. It is not only related to the intensity and frequency of disasters faced by the system, but also is affected by the characteristics of the system and its ability to withstand these disasters. From the perspective of risk stress, the exposure of the farmland system is influenced by the interaction of natural factors such as climate change, meteorological disasters, and human, social and economic activities. To a certain extent, human activities can intensify or slow these influences.
From Figure 6, we can see that the overall exposure of the farmland system showed an upward trend, although these changes were not large, increasing from 0.16 in 2000 to 0.21 in 2017, an increase of 31%. The increase in the exposure index of the farmland system indicates that the farmland was more affected by natural and human disturbances, as the environment deteriorated, the risk to it was increased, and its stability was undermined. In 2000–2005, the exposure index declined slightly, although there were small fluctuations; in 2006–2012, the exposure index fluctuated greatly from 0.21 in 2007 to 0.14 in 2010, reaching a peak of 0.23 in 2012; after 2013, the exposure index showed a small declining trend and the farmland system remained at a high exposure level.
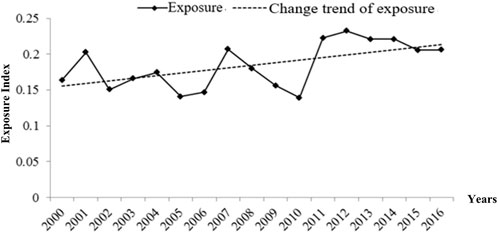
FIGURE 6. Changes in the exposure of the farmland system in Sanmenxia City.
4.2.2 Changes in sensitivity
Changes in the sensitivity of the farmland system can reflect the damage caused by disasters. Sensitivity is the response to exposure and is mainly influenced by the frequency and amplitude of system interference factors, manifesting in phenomena such as changes in farmland yield and ecological degradation. The level of sensitivity can indicate the stability of the farmland system, as systems with lower sensitivity generally have higher stability.
In Figure 7, the sensitivity index generally shows a declining trend. In 2000–2017, the sensitivity index declined from 0.22 to 0.06, a decrease of 71%. In 2000–2006, the sensitivity index showed a temporary fluctuation. In 2001 and 2003, it experienced a low growth, but these changes were not large, and it still remained at a high level. In 2007–2012, the sensitivity index dropped sharply, with this decline slowing down after 2013. The changing trend in sensitivity of the farmland system reflects the significant improvements in its stability, with the anti-interference ability also improving.
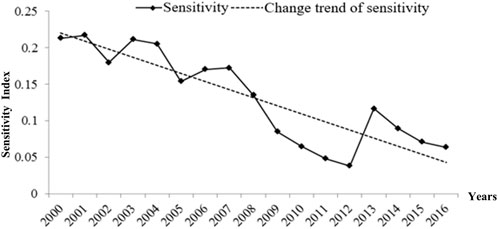
FIGURE 7. Changes in the sensitivity of the farmland system in Sanmenxia City.
4.2.3 Changes in adaptive capacity
The adaptive capacity characterizes the state and resilience of the farmland system after being disturbed. Changes in adaptive capacity determine the actual loss of farmland in the face of various risks and are mainly affected by the resilience of the farmland itself and human investment in farmland protection. Although sensitivity can describe the state of the system, it focuses on the system stability, while adaptive capacity focuses on the description of the system’s resilience and indicates sustainable development.
Figure 8 shows that in 2000–2017, the adaptive capacity index of the farmland system showed a declining trend from 0.29 to 0.1, a decrease of 66%, which suggests that its capacity to withstand pressure to cope with risks was greatly improved. Specifically, in 2000–2010, the adaptive capacity index declined from 0.27 to 0.2, but the decline rate was small, showing that the adaptive capacity of the farmland system during this period improved rapidly; in 2010–2014, the adaptive capacity index rapidly declined; after 2015, it increased, with a large fluctuation that reflected the instability of the adaptive capacity. The lower the adaptive capacity index, the lower the vulnerability index of the farmland system, with a decline in the adaptive capacity index indicating a corresponding increase in resilience.
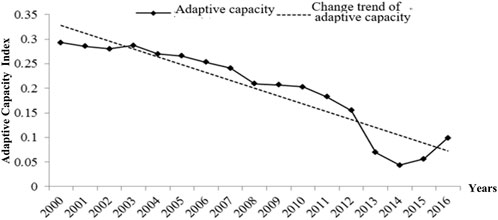
FIGURE 8. Changes in the adaptive capacity of the farmland system in Sanmenxia City.
4.3 Analysis of the degree of vulnerability changes
To reveal the regional differences in the vulnerability of the farmland system in the districts and counties of Sanmenxia City, the average value, standard deviation, coefficient of variation and slope of change based on the vulnerability index of the farmland system in each county and district in 2000–2017 were calculated. The average value indicates the average level of farmland system vulnerability during these years. The standard deviation and coefficient of variation reveal the variation of the vulnerability index of the farmland system in the time series of each district and county. The trend slope fits the vulnerability index of the farmland system against time and reflects the degree of vulnerability changes in the time dimension as shown in Figure 9. During this period, Mianchi County had the highest coefficient of variation in the farmland system vulnerability index at 0.251, followed by Lushi County at 0.198, with the lowest being Yima City at only 0.106. Mianchi County and Lushi County had the most significant changes in vulnerability of the farmland system.
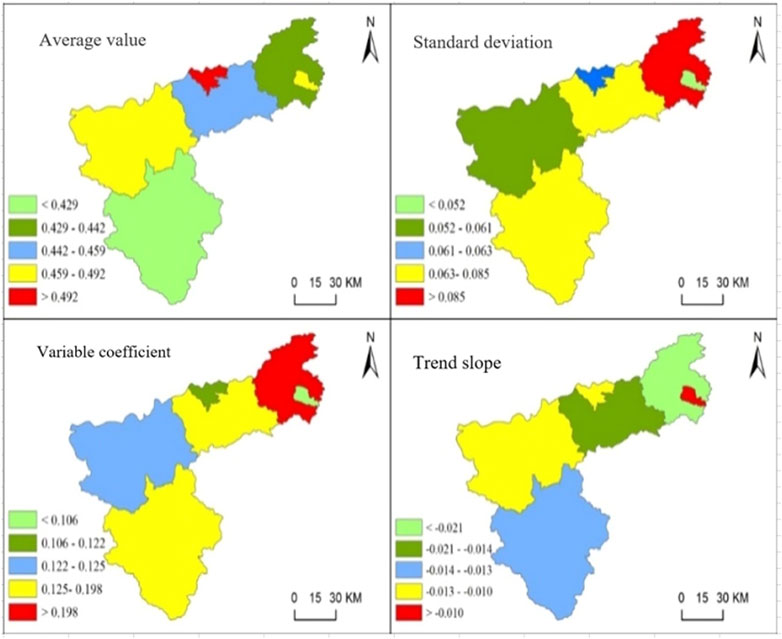
FIGURE 9. Degree of vulnerability changes in the farmland system in Sanmenxia City.
4.4 Spatial changes in vulnerability
To further explore the changes in vulnerability, we analyzed the spatial differentiation characteristics of the vulnerability of the farmland system in Sanmenxia City’s districts and counties. We selected the four time periods of 2000, 2006, 2010 and 2016, and used ArcGIS 10.3 for technical processing. Through data visualization, it is possible to show the spatial changes in vulnerability at the county scale.
From Figure 10, we can see that in 2000, the overall vulnerability of the farmland system was relatively high, and the level of vulnerability was severe. Specifically, the vulnerability of the farmland system in Hubin and Shanzhou Districts in the central region of Sanmenxia City was at an extreme level, Mianchi County in the east was also at an extreme level, with the extreme vulnerability area showing a concentrated and contiguous trend. Lingbao City in the west, Lushi County in the south and Yima City in the east were areas of severe vulnerability.

FIGURE 10. Spatial changes in vulnerability of the farmland system in Sanmenxia City.
In 2006, the overall vulnerability level declined. The vulnerability index of the eastern and southern districts and counties was relatively low, with most of them moderate and only Hubin District and Lingbao City being severe. The vulnerability of Shanzhou District and Mianchi County declined from severe to moderate in 2000, representing a significant decline. The vulnerability of Yima City and Lushi County declined from severe to moderate, and Lingbao City remained unchanged at severe.
In 2010, the vulnerability of the farmland system was mostly at a mild level. Apart from Hubin District and Yima City, the vulnerability of other districts and counties declined. Lingbao City declined from severe in 2006 to mild, and Shanzhou District, Mianchi County and Lushi County declined from moderate to mild. The vulnerability of the farmland system in Sanmenxia City experienced significant changes to the spatial pattern, forming wide ranging low-value vulnerable areas.
In 2016, the spatial difference in vulnerability was more obvious than in 2010, with some areas significantly improved. The western and central regions had relatively high vulnerability levels. Shanzhou District, Lingbao City and Yima City increased from mild to moderate, while Hubin District declined from moderate to mild, and Lushi County in the south changed from mild to slight vulnerability.
4.5 Spatial distribution of dominant types - District and county levels
There are two districts and four counties under the jurisdiction of Sanmenxia City. The natural conditions and the level of social and economic development vary greatly between districts and counties; the spatial characteristics of farmland system vulnerability are also different in the various districts and counties. To further explain the factors that cause these changes in vulnerability, we used the contribution degree model. Using its formula, we calculated the contribution degree of the contribution factors to farmland system vulnerability in each district and county; the sum of the contribution rate of the three dimensions of exposure, sensitivity and adaptive capacity was 100%. Through comparing the contribution degree of the three dimensions of each district and county with that of the Sanmenxia City area, the dimension with the largest difference was found to be the dominant level causing farmland system vulnerability in each district and county to be significantly different from that of the Sanmenxia City area. On the basis of this, it can be judged that there are three main types of the farmland system vulnerability at the county level: exposure dominant (E), sensitivity dominant (S) and adaptive capacity dominant (A). The changes in types of farmland system vulnerability in districts and counties of Sanmenxia City in 2000–2016 are shown in Table 6.
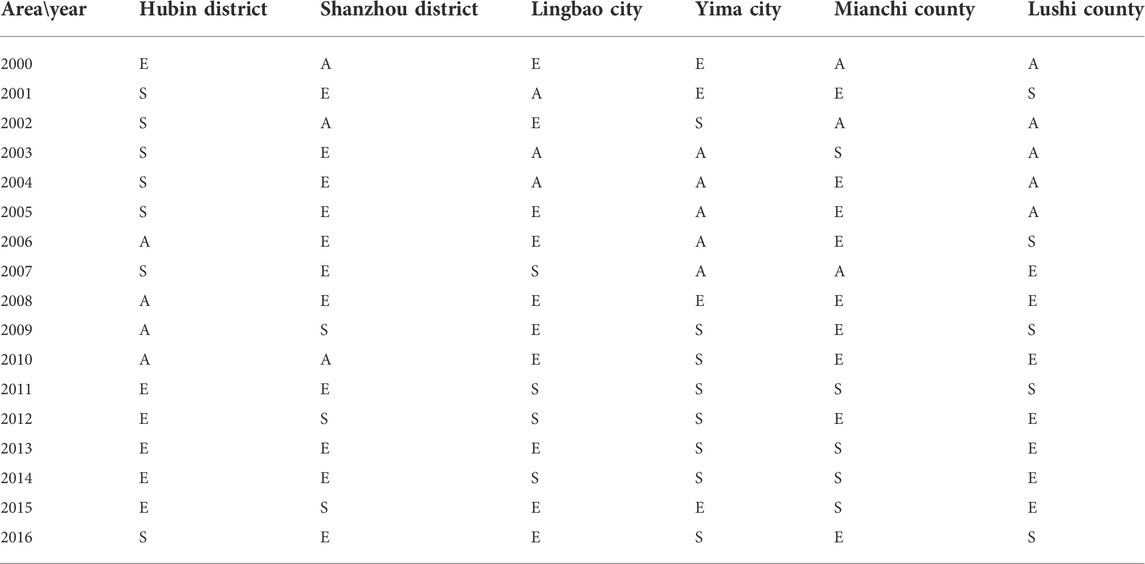
TABLE 6. Changes in dominant types of farmland system vulnerability in districts and counties of Sanmenxia City.
We selected 4 years (2000, 2006, 2010, and 2016) in which to compare the vulnerability dominant types. The results show that Hubin District evolved from type E in 2000 into type A in 2006 and 2010, and then to type S in 2016. This indicates that farmland system vulnerability in Hubin District first evolved from exposure dominant into adaptive capacity dominant, and in recent years, has been significantly influenced by sensitivity. Shanzhou District was type A in 2000, evolving into type E in 2006, 2010, and 2016, indicating that the farmland system in Shanzhou District has been greatly influenced by exposure factors since 2000. The dominant types in Lingbao City were all type E, indicating that exposure had the most significant impact on the vulnerability of the farmland system in Lingbao City. Yima City was type E in 2000, evolving into type A in 2006, and then to type S in 2016, indicating that sensitivity was the dominant factor leading to these changes in vulnerability during this period. Mianchi County was type A in 2000 and type E in 2006, 2010 and 2016, indicating that vulnerability was significantly influenced by exposure factors. Lushi County was type A in 2000 changing to type E in 2010, and to type S in 2016, indicating that changes in sensitivity exerted a major influence on the vulnerability of the farmland system here.
5 Discussion
5.1 Influencing factors in the vulnerability of the farmland system based on correlation analysis
A bivariate correlation analysis of the vulnerability of the farmland system in Sanmenxia City can reveal its key influencing factors. Using SPSS bivariate correlation analysis, we analyzed the correlation between the 26 indicators in the vulnerability assessment system and the farmland system vulnerability index of Sanmenxia City to obtain the correlation coefficients of 26 vulnerability variables.
As indicated in Table 7, the changes in the vulnerability of the farmland system were significantly correlated with 16 factors, including X5 (per capita farmland), X6 (highway density), X7 (population density), X8 (urbanization rate), X9 (pesticide load per unit of farmland), and X11 (mulching film load per unit of farmland); the changes in the vulnerability of the farmland system in Sanmenxia City were generally correlated with three factors, namely, X10 (fertilizer load per unit of farmland), X18 (sewage treatment rate), and X26 (agricultural mechanization level). Changes in vulnerability had little correlation with five factors, including X1 (mean annual temperature), X2 (mean annual rainfall), and X3 (annual drought days). These indicate that in the Sanmenxia City area, many factors have a high correlation with farmland system vulnerability.
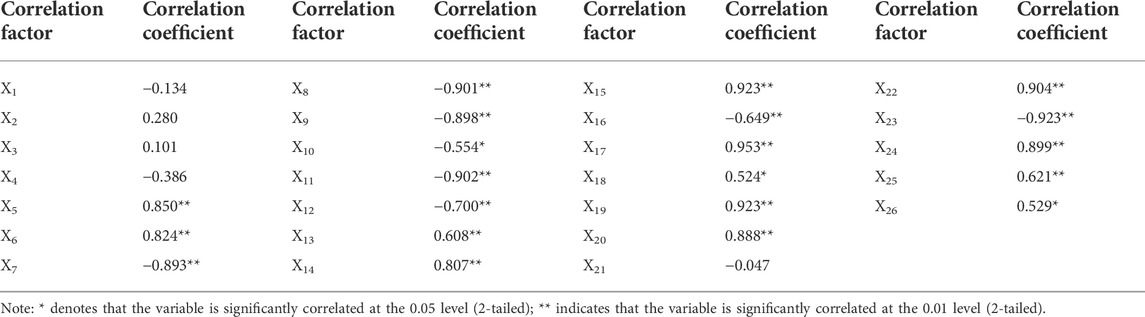
TABLE 7. Correlation coefficients of vulnerability of the farmland system in Sanmenxia City.
Urbanization, land use intensity and agricultural pollution are major factors influencing farmland system vulnerability. In 2000–2017, Sanmenxia City’s farmland system remained in a high exposure state and was subject to relatively high risks, which were mainly due to human interference. According to the correlation coefficient, climatic factors had little correlation with the changes in the vulnerability of the farmland system, while the correlation between population density, urbanization rate, highway density and changes in farmland system vulnerability was relatively high. With the increase in population and the development of the social economy, the demand for food is also increasing. In order to ensure food production, farmers constantly increase the use of pesticides, fertilizers and mulching films, which make farmland pollution worse. The urbanization rate of Sanmenxia City rose from 26.36% to 53.11% during these 18 years. The continuous advancement of urbanization and the increase in urban population led to the rapid expansion of urban construction. Some high-quality farmland around the city is occupied, and the development of road traffic also results in the expansion of construction land on both sides of the road, in turn resulting in an increase in the intensive use of farmland. Therefore, for the farmland system of Sanmenxia City, high exposure is due to the stress of social factors on the farmland, with natural factors having little correlation with this.
The optimization of the farmland use structure and improvements to the ecological environment can reduce the sensitivity of the farmland system. The multiple cropping index, forest coverage rate, and farmland ecosystem resilience are highly correlated with changes in farmland system vulnerability. The multiple cropping index of the farmland in Sanmenxia City has declined over these 18 years from 1.58 to 1.38. The decline in the multiple cropping index shows that the intensity of farmland use in the Sanmenxia area is falling and the quality of farmland is poor. Proper fallowing is conducive to improving the nutrient restoration of farmland and promoting its sustainable use. The reduction in the intensity of farmland use and the improvement in water-soil coordination ensure its sustainable production capacity. The forest coverage rate of Sanmenxia City rose from 36% to 51% during this period. This increase not only improves the ecological environment, but also plays a key role in maintaining water and soil and conserving water resources, which is of utmost importance to the stability of the ecosystem of the city, where there are large mountainous and loess areas.
In 2000–2017, the adaptive capacity of the farmland system gradually fell, which means that actual losses suffered when faced with various risks are decreased. The above analysis indicates that agricultural financial expenditure, rural income per capita, employment levels in primary industries, and agricultural output value have a high correlation with the vulnerability of the farmland system in the Sanmenxia City area. The increase in expenditure by government on agriculture provides advanced equipment and technology for agricultural production and optimizes the use of farmland. From the perspective of farmers, an increase in income from farmland leads to improvements in farming technology, more capital investment in the farmland system, and increases in productivity. The decline in the employment level in primary industries is mainly due to the decline in the rural population, with most young and middle-aged people going out to work. Most of those left behind are elderly and unable to work. The loss of rural labor has caused part of the farmland to be abandoned or left unattended, leading to a waste of farmland resources. The decrease in the number of people engaged in agriculture has impacted on the adaptive capacity of the farmland system.
5.2 Influencing factors of farmland system vulnerability
The development of vulnerability theory is already advanced, but there are still few studies on farmland system vulnerability. As a complex SES, the farmland system faces the dual interferences of human activity and natural elements. Since research on these issues is comprehensive, the construction of farmland system vulnerability indicators is inevitably limited. However, this research has the following limitation: when assessing the vulnerability of the farmland system in Sanmenxia City, constructing the indicator system is problematic due to the incompleteness and inaccessibility of some data. For example, it is difficult to obtain continuous data on soil quality and soil erosion conditions that can characterize the transitional characteristics of the Loess Plateau. Consequently, this research does not cover all the variables reflecting the level of ecological vulnerability, and the evaluation results caused by the vulnerability of the farmland system might be different from the actual results.
The dimensions in the social-ecological framework are often spatial or temporal; it is also recognized that supralocal and current events may influence the outcomes of social-economic status (Pulver et al., 2018). In the cross-scale interaction model, the fine-scale process can affect a wide spatial range or a long time period, or the large-scale drivers can interact with the fine-scale to determine the system dynamic process (Peters et al., 2007). Cross-scale interactions are considered to be the basis for the transformation of cascade mechanisms (Rocha et al., 2018) and are increasingly seen to have important implications for ecosystem processes, although the complexity of SES poses significant challenges to understanding these interactions (Ting et al., 2020). This research on the vulnerability of the farmland system in Sanmenxia City area has wider significance for the study of other large-scale farmland systems. Our research has shown that the regional farmland system has the same characteristics of significant vulnerability as the large-scale SES. Although regional small-scale research has particularities and limitations, natural factors with large-scale characteristics, such as temperature, precipitation, drought and floods, have little effect on the vulnerability of the farmland system, indicating that a local balance can be achieved through an adaptive mechanism in the long-term evolution process; human factors are a key process driving these system changes. This result is also consistent with the fact that there have been frequent extreme weather disasters in China in recent years, although food production has not decreased. It should be noted that this paper studies the vulnerability of farmland ecosystems in the study area in a short time span and pays little attention to the interaction between regions and elements. Future studies could feasibly focus on the vulnerability of farmland systems at different scales and in different regions, in order to explore the cascading regime of cross-scale farmland system interaction. In this case, a dynamic protection mechanism for the farmland SES could provide countermeasures for solving and preventing the issues of sustainable utilization of farmland.
From the above analysis, it is seen that as a complex system, SES has many factors that affect its stability. It is not enough to evaluate the vulnerability of SES. It is clear that the main risks faced by the farmland system in the Sanmenxia City area are due to the pressure caused by rapid social and economic development, while the influence of natural factors is not significant. Avoiding these risks is an effective means of controlling the vulnerability of the farmland system. Thus, when formulating farmland policies, the Sanmenxia municipal government and functional departments should control them from the macro level, ensuring overall awareness, and providing guidance for the formulation of policies in all districts and counties under their jurisdiction.
The results show the feasibility of the evaluation of farmland vulnerability in a fine scale system. First, the index system is constructed. In addition to referring to the relevant research results, our research group also visited Sanmenxia City and the functional departments of counties and districts in July 2016 and March 2017 to collect data and conduct interviews. Experts from Sanmenxia Land Bureau, Agriculture Bureau and the Farmland Protection Bureau were invited to mark the index comparison matrix constructed by AHP. Based on these data and expert interviews, combined with the specific situation of farmland use in Sanmenxia City, the evaluation index system is set. Although this may deviate from existing research results, it is closer to the local situation. Second, the entropy weight method used in this paper is relatively weak in correlation compared with the set pair analysis and pairwise analysis. However, it solves the overall problem of the system. Due to limited space, this paper does not explore further the correlation between indicators. Third, the consistency of land use data is mainly due to the large difference between image interpretation data and annual change data. The indicators in the paper are calculated based on the data integrated in each year, and the calculation results are closer to the actual situation in the study area.
6 Conclusion
In this paper, the vulnerability theory and evaluation method are applied to the study of the farmland system, and the VSD research framework of the farmland system is constructed. The results show that:
(1) In 2000–2016, the vulnerability index of the farmland system in Sanmenxia City showed an overall downward trend, declining from extreme to mild vulnerability. In terms of the three dimensions of farmland system vulnerability, exposure showed an increasing trend, reflecting the fact that both interferences and risks for the farmland system were greater. However, the sensitivity index fluctuated, indicating that the actual loss of the farmland system in dealing with various risks was reduced. The adaptive capacity index showed a declining trend as well, indicating that the ability of the farmland system to withstand stress and deal with risks was greatly improved. Data analysis showed that the increase in the exposure index of the farmland system is much lower than the decrease in the sensitivity and adaptive capacity indexes. Therefore, despite the increase in risks and disturbances, the overall vulnerability of the farmland system still decreases.
(2) In terms of the spatial distribution, the vulnerability of the farmland system in the districts and counties of Sanmenxia City is unevenly distributed as it is higher in the central and western regions and lower in the south. Overall vulnerability shows a declining trend from “high in the central and eastern regions and low in the southwest” in 2000 to “high in the central and western regions and low in the southeast” in 2016.
(3) The main factors influencing the vulnerability of the farmland system in Sanmenxia City are the sensitivity and adaptive capacity of human social and economic activities and the capacity of the farmland system to cope with stress. Population growth and rapid urbanization are the main risk factors for the farmland system in Sanmenxia City, as they place great pressure on the intensity of farmland use. However, the increase in agricultural financial investment and farmers’ incomes results in higher agricultural production, farming technology and factor input intensity, so the farmland system becomes less sensitive to the threat of risks. The implementation of regional agricultural policies, changes in agricultural production factors, farming technology inputs, and farming intensity provide support for the stable operation of the farmland system, enabling farmland to be more resilient to risk stress.
Data availability statement
The raw data supporting the conclusion of this article will be made available by the authors, without undue reservation.
Author contributions
Conceptualization, PN and YY; methodology, YJ; investigation, LW; writing—original draft preparation, PN; writing—review and editing, YY; visualization, YJ and LW; supervision, YY; project administration, PN and YY; funding acquisition, PN. All authors have contributed to this version of the manuscript.
Conflict of interest
The authors declare that the research was conducted in the absence of any commercial or financial relationships that could be construed as a potential conflict of interest.
Publisher’s note
All claims expressed in this article are solely those of the authors and do not necessarily represent those of their affiliated organizations, or those of the publisher, the editors and the reviewers. Any product that may be evaluated in this article, or claim that may be made by its manufacturer, is not guaranteed or endorsed by the publisher.
References
Acosta-Michlik, L., and Rounsevell, M. (2012). “An agent-based framework for assessing vulnerability futures,” in Assessing vulnerability to global environmental change (London: Routledge), 168–192. doi:10.4324/9781849770514
Adger, W. N. (2006). Vulnerability. Glob. Environ. Change 16, 268–281. doi:10.1016/j.gloenvcha.2006.02.006
Adger, W. N. (2000). Social and ecological resilience: Are they Prog. Hum. Geogr. 24 (3), 347–364. doi:10.1191/030913200701540465
Armitage, C. J. (2008). A volitional help sheet to encourage smoking cessation: A randomized exploratory trial. Health Psychol. 27 (5), 557–566. doi:10.1037/0278-6133.27.5.557
Ashley, C. (2000). Applying livelihood approaches to natural resource management initiatives: Experiences in Namibia and Kenya. London: Overseas Development Institute. Working Paper 134.
Barros, V. R., Field, C. B., and Dokken, D. J. (2014). “Climate change 2014: Impacts, adaptation, and vulnerability. Part B: Regional aspects,” in Contribution of working group II to the fifth assessment report of the intergovernmental Panel on climate change (Cambridge, United Kingdom and New York: Cambridge University Press), 1267–1326.
Bennett, N. J., Blythe, J., Tyler, S., and Ban, N. C. (2016). Communities and change in the anthropocene: Understanding social-ecological vulnerability and planning adaptations to multiple interacting exposures. Reg. Environ. Change 16, 907–926. doi:10.1007/s10113-015-0839-5
Bennett, N. J., Dearden, P., Murray, G., and Kadfak, A. (2014). The capacity to adapt? Communities in a changing climate, environment, and economy on the northern andaman coast of Thailand. Ecol. Soc. 19, 5. doi:10.5751/ES-06315-190205
Berkes, F., and Ross, H. (2016). Panarchy and community resilience: Sustainability science and policy implications. Environ. Sci. Policy 61, 185–193. doi:10.1016/j.envsci.2016.04.004
Berry, P. M., Rounsevell, M. D. A., Harrison, P. A., and Audsley, E. (2006). Assessing the vulnerability of agricultural land use and species to climate change and the role of policy in facilitating adaptation. Environ. Sci. Policy 9, 189–204. doi:10.1016/j.envsci.2005.11.004
Bindi, M., and Olesen, J. (2011). The responses of agriculture in Europe to climate change. Reg. Environ. Change 11, 151–158. doi:10.1007/s10113-010-0173-x
Brklacich, M., Chazan, M., and Bohle, H-G. (2009). “Human security, vulnerability, and global environmental change,” in Global environmental change and human security. Editors R. A. Matthew, J. Barnett, B. McDonald, and K. L. O’Brien (Cambridge: MIT Press), 35–52.
Brugere, C., and Lingard, J. (2003). Irrigation deficits and farmers’ vulnerability in Southern India. Agric. Syst. 77 (1), 65–88. doi:10.1016/s0308-521x(02)00108-7
Bussey, M., Carter, R. W., Keys, N., Carter, J., Mangoyana, R., Matthews, J., et al. (2012). Framing adaptive capacity through a history–futures lens: Lessons from the south east queensland climate adaptation research initiative. Futures 44, 385–397. doi:10.1016/j.futures.2011.12.002
Carpenter, S. R. (2005). Eutrophication of aquatic ecosystems: Bistability and soil phosphorus. Proc. Natl. Acad. Sci. U. S. A. 102 (29), 10002–10005. doi:10.1073/pnas.0503959102
Chen, X., Zhang, Q., Peterson, M. N., and Song, C. (2019). Feedback effect of crop raiding in payments for ecosystem services. Ambio 48, 732–740. doi:10.1007/s13280-018-1105-0
Cinner, J. E., Fuentes, M., and Randriamahazo, H. (2009). Exploring social resilience in Madagascar’s marine protected areas. Ecol. Soc. 14, 41. doi:10.5751/es-02881-140141
Cinner, J. E., Huchery, C., Darling, E. S., Humphries, A. T., Graham, N. A. J., Hicks, C. C., et al. (2013). Evaluating social and ecological vulnerability of coral reef fisheries to climate change. PLoS One 8, e74321. doi:10.1371/journal.pone.0074321
Cinner, J. E., McClanahan, T. R., Graham, N. A. J., Daw, T. M., Maina, J., Stead, S. M., et al. (2012). Vulnerability of coastal communities to key impacts of climate change on coral reef fisheries. Glob. Environ. Change 22, 12–20. doi:10.1016/j.gloenvcha.2011.09.018
Copeland, S., Comes, T., Bach, S., Nagenborg, M., Schulte, Y., and Doorn, N. (2020). Measuring social resilience: Trade-offs, challenges and opportunities for indicator models in transforming societies. Int. J. Disaster Risk Reduct. 51, 101799. doi:10.1016/j.ijdrr.2020.101799
Cutter, S. L. (2016). The landscape of disaster resilience indicators in the USA. Nat. Hazards 80, 741–758. doi:10.1007/s11069-015-1993-2
FAO (2021). FAO Report on World Food Security and Nutrition in 2021, Available at: https://weibo.com/ttarticle/p/show?id,2021.10.12.
Fischer, G., Velthuizen, V., Shah, H. T., and Nachtergaele, M. M. (2002). Global agro-ecological assessment for agriculture in the 21st century: Methodology and results. Laxenburg, Autria: International Institute for Applied Systems Analysis.
Folke, C., Colding, J., and Berkes, F. (2003). “Synthesis: Building resilience and adaptive capacity in social-ecological systems,” in Navigating social-ecological systems: Building resilience for complexity and change. Editors F. Berkes, J. Colding, and C. Folke (Cambridge; New York: Cambridge University Press), 352–387.
Hagenlocher, M., Renaud, F. G., Haas, S., and Sebesvari, Z. (2018). Vulnerability and risk of deltaic social-ecological systems exposed to multiple hazards. Sci. total Environ. 631, 71–80. doi:10.1016/j.scitotenv.2018.03.013
Huang, Y. F., Li, F. Y., Bai, X. M., and Cui, S. (2012). Comparing vulnerability of coastal communities to land use change: Analytical framework and a case study in China. Environ. Sci. Policy 23 (23), 133–143. doi:10.1016/j.envsci.2012.06.017
IPCC (2001). Climate change 2001:impacts, adaptation, and vulnerability[R]. Cambridge: Cambridge University Press.
Jamir, C., Sharma, N., Sengupta, A., and Ravindranatrh, A. (2013). Farmers’ vulnerability to climate variability in Dimapur district of Nagaland, India. Reg. Environ. Change 13 (1), 153–164. doi:10.1007/s10113-012-0324-3
Jinno, K. (1995). Risk assessment of a water supply system during drought. Int. J. Water Resour. Dev. 11 (2), 185–204. doi:10.1080/07900629550042399
Kienberger, S., Blaschke, T., and Zaidi, R. Z. (2013). A framework for spatio-temporal scales and concepts from different disciplines: The ‘vulnerability cube. Nat. Hazards (Dordr). 68 (3), 1343–1369. doi:10.1007/s11069-012-0513-x
Kovács-Hostyánszki, A., Espíndola, A., Vanbergen, A. J., Settele, J., Kremen, C., and Dicks, L. V. (2017). Ecological intensification to mitigate impacts of conventional intensive land use on pollinators and pollination. Ecol. Lett. 20 (5), 673–689. doi:10.1111/ele.12762
Li, Q., and Zander, P. (2019). Resilience building of rural livelihoods in PES programmes: A case study in China’s loess hills. Ambio 49, 962–985. doi:10.1007/s13280-019-01236-4
Lazzari, N., Becerro, M. A., Sanabria-Fernandez, J. A., and Martin-Lopez, B. (2021). Assessing social-ecological vulnerability of coastal systems to fishing and tourism. Sci. Total Environ. 784, 147078. doi:10.1016/j.scitotenv.2021.147078
Lazzari, N., Martín-López, B., Sanabria-Fernandez, J. A., and Becerro, M. A. (2020). Alpha and beta diversity across coastal marine social-ecological systems: Implications for conservation. Ecol. Indic. 109, 105786. 10.1016/j. ecolind.2019.105786.
Liu, J., Dietz, T., Carpenter, S. R., Alberti, M., Folke, C., Moran, E., et al. (2007). Complexity of coupled human and natural systems. Science 317, 1513–1516. doi:10.1126/science.1144004
Lizhen, L., Yuanzeng, Z., Yanmei, Y., Chen, J., Mou, Y., et al. 2010, Regional ecosystem health assessment based on land use pattern: A case of study of zhoushan island. Acta Ecol. Sin., 30, 1, 0245–0252.
Lorenz, D. F. (2013). The diversity of resilience: Contributions from a social science perspective. Nat. Hazards 67, 7–24.
Marull, J., Pino, J., Mallarach, M., and Cordobilla, M. J. (2007). A land suitability index for strategic environmental assessment in metropolitan areas. Landsc. Urban Plan. 81 (3), 200–212. doi:10.1016/j.landurbplan.2006.11.005
Mumby, P. J., Wolff, N. H., Bozec, Y. M., Chollett, I., and Halloran, P. (2014). Operationalizing the resilience of coral reefs in an era of climate change. Conserv. Lett. 7 (3), 176–187. doi:10.1111/conl.12047
Neset, T. S., Wiréhn, L., Opach, T., Glaas, E., and Linnér, B. O. (2019). Evaluation of indicators for agricultural vulnerability to climate change: The case of Swedish agriculture. Ecol. Indic. 105, 571–580. doi:10.1016/j.ecolind.2018.05.042
O'Brien, K. L., and Leichenko, R. M. (2000). Double exposure: Assessing the impacts of climate change within the context of economic globalization. Glob. Environ. change 10 (3), 221–232. doi:10.1016/S0959-3780(00)00021-2
O’Brien, K. L., Leichenko, R., Kelkar, U., Venema, V., Aandahl, G., Tompkins, H., et al. (2004). Mapping vulnerability to multiple stressors: Climate change and globalization in India. Glob. Environ. Change 14, 303–313. doi:10.1016/j.gloenvcha.2004.01.001
Pereira, H. M., Navarro, L. M., and Martins, I. S. (2012). Global biodiversity change: The bad, the good, and the unknown. Annu. Rev. Environ. Resour. 37, 25–50. doi:10.1146/annurev-environ-042911-093511
Perry, R. I., Ommer, R. E., Barange, M., Jentoft, S., Neis, B., and Rashid Sumaila, U. (2011). Marine social–ecological responses to environmental change and the impacts of globalization. Fish. Fish. (Oxf). 12, 427–450. doi:10.1111/j.1467-2979.2010.00402.x
Peters, D. P. C., Bestelmeyer, B. T., and Turner, M. G. (2007). Cross-scale interactions and changing pattern-process relationships: Consequences for system dynamics. Ecosystems 10, 790–796. doi:10.1007/s10021-007-9055-6
Pham, B. T., Khosravi, K., and Prakash, I. (2017). Application and comparison of decision tree-based machine learning methods in landside susceptibility assessment at pauri garhwal area, uttarakhand, India. Environ. Process. 4 (3), 711–730. doi:10.1007/s40710-017-0248-5
Pulver, S., Ulibarri, N., Sobocinski, K. L., Alexander, S. M., Johnson, M. L., McCord, P. F., et al. (2018). Frontiers in socio-environmental research: Components, connections, scale, and context. Ecol. Soc. 23. doi:10.5751/es-10280-230323
Rocha, J. C., Peterson, G., Bodin, O., and Levin, S. (2018). Cascading regime shifts within and across scales. Science 362, 1379–1383. doi:10.1126/science.aat7850
Rockenbauch, T., and Sakdapolrak, P. (2017). Social networks and the resilience of rural communities in the global south: A critical review and conceptual reflections. Ecol. Soc. 22, art10. doi:10.5751/es-09009-220110
Rogers, A. D., Aburto-Oropeza, O., Appeltans, W., et al. (2020). Critical habitats and biodiversity: Inventory, thresholds and governance. Washington, DC: World Resources Institute.
Saja, A. M. A., Goonetilleke, A., Teo, M., and Ziyath, A. M. (2019). A critical review of social resilience assessment frameworks in disaster management. Int. J. Disaster Risk Reduct. 35, 101096. doi:10.1016/j.ijdrr.2019.101096
Salvati, L., Bajocco, S., Ceccarelli, T., Zitti, M., and Perini, L. (2011). Towards a process-based evaluation of land vulnerability to soil degradation in Italy. Ecol. Indic. 11 (5), 1216–1227. doi:10.1016/j.ecolind.2010.12.024
Siegel, K. J., Cabral, R. B., McHenry, J., Ojea, E., Owashi, B., and Lester, S. E. (2019). Sovereign states in the Caribbean have lower social-ecological vulnerability to coral bleaching than overseas territories. Proc. R. Soc. B 286, 20182365. doi:10.1098/rspb.2018.2365
Smit, B., and Wandel, J. (2006). Adaptation, adaptive capacity and vulnerability. Glob. Environ. Change 16, 282–292. doi:10.1016/j.gloenvcha.2006.03.008
Speranza, C. I., Wiesmann, U., and Rist, S. (2014). An indicator framework for assessing livelihood resilience in the context of social–ecological dynamics. Glob. Environ. Change 28, 109–119. doi:10.1016/j.gloenvcha.2014.06.005
Tebbotha, M. G. L., Conway, D., and Adger, W. N. (2019). Mobility endowment and entitlements mediate resilience in rural livelihood systems. Glob. Environ. Change 54, 172–183.
Thiault, L., Gelcich, S., Cinner, J. E., Lewin, S. T., Chlous, F., and Claudet, J. (2019). Generic and specific facets of vulnerability for analysing trade‐offs and synergies in natural resource management. People Nat. Hob., 573–589. doi:10.1002/pan3.10056
Thiault, L., Collin, A., Chlous, F., Gelcich, S., and Claudet, J. (2017). Combining participatory and socioeconomic approaches to map fishing effort in small-scale fisheries. PLoS One 12 (5), e0176862. doi:10.1371/journal.pone.0176862
Ting, L., Yuxiang, D., and Zhenhuan, L. (2020). A review of social-ecological system resilience: Mechanism, assessment and management. Sci. Total Environ. 723, 138113. doi:10.1016/j.scitotenv.2020.138113
Tuler, S., Agyeman, J., da Silva, P., Roth LoRosso, K., and Kay, R. (2008). Assessing vulnerabilities: Integrating information about driving forces that affect risks and resilience in fishing communities. Hum. Ecol. Rev. 15, 171–184.
Turner, B. L., Kasperson, R. E., Matson, P. A., Matson, P. A., Corell, R. W., Christensen, L., et al. (2003). A framework for vulnerability analysis in sustainability science. Proc. Natl. Acad. Sci. U. S. A. 100, 8074–8079. doi:10.1073/pnas.1231335100
Walker, B., Holling, C. S., Carpenter, S. R., and Kinzig, A. (2004). Resilience, adaptability and transformability in social–Ecological systems. Ecol. Soc. 9 (2), 5.
Walker, B., and Salt, D. (2006). Resilience thinking: Sustaining ecosystems and people in a changing world. Washington, D.C., USA: Island Press.
Wang, Y., Zhang, Q., Li, Q., Wang, J., Sannigrahi, S., Bilsborrow, R., et al. (2021). Role of social networks in building household livelihood resilience under payments for ecosystem services programs in a poor rural community in China. J. Rural Stud. 86 (8), 208–225. doi:10.1016/j.jrurstud.2021.05.017
Watts, M. J., and Bohle, H. G. (1993). The space of vulnerability: The causal structure of hunger and famine. Prog. Hum. Geogr. 17, 43–67. doi:10.1177/030913259301700103
Wilson, G. A., Schermer, M., and Stotten, R. (2018). The resilience and vulnerability of remote mountain communities: The case of Vent, Austrian Alps. Land Use Policy 71, 372–383. doi:10.1016/j.landusepol.2017.12.022
Wilson, S., Pearson, L. J., Kashima, Y., Lusher, D., and Pearson, C. (2013). Separating adaptive maintenance (resilience) and transformative capacity of social-ecological systems. Ecol. Soc. 18, art22. doi:10.5751/es-05100-180122
Wiréhn, L. (2018). Nordic agriculture under climate change: A systematic review of challenges, opportunities and adaptation strategies for crop production. Land Use Policy 77, 63–74. doi:10.1016/j.landusepol.2018.04.059
Wiréhn, L., Opach, T., and Neset, T. S. (2017). Assessing agricultural vulnerability to climate change in the Nordic countries–an interactive geovisualization approach. J. Environ. Plan. Manag. 60 (1), 115–134. doi:10.1080/09640568.2016.1143351
Xie, L., Li, Y., and Qian, F. (2014). Analysis on agricultural sensitivity and vulnerability to climate change and countermeasures. China Popul. Resour. Environ. 24 (5), 25–30.
Keywords: social-ecological system (SES), farmland system, vulnerability, exposure, sensitivity, adaptive capacity
Citation: Niu P, Jiang Y, Yang Y and Wang L (2022) The characteristics and influencing factors of change in farmland system vulnerability: A case study of Sanmenxia City, China. Front. Environ. Sci. 10:887570. doi: 10.3389/fenvs.2022.887570
Received: 16 March 2022; Accepted: 21 September 2022;
Published: 11 October 2022.
Edited by:
David Lopez-Carr, University of California, Santa Barbara, United StatesReviewed by:
Yongjun Yang, China University of Mining and Technology, ChinaJinman Wang, China University of Geosciences, China
Yang Xianguang, Henan Normal University, China
Copyright © 2022 Niu, Jiang, Yang and Wang. This is an open-access article distributed under the terms of the Creative Commons Attribution License (CC BY). The use, distribution or reproduction in other forums is permitted, provided the original author(s) and the copyright owner(s) are credited and that the original publication in this journal is cited, in accordance with accepted academic practice. No use, distribution or reproduction is permitted which does not comply with these terms.
*Correspondence: Yongfang Yang, eXlmbnBAaGVudS5lZHUuY24=