 Zhan Tian
 Ziwei Yu1
 Yifan Li
 Junguo Liu
94% of researchers rate our articles as excellent or good
Learn more about the work of our research integrity team to safeguard the quality of each article we publish.
Find out more
ORIGINAL RESEARCH article
Front. Environ. Sci., 22 June 2022
Sec. Water and Wastewater Management
Volume 10 - 2022 | https://doi.org/10.3389/fenvs.2022.887446
This article is part of the Research TopicNature-Based Solutions for Urban Water ManagementView all 11 articles
Climate change and rapid urbanization have made it difficult to predict the risk of pollution in cities under different types of rainfall. In this study, a data-driven approach to quantify the effects of rainfall characteristics on river pollution was proposed and applied in a case study of Shiyan River, Shenzhen, China. The results indicate that the most important factor affecting river pollution is the dry period followed by average rainfall intensity, maximum rainfall in 10 min, total amount of rainfall, and initial runoff intensity. In addition, an artificial neural network model was developed to predict the event mean concentration (EMC) of COD in the river based on the correlations between rainfall characteristics and EMC. Compared to under light rain (< 10 mm/day), the predicted EMC was five times lower under heavy rain (25–49.9 mm/day) and two times lower under moderate rain (10–24.9 mm/day). By converting the EMC to chemical oxygen demand in the river, the pollution load under non-point-source runoff was estimated to be 497.6 t/year (with an accuracy of 95.98%) in Shiyan River under typical rainfall characteristics. The results of this study can be used to guide urban rainwater utilization and engineering design in Shenzhen. The findings also provide insights for predicting the risk of rainfall-runoff pollution and developing related policies in other cities.
Rapid urbanization has adverse effects on the natural environment, especially in aquatic environments. Due to changes in the hydrological cycle and the high diversity of pollutants, urban rainfall-runoff pollution has become a major problem (Kammen and Sunter, 2016). Especially in the initial stage of rainfall, the river pollutant content is the highest in the entire runoff process, which is referred to as the first flush effect (Gnecco et al., 2005; Feng et al., 2017). Common contaminants of river mainly include suspended solids, nutrients and heavy metals which have a major effects on the water quality of urban rivers (Perera et al., 2019; Yang et al., 2021).
Rapid urbanization has increased the impervious areas in cities, thereby reducing rainwater infiltration and increasing the total amount of runoff into urban rivers and the pollution load of urban surface runoff (Chen et al., 2017; He et al., 2018). Li et al. (2021) found that human activity has contributed to long-term reductions in the total amount and frequency of weak precipitation and the significant increases in the total amount and frequency of heavy precipitation in China. Human activities such as land use and land cover change, the construction of dams and irrigation canals, and mining have altered urban river runoff (Adeyeri et al., 2020) and significantly affected the rainfall characteristics. Urban rainfall-runoff pollution has become the main cause of global urban water pollution (Wang et al., 2021). Thus, identifying the factors affecting this type of pollution is critically important for controlling urban river pollution.
To make timely predictions related to rainfall-runoff pollution with minimal data, researchers have begun to apply machine learning methods. These methods do not require a comprehensive understanding of the mechanism underlying the interactions between various parameters. These methods are also effective for simulating nonlinear and non-stationary hydrological environmental processes (Wang and Yao, 2013; Badrzadeh et al., 2015). Machine learning-based methods have shown advantages for the analysis of rainfall-runoff pollution, and with the development of data science, various machine learning methods have been explored and developed to predict rainfall-runoff pollution in urban rivers (Jeung et al., 2019). These methods including random forest (RF), gradient boosting decision tree (GBDT), and extreme gradient boosting (XGBoost) methods, which have been applied to analyze the relationships between rainfall characteristics and runoff pollution (Wu et al., 2014; Wang et al., 2015). RF algorithms have been used to rank the importance of multiple rainfall characteristics affecting the initial scouring effect of river runoff, revealing the following six most important characteristics: total rainfall amount; maximum rainfall intensity in 5 min; rainfall duration; total amount of runoff; peak runoff; and average rainfall intensity (Alias et al., 2014; Perera et al., 2019). By using the boosting method, GBDT will integrate multiple decision trees (DT) for analysis, which has shown a good prediction performances (Liang et al., 2020). Huan et al. (2020) applied a GBDT method to select characteristic factors with strong effects on dissolved oxygen and used these factors as input data to reduce the time needed for calculations. Joslyn (2018) evaluated the performance of XGBoost in predicting nine water quality factors (each factor was separately predicted using the other eight factors) and obtained success rates ranging from 80% to 90%.
Rainfall characteristics can also significantly affect the concentrations of river pollutants (Feng et al., 2015; Zhang et al., 2021), and rainfall duration and rainfall intensity are two of the most important factors affecting hydrological processes (Ran et al., 2012). Rainfall-runoff pollution is also affected by other rainfall characteristics such as the total amount of rainfall, which can affect the scouring effect of runoff (Liu et al., 2014), and the dry period (Zhang, 2011; Pang et al., 2012). Jeung et al. (2019) assessed the effects of rainfall characteristics on water quality parameters in urban rivers and found that different water quality parameters were affected by different rainfall characteristics; for example, biochemical oxygen demand and chemical oxygen demand (COD) were closely related to rainfall intensity, whereas total organic carbon and total phosphorus were strongly affected by the dry period. Gnecco et al. (2005) analyzed the event mean concentrations (EMCs) of various pollutants in urban rivers and found a strong correlation between maximum rainfall intensity and EMC.
Although several previous studies have analyzed rainfall characteristics and their qualitative effects on rainfall-runoff pollution, few studies have quantitatively analyzed the effects of rainfall characteristics on its pollution. Neural network models including artificial neural network (ANN), convolutional neural network, and back-propagation neural network models can consider multiple rainfall features together to predict rainfall-runoff pollution (Wu et al., 2014; Wang et al., 2015; Chau, 2017; Fotovatikhah et al., 2018). Some researchers have used neural network models to generalize the complex relationships between rainfall characteristics and water quality parameters to enhance the accuracy of rainfall-runoff simulation and prediction (Fernandes et al., 2020). For example, ANN models can be used to accurately determine whether the surface water quality meets the criteria set by national regulations or quantify the characteristics of water bodies (Palani et al., 2008; Shi et al., 2018). Using rainfall characteristics such as rainfall duration and confluence area as inputs and EMC as a training target, a back-propagation neural network model showed high accuracy for evaluating the total amount of pollutants in rainwater runoff (Tian, 2016). Ye et al. (2020) summarized the characteristics of neural network models used in environmental pollution research and found that ANN models can significantly improve the efficiency of pollutant prediction in rivers.
The objectives of this study were to analyze the CODs of Shiyan River and Shiyan Reservoir and explore the relationships between COD and rainfall characteristics. To achieve these objectives, we: 1) ranked the importance of different rainfall characteristics in terms of their effects on rainfall-runoff pollution using various integrated learning methods; 2) quantified the relationships between rainfall characteristics and runoff pollution in Shiyan River using an ANN model; and 3) estimated the non-point-source pollution load based on the typical EMC in the Shiyan River. As verified in this paper, the data-driven method presented herein can quickly predict the COD of the river. The findings provide a reference for water quality analysis in other fields.
Over the past 40 years, precipitation and extreme precipitation in the western urban area of Shenzhen have increased. Changes in the underlying surface and rainfall characteristics have also affected the temporal and spatial distributions of non-point-source pollution. In this study, Shiyan River in Shenzhen, China is taken as a research case, as can be seen in Figure 1. Shiyan River is located in Shiyan Street, Bao’an District and is a first-level tributary in the Maozhou River Basin. The total length of Shiyan River is 10.44 km, and the catchment area of the basin is 27.05 km2. The Shiyan River eventually merges into the Shiyan Reservoir, which is one of the four major reservoirs in Shenzhen and one of the largest sources of drinking water in Bao’an District. With the rapid economic development of Bao’an District, Shiyan River and Shiyan Reservoir will play increasingly important roles in water supply.
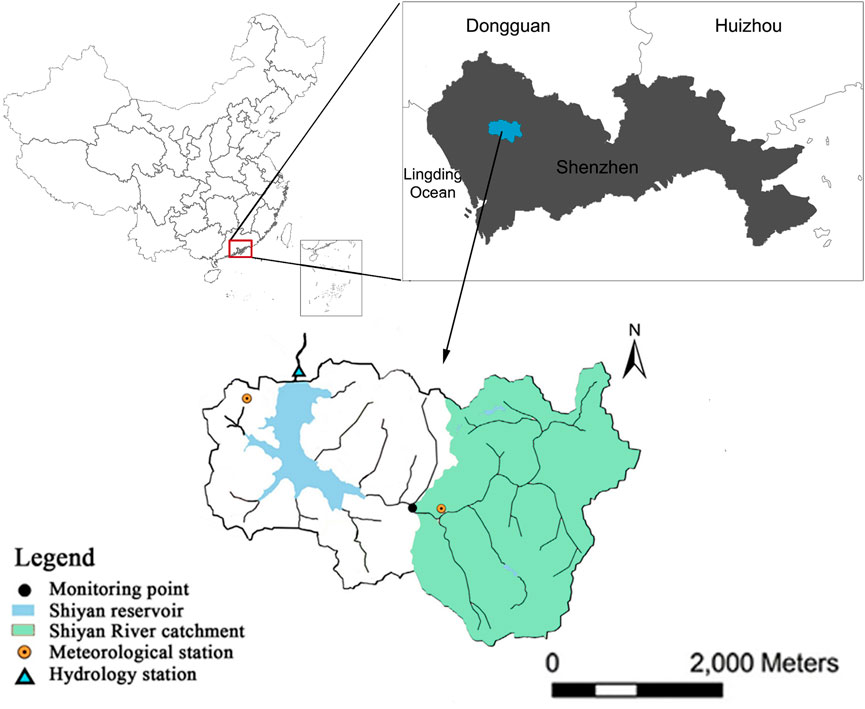
FIGURE 1. Map of Shiyan River, Shenzhen, China.
The following data were used in this study. First, the hourly/daily/annual river discharge (m3/s) and COD data (mg/L) for Shiyan River from 2009 to 2012 were obtained from Qin et al. (2013). We also used data from Qin et al. (2013) to select the most influential rainfall characteristics for EMC and build the ANN model based on rainfall characteristics to predict the EMC value. Rainfall-runoff data (mm/min) for 2013–2018 were obtained from Li (2020).
Due to the uncertainty of rainfall events, there is currently no uniform and clear criteria for classifying rainfall events. Based on recent research considering the effects of rainfall confluence time and rainfall duration, 180 min was used as the minimum time interval between two rainfall events, and the cumulative rainfall of each event had to be greater than 3 mm (Huang et al., 2021). According to the amount of rainfall in 24 h, all rainfall events were divided into six categories: light rain (< 10 mm); moderate rain (10–24.9 mm); heavy rain (25–49.9 mm); torrential rain (50–99.9 mm); rainstorm (100–249.9 mm); and extraordinary rainstorm (> 250 mm). Based on the above definitions of rainfall event and rainfall type, we obtained the typical rainfall characteristics (total amount of rainfall, rainfall duration, maximum rainfall per minute, maximum rainfall in 10 min, rainfall intensity, and dry period) for the study area and used them in the subsequent verification of the pollution load of Shiyan River (Table 1).
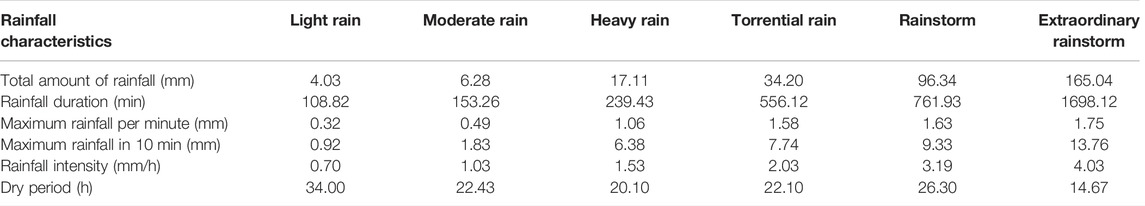
TABLE 1. Typical rainfall characteristics under different rainfall types (2013–2018) (Li, 2020).
As shown in Figure 2, we first processed the minute-level rainfall data (2013–2018) into different rainfall characteristics (total amount of rainfall, rainfall duration, maximum rainfall per minute, maximum rainfall in 10 min, rainfall intensity, and dry period). Subsequently, we identified the rainfall characteristics that most strongly affect EMC using mathematical statistical methods and three integrated learning methods (RF, GBDT, and XGBoost). Next, we developed an ANN model to predict the EMC values of Shiyan River by inputting typical rainfall characteristics under different rainfall types in terms of rainfall intensity per 24 h (namely, light rain, moderate rain, heavy rain, and torrential rain). Finally, we calculated and verified the runoff pollution load of the Shiyan Reservoir using the predicted EMC value.
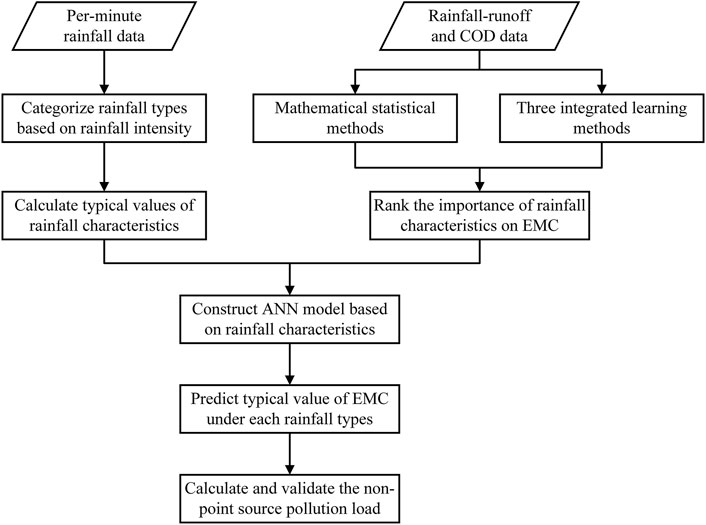
FIGURE 2. Research framework for this study.
The integrated learning methods mainly completes research tasks by building and combining multiple different approaches, which can have a high accuracy rate. In this study, three widely used integrated learning algorithms (RF, GBDT, and XGBoost) were used to analyze the importance of various rainfall characteristics. RF is one of the most popular algorithms for solving classification and regression problems in recent years, with extremely high accuracy. GBDT can process a wide range of data types, and tuning parameter is relatively easy. XGBoost is efficient and flexible, which prevent overfitting and reduce model complexity.
RF is a method for accurately classifying large amounts of data by creating multiple decision trees. The RF algorithm consists of a combination of tree classifiers where each classifier is generated using a random vector sampled independently from the input vector, and each tree casts a unit vote for the most popular class to classify an input vector. The decision trees use the CART algorithm to select variables based on the splitting criteria of the root node and make judgments based on the characteristic evaluation standard; the root node recursively generates child nodes through the internal node. The internal nodes represent the judgments of the characteristics, and each child node represents a regression result. Random attributes are introduced into the training process of decision trees, and the results are determined by the predicted mean values of multiple decision trees. Averaging can alleviate the problem of high variance and high deviation by finding a natural balance between the two extremes. Because RFs are often used as black-box models, they can generate reasonable predictions for data without configuration.
GBDT is a characteristics selection method with high interpretability. GBDT has high nonlinear processing ability when considering the interactions of multiple groups of characteristics (Huan et al., 2020). GBDT is a powerful machine learning tool consisting of three parts: regression decision tree, gradient boosting, and shrinkage. GBDT is based on the linear combination of basic functions; multiple rounds of iteration are performed, and each round of iteration produces a weak classifier (regression decision tree). Each classifier is trained based on the gradient of the previous classifiers, and the accuracy of the result is continuously improved by reducing the deviation. The algorithm aims to obtain a set of decision rules using the original characteristics as input to create a new decision tree (He et al., 2014).
XGBoost is an integrated machine learning algorithm based on decision trees that uses a gradient boosting framework. XGBoost has been widely used for regression, classification, and other applications. The core idea of XGBoost is to increase the number of decision trees by continuously splitting characteristics. Every time a tree is added, a new function f(x) is learned to fit the residual of the last prediction. When the training is completed, resulting in k trees, the score of a sample is predicted based on the characteristics of this sample, and the score corresponding to each tree is added to the predicted value of the sample. This method uses normalization in the objective function to prevent overfitting and reduce the complexity of the model.
ANN models are networks of parallel distributed information processing systems that link input vectors to output vectors. They are composed of many information processing elements called neurons or nodes (Bisht et al., 2013). ANNs are mainly composed of three parts: the input layer, hidden layer, and output layer. The input layer primarily provides input data for the ANN model, and the hidden layer performs various transformations of the data (fitting the data by adjusting the function type and the number of neurons in the hidden layer), thus enhancing the network’s ability to simulate complex functions. The output layer is considered to be a summary of the parallel calculation results performed by the hidden layer. The result of each neuron is the input of neurons existing in the next layer of the network, and the result of the output layer can be compared with the observed result (Haghiabi et al., 2018). Because the model is relatively simple and convenient for practical applications and prediction, it is a powerful tool for modeling many nonlinear hydrological processes; for example, ANN models have proven effective for use in the fields of water quality analysis and prediction.
Rainfall-runoff pollution events are characterized by uncertainty, and river runoff pollution is affected by factors such as the rainfall characteristics and underlying surface types. Instantaneous pollution concentrations do not accurately capture the characteristics of runoff pollution (Lee et al., 2011), it is necessary to find a variable to describe the pollution concentration in each rainfall-runoff pollution event. Therefore, in each event, COD was used to characterize water quality, and the degree of rainfall-runoff pollution was analyzed based on the event mean concentration (EMC) (Kim et al., 2007), which was calculated as the following equation (EMC formula):
Where: EMC = event mean concentration, mg/L; M = amount of pollutant, mg/L; V = runoff volume, m3; T = rainfall duration, s; Ct = concentration of pollutant over time, mg/L; and Qt = flow rate over time, m3/s.
Due to the randomness of surface runoff discharge, the annual pollution load is usually to estimate the pollution load concentration of urban surface runoff, that is, the total amount of pollutants discharged from surface runoff caused by multiple rainfall events in a year (Li et al., 2010). The annual non-point-source runoff pollution load of Shiyan River was estimated based on the EMC values under typical rainfall characteristics. This estimation method has been widely used both within and outside of China (Wang, 2015). The annual runoff pollution load based on the EMC of the site was calculated using the following formula:
where: Ly = annual pollution load, t; CF = proportion of rainfall events that produce runoff, usually taken when data are lacking, 0.9 was the empirical coefficient (Wang, 2015); Ψ = runoff coefficient; A = catchment area, km2; P = average annual rainfall, mm; and C = EMC, mg/L.
In this study, Shiyan River and Shiyan Reservoir were taken as typical research areas to explore the correlation between rainfall characteristics and runoff pollution. COD was used as a typical metric for pollution analysis. For convenience, the EMC formula was used to convert COD to EMC. Due to the low frequency of rainstorms and extraordinary rainstorms (0.03 and 0.01, respectively), these rainfall types were combined with torrential rainfall events in this analysis.
Figure 3 shows the relationships between rainfall type and EMC based on rainfall data from 26 rainfall events (2009–2012). The vertical axis of the box plot represents the degree of data dispersion, and the center represents the typical distribution probability of EMC. Therefore, the typical value of EMC represents the location corresponding to the maximum distribution probability. In general, the typical EMC value is largest during light rain; the EMC during light rain (based on the median value) was almost four times higher than that during moderate rain, which was associated with the lowest EMC. Meanwhile, the EMC values corresponding to heavy rain and torrential rain were much lower than that for light rain.
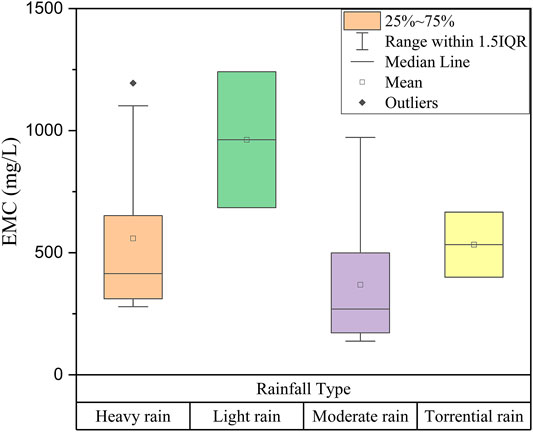
FIGURE 3. EMC values under different rainfall types.
Evaluating the effect of rainfall type on EMC requires analyzing the effects of different rainfall characteristics on EMC. In the case of light rain, the initial stage of rainfall will wash urban surface pollutants into the river, increasing the EMC. During moderate rain, rainfall runoff gradually increases, and the pollutants washed into the river channel change little, which reduces the EMC to a large degree. For heavy rain and torrential rain, the erosion of the river channel may wash pollutants from the deep layers of the ground into the river channel, resulting in a gradual increase in EMC.
Principal component analysis (PCA) was used to identify the correlations between rainfall characteristics and EMC. Figure 4 shows the results of the PCA of rainfall characteristics and EMC. PC1 and PC2 explained 42% and 20.5% of the total variance of the data, respectively. The proportion contributed by each rainfall characteristic to PC1 and PC2 can be obtained from the directions and lengths of the blue arrows in Figure 4. Most of the scattered points in Figure 4 are within the 95% confidence interval (shown by the red circle), which indicates that there were no obvious extreme values. A correlation matrix was used to calculate the correlation coefficients between EMC and the rainfall characteristics (Figure 5). In Figure 5, red and blue represent positive and negative correlations, respectively, and the intensity of the color indicates the strength of the correlation. Among the rainfall characteristics, dry period showed the strongest correlation with EMC (correlation coefficient = 0.5). Average rainfall intensity was negatively correlated with EMC (correlation coefficient = −0.13). The initial, average, and maximum runoff intensities were highly correlated. If the angle between the two rainfall eigenvalues in Figure 4 was less than 30°, and the correlation coefficient was greater than 0.8 in Figure 5, we considered the correlation between two variables to be significant. Using these criteria, no significant correlations were observed between EMC and any single rainfall characteristic. Thus, it was necessary further analyze the data to reveal the relationships between multiple rainfall characteristics and EMC.
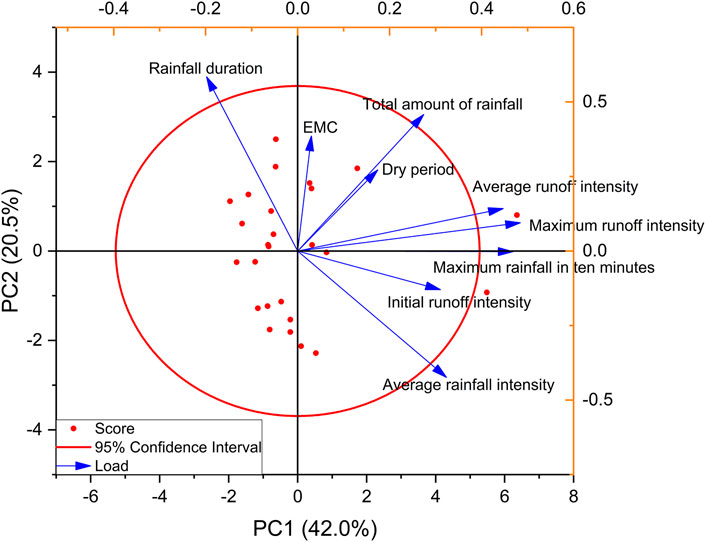
FIGURE 4. PCA results between rainfall characteristics and EMC. PC1 and PC2 represent 42% and 20.5% of the total variance of the data, respectively. Red dots represent the scores of rainfall events. The red circle represents the 95% confidence interval. The blue arrows represent the proportions contributed by rainfall characteristics to PC1 and PC2.
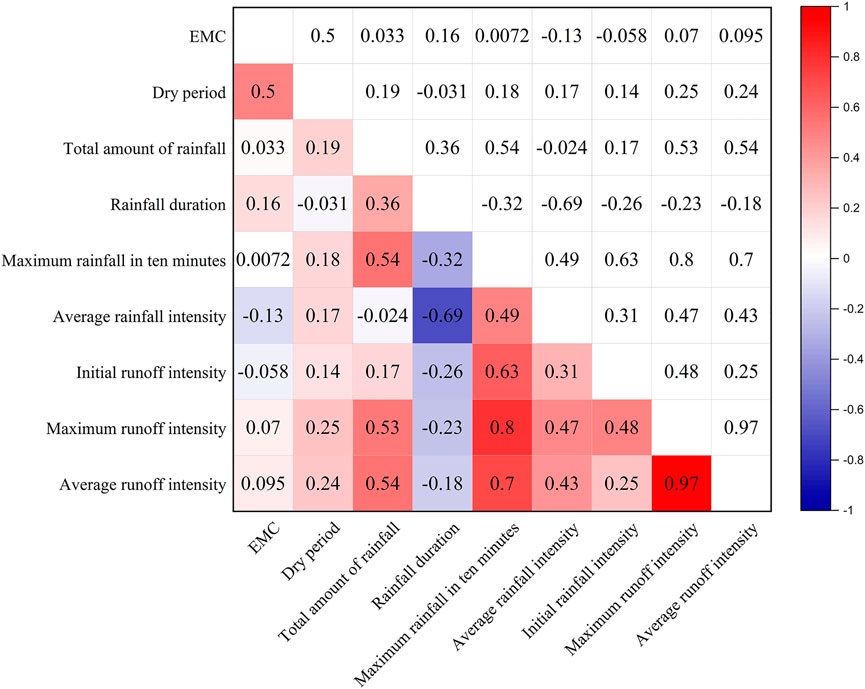
FIGURE 5. Correlations between rainfall characteristics and EMC. Red and blue squares represent positive and negative correlations between two characteristics, respectively. Deeper color indicates a stronger correlation.
Using six rainfall characteristics (dry period, total amount of rainfall, average rainfall intensity, rainfall duration, maximum rainfall intensity in 10 min, and initial runoff intensity), we performed multiple linear regression fitting for EMC. Figure 6 shows the relationships between EMC and various rainfall characteristics. Each black dot represents the EMC value of a rainfall event, and each figure contains 26 rainfall events. By constructing a linear fitting curve, we can observe the effects of different rainfall characteristics on EMC. In Figure 6, the dark orange range represents the 95% confidence interval between different rainfall characteristics and EMC, while the light orange range represents the 95% prediction interval between them. A positive correlation was observed between the dry period and EMC, while EMC gradually decreased as the initial runoff intensity increased. As the total amount of rainfall increased, EMC first decreased and then increased; a similar trend in EMC was observed for the maximum rainfall intensity. Thus, EMC showed different relationships with the various rainfall characteristics.
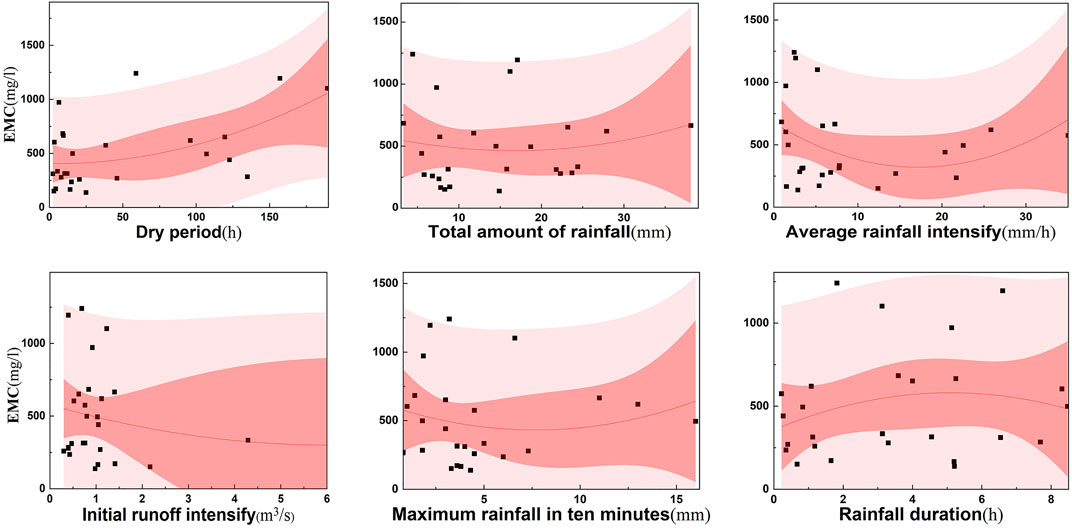
FIGURE 6. Relationship between EMC and rainfall characteristics. Each black dot represents the EMC value of a rainfall event. The dark orange range represents the 95% confidence interval, while the light orange range represents the 95% prediction interval.
Three widely used machine learning algorithms (RF, GBDT, and XGBoost) were used to analyze the relative importance of rainfall characteristics affecting runoff pollution (Figure 7). The most important rainfall characteristic affecting EMC was the dry period followed by the average rainfall intensity, the maximum rainfall in 10 min, the total amount of rainfall, and the initial runoff intensity. The high importance of the dry period may be related to the accumulation of surface pollutants during dry periods. During rainfall after an extended dry period, large quantities of pollutants are washed into the river, causing the EMC in the river to increase. However, due to the large differences in rainfall duration observed in the data, the effect of rainfall duration on EMC was relatively weak. The risk of runoff pollution was quantified by selecting the rainfall characteristics with the strongest effects on EMC based on the above analysis.
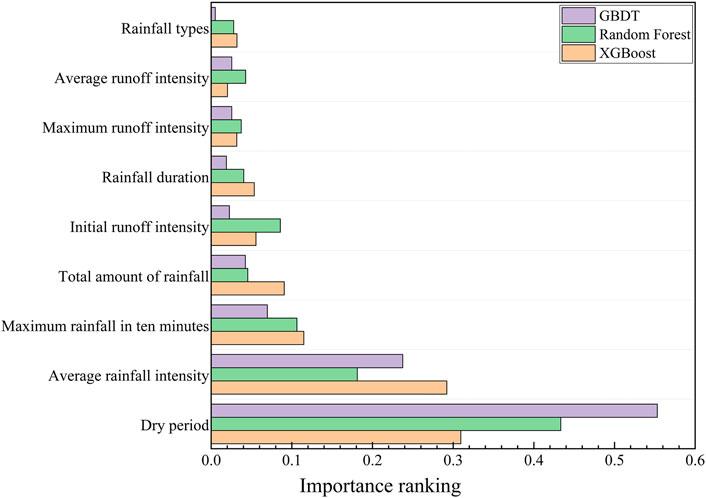
FIGURE 7. Importance rankings of different rainfall characteristics in terms of their effect on EMC based on GBDT, RF, and XGBoost algorithms.
Analyzing the input data improves the interpretability of the input data for neural network models. We established a model to predict runoff pollution from rainfall characteristics based on the relative importance of different rainfall characteristics and the availability of actual forecast data. The model considered the five rainfall characteristics with the strongest effects on EMC (i.e., dry period, average rainfall intensity, maximum rainfall in 10 min, total amount of rainfall, and initial runoff intensity), and the corresponding EMC values were used as the training targets. A total of 70% of the original data was used to train the ANN model, while the remaining 30% of the original data was used to verify the ANN model.
Figure 8 shows the training performance of the ANN model. The model training performance was 0.976, the test performance was 0.989, and the verification performance was 0.883. It also can be found that most of these scattered points are clustered near the fitted line from Figure 8, which show that the response results of this model are good; thus, the model can be used to predict EMC. The frequencies of rainstorms and extraordinary rainstorms were extremely low; thus, these rainfall types were ignored in the analysis of runoff pollution. Therefore, the typical EMC values for each rainfall characteristic under the other four rainfall types were used to predict EMC.

FIGURE 8. Plot showing the ANN training performance.
Under typical rainfall characteristics, the predicted EMC value was highest under the light rain scenario (2612.20 mg/L), and this EMC was approximately two times the predicted EMC under moderate rain (Table 2). The EMC prediction values for heavy rain and torrential rain were almost the same (both were one-fifth of the predicted EMC value for light rain). This may be explained by the fact that the dry period under the light rain scenario was typically longer than that under other rain types; thus, the dilution effect of pollutants washing into the river channel during light rain was weak. The dilution effect of heavy and moderate rain was more pronounced; under the torrential rain scenario, the predicted EMC value increased slowly because of the stronger effects of rainfall duration and runoff area. Rainfall events following long dry periods and light rain events require additional attention, and measures should be enacted in a timely manner to prevent water pollution.
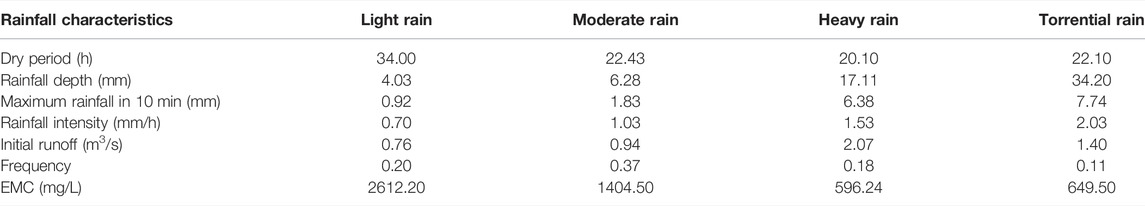
TABLE 2. Effects of typical rainfall characteristics on EMC.
The annual pollution load of non-point-source runoff for Shiyan River was estimated based on the predicted EMC values under typical rainfall characteristics (Table 1). EMC was used to approximate the annual runoff pollution load. Given that the traditional method of EMC value selection is relatively random, the predicted EMC values under typical rainfall events should be used. Hence, the estimation of rainfall-runoff pollution load considered the predicted values of EMC under typical rainfall events along with the probabilities of different rainfall patterns. The proportion of runoff events was 0.9, and the multi-year runoff depth of Shiyan River was 860 mm (average runoff depth is the product of the runoff coefficient and annual average rainfall). The EMC under different rainfall pattern was predicted based on the typical rainfall characteristics of the model, then the actual EMC value of this river can be obtained by weighted average of the probability values of different rainfall pattern, which was 1460 mg/L. Thus, according to the conversion of Eq. 2, the annual non-point-source COD pollution load was calculated to be 497.6 t. The annual non-point-source pollution load of COD in the built-up area of Shiyan Reservoir was previously reported to be 477 t (Yang et al., 2013), indicating an estimation accuracy for our model of 95.98%.
Integrated learning methods were used to analyze the relationships between rainfall characteristics and EMC for Shiyan River. Rainfall characteristics were then used to predict the water quality by constructing an ANN model. The main findings are summarized below.
PCA of the rainfall characteristics revealed no significant correlations between rainfall characteristics. A positive correlation was observed between rainfall dry period and EMC, while EMC was negatively correlated with initial runoff intensity. Using mathematical statistical analysis and a variety of machine learning algorithms, we qualitatively described and ranked the effects of different rainfall characteristics on EMC. Among all rainfall characteristics, the dry period was the most important factor influencing EMC. This can be attributed to the build-up of surface pollutants as the dry period becomes longer. When rainfall occurs after a long dry period, large quantities of pollutants are washed into the river, causing EMC to increase. After dry period, the next most important rainfall characteristics were average rainfall intensity, maximum rainfall in 10 min, total amount of rainfall, and initial runoff intensity.
A model to predict EMC based on rainfall characteristics was constructed using the above five most influential rainfall characteristics as inputs, which greatly improved the interpretability of the neural network and the accuracy of the ANN model. The model training performance was 0.976, the test performance was 0.989, and the verification performance was 0.883. The prediction results under typical rainfall characteristics revealed that the runoff pollution caused by light rain is approximately two times that under moderate rain and five times that under heavy rain. Based on the predicted EMC values under typical rainfall characteristics, the annual non-point-source runoff pollution load of Shiyan River was estimated to be 497.6 t. The accuracy of the estimation method was 95.98%, indicating the robustness of the model.
We acknowledge that there are several limitations of this study. The relatively short time scale of the high-precision rainfall data in Shenzhen precludes a more in-depth study of future rainfall characteristics and trends under the influence of climate change. Because of the difficulty in monitoring rainfall-runoff pollution, the total number of samples used in this study was only 26 rainfall events. In order to prove the credibility of the results, we use RF and XGBoost methods to study this data. As can be seen in Figure 9, the simulation results of these two methods are good. The values of the coefficients of determination (r2) obtained by RF and XGBoost methods are 0.879 and 0.914, which are similar to the results we predicted by ANN model (0.9). These results also prove that our findings are still reliable. Of course, subsequent studies should collect data over a longer time scale and consider the effects of land use and other factors on water quality/runoff pollution. The focus of this study was the relationships between rainfall characteristics and runoff pollution. Machine learning models can also be used to integrate rainfall and runoff data in future research.
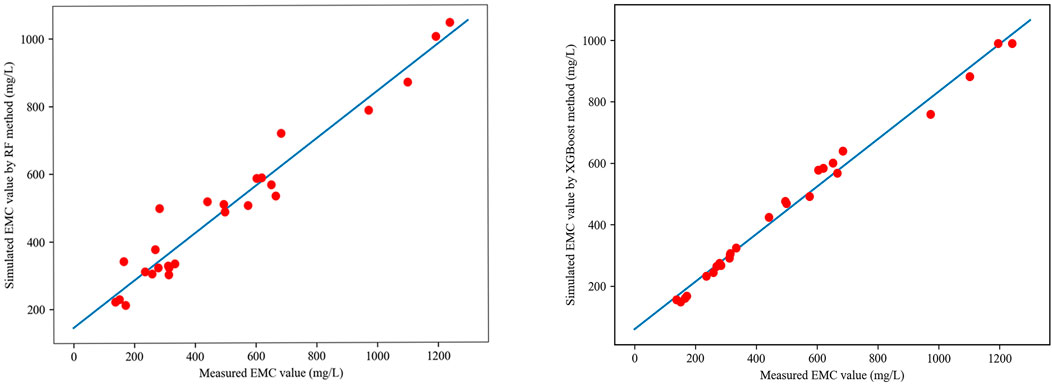
FIGURE 9. Plot showing the training performance by RF and XGBoost.
The results of this study have implications for the utilization of urban rainwater and resources, engineering design, predicting rainfall-runoff pollution risk, and policy development.
The raw data supporting the conclusions of this article will be made available by the authors, without undue reservation.
ZT: Conceptualization, Discussion, Supervision, Writing (review and editing); ZY: Data curation, Planning, Writing (original draft); YL: Methodology, Data curation, Discussion; QK: Discussion, Writing (review and editing); JL: Conceptualization, Discussion, Supervision, Writing (review and editing); HL: Data provision, Discussion; YT: Data provision, Discussion. All authors read and approved the final manuscript.
This study was supported by the Science, Technology and Innovation Commision of Shenzhen Municipality (JCYJ20210324104004013). It was also supported by the National Key R&D Program of China (No. 2018YFE0206200).
Author YT was employed by the company PowerChina Huadong Engineering Corporation Limited.
The remaining authors declare that the research was conducted in the absence of any commercial or financial relationships that could be construed as a potential conflict of interest.
All claims expressed in this article are solely those of the authors and do not necessarily represent those of their affiliated organizations, or those of the publisher, the editors and the reviewers. Any product that may be evaluated in this article, or claim that may be made by its manufacturer, is not guaranteed or endorsed by the publisher.
We acknowledge Aifang Chen, Wenfang Cao and Yanlong Guan of the iTOWER group for discussion and Pengfei Wang of the Southern University of Science and Technology for modifying graphs. We also acknowledge Xingxing Huang of the Shanghai Institute of Technology for his help.
Adeyeri, O. E., Laux, P., Lawin, A. E., and Arnault, J. (2020). Assessing the Impact of Human Activities and Rainfall Variability on the River Discharge of Komadugu-Yobe Basin, Lake Chad Area. Environ. Earth Sci. 79 (6), 1–12. doi:10.1007/s12665-020-8875-y
Alias, N., Liu, A., Goonetilleke, A., and Egodawatta, P. (2014). Time as the Critical Factor in the Investigation of the Relationship between Pollutant Wash-Off and Rainfall Characteristics. Ecol. Eng. 64, 301–305. doi:10.1016/j.ecoleng.2014.01.008
Badrzadeh, H., Sarukkalige, R., and Jayawardena, A. W. (2015). Hourly Runoff Forecasting for Flood Risk Management: Application of Various Computational Intelligence Models. J. Hydrology 529, 1633–1643. doi:10.1016/j.jhydrol.2015.07.057
Bisht, D., Jain, S., and Raju, M. M. (2013). Prediction of Water Table Eevation Fluctuation through Fuzzy Logic & Artificial Neural Networks. Int. J. Adv. Sci. Technol. 51, 107–120.
Chau, K.-w. (2017). Use of Meta-Heuristic Techniques in Rainfall-Runoff Modelling. Water 9 (3), 186. doi:10.3390/w9030186
Chen, J., Theller, L., Gitau, M. W., Engel, B. A., and Harbor, J. M. (2017). Urbanization Impacts on Surface Runoff of the Contiguous United States. J. Environ. Manag. 187, 470–481. doi:10.1016/j.jenvman.2016.11.017
Feng, C., Mi, N., Wang, X., Cai, Z., and Di, W. (2015). Analysis of Road Runoff Pollution in Northern City Based on the Typical Rainfall. Ecol. Environ. Sci. 24 (3), 418–426. doi:10.16258/j.cnki.1674-5906.2015.03.008
Feng, Z., Cao, M., Mingming, C., Fan, K., Liu, Z., Muhua, F., et al. (2017). Analysis of Pollution Characteristics and First Flush Effect in Rainfall Runoff in Separate Storm Sewer System in Upstream of Tangxi River,Chaohu Catchment. Hupo Kexue/Journal Lake Sci. 29 (2), 285–296. doi:10.18307/2017.0204
Fernandes, A., Chaves, H., Lima, R., Neves, J., and Vicente, H. (2020). Draw on Artificial Neural Networks to Assess and Predict Water Quality. IOP Conf. Ser. Earth Environ. Sci. 612 (1), 012028. doi:10.1088/1755-1315/612/1/012028
Fotovatikhah, F., Herrera, M., Shamshirband, S., Chau, K.-w., Faizollahzadeh Ardabili, S., and Piran, M. J. (2018). Survey of Computational Intelligence as Basis to Big Flood Management: Challenges, Research Directions and Future Work. Eng. Appl. Comput. Fluid Mech. 12 (1), 411–437. doi:10.1080/19942060.2018.1448896
Gnecco, I., Berretta, C., Lanza, L. G., and La Barbera, P. (2005). Storm Water Pollution in the Urban Environment of Genoa, Italy. Atmos. Res. 77 (1–4), 60–73. doi:10.1016/j.atmosres.2004.10.017
Haghiabi, A. H., Nasrolahi, A. H., and Parsaie, A. (2018). Water Quality Prediction Using Machine Learning Methods. Water Qual. Res. J. 53 (1), 3–13. doi:10.2166/wqrj.2018.025
He, M., Zhang, J., Chen, C., Qi, X., and Chen, Q. (2018). Analysis of the Temporal and Spatial Characteristics of Rainfall-Runoff Pollution in Dianbei Basin of Shanghai. Acta Sci. Circumstantiae 38 (2), 536–545. doi:10.13671/j.hjkxxb.2017.0338
He, X., Bowers, S., Candela, J. Q., Pan, J., Jin, O., Xu, T., et al. (2014). “Practical Lessons from Predicting Clicks on Ads at Facebook,” in Proceedings of the Eighth International Workshop on Data Mining for Online Advertising (ADKDD’14), Menlo Park, CA, August 24, 2014 (ADKDD’14), 1–9. doi:10.1145/2648584.2648589
Huan, J., Li, H., Li, M., and Chen, B. (2020). Prediction of Dissolved Oxygen in Aquaculture Based on Gradient Boosting Decision Tree and Long Short-Term Memory Network: A Study of Chang Zhou Fishery Demonstration Base, China. Comput. Electron. Agric. 175, 105530. doi:10.1016/j.compag.2020.105530
Huang, X., Li, Y., Tian, Z., Ye, Q., Ke, Q., Fan, D., et al. (2021). Evaluation of Short-Term Streamflow Prediction Methods in Urban River Basins. Phys. Chem. Earth, Parts A/B/C 123, 103027. doi:10.1016/j.pce.2021.103027
Jeung, M., Baek, S., Beom, J., Cho, K. H., Her, Y., and Yoon, K. (2019). Evaluation of Random Forest and Regression Tree Methods for Estimation of Mass First Flush Ratio in Urban Catchments. J. Hydrology 575, 1099–1110. doi:10.1016/j.jhydrol.2019.05.079
Joslyn, K. (2018). Water Quality Factor Prediction Using Supervised Machine Learning Citation Details. REU Final Report. AvaliableAt: https://archives.pdx.edu/ds/psu/26231 (Accessed November 20, 2021).
Kammen, D. M., and Sunter, D. A. (2016). City-integrated Renewable Energy for Urban Sustainability. Science 352 (6288), 922–928. doi:10.1126/science.aad9302
Kim, G., Chung, S., and Lee, C. (2007). Water Quality of Runoff from Agricultural-Forestry Watersheds in the Geum River Basin, Korea. Environ. Monit. Assess. 134 (1–3), 441–452. doi:10.1007/s10661-007-9635-0
Lee, J. Y., Kim, H., Kim, Y., and Han, M. Y. (2011). Characteristics of the Event Mean Concentration (EMC) from Rainfall Runoff on an Urban Highway. Environ. Pollut. 159 (4), 884–888. doi:10.1016/j.envpol.2010.12.022
Li, J., Li, Y., and Li, H. (2010). Study on the Calculation Method for Urban Surface Runoff Pollution Load. J. Water Res. Water Eng. 21 (2), 5–13.
Li, W., Chen, Y., and Chen, W. (2021). The Emergence of Anthropogenic Signal in Mean and Extreme Precipitation Trend over China by Using Two Large Ensembles. Environ. Res. Lett. 16 (1), 014052. doi:10.1088/1748-9326/abd26d
Li, Y. (2020). Analysis of Rainfall Characteristics and Their Influence on Runoff and Water Quality in Maozhou River. Master’s Thesis. Harbin (China). Harbin Institute of Technology.
Liang, W., Luo, S., Zhao, G., and Wu, H. (2020). Predicting Hard Rock Pillar Stability Using GBDT, XGBoost, and LightGBM Algorithms. Mathematics 8 (5), 765. doi:10.3390/math8050765
Liu, A., Guan, Y., and Liu, L. (2014). Impact of Catchment and Rainfall Characteristics on Urban Runoff Quality. J. Tsinghua Univ (Sci Technol) 54 (7), 846–852. doi:10.16511/j.cnki.qhdxxb.2014.07.004
Palani, S., Liong, S.-Y., and Tkalich, P. (2008). An ANN Application for Water Quality Forecasting. Mar. Pollut. Bull. 56 (9), 1586–1597. doi:10.1016/j.marpolbul.2008.05.021
Pang, C., Wu, S., Zhou, J., and Lv, X. (2012). Nonpoint Source Pollution from Urban Runoff and Pollution Abatement in Urban Waterways. Environ. Sci. Technol. 35 (12), 2–6. doi:10.3969/j.issn.1003-6504.2012.12.037
Perera, T., McGree, J., Egodawatta, P., Jinadasa, K. B. S. N., and Goonetilleke, A. (2019). Taxonomy of Influential Factors for Predicting Pollutant First Flush in Urban Stormwater Runoff. Water Res. 166, 115075. doi:10.1016/j.watres.2019.115075
Qin, H., Tan, X., Fu, G., Zhang, Y., and Huang, Y. (2013). Frequency Analysis of Urban Runoff Quality in an Urbanizing Catchment of Shenzhen, China. J. Hydrology 496, 79–88. doi:10.1016/j.jhydrol.2013.04.053
Ran, Q., Su, D., Li, P., and He, Z. (2012). Experimental Study of the Impact of Rainfall Characteristics on Runoff Generation and Soil Erosion. J. Hydrology 424-425, 99–111. doi:10.1016/j.jhydrol.2011.12.035
Shi, B., Wang, P., Jiang, J., and Liu, R. (2018). Applying High-Frequency Surrogate Measurements and a Wavelet-ANN Model to Provide Early Warnings of Rapid Surface Water Quality Anomalies. Sci. Total Environ. 610-611, 1390–1399. doi:10.1016/j.scitotenv.2017.08.232
Wang, S., and Yao, X. (2013). Using Class Imbalance Learning for Software Defect Prediction. IEEE Trans. Rel. 62 (2), 434–443. doi:10.1109/TR.2013.2259203
Tian, H. (2016). Research on Measurement and Evaluation Methods of Stormwater Runoff Pollution Load. Master’s Thesis. Beijing (China): Beijing University of Civil Engineering and Architecture.
Wang, H. (2015). Pollution Characteristics Analysis and Pollution Load Estimation in Rainfall Runoff of Different Underlying Surface in Wuhan City. Master’s Thesis. Wuhan (China): Huazhong University of Science and Technology.
Wang, Z., Lai, C., Chen, X., Yang, B., Zhao, S., and Bai, X. (2015). Flood Hazard Risk Assessment Model Based on Random Forest. J. Hydrology 527, 1130–1141. doi:10.1016/j.jhydrol.2015.06.008
Wang, Z., Qi, F., Liu, L., Chen, M., Sun, D., and Nan, J. (2021). How Do Urban Rainfall-Runoff Pollution Control Technologies Develop in China? A Systematic Review Based on Bibliometric Analysis and Literature Summary. Sci. Total Environ. 789, 148045. doi:10.1016/j.scitotenv.2021.148045
Wu, Q., Ye, Y., Zhang, H., Ng, M. K., and Ho, S.-S. (2014). Forestexter: An Efficient Random Forest Algorithm for Imbalanced Text Categorization. Knowledge-Based Syst. 67, 105–116. doi:10.1016/j.knosys.2014.06.004
Yang, S., Liang, M., Qin, Z., Qian, Y., Li, M., and Cao, Y. (2021). A Novel Assessment Considering Spatial and Temporal Variations of Water Quality to Identify Pollution Sources in Urban Rivers. Sci. Rep. 11, 8714. doi:10.1038/s41598-021-87671-4
Yang, Y., Li, J., and Zhang, J. (2013). Study on Pollution Load of Watershed in Shiyan Reservoirs in Shenzhen. Res. Conserv. Environ. Prot. 8, 174. doi:10.16317/j.cnki.12-1377/x.2013.08.100
Ye, Z., Yang, J., Zhong, N., Tu, X., Jia, J., and Wang, J. (2020). Tackling Environmental Challenges in Pollution Controls Using Artificial Intelligence: A Review. Sci. Total Environ. 699, 134279. doi:10.1016/j.scitotenv.2019.134279
Zhang, W., Li, J., Sun, H., and Che, W. (2021). Pollutant First Flush Identification and its Implications for Urban Runoff Pollution Control: A Roof and Road Runoff Case Study in Beijing, China. Water Sci. Technol. 83 (11), 2829–2840. doi:10.2166/wst.2021.157
Keywords: rainfall-runoff pollution, rainfall characteristics, EMC, integrated learning methods, ANN
Citation: Tian Z, Yu Z, Li Y, Ke Q, Liu J, Luo H and Tang Y (2022) Prediction of River Pollution Under the Rainfall-Runoff Impact by Artificial Neural Network: A Case Study of Shiyan River, Shenzhen, China. Front. Environ. Sci. 10:887446. doi: 10.3389/fenvs.2022.887446
Received: 01 March 2022; Accepted: 20 May 2022;
Published: 22 June 2022.
Edited by:
Mohamed Hasnain Isa, University of Technology Brunei, BruneiReviewed by:
An Liu, Shenzhen University, ChinaCopyright © 2022 Tian, Yu, Li, Ke, Liu, Luo and Tang. This is an open-access article distributed under the terms of the Creative Commons Attribution License (CC BY). The use, distribution or reproduction in other forums is permitted, provided the original author(s) and the copyright owner(s) are credited and that the original publication in this journal is cited, in accordance with accepted academic practice. No use, distribution or reproduction is permitted which does not comply with these terms.
*Correspondence: Junguo Liu, anVuZ3VvLmxpdUBnbWFpbC5jb20=
Disclaimer: All claims expressed in this article are solely those of the authors and do not necessarily represent those of their affiliated organizations, or those of the publisher, the editors and the reviewers. Any product that may be evaluated in this article or claim that may be made by its manufacturer is not guaranteed or endorsed by the publisher.
Research integrity at Frontiers
Learn more about the work of our research integrity team to safeguard the quality of each article we publish.