 UK Pata
 Farrukh Shahzad
 Zeeshan Fareed
 MA Rehman
94% of researchers rate our articles as excellent or good
Learn more about the work of our research integrity team to safeguard the quality of each article we publish.
Find out more
ORIGINAL RESEARCH article
Front. Environ. Sci. , 16 May 2022
Sec. Environmental Economics and Management
Volume 10 - 2022 | https://doi.org/10.3389/fenvs.2022.886515
This article is part of the Research Topic Export Product Quality, Renewable Energy, and Sustainable Production View all 48 articles
This study assesses India’s environmental problems by focusing on the ecological footprint pressure index (EFPI), which provides a simultaneous analysis of biocapacity and ecological footprint. In particular, the study examines the impact of export diversification, economic growth, and renewable energy on EFPI under the environmental Kuznets curve (EKC) hypothesis for India. To analyze the long-run relationships, the Residual Augmented Ordinary Least Squares (RALS)-Fourier cointegration test is applied to annual data from 1965 to 2014. Contrary to the EKC hypothesis, the results show a U-shaped relationship between income and EFPI. The absence of the EKC hypothesis implies that economic development does not help to ensure environmental quality; hence, other measures are required to minimize irreversible environmental problems. In this regard, the results of the study suggest that renewable energy consumption and export diversification reduce EFPI. Based on the overall findings of the study, it is recommended that the Indian government improve environmental values by changing the export structure and energy mix.
The desire for a higher standard of living pushes countries to accomplish the objective of economic growth through the transition from the agricultural to the industrial sector, which may lead to deterioration of the environment (Li et al., 2021). The environmental quality is simply influenced by national and international economic aspects. To meet this objective, both developed and developing nations are considering various policies and strategies that address the impact of global trade on sustainable economic growth. More so, to generate sustainable revenues and curtail dependence on specific exports, the World Bank and the International Monetary Fund (International Monetary Fund, 2020) encourage both developing and advanced economies to adopt export diversification policies. Diversified exports and trade openness strategies primarily promote countries’ economic development. Occasionally, however, it may also be a process that leads to environmental degradation. Clearly, diversified exports simply rely on industrialization and traditional fossil fuel-based energy consumption, which can degrade environmental quality by emitting greenhouse gas (GHG) emissions unless the portion of clean and renewable energy sources has been inflated (Can et al., 2021; Shahzad et al., 2021). Export diversification and the impact of renewable resources on environmental quality have recently become an important research topic. The environmental indicator studied in this context is important.
Global warming is a universal concern and the whole world is facing an alarming situation due to the expansion of GHG emissions (Yang et al., 2021). In recent years, economies have also been hit by enormous disasters, such as the explosion of floods in India, Pakistan, and Australia, the tsunami in Indonesia, and the fire disaster in Russia, etc. Such disasters are the main reasons for the deterioration of the ecological environment (Dagar et al., 2021). However, carbon dioxide (CO2) emissions do not reflect this and similar disasters. In this context, the ecological footprint proposed by Rees 1992) is a more comprehensive environmental measure. Ecological footprint includes six sub-components such as builtupland, cropland, grazingland, fishing grounds, forest area, and carbon footprint, allowing to examine environmental problems with air, land and marine ecosystems. On the one hand, an analysis covering only the ecological footprint deals with the demand side of environmental problems. On the other hand, biocapacity reflects the supply side of this demand (Pata and Isik, 2021). Ecological footprint and biocapacity should be evaluated together in order to evaluate environmental problems from both supply and demand aspects. In this context, the ecological footprint pressure index (hereafter EFPI) can be used as a proxy for environmental deterioration. Calculated by dividing the ecological footprint by biocapacity and proposed by Huang et al. (2007), the EFPI allows for a simultaneous analysis of the environmental situation with supply and demand. Hence, this will offer an opportunity to evaluate the ecological hazards from a wide ranging perspective rather than just considering environmental demand.
In this study, we examine the effects of export diversification, renewable energy consumption, and gross domestic product (GDP) on EFPI. In this study, we seek answers to three basic research questions. 1) What is the impact of export diversification on sustainable development? 2) Does the use of renewable energy promote environmental quality? 3) Is there an inverted U-shaped environmental trade-off between GDP and EFPI, as reflected in the environmental Kuznets curve (EKC) hypothesis proposed by Grossman and Krueger (1991)? We attempt to answer these questions for India.
We have chosen to analyze the determinants of environmental degradation in India for several reasons. Since the 1990s, India’s GDP growth rate has been among the fastest in the world (Solarin et al., 2017). However, this growth also brings with it social, economic and environmental problems. The increasing production and consumption activities in the wake of liberalization and economic reforms in India have led to environmental problems such as climate change and depletion of the ozone layer globally (Pata and Kumar, 2021). Moreover, Indian society is exerting significant pressure on water and land resources. The fact that India has the third largest ecological footprint in the world (Global Footprint Network, 2018) is a clear indication of these pressures. For these reasons, it is important to study the impact of export diversification, renewable energy and income on environmental quality in India, both for the country and the world.
However, few studies in the literature have adjusted export diversification to test the EKC hypothesis (Liu et al., 2019). Given this gap, our study is the first to analyze the impact of export diversification on environmental degradation in India. Moreover, we introduce and use the RALS-Fourier cointegration test to provide stronger evidence of the cointegration relationship than conventional methods by considering both the information of the high moments of non-normal residuals and smooth structural changes. Furthermore, unlike previous studies, we focus on the ecological footprint pressure index for India and thus analyze the ecological footprint and biocapacity simultaneously. With these aspects, we expect this study to contribute to the field of environmental economics. Based on the outcomes of this study, policy implications will be suggested on export diversification and economic growth for emerging countries. The regulators of these countries may benefit from these recommendations by drawing such plans to enjoy sustainable economic growth and international trading.
The remainder of the study is organized as follows. Section 2 represents the existing literature whereas Section 3 defines the materials and methods of the research. Section 4 elaborates the empirical results. Lastly, Section 5 concludes the study and provide some indispensable policy implications.
Since the seminal research of Grossman and Krueger (1991), many researchers have tested the validity of the environmental Kuznets curve hypothesis, which implies that there is an inverted-U-shaped relationship between income and environmental degradation, ultimately resulting in environmental benefits from economic growth. In the initial stages of economic development, ecological degradation becomes started to rise as the per capita income in a country increases; though, after reaching a certain point, the per capita income begins to decline by preserving the environment (Tamazian et al., 2009; Jalil and Feridun, 2011; Shahbaz et al., 2013; Ulucak et al., 2020). More so, some studies showed a mixed relation between economic growth and the environment (Destek et al., 2020; Ullah et al., 2022).
Because the EKC literature is so extensive, we briefly review studies on India. Some studies have argued that the EKC hypothesis is valid for India (see e.g., Managi and Jena, 2008; Tiwari et al., 2013; Shahbaz et al., 2015; Sinha and Shahbaz, 2018; Ahmed and Wang, 2019; Rana and Sharma, 2019; Usman et al., 2019). In contrast, the studies of Alam et al. (2016), Pal and Mitra (2017), Destek et al. (2018), Adamu et al. (2019), Sarkodie and Yadav (2019), Pata and Aydin (2020), and Bandyopadhyay and Rej (2021) do not support the EKC hypothesis. The validity of the EKC hypothesis for India is still a controversial issue in the current literature. We aim to contribute to this discussion by examining the effects of renewable energy and export diversification on the ecological footprint pressure index in India.
On the one hand, some researchers have analyzed the determinants of renewable energy (Abumunshar et al., 2020; Habesoglu et al., 2022; Samour and Pata, 2022). On the other hand, the environmental pollution-reducing effect of renewable energy consumption has been proven in many studies (see e.g., Destek and Sinha, 2020; Wang et al., 2020; Destek and Manga, 2021; Li et al., 2021; Pata, 2021; Rehman et al., 2021; Fareed et al., 2022; Rehman et al., 2022, among others). However, contrary to the general view, some studies have reported that renewable energy does not have a significant impact on environmental degradation (Apergis et al., 2010; Menyah and Wolde-Rufael, 2010; Lin and Mubarek, 2014; Pata, 2018), even that it can increase CO2 emissions (Boluk and Mert, 2014). Al-Mulali et al. (2016) also found that renewable energy production could increase the ecological footprint by causing inefficiency in the use of water and land.
Researchers have widely used trade-related variables such as exports, imports, and trade openness when testing the EKC hypothesis. However, these variables refer to trade volume and do not provide information on the diversity of exported and imported goods. How does the diversity of exported goods affect environmental degradation? Recently, some studies have focused on this relatively new research topic compared to the EKC hypothesis and renewable energy. There is also no consensus among researchers on this topic and different results can be observed under the following parts.
The first part of the studies emphasizes the negative environmental side of export diversification. Liu et al. (2018) used the Johansen cointegration test and vector error correction (VEC) model on annual data from 1990 to 2013, and found that export diversification leads to the formation of more ecological footprint in Korea, Japan, and China. Liu et al. (2019) utilized the Driscoll-Kraay panel estimator for 125 countries from 2000 to 2015 and found that export diversification is positively linked with CO2 emissions. Can et al. (2020) performed the autoregressive distributed lag (ARDL) model for 84 developing countries from 1971 to 2014 and concluded that export diversification increases CO2 emissions. Wang et al. (2020) conducted the cross-sectional ARDL model for G7 countries from 1990 to 2017 and concluded that export diversification has a positive impact on CO2 emissions. Iqbal et al. (2021) used the Augmented Mean Group Estimator for 37 OECD countries from 1970 to 2019 and noted that export diversification has a positive impact on CO2 emissions. Khan et al. (2021) and Sharma et al. (2021) applied the cross-sectional approach for different countries and reported similar results to previous studies.
The second part of the studies emphasizes that export diversification benefits the environment. Shahzad et al. (2020) used the generalized moment method for 63 countries from 1971 to 2014 and reported that export diversification has a negative impact on CO2 emissions. Fareed et al. (2021) conducted the Fourier quantile causality test for Indonesia from 1965q1 to 2014q4 and concluded that export diversification increases the load capacity factor and improves environmental quality. Li et al. (2021) conducted Bayer-Hanck and Maki cointegration test for annual data from 1989 to 2019 and found that export diversification reduces CO2 emissions in China. Similarly, Zafar et al. (2022) studied the relationship between export diversification and the environment in a panel of 22 countries over the period 1986–2017 by employing Westerlund and Edgerton cointegration, Cup-FM and CUP-BC long-run estimation, and generalized quantile regression techniques and found that export diversification lessens CO2 emissions.
Despite the vast literature, no study has considered export diversification in testing the EKC hypothesis for India. Also, no study has examined the ecological footprint index pressure index for India. Previous studies have generally focused on environmental degradation indicators such as CO2, nitrogen oxides and ecological footprint. These indicators only symbolize the increase in emissions or ecological footprint due to a demand, but do not provide information on nature’s ability to meet human demand for environmental resources. To address these research gaps, we examine the impact of export diversification, income, and renewable energy consumption on EFPI in India.
In the last two decades, several cointegration tests have been introduced in the literature that consider structural changes in the long-term relationship. The pioneers use dummy variables to capture structural changes and only allow for sharp breaks (see Gregory and Hansen, 1996; Carrion-i-Silvestre and Sansó, 2006; Hatemi-J, 2008, among others). But, as emphasized by Hyndman (2014), “most things change slowly over time,” and dummy variables are not able to characterize such changes. To compensate for this shortcoming, Tsong et al. (2016) and Banerjee et al. (2017) suggest using a Fourier function when testing the cointegration relationship to account for multiple smooth changes. Using a Fourier function eliminates the need to determine the location and number of breaks.
Although both types of tests allow for structural changes, they do not take into account the information contained in non-normal errors because the limiting distribution of test statistics is not based on the assumption of error distribution and the parameter estimates are based on test regressions that remain consistent. Since using the information contained in non-normal errors improves the power of the test, as pointed out by Lee et al. (2014), we follow the suggestion of Im and Schmidt (2008) and employ “residual augmented least squares” (RALS) to use this information to improve the power of the Fourier Engle-Granger cointegration test introduced by Yilanci (2019). The RALS method allows the use of information in the higher moments of the residuals, and because of this advantage, a number of studies use RALS to improve the power of unit root or cointegration tests (see, among others, Im et al., 2014; Meng et al., 2014; Lee et al., 2014). Differently, we propose for the first time the use of the RALS method in a cointegration test that accounts for structural breaks in the long-run relationship.
We first explain the two-step procedure of the Fourier Engle-Granger (FEG) cointegration test. The FEG test is a residual-based test for cointegration, and the first step is to estimate Eq. 1 as follows:
where
Then, we can define the
where
where
Following the suggestion of Im and Schmidt (2008), we augment Eq. (2) with the following term:
where
The first part of Eq. 7 is related to the condition of homoscedasticity of the error terms, which improves the efficiency of the estimator as long as the residuals are asymmetric. The term of the second part improves the efficiency if
We can obtain the RALS-FEG test statistic by estimating the OLS to Eq. 8. We can obtain the t-statistic on
Lemma 1: Under the null hypothesis of no-cointegration, the limiting distribution of
Under the moment conditions of Eqs 4, 5, the RALS-FEG test has the same asymptotic distribution as generalized method of moments estimators (see Lee et al., 2014). We compute the critical values of the RALS-FEG test considering Eq. 7 with different frequency values of
The fully modified OLS (FMOLS) method developed by Phillips and Hansen (1990) is used to obtain cointegration estimators. The FMOLS estimator remedies diagnostic problems encountered with standard estimators. This method was obtained by developing the OLS, taking into account the internality and autocorrelation problem. Moreover, the asymptotic deviation and externality assumption were used in FMOLS to eliminate the inadequacy of the OLS estimator in calculating the optimal values of the cointegrated equations (Chen and Huang, 2013).
The FMOLS estimator that corrects for the deviation effect in the cointegrated equation with the help of the
We use annual data for the period 1965–2014 for our empirical analysis, which aims to analyze the dynamic impact of economic growth, renewable energy consumption, and export diversification on the ecological footprint pressure index under the EKC hypothesis. Since export diversification data was available until 2014, we limited our data range to 50 years. Among the variables used in the study, EFPI is the ecological footprint pressure index measured as ecological footprint (per capital, global hectares)/biocapacity (per capita, global hectares), GDP and GDP2 are gross domestic production (per capita, constant 2010 $US) and its squared term, REC is renewable energy consumption (per capita, kWh) and EXDIV stands for export diversification (index, measured by Henn et al., 2020). These variables are obtained from four different data sources. EFPI data is from the Global Footprint Network (2021), GDP is from the World Bank (2021), REC is from Our World in Data (2021), and EXDIV is from the International Monetary Fund (2021). The descriptive statistics of the variables are shown in Table 1.
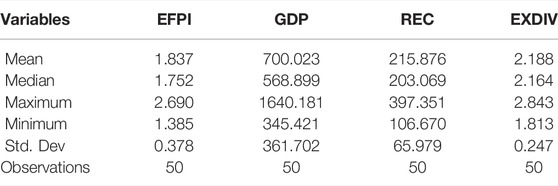
TABLE 1. Descriptive statistics.
As for the mean, GDP has the highest value and EFPI has the lowest value. EXDIV is the variable with the lowest standard error. The mean value of EFPI is 1.83, and in the last 15 years, the EFPI value has been above “2”, as shown in Figure 1.
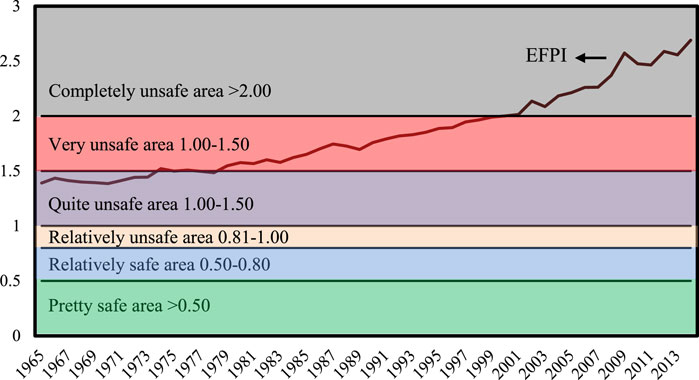
FIGURE 1. Ecological situation in India.
SOURCE: Global Footprint Network (2021).
In Figure 1, the green area indicates pretty safe ecological status, and the blue area indicates relatively safe ecological status. According to Wang et al. (2018), EFPI values above “2” mean that the ecological situation in a country or region is completely unsafe. An EFPI greater than 1 symbolizes that humanity’s demand for ecological resources is greater than the supply of natural resources and that regional ecology is unsustainable (Wang et al., 2018). The ecological footprint pressure index in India has been greater than “1” for 50 years and in unsafe areas. Since 2001, the EFPI has crossed the threshold of “2”. In other words, the people of India will not be able to sustain their current use of land and water resources in the future. This situation highlights the need to address the ecological problems of India, whose population, economy, exports and energy demand are growing rapidly.
To investigate the validity of the EKC hypothesis in India, we use the following log quadratic specification:
where ln is the logarithm, t is the time period, β0 is the constant term, β1,2,3, and β4 are the long term elasticities with respect to the dependent variable, and ut is the error term. The inclusion of the squared GDP in Equation 10 helps to analyze the inverted U-shaped EKC relationship. If β1 is positive, β2 is negative, and both coefficients are statistically significant, the EKC hypothesis is valid. If β1 is negative and β2 is positive, there may be a U-shaped relationship between economic growth and environmental degradation (Pata and Caglar, 2021). When β1 and β2 are zero, there is no relationship between pollution and income. The expected value of β3 is negative because greater use of renewable energy can help reduce anthropogenic air, water and soil pollution. However, the expected sign of β4 can be positive or negative conditional on the type of goods exported.
To investigate the long-run relationship among the variables, we first test the unit root properties of the variables under consideration. To this end, we employ the Fourier augmented Dickey-Fuller (FADF) unit root test introduced into the literature by Enders and Lee (2012). They extend the traditional augmented Dickey-Fuller (ADF) unit root test with a Fourier function to allow for multiple smooth changes. We first test the significance of the Fourier function, and in case of significance, we interpret the results of the FADF test; otherwise, we use the ADF unit root test. Table 2 presents the results of the unit root tests:
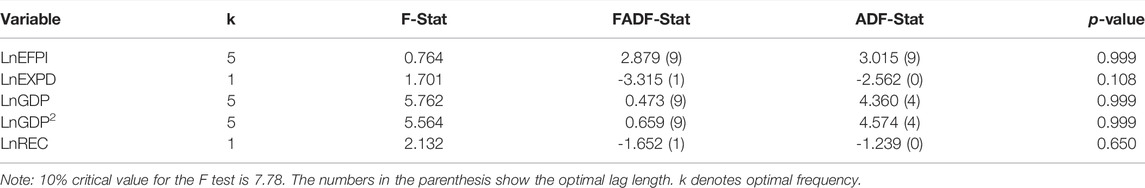
TABLE 2. Results of unit root tests.
The results show that the trigonometric terms are not statistically significant because the F-test statistics are below the critical values. Thus, instead of considering the results of the FADF test, we interpret the results of the ADF test, which show that all variables are non-stationary at the level. Therefore, we can apply the cointegration test to investigate the long-run relationship between the variables. Table 3 presents the results of the FEG and RALS-FEG tests:

TABLE 3. Results of cointegration tests.
The findings of the RALS-FEG test show a cointegration relationship between the considered series. The FEG test also support these findings, as the test statistic is above the critical value of 1% (-5.482|>|-4.906|). In other words, both test statistics suggest the rejection of the null hypothesis of no cointegration. Therefore, after finding the cointegration relationship, we calculate the long-term coefficients using FMOLS method and present the results in Table 4.
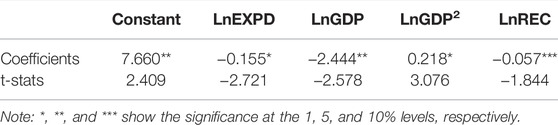
TABLE 4. Results of long-run estimation.
The long run estimates divulge that all coefficients are statistically significant at the traditional levels. Since the GDP coefficient is positive and its squared coefficient is negative, there is a U-shaped relationship between income and environmental degradation, implying that the EKC hypothesis is not valid for India. In stark contrast to the opinion of Sinha and Shahbaz (2018), Ahmed and Wang (2019) and Usman et al. (2019) that the EKC hypothesis holds for India, our result is fully consistent with the outputs of Adamu et al. (2019) and Sarkodie and Yadav (2019). It is possible that the EKC hypothesis is not valid in countries like India that have not yet completed the industrialization phase. The U-shaped relationship between income and pollution in India shows that in the initial stage of economic development, economic growth reduces pollution, but after a certain threshold, industrial production, use of polluting inputs and excessive resource consumption increase environmental degradation. As Sarkodie and Yadav (2019) point out, the validity of the U-hypothesis could mean that India’s energy- and carbon-intensive industrial production is driving up pollution. So, income growth does not automatically solve environmental problems, and hence additional measures need to be taken to maintain environmental quality while the economy expands. India needs an annual economic growth of 6–8% to reduce poverty (Alam et al., 2016), and therefore, it does not seem feasible for the Indian government to take measures that limit economic development due to environmental concerns. In this context, export diversification and renewable energy use can be included in the environmental policymaking.
The coefficient of renewable energy is negative and statistically significant at 1% level, revealing that cleaner energy has a reducing impact on the EFPI. All else is same, a 1% upsurge in REC reduces EFPI by 0.057%. This outcome concurs with the results of Wang et al. (2020) for G7 economies, Iqbal et al. (2021) for 37 OECD countries, Li et al. (2021) for China, and Pata (2021) for the United States. Considering the environmental positive role of renewable resources, Indian government should invest in renewable energy technologies and expand the use of renewable energy instead of fossil fuels. Although the Indian economy is based on polluting energy sources, it may be possible to increase environmental quality without hindering economic growth by increasing the use of renewable energy types.
More so, keeping other things constant, there is 0.15% decline in EFPI due to 1% rise in export diversification. This empirical result is contradictory with Liu et al. (2018, 2019), Can et al. (2020), Wang et al. (2020), Iqbal et al. (2021), Khan et al. (2021) and Sharma et al. (2021). However, our results are in line with the findings of Shahzad et al. (2020), Li et al. (2021), and Fareed et al. (2021). Diversification of export commodities can contribute to environmental quality by reducing traditional energy consumption (Li et al., 2021). Accordingly, Shahzad et al. (2021) found that export diversification reduces energy demand in India. Moreover, the production of chemical, industrial and high-tech goods can support renewable energy adaptation by providing technological advancement through export basket diversification. Therefore, India can reduce EFPI by diversifying export portfolios and markets.
This study contributes to the growing literature by analyzing the dynamic influence of export diversification, economic growth and renewable energy on the EFPI using time series data from India for the period 1965–2014. Following the EKC hypothesis, we applied the RALS-Fourier cointegration test to provide stronger evidence of the cointegration relationship than conventional methods by considering both the high moments information of the non-normal residuals and smooth structural changes. This technique is efficient enough to extend the power of the Fourier-Engle-Granger cointegration test. The empirical findings represent that diversified exports and greener energy consumption have a reducing effect on EFPI. Moreover, contrary to the EKC hypothesis, the results show a U-shaped association between GDP and EFPI, implying that economic development does not contribute to the maintenance of environmental quality.
The empirical results of the study suggest the following policy implications. First, to offset the effects of global warming, export diversification strategies should be incorporated into sustainable growth programs. Industry actors and political influencers should not influence regulators in emerging economies. Second, policymakers should also promote clean energy to reduce EFPI by substituting renewable resources for fossil fuels. The employment of export diversification and clean energy is expected to achieve the goal of carbon neutrality. Since these factors are closely aligned and not mutually exclusive, they would not only enable a smooth transition of the industrial energy structure, but also increase export revenues. Specifically, this study recommends that to achieve the goal of carbon neutrality and address environmental challenges, emerging economies need to consider export diversification and renewable energy sources. A country like India can enable the development of clean environmental technologies by diversifying its exports. It can also increase the efficiency of energy use by facilitating the adaptation of high technologies thanks to the specialization of the production process in export. In addition, the Indian government can support exporting companies that use renewable energy sources with measures such as tax exemptions, investment subsidies for renewable energy, and price or volume adjustments for companies that do not use renewable resources.
Finally, future studies could incorporate other comprehensive environmental indicators to arrive at more meaningful results. In addition, this article considers the cointegration nexus that can lead to worthwhile effects of export diversification and renewable energy. Including the moderation effect in the analysis could increase its explanatory power. Moreover, this study is limited to time-series data from one emerging market. Future studies can be conducted considering a region or continent to evaluate the impact of a panel data analysis.
The raw data supporting the conclusions of this article will be made available by the authors, without undue reservation.
UP: Methodology, Software, Formal analysis, Data Curation, Conceptualization, Writing Original Draft, Writing—Review and Editing, Resources. ZF: Writing—Review and Editing, Investigation. FS: Writing—Original Draft, Writing—Review and Editing, Investigation. MR: Writing—Review and Editing, Investigation.
The authors declare that the research was conducted in the absence of any commercial or financial relationships that could be construed as a potential conflict of interest.
All claims expressed in this article are solely those of the authors and do not necessarily represent those of their affiliated organizations, or those of the publisher, the editors and the reviewers. Any product that may be evaluated in this article, or claim that may be made by its manufacturer, is not guaranteed or endorsed by the publisher.
The Supplementary Material for this article can be found online at: https://www.frontiersin.org/articles/10.3389/fenvs.2022.886515/full#supplementary-material
Abumunshar, M., Aga, M., and Samour, A. (2020). Oil Price, Energy Consumption, and CO2 Emissions in Turkey. New Evidence from a Bootstrap ARDL Test. Energies 13 (21), 5588. doi:10.3390/en13215588
Adamu, T., Haq, I., and Shafiq, M. (2019). Analyzing the Impact of Energy, Export Variety, and FDI on Environmental Degradation in the Context of Environmental Kuznets Curve Hypothesis: A Case Study of India. Energies 12 (6), 1076. doi:10.3390/en12061076
Ahmed, Z., and Wang, Z. (2019). Investigating the Impact of Human Capital on the Ecological Footprint in India: an Empirical Analysis. Environ. Sci. Pollut. Res. 26 (26), 26782–26796. doi:10.1007/s11356-019-05911-7
Al-Mulali, U., Solarin, S. A., Sheau-Ting, L., and Ozturk, I. (2016). Does Moving towards Renewable Energy Cause Water and Land Inefficiency? an Empirical Investigation. Energy Policy 93, 303–314. doi:10.1016/j.enpol.2016.03.023
Alam, M. M., Murad, M. W., Noman, A. H. M., and Ozturk, I. (2016). Relationships Among Carbon Emissions, Economic Growth, Energy Consumption and Population Growth: Testing Environmental Kuznets Curve Hypothesis for Brazil, China, India and Indonesia. Ecol. Indic. 70, 466–479. doi:10.1016/j.ecolind.2016.06.043
Apergis, N., Payne, J. E., Menyah, K., and Wolde-Rufael, Y. (2010). On the Causal Dynamics between Emissions, Nuclear Energy, Renewable Energy, and Economic Growth. Ecol. Econ. 69 (11), 2255–2260. doi:10.1016/j.ecolecon.2010.06.014
Asumadu-Sarkodie, S., and Yadav, P. (2019). Achieving a Cleaner Environment via the Environmental Kuznets Curve Hypothesis: Determinants of Electricity Access and Pollution in India. Clean. Techn Environ. Policy 21 (9), 1883–1889. doi:10.1007/s10098-019-01756-3
Bandyopadhyay, A., and Rej, S. (2021). Can Nuclear Energy Fuel an Environmentally Sustainable Economic Growth? Revisiting the EKC Hypothesis for India. Environ. Sci. Pollut. Res. 28, 63065–63086. doi:10.1007/s11356-021-15220-7
Banerjee, P., Arčabić, V., and Lee, H. (2017). Fourier ADL Cointegration Test to Approximate Smooth Breaks with New Evidence from Crude Oil Market. Econ. Model. 67, 114–124. doi:10.1016/j.econmod.2016.11.004
Boluk, G., and Mert, M. (2014). Fossil and Renewable Energy Consumption, GHGs (Greenhouse gases) and Economic Growth: Evidence From a Panel of EU (European Union) Countries. Energy 74, 439–446. doi:10.1016/j.energy.2014.07.008
Can, M., Ahmad, M., and Khan, Z. (2021). The Impact of Export Composition on Environment and Energy Demand: Evidence from Newly Industrialized Countries. Environ. Sci. Pollut. Res. 28 (25), 33599–33612. doi:10.1007/s11356-021-13084-5
Can, M., Dogan, B., and Saboori, B. (2020). Does Trade Matter for Environmental Degradation in Developing Countries? New Evidence in the Context of Export Product Diversification. Environ. Sci. Pollut. Res. 27, 14702–14710. doi:10.1007/s11356-020-08000-2
Carrion-i-Silvestre, J. L., and Sansó, A. (2006). Testing the Null of Cointegration with Structural Breaks. Oxf. Bull Econ Stats 68 (5), 623–646. doi:10.1111/j.1468-0084.2006.00180.x
Chen, J. H., and Huang, Y. F. (2013). The Study of the Relationship between Carbon Dioxide (CO2) Emission and Economic Growth. J. Int. Glob. Econ. Stud. 6 (2), 45–61.
Dagar, V., Khan, M. K., Alvarado, R., Usman, M., Zakari, A., Rehman, A., et al. (2021). Variations in Technical Efficiency of Farmers with Distinct Land Size across Agro-Climatic Zones: Evidence from India. J. Clean. Prod. 315, 128109. doi:10.1016/j.jclepro.2021.128109
Destek, M. A., and Manga, M. (2021). Technological Innovation, Financialization, and Ecological Footprint: Evidence from BEM Economies. Environ. Sci. Pollut. Res. 28 (17), 21991–22001. doi:10.1007/s11356-020-11845-2
Destek, M. A., Shahbaz, M., Okumus, I., Hammoudeh, S., and Sinha, A. (2020). The Relationship between Economic Growth and Carbon Emissions in G-7 Countries: Evidence from Time-Varying Parameters with a Long History. Environ. Sci. Pollut. Res. 27 (23), 29100–29117. doi:10.1007/s11356-020-09189-y
Destek, M. A., and Sinha, A. (2020). Renewable, Non-renewable Energy Consumption, Economic Growth, Trade Openness and Ecological Footprint: Evidence from Organisation for Economic Co-operation and Development Countries. J. Clean. Prod. 242, 118537. doi:10.1016/j.jclepro.2019.118537
Destek, M. A., Ulucak, R., and Dogan, E. (2018). Analyzing the Environmental Kuznets Curve for the EU Countries: the Role of Ecological Footprint. Environ. Sci. Pollut. Res. 25 (29), 29387–29396. doi:10.1007/s11356-018-2911-4
Enders, W., and Lee, J. (2012). The Flexible Fourier Form and Dickey–Fuller Type Unit Root Tests. Econ. Lett. 117 (1), 196–199. doi:10.1016/j.econlet.2012.04.081
Fareed, Z., Rehman, M. A., Adebayo, T. S., Wang, Y., Ahmad, M., and Shahzad, F. (2022). Financial Inclusion and the Environmental Deterioration in Eurozone: the Moderating Role of Innovation Activity. Technol. Soc. 69, 101961. doi:10.1016/j.techsoc.2022.101961
Fareed, Z., Salem, S., Adebayo, T. S., Pata, U. K., and Shahzad, F. (2021). Role of Export Diversification and Renewable Energy on the Load Capacity Factor in Indonesia: A Fourier Quantile Causality Approach. Front. Environ. Sci. 9, 770152. doi:10.3389/fenvs.2021.770152
Global Footprint Network, (2021). Global Footprint Network. Available at https://data.footprintnetwork.org/#/(accessed September 10, 2021).
Global Footprint Network, (2018). Has Humanity’s Ecological Footprint Reached its Peak? Available at https://www.footprintnetwork.org/2018/04/09/has_humanitys_ecological_footprint_reached_its_peak/(accessed September 28, 2021).
Gregory, A. W., and Hansen, B. E. (1996). Residual-based Tests for Cointegration in Models with Regime Shifts. J. Econ. 70 (1), 99–126. doi:10.1016/0304-4076(69)41685-7
Grossman, G. M., and Krueger, A. B. (1991). Environmental Impacts of a North American Free Trade Agreement. NBER
Habesoglu, O., Samour, A., Tursoy, T., Ahmadi, M., Abdullah, L., and Othman, M. (2022). A Study of Environmental Degradation in Turkey and its Relationship to Oil Prices and Financial Strategies: Novel Findings in Context of Energy Transition. Front. Environ. Sci. 10, 876809. doi:10.3389/fenvs.2022.876809
Hatemi-j, A. (2008). Tests for Cointegration with Two Unknown Regime Shifts with an Application to Financial Market Integration. Empir. Econ. 35 (3), 497–505. doi:10.1007/s00181-007-0175-9
Henn, C., Papageorgiou, C., Romero, J. M., and Spatafora, N. (2020). Export Quality in Advanced and Developing Economies: Evidence from a New Data Set. IMF Econ. Rev. 68 (2), 421–451. doi:10.1057/s41308-020-00110-8
Huang, Q., Wang, R., Ren, Z., Li, J., and Zhang, H. (2007). Regional Ecological Security Assessment Based on Long Periods of Ecological Footprint Analysis. Resour. Conservation Recycl. 51 (1), 24–41. doi:10.1016/j.resconrec.2006.07.004
Hyndman, R. (2014). Structural Breaks. Available at https://robjhyndman.com/hyndsight/structural-breaks/(accessed September 20, 2021).
Im, K. S., Lee, J., and Tieslau, M. A. (2014). “More Powerful Unit Root Tests with Non-normal Errors,” in Festschrift in Honor of Peter Schmidt (New York, NY: Springer), 315–342. doi:10.1007/978-1-4899-8008-3_10
Im, K. S., and Schmidt, P. (2008). More Efficient Estimation under Non-normality when Higher Moments Do Not Depend on the Regressors, Using Residual Augmented Least Squares. J. Econ. 144 (1), 219–233. doi:10.1016/j.jeconom.2008.01.003
International Monetary Fund (2021). Export Diversification and Quality. Available at https://data.imf.org/?sk=A093DF7D-E0B8-4913-80E0-A07CF90B44DB (accessed September 30, 2021).
Iqbal, N., Abbasi, K. R., Shinwari, R., Guangcai, W., Ahmad, M., and Tang, K. (2021). Does Exports Diversification and Environmental Innovation Achieve Carbon Neutrality Target of OECD Economies? J. Environ. Manag. 291, 112648. doi:10.1016/j.jenvman.2021.112648
Jalil, A., and Feridun, M. (2011). The Impact of Growth, Energy and Financial Development on the Environment in China: a Cointegration Analysis. Energy Econ. 33 (2), 284–291. doi:10.1016/j.eneco.2010.10.003
Khan, Z., Murshed, M., Dong, K., and Yang, S. (2021). The Roles of Export Diversification and Composite Country Risks in Carbon Emissions Abatement: Evidence from the Signatories of the Regional Comprehensive Economic Partnership Agreement. Appl. Econ. 53, 4769–4787. doi:10.1080/00036846.2021.1907289
Lee, H., Lee, J., and Im, K. (2014). More Powerful Cointegration Tests with Non-normal Errors. Stud. Nonlinear Dyn. Econ. 19 (4), 397–413. doi:10.1515/snde-2013-0060
Li, M., Ahmad, M., Fareed, Z., Hassan, T., and Kirikkaleli, D. (2021). Role of Trade Openness, Export Diversification, and Renewable Electricity Output in Realizing Carbon Neutrality Dream of China. J. Environ. Manag. 297, 113419. doi:10.1016/j.jenvman.2021.113419
Lin, B., and Moubarak, M. (2014). Renewable Energy Consumption - Economic Growth Nexus for China. Renew. Sustain. Energy Rev. 40, 111–117. doi:10.1016/j.rser.2014.07.128
Liu, H., Kim, H., and Choe, J. (2019). Export Diversification, CO2 Emissions and EKC: Panel Data Analysis of 125 Countries. Asia-Pac J. Reg. Sci. 3 (2), 361–393. doi:10.1007/s41685-018-0099-8
Liu, H., Kim, H., Liang, S., and Kwon, O.-S. (2018). Export Diversification and Ecological Footprint: a Comparative Study on EKC Theory Among Korea, Japan, and China. Sustainability 10 (10), 3657. doi:10.3390/su10103657
Managi, S., and Jena, P. R. (2008). Environmental Productivity and Kuznets Curve in India. Ecol. Econ. 65 (2), 432–440. doi:10.1016/j.ecolecon.2007.07.011
Meng, M., Im, K. S., Lee, J., and Tieslau, M. A. (2014). “More Powerful LM Unit Root Tests with Non-normal Errors,” in Festschrift in Honor of Peter Schmidt (New York, NY: Springer), 343–357. doi:10.1007/978-1-4899-8008-3_11
Menyah, K., and Wolde-Rufael, Y. (2010). CO2 Emissions, Nuclear Energy, Renewable Energy and Economic Growth in the US. Energy Policy 38 (6), 2911–2915. doi:10.1016/j.enpol.2010.01.024
Pal, D., and Mitra, S. K. (2017). The Environmental Kuznets Curve for Carbon Dioxide in India and China: Growth and Pollution at Crossroad. J. Policy Model. 39 (2), 371–385. doi:10.1016/j.jpolmod.2017.03.005
Pata, U. K., and Aydin, M. (2020). Testing the EKC Hypothesis for the Top Six Hydropower Energy-Consuming Countries: Evidence from Fourier Bootstrap ARDL Procedure. J. Clean. Prod. 264, 121699. doi:10.1016/j.jclepro.2020.121699
Pata, U. K., and Caglar, A. E. (2021). Investigating the EKC Hypothesis with Renewable Energy Consumption, Human Capital, Globalization and Trade Openness for China: Evidence from Augmented ARDL Approach with a Structural Break. Energy 216, 119220. doi:10.1016/j.energy.2020.119220
Pata, U. K., and Isik, C. (2021). Determinants of the Load Capacity Factor in China: A Novel Dynamic ARDL Approach for Ecological Footprint Accounting. Resour. Policy 74, 102313. doi:10.1016/j.resourpol.2021.102313
Pata, U. K., and Kumar, A. (2021). The Influence of Hydropower and Coal Consumption on Greenhouse Gas Emissions: A Comparison between China and India. Water 13 (10), 1387. doi:10.3390/w13101387
Pata, U. K. (2021). Renewable and Non-renewable Energy Consumption, Economic Complexity, CO2 Emissions, and Ecological Footprint in the USA: Testing the EKC Hypothesis with a Structural Break. Environ. Sci. Pollut. Res. 28 (1), 846–861. doi:10.1007/s11356-020-10446-3
Pata, U. K. (2018). Renewable Energy Consumption, Urbanization, Financial Development, Income and CO2 Emissions in Turkey: Testing EKC Hypothesis with Structural Breaks. J. Clean. Prod. 187, 770–779. doi:10.1016/j.jclepro.2018.03.236
Phillips, P. C. B. (1995). Fully Modified Least Squares and Vector Autoregression. Econometrica 63 (5), 1023–1078. doi:10.2307/2171721
Phillips, P. C. B., and Hansen, B. E. (1990). Statistical Inference in Instrumental Variables Regression with I(1) Processes. Rev. Econ. Stud. 57 (1), 99–125. doi:10.2307/2297545
Rana, R., and Sharma, M. (2019). Dynamic Causality Testing for EKC Hypothesis, Pollution Haven Hypothesis and International Trade in India. J. Int. Trade & Econ. Dev. 28 (3), 348–364. doi:10.1080/09638199.2018.1542451
Rees, W. E. (1992). Ecological Footprints and Appropriated Carrying Capacity: What Urban Economics Leaves Out. Environ. urban. 4 (2), 121–130. doi:10.1177/095624789200400212
Rehman, M. A., Fareed, Z., Salem, S., Kanwal, A., and Pata, U. K. (2021). Do Diversified Export, Agriculture, and Cleaner Energy Consumption Induce Atmospheric Pollution in Asia? Application of Method of Moments Quantile Regression. Front. Environ. Sci. 497, 781097. doi:10.3389/fenvs.2021.781097
Rehman, M. A., Fareed, Z., and Shahzad, F. (2022). When Would the Dark Clouds of Financial Inclusion Be over, and the Environment Becomes Clean? the Role of National Governance. Environ. Sci. Pollut. Res. 29, 27651–27663. doi:10.1007/s11356-021-17683-0
Samour, A., and Pata, U. K. (2022). The Impact of the US Interest Rate and Oil Prices on Renewable Energy in Turkey: a Bootstrap ARDL Approach. Environ. Sci. Pollut. Res. doi:10.1007/s11356-022-19481-8
Shahbaz, M., Hye, Q. M. A., Tiwari, A. K., and Leitão, N. C. (2013). Economic Growth, Energy Consumption, Financial Development, International Trade and CO2 Emissions in Indonesia. Renew. Sustain. Energy Rev. 25, 109–121. doi:10.1016/j.rser.2013.04.009
Shahbaz, M., Mallick, H., Mahalik, M. K., and Loganathan, N. (2015). Does Globalization Impede Environmental Quality in India? Ecol. Indic. 52, 379–393. doi:10.1016/j.ecolind.2014.12.025
Shahzad, U., Doğan, B., Sinha, A., and Fareed, Z. (2021). Does Export Product Diversification Help to Reduce Energy Demand: Exploring the Contextual Evidences from the Newly Industrialized Countries. Energy 214, 118881. doi:10.1016/j.energy.2020.118881
Shahzad, U., Ferraz, D., Doğan, B., and Aparecida do Nascimento Rebelatto, D. (2020). Export Product Diversification and CO2 Emissions: Contextual Evidences from Developing and Developed Economies. J. Clean. Prod. 276, 124146. doi:10.1016/j.jclepro.2020.124146
Sharma, R., Sinha, A., and Kautish, P. (2021). Examining the Nexus between Export Diversification and Environmental Pollution: Evidence from BRICS Nations. Environ. Sci. Pollut. Res. 28, 61732–61747. doi:10.1007/s11356-021-14889-0
Sinha, A., and Shahbaz, M. (2018). Estimation of Environmental Kuznets Curve for CO2 Emission: Role of Renewable Energy Generation in India. Renew. Energy 119, 703–711. doi:10.1016/j.renene.2017.12.058
Solarin, S. A., Al-Mulali, U., and Ozturk, I. (2017). Validating the Environmental Kuznets Curve Hypothesis in India and China: The Role of Hydroelectricity Consumption. Renew. Sustain. Energy Rev. 80, 1578–1587. doi:10.1016/j.rser.2017.07.028
Tamazian, A., Chousa, J. P., and Vadlamannati, K. C. (2009). Does Higher Economic and Financial Development Lead to Environmental Degradation: Evidence from BRIC Countries. Energy policy 37 (1), 246–253. doi:10.1016/j.enpol.2008.08.025
Tiwari, A. K., Shahbaz, M., and Adnan Hye, Q. M. (2013). The Environmental Kuznets Curve and the Role of Coal Consumption in India: Cointegration and Causality Analysis in an Open Economy. Renew. Sustain. Energy Rev. 18, 519–527. doi:10.1016/j.rser.2012.10.031
Tsong, C.-C., Lee, C.-F., Tsai, L.-J., and Hu, T.-C. (2016). The Fourier Approximation and Testing for the Null of Cointegration. Empir. Econ. 51 (3), 1085–1113. doi:10.1007/s00181-015-1028-6
Ullah, I., Rehman, A., Svobodova, L., Akbar, A., Shah, M. H., Zeeshan, M., et al. (2022). Investigating Relationships between Tourism, Economic Growth, and CO2 Emissions in Brazil: An Application of the Nonlinear ARDL Approach. Front. Environ. Sci. 52 , 843906. doi:10.3389/fenvs.2022.843906
Ulucak, Z. Ş., İlkay, S. Ç., Özcan, B., and Gedikli, A. (2020). Financial Globalization and Environmental Degradation Nexus: Evidence from Emerging Economies. Resour. Policy 67, 101698. doi:10.1016/j.resourpol.2020.101698
Usman, O., Iorember, P. T., and Olanipekun, I. O. (2019). Revisiting the Environmental Kuznets Curve (EKC) Hypothesis in India: the Effects of Energy Consumption and Democracy. Environ. Sci. Pollut. Res. 26 (13), 13390–13400. doi:10.1007/s11356-019-04696-z
Wang, L., Chang, H.-L., Rizvi, S. K. A., and Sari, A. (2020). Are Eco-Innovation and Export Diversification Mutually Exclusive to Control Carbon Emissions in G-7 Countries? J. Environ. Manag. 270, 110829. doi:10.1016/j.jenvman.2020.110829
Wang, Z., Yang, L., Yin, J., and Zhang, B. (2018). Assessment and Prediction of Environmental Sustainability in China Based on a Modified Ecological Footprint Model. Resour. Conservation Recycl. 132, 301–313. doi:10.1016/j.resconrec.2017.05.003
World Bank (2021). World Development Indicators. Available at https://data.worldbank.org/indicator/NY.GDP.PCAP.KD (accessed September 10, 2021).
Yang, B., Usman, M., and Jahanger, A. (2021). Do industrialization, Economic Growth and Globalization Processes Influence the Ecological Footprint and Healthcare Expenditures? Fresh Insights Based on the STIRPAT Model for Countries with the Highest Healthcare Expenditures. Sustain. Prod. Consum. 28, 893–910. doi:10.1016/j.spc.2021.07.020
Yilanci, V. (2019). A Residual-Based Cointegration Test with a Fourier Approximation. MPRA Paper 95395. Available at https://mpra.ub.uni-muenchen.de/95395/(accessed September 20, 2021).
Zafar, M. W., Saleem, M. M., Destek, M. A., and Caglar, A. E. (2022). The Dynamic Linkage between Remittances, Export Diversification, Education, Renewable Energy Consumption, Economic Growth, and CO 2 Emissions in Top Remittance‐receiving Countries. Sustain. Dev. 30 (1), 165–175. doi:10.1002/sd.2236
Keywords: ecological footprint, EKC hypothesis, export diversification, RALS-fourier cointegration, India
Citation: Pata U, Shahzad F, Fareed Z and Rehman M (2022) Revisiting the EKC Hypothesis With Export Diversification and Ecological Footprint Pressure Index for India: A RALS-Fourier Cointegration Test. Front. Environ. Sci. 10:886515. doi: 10.3389/fenvs.2022.886515
Received: 28 February 2022; Accepted: 19 April 2022;
Published: 16 May 2022.
Edited by:
Lianbiao Cui, Anhui University of Finance and Economics, ChinaReviewed by:
Andrew Adewale Alola, Istanbul University, TurkeyCopyright © 2022 Pata, Shahzad, Fareed and Rehman. This is an open-access article distributed under the terms of the Creative Commons Attribution License (CC BY). The use, distribution or reproduction in other forums is permitted, provided the original author(s) and the copyright owner(s) are credited and that the original publication in this journal is cited, in accordance with accepted academic practice. No use, distribution or reproduction is permitted which does not comply with these terms.
*Correspondence: Farrukh Shahzad, ZmFycnVraC5oYWlsaWFuQGdtYWlsLmNvbQ==
Disclaimer: All claims expressed in this article are solely those of the authors and do not necessarily represent those of their affiliated organizations, or those of the publisher, the editors and the reviewers. Any product that may be evaluated in this article or claim that may be made by its manufacturer is not guaranteed or endorsed by the publisher.
Research integrity at Frontiers
Learn more about the work of our research integrity team to safeguard the quality of each article we publish.