 Hande Mahide Okutan1,2*
 Çağdaş Sağir3
 Claude Fontaine3
 Benoît Nauleau3
 Bedri Kurtulus2
 Philippe Le Coustumer1,4Moumtaz Razack3
- 1EA CNRS 4592 Géoressources et Environnement, Université Bordeaux Montaigne, Pessac, France
- 2Geological Engineering Department, Mugla Sitki Kocman University, Mugla, Turkey
- 3Department of Hydrogeology, University of Poitiers, IC2MP UMR CNRS 7285, Poitiers, France
- 4Bordeaux Imaging Center UMS 3420 CNRS-INRA, Université de Bordeaux, Bordeaux, France
Plastics are widely used in every part of life. Microplastics (MPs) are classified as emerging contaminants in nature. Yet, microplastic transportation parameters in groundwater are not characterized well. In this study, microplastic transport in saturated homogeneous media was investigated. For this purpose, one-dimensional column tests were performed using the fluorescent and microplastic tracers to figure out the hydrodynamic conditions for the microplastic transport. Large silica, small silica, sand, and coarse gravel were the tested media. The hydrodynamic transport parameters were calculated by inverse solution methodology using the experimental and the analytical solution results. Only the coarse gravel medium with a minimum 1 mm and maximum 20 mm (5 mm of median) pore sizes and kinematic porosity 40.2% were found to be suitable for the transport of the used polyethylene (PE) whose particle size was between 200 and 500 µm. It is not possible to transport PE particles of selected size from fine-grained media. Transportation occurred in coarse-grained media such as coarse gravel. The calculated dispersivity values for the coarse gravel were 2.58 and 3.02 cm by using fluorescent and PE tracers, respectively. The experiments showed that the used PE particles cannot be transported if the mean flow velocity is lower than 2.02 cm/min in the coarse gravel medium. The microplastic accumulation might be an issue for an actual aquifer rather than the transportation of it considering the actual groundwater flow velocity is generally much lower.
Introduction
Groundwater is an important freshwater source that can be directly used as drinking water and constitutes 97% of global freshwater resources. Contamination of groundwater can be caused by the natural presence of fluoride and arsenic or by human activities, such as industry, agriculture, etc. The most common groundwater pollutants that threaten human health are pathogens and chemical hazards (World Health Organization, 2006).
Plastics have become indispensable in daily life with their easy accessibility and long-term use. At the same time, its abundant usage and long life make them frequently encountered pollutants in the environment. The size classification of plastic varies depending on the studies. Microplastics are specified as smaller than 5 mm in diameter according to GESAMP (2015). Windsor et al. (2019) also defined the size distribution of microplastics as 0.0001–5 mm according to their review research. Direct releasing of the micro-sized plastic products and fragmentation of large plastics are the sources of the microplastics (MPs). These sources are called primary and secondary, respectively. Primary MPs are used in personal care products, toothpaste, detergents, and hygiene products. Fragmentation and gradual deterioration of the large plastics by various organic and inorganic processes create secondary MPs. These processes include ultraviolet radiation-based photodegradation, mechanical abrasion, and biological effects (Ivar Do Sul and Costa, 2014; Waldschläger et al., 2020; Wu et al., 2020). The effect of primary and secondary MPs and current knowledge were compiled in view of the marine environment (Ivar Do Sul and Costa, 2014). The source of primary and secondary MPs and the generation of secondary MPs were explained by Waldschläger et al. (2020).
MPs are emerging contaminants. They have been detected in marine, terrestrial, and atmospheric ecosystems. The first studies about microplastics were conducted in the marine environment. The following studies dominantly discussed microplastic contamination in the marine environment (Thompson et al., 2004; Law and Thompson, 2014). One of the first studies by Thompson et al. (2004) presented spatial distribution and accumulation of polymers while identifying their types in the marine environment, northeast Atlantic. The rising occurrence of MPs and their sources in the marine environment was mentioned and pointed out while concerning the removal of MPs by reducing their consumption. The mass of the terrestrial-sourced plastics in the oceans from the major plastic producing and consuming countries was estimated at 7.7 million tons (MT) at least (Sarkar et al., 2022). MP pollution in groundwater is not a fully enlightened subject, but studies in this area are increasing. Panno et al. (2019) calculated the average concentration of MP as 6.4 particles per liter and the maximum concentration as 15.2 particles per liter by analyzing the samples from some karst regions in the USA. Mintenig et al. (2019) detected a maximum of 7 particles per liter for the groundwater that was treated and injected through underground.
There are some studies about the migration of MPs in porous media. Porous media makes possible the migration of small particles and dissolved materials. Besides the expected accumulation of MPs in the soil, the particles could migrate vertically by the physical and chemical effects of water infiltration, fauna activities, and root growth (Maaß et al., 2017; Rillig et al., 2017; O’Connor et al., 2019; Li H. et al., 2021). The studies concerning in fate of MPs in the soil environment are limited and evaluation requires. More studies are needed on the transport, distribution, and degradation of MPs in the soil, especially in terms of environmental impacts in agricultural areas (Kumar et al., 2020).
Higher MP concentration makes the particle transport higher. Also, the effect of concentration decreases upon the flow rate decrease. Researching the effect of changes in the size of MPs on transport and retention, it has been revealed that for porous media-saturated in seawater salinity, the transport decreases with the increase in the size of MPs. Mobility has weakened due to aggregation. It has been observed that the transport in environments with different salinities is directly related to the size of the MPs (Dong et al., 2018).
Chu et al. (2019) and Hou et al. (2020) studied the effect of zeta potential and ionic strength of the background solution on the transportation of MPs in saturated media. Zeta potential becomes less negative for both MP particles and glass balls as porous media, while the ionic strength of the background solution gets higher. The higher ionic strength leads to higher attachment efficiency of MPs. Chu et al. (2019) studied the zeta potential and ionic strength effect on transportation MPs in saturated media. Higher MP concentration makes the particles transport higher. Also, the effect of concentration decreases upon the flow rate decrease. MP retention is higher in a medium particle-sized porous media (1–2 mm) than in a large particle-sized porous media (2–4 mm) because of the decrease in pore sizes. As the size of the material constituting the porous medium decreases, the retention/accumulation increases because the surface area that the transported particles contact with the material during transport increases. With the increase in the ionic strength of the background solution, the penetration of the MP particles decreases in the quartz sand porous media. The transport ability of the MP particles decreases if there is fulvic acid in the environment. The presence of fulvic acid strengthens the double layer repulsive forces of plastic particles and porous media. On the contrary, the high ionic strength decreases the double layer repulsive forces of plastic particles and porous media leading to an increase in the transport ability of the MP (Hou et al., 2020). The high density of the MPs may cause higher retention and lower mobility depending on the increase in their gravitational sedimentation (Dong et al., 2021). In different ionic strength conditions, the presence of clay and organic matter (NOM), which are natural colloids in the environment directly affects the MPs transport. The presence of clay increased the MPs mobility under low ionic strength conditions. However, as clay and MPs formed clusters under high ionic strength conditions, a decrease in mobility was detected. In cases where clay and NOM exist together, it is NOM that has low ionic strength and dominantly affects the transport of MPs. At high ionic strength, clay and NOM affect the MP transport together and the NOM increases the MPs transport (Li M. et al., 2021b). The vertical penetration of the particles with water infiltration varies in saturated and unsaturated porous media. The maximum penetration depth was experimented with as ∼ 7.5 cm (O’Connor et al., 2019). The results of the MP penetration column experiment were used in a model to forecast the potential subsurface transport of MP. The average penetration depth was found to be 5.24 m by using a historic weather pattern (O’Connor et al., 2019). The penetration in sandy soil and clay loam was compared for aged and new MPs. The penetration depth of MPs was the same (30 cm) for both media, but the particles reached the same depth faster in sandy soil than in clay loam. The results indicated that there is a possibility of groundwater contamination (Ren et al., 2021a; Ren et al., 2021b). There are also biological agents to help the transport of the MPs into the soil. It is demonstrated that the presence of earthworms and collembolan species in the soil environment accelerates the vertical transport of MPs (Maaß et al., 2017; Rillig et al., 2017). The mean vertical velocity of the MPs was 0.5 cm per day. The small MP particles reached deeper zones (Rillig et al., 2017). Li H. et al. (2021a) investigated the effects of plant root growth. They tested several shapes and sizes of MPs particles at different depths with various types of plants. The roots can prevent the movement of MPs particles to deeper zones, which results in the topsoil accumulation of MPs (Li H. et al., 2021a). The transport of MPs in a shallow alluvial aquifer was investigated by performing well-pumping tests. Uranine and MPs tracer experiment was carried out with an injection well and several observation points at a 200 m distance. The observations were continued for 6 months. The peak concentrations of MPs exceeded the peak concentrations of uranine, especially for long distances. The first detection time for shorter distances was the same for the uranine solution and MPs. When the distance increases, MPs’ first arrival time is shorter than the uranine. Also, MPs can travel much more distances compared with uranine (Goeppert and Goldscheider, 2021).
The studies which are focused on the transport of PE particles in porous media often underline the effects of environmental factors, porous media properties, and plastic particle properties. According to Windsor et al. (2019), there is a lack of knowledge about the residence time of plastics in the surface waters and the quantitative assessments of the transport pathways from land to sea. Also, a significant absence of studies on microplastic presence and transport in the soil/porous environment must be underlined (Bläsing and Amelung, 2018; Li et al., 2020). It is essential to clarify how the MP particles are transported and dispersed through porous media. The hydrodynamic transport parameters of the porous media need to be assessed by using MPs and compared with those found by using the common traditional tracers. That will give detailed information on the possible contamination of groundwater.
This study aims to determine the hydrodynamic transport parameters of saturated porous media by using PE to understand the transport mechanism of the plastic particles. The existing solute transport analytical solutions were used and tested to see whether they are also valid for MPs transport. For this purpose, 1-D column experiments were performed with a conventional tracer (fluorescein) and PE tracer. Then, the solute transport analytical solutions were applied. The equations were chosen according to the injection type; instantaneous and finite-duration injections for uranine and PE, respectively. At last, the inverse solution was applied to the analytical solutions to achieve the hydrodynamic parameters.
Materials and Methods
Properties of the PE Particles
The type of MP used in this study was polyethylene (PE). The density of the PE is between 0.88 and 0.96 (Rillig et al., 2017; Hüffer et al., 2019; O’Connor et al., 2019). The PE grains between 200–500 µm were set apart by using the sieves. The grain sizes of this PE were measured by Zeiss Primostar optical microscopy and ZEN 2.6 Primostar software. The grain size statistics and the histogram of the used PE particles are given in Table 1 and Figure 1, respectively. Approximately, 7.5% of the grains were smaller and 3.5% of the grains were higher than the used sieve gap sizes which were a minimum of 200 µm and a maximum of 500 µm. Scanning electron microscopy (SEM) was used to identify the shape, and the surface morphology of the PE particles was irregular and rough, so they can be called fragments (Figure 2). If the pore size and the grain size of the saturated porous medium are too small for the movement of the plastic particles, straining will occur. According to the studies on pore straining, the diameter of the particles should not exceed 5–10% of the porous medium grain diameter to avoid the pore straining (DeNovio et al., 2004).

TABLE 1. General descriptive statistics of the grain size of the used PE, in µm.
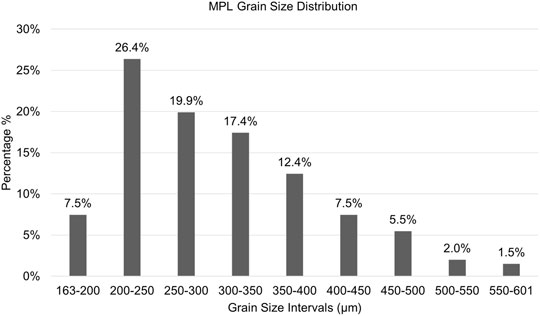
FIGURE 1. The grain size histogram of the used PE.
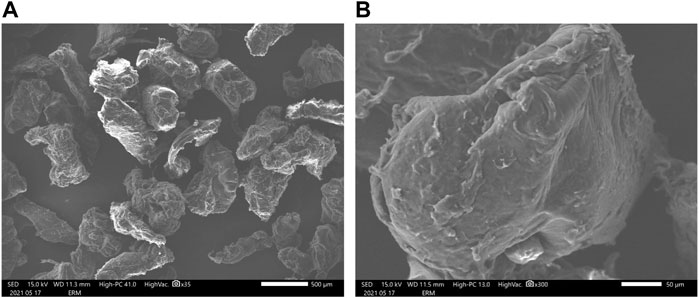
FIGURE 2. SEM micrographs of the MP: (A) shape and size distribution; (B) detail of rugged PE particles.
Properties of the Porous Medium Materials
In order to test different grain sizes and porosities, large silica balls, small silica balls, sand, and coarse gravel materials were used in the experiments (Figure 3). For the pore size and grain size measurements of large silica, small silica, and sand, the materials were mixed with resin in a plastic holder and left to dry. Then the dried samples were cut horizontally near the bottom. The bottom sides of the samples were examined with an optical microscope to measure the pore and grain sizes. The particle size of the coarse gravel was directly measured with a tape measure. For the pore size measurements of the coarse gravel, pore sizes were directly measured on the column filled with the material. Between 40 and 90 measurements were performed for each material to obtain reliable pore/grain size distribution of each used material.
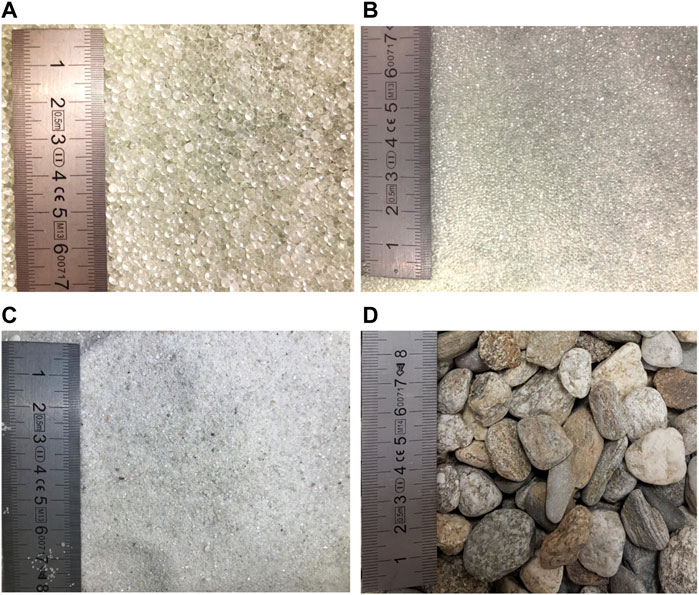
FIGURE 3. The porous medium materials for the column tests: (A) large silica balls; (B) small silica balls; (C) sand; (D) coarse gravel.
Depending on the magnification of the optical microscopy, image resolution changes. The smallest measurable pixel sizes for the images of the large silica, small silica, and sand were 213 μm, 206 μm, and 211 μm, respectively. Approximately, 58% of the pores were higher than 800 μm and 97% of the pores were higher than 400 µm for the large silica. 93% of the pores were higher than 300 µm for the small silica. Some 78.6% of the pores were higher than 300 µm for the sand. Coarse gravel pore size varied between 1 and 20 mm (Table 2 and Supplementary Figure S1).
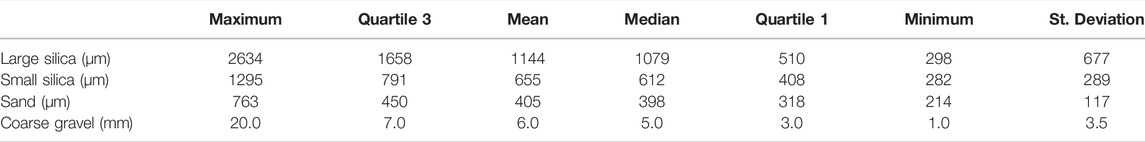
TABLE 2. General descriptive statistics of the pores size of the porous medium materials.
According to the grain size distributions of the porous medium, the most dominant grain size intervals for the large silica, small silica, sand, and coarse gravel are 1700–2000 μm, 1000–1100 μm, 400–800 μm, and 23–28 mm, respectively (Table 3 and Supplementary Figure S2).
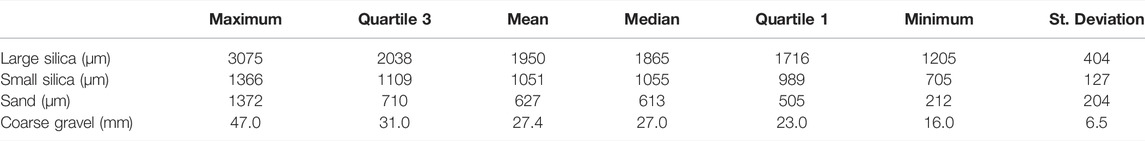
TABLE 3. General descriptive statistics of the grain size of the porous medium materials.
Fluorescent Tracer Column Tests
The fluorescent tracer experiments were performed by vertically placed columns under a steady flow rate within the saturated medium to investigate the hydrodynamic parameters of the porous medium materials used in this study. The experimental setup is given in Figure 4. The X indicates the distance from the injection point to the top of the material. L1 indicates the height of the material. L2 is for the length of the small outlet tube, which indicates the distance from the top of the material to the water sampling point. R1 and R2 are the diameter of the column and the diameter of the small outlet tube, respectively. The experimental system was cleaned after each experiment. The parameters of the experimental setup are given in Supplementary Table S1.
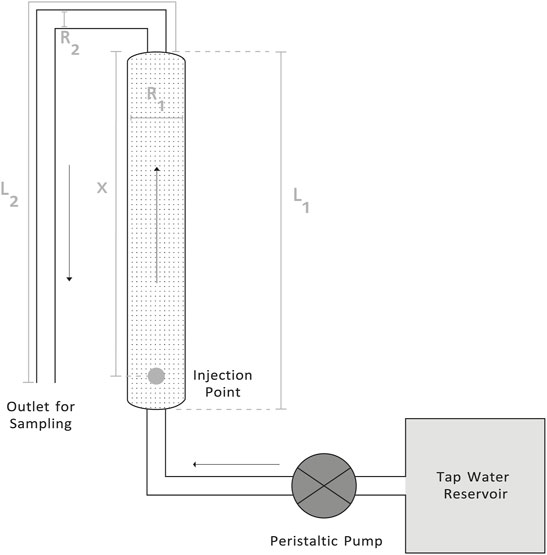
FIGURE 4. Experimental setup for the fluorescent tracer tests.
The experiment started with calculating the density of the materials and their total porosities to determine the mean transit time of the water in the column. A volumetric flask was used for the density measurements. The material of known volume was filled with water and the volume of the used water was measured, then the ratio between these volumes was calculated for the total porosity measurements. The mean transit time was calculated by Equations 1, 2 in order to decide the start time and the intervals of the water sampling/fluorescent measurement (Fetter, 2014).
where T, mean transit time (time); X, distance from injection point (distance); and u, mean velocity (distance/time).
where u, mean velocity (distance/time); Q, flowrate (volume/time); A, cross-sectional area (area); and n, total porosity (dimensionless, ratio).
AquaFluor® Handheld Fluorometer (Turner Designs) was used for the fluorescent measurements of the samples. At the beginning of each experiment day, the fluorometer was re-calibrated and the fluorescein (uranine) injection solutions were prepared. For the calibrations, 300 μg/L solutions were used and equaled 300 units on the fluorometer. The injection solution was prepared at 0.2 g/L concentration. Minimum three injections/experiments were done for each material. The experiments were implemented by different flow rates and volumes of the injected tracer. The flow rates (Q) and injected volumes (Vinj) are given in Table 4.
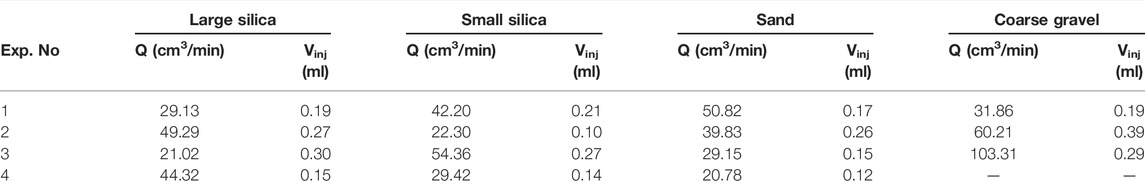
TABLE 4. The flow rates (Q) and injected tracer volumes (Vinj) for the fluorescent tracer tests.
The longitudinal dispersivities and the kinematic porosities of the porous medium materials were calculated using the inverse solution method. One-dimensional advection–dispersion equation (ADE) was used to have analytic breakthrough curves (BTC) (concentration/time). Then these analytically calculated curves were fitted to the BTCs that were created by the fluorescent measurements of the outlet samples. The fitting process was applied by Solver Add-in of Excel application. This application allowed to modify the dispersivity, kinematic porosity, and mean velocity to get the best fit by an iterative process. The dispersivity and kinematic porosity were achieved by calculating the average of the results of the multiple experiments for each material and condition.
Under steady-state flow and saturated conditions in a homogeneous porous medium, the transport of suspended particles can be described by the advection and dispersion equation (Eq. 3) (Bear and Cheng, 2010).
where ∂C/∂t, solute concentration change over time (concentration/time); C, solute concentration (mass/volume); DL, longitudinal dispersion coefficient (area/time); X, distance (distance); u, average linear water velocity (distance/time).
The longitudinal dispersion coefficient is a linear function of the average velocity and dispersivity of the porous medium. It was defined as under saturated conditions by Bear (1988) and is given in Eq. 4.
where DL, longitudinal dispersion coefficient of the medium (area/time); De, effective dispersion coefficient of the medium (area/time); αL, longitudinal dispersivity (distance); and v, average flow velocity (distance/time).
The velocity of the groundwater ranges between 1 cm/day to 1 m/day. The effect of diffusion in the transport of solutes is negligible for the flow in a saturated porous medium for most of the studies (Raaijmakers, 2018). The tracer injection was implemented instantaneously. The length of the small outlet tube from the top of the material to the outlet where the samples were taken was measured and considered as only advective transport was valid there.
The recovered mass was calculated with the assumption of zero-mass loss. The recovered mass was used in the analytical solution of the 1D advection–dispersion equation as initially injected mass. Eq. 5 was used to calculate the recovered mass (Goldscheider and Drew, 2007).
where Q, flow rate (volume/time); c(t), tracer concentration by time (mass/volume); Δt, timestep (time).
The ADE for instantaneous injection under the assumptions of the 1D, semi-infinite, isotropic, and homogeneous porous medium was used to create analytical BTCs (Kreft and Zuber, 1978) (Eq. 6).
where Ci, concentration at the sampling point (mass/volume); M0, recovered mass (mass); x, distance between the sampling point and the injection point (distance); u, mean velocity (distance/time); D, dispersion coefficient (area/time); t, time (time); A, cross-sectional area (area); n, total porosity (dimensionless, ratio).
Microplastic Tracer Column Tests
A new Plexiglass column and experimental setup were built for this study. The length and the inner diameter (R2) of the column were 100 and 8 cm, respectively (Figure 5). The column was filled with the materials and then saturated. The PE particles were injected for a finite duration with a constant flow rate. The porous mediums were assumed as isotropic and homogenous. When the column is filled, X indicates the length of the porous medium. L1 is the distance between the sampling point and the outlet of the column. L2 is the distance between the PE suspension reservoir and the inlet of the column. Only advective transport was considered for L1 and L2.
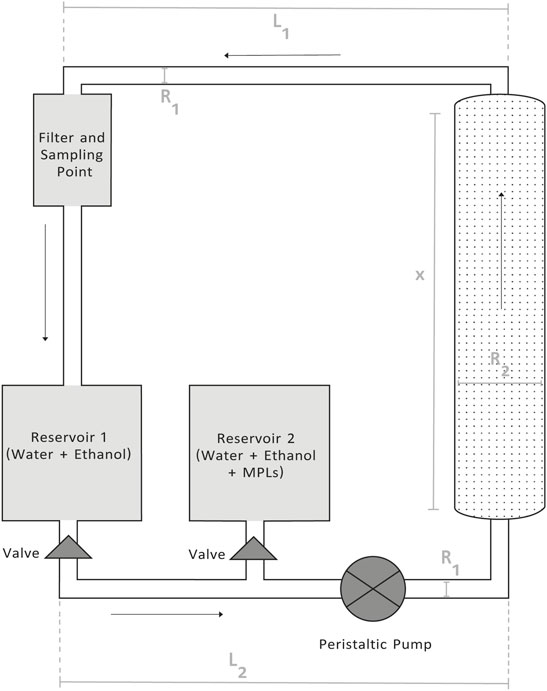
FIGURE 5. Experimental setup for the microplastic tests.
The density of the PE particles is lower than the distilled water. A suspension was needed for the homogenous injection of the MP. Ethanol and distilled water were used to create a lower density liquid. The ethanol and distilled water ratio were determined as 56 and 44%, respectively. The density of this liquid mixture was around 0.87 g/cm3. PE particles were successfully suspended within this liquid matrix. The column and the circulation system were built considering to minimize the evaporation of the ethanol.
The column was filled with the material and the ethanol–distilled water mix (Reservoir 1) was circulated for a while to saturate the porous medium. After the steady-state flow conditions were achieved, the valve of Reservoir 1 was closed, and the valve of Reservoir 2 was opened at the same time to start the finite-duration MP injection. The experimental system was cleaned after each experiment.
The PE concentration of the injection suspension injected volume and the mean flow rate for each experiment are given in Table 5.

TABLE 5. Parameters of the tests with PE.
TD-700 Laboratory Fluorometer (Turner Design) with a blue channel was used to measure the plastic concentrations of the samples. A fluorometer was used because it was determined that the PE particles have a certain level of reflectance for the blue channel. Yet, this was an indirect measurement. So, the inversion of the fluorometer measurements was performed. The inversion equations were found to convert the device measurements to the plastic concentrations. Six PE suspensions of known concentrations were prepared. These suspensions were measured by the fluorometer. The PE concentrations were plotted versus device measurements. A trendline with an equation was defined (Figure 6). These equations were used to convert the device measurements to the PE concentrations. The samples were collected in tubes with a cap to avoid the evaporation of the ethanol. PE concentrations of the samples were measured after the end of the experiment.
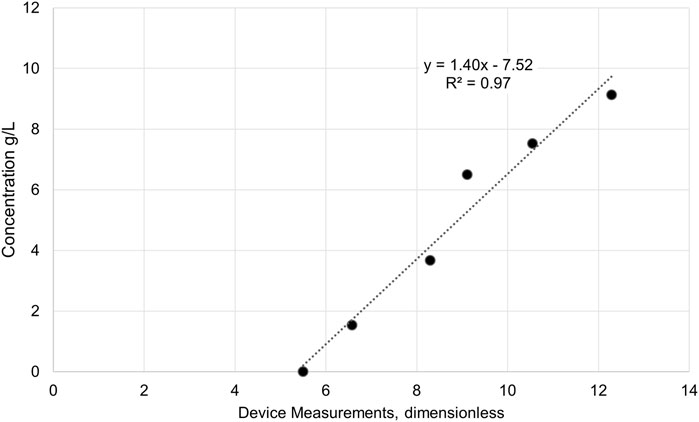
FIGURE 6. The equation for the inversion of the fluorometer measurements to PE concentrations.
The same principles with the solution method of the fluorescent tracer experiment were used also for the tests with PE (Eqs 3–5) (Bear, 1988; Goldscheider and Drew, 2007; Bear and Cheng, 2010). Only the longitudinal dispersion was considered. The porous media were assumed as isotropic and homogeneous. The 1D ADE equation for finite-duration injection by Ogata and Banks (1961) with the assumptions of the 1D, semi-infinite, isotropic, and homogeneous porous medium was used (Eq. 7). A similar procedure–the fluorescent tracer tests solution for the inverse modeling by using Solver Add-in on Excel–was applied for the PE tests with the additional modifiable parameters (concentration injected and injection time).
where C, solute concentration (mass/volume); C0, initial solute concentration (mass/volume); L, flow path length (distance); vx, average linear water flow velocity (distance/time); t, time since the injection of the solute (time); DL, longitudinal dispersion coefficient (area/time).
Results and Discussion
Fluorescent Tracer Column Tests
The fitted experimental and the analytical fluorescent tracer concentration BTCs for each medium and each column test were given in Supplementary Figure S3. The recovered mass was calculated with Eq. 5 and was used as an injected mass while doing analytical solution (Table 6). The results of the fluorescent tracer column tests, kinematic porosity (nk), and dispersivity (α) values for each medium are given in Table 7.
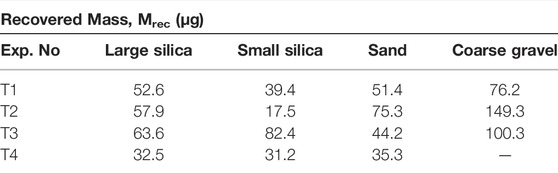
TABLE 6. Fluorescent tracer column test results: Recovered Mass, Mrec (µg).
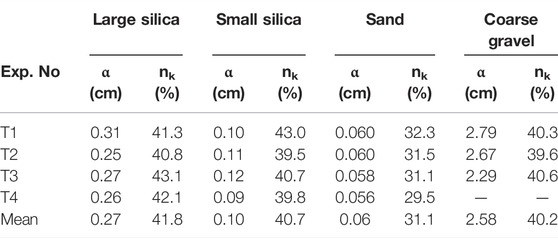
TABLE 7. Fluorescent tracer column test results: the kinematic porosity (nk) and dispersivity (α) values for the media.
Concentration measurements were initiated at the beginning of the first sample collection. However, the sampling was faster than the measurements. This caused a waiting time for most of the samples up to 10 min. It is expected that a certain level of fluorescent activity might have diminished during this period depending on the sensitivity of the fluorescent to the light.
The injected mass and the recovered mass were accepted as equal, based on the assumption that there was not any mass lost. The recovered mass was calculated using the sample measurements. The above-mentioned error in the sample measurements might have been valid for the calculations made by using recovered masses also.
Microplastic Tracer Column Tests
The PE particles did not transport up to the outlet of the column in the materials of small silica and sand. The MPs settled down at the very beginning of the inlet of the column and they clogged the inlet. The MPs were transported successfully through the column in the materials of large silica and coarse gravel.
For experiment P1 for large silica, the pumping flow rate was 70 cm3/min, the injection duration was 16 min, the injection concentration was 0.024 g/cm3, and the injection volume was 1120 cm3 which was lower than the pore volume (1996.04 cm3). The injected PE particles clogged the column entrance. There were not any PE particles in the samples and on the filter. The PE particles did not transport throughout the column.
In experiment P2 for large silica, the pumping flow rate was 104.8 cm3/min, the injection duration was 5 min, and the injection concentration was reduced from 0.024 g/cm3 to 0.01 g/cm3, and the injection volume was 524 cm3. The PE particles were transported up to the first 10 cm from the bottom of the column and then stopped there. There were a very low number of particles found on the filter and in the samples.
In experiment P3 for the large silica, the pumping flow rate was 206.28 cm3/min, the injection duration was 10 min, the injection concentration was 0.01 g/cm3 same as experiment P2, and the injection volume was 2062.8 cm3. The PE particles were transported up to the first 10 cm from the bottom of the column and then stopped there same as experiment P2. The amounts of the observed PE particles on the filter and in the samples were higher than those for experiment P2. Yet, the increase in the pumping flow rate did not create a significant change in the transport of the PE particles.
The injection concentration could not be decreased more because the lower values than 0.01 g/cm3 cannot be detected by the fluorometer used in this study. When the pore sizes of the porous media are evaluated, it is seen that the distribution graphs are not symmetrical. Therefore, when talking about pore sizes, they should be evaluated by considering maximum, minimum, and standard deviation values instead of average values. According to the pore size measurements of the large silica, it was seen that 97% of the pore sizes were higher than 800 µm while the PE particle size was between 200 and 500 µm. It is determined that the PE particle size and the pore size of the large silica were not suitable for the transport of the particles. The pore size measurement method might have caused a certain level of error. Also, there were not enough amount of PE particles smaller than 200–500 µm to perform further experiments. When column experiments are evaluated, Dong et al. (2021) and Chu et al. (2019) used a combination of 0.25–5 µm diameter MPs for 0.35–0.45 mm porous media and 1 µm diameter MPs with 0.25–0.30 mm grain size, respectively. Considering the study of Hou et al. (2020) as the experiment using larger size MPs, it was seen that MPs with 40–48 µm diameter and two different porous media with 1–2 and 2–4 mm grain sizes were used. In this study, MPs with a larger diameter were used. 200 and 500 μm MP were tested with 1.7–2.0 mm and 23–27 mm porous media.
Considering the previous results, the experiments were continued with the coarse gravel, which had larger particle and pore sizes than the other materials. In experiment P1 for coarse gravel, the pumping flow rate was 40.59 cm3/min, the injection duration was 50 min, the injection concentration was 0.02 g/cm3, and the injection volume was 2029.5 cm3 which was slightly higher than the pore volume (1910.09 cm3). The particle movement in the column was very slow. The particles mostly stopped at the bottom half of the column. The pumping flow rate was too low, thus the mean velocity of the injection liquid in the column was too slow. The mean velocity of the injection liquid in the column was 2.02 cm/min. It can be said that the 2.02 cm/min and lower velocities are not enough for the transport of the PE particles.
In experiment P2 for coarse gravel, the pumping flow rate was increased to 153.84 cm3/min, the injection duration was 15 min, the injection concentration was 0.02 g/cm3, and the injection volume was 2307.6 cm3 which was higher than the pore volume (1910.09 cm3). The PE particles were successfully transported throughout the experimental system.
Eq. 7 was used for the analytical solution of the P2 experiment to estimate the transport parameters. The analytical BTC was fitted to the experimental BTC by the manipulation of the injected concentration (C0), injection duration (Tinj), dispersivity (α), and mean velocity (u). These four parameters had to be changed by the Solver Add-in in order to get a reasonable fit. The fitted BTC are shown in Figure 7. The results of the parameters are given in Table 8.
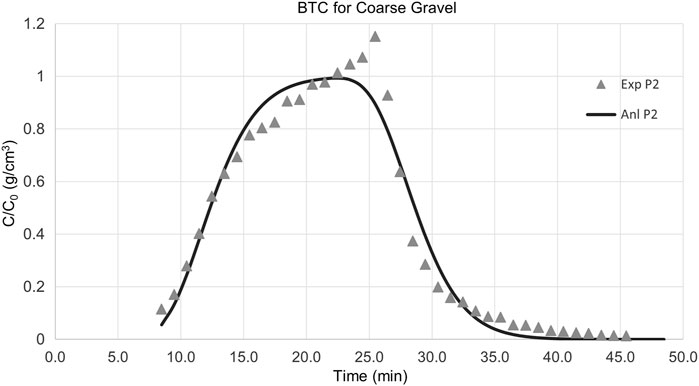
FIGURE 7. BTCs of plastic particle experiment P2 for coarse gravel.

TABLE 8. The calculated values of the parameters for the plastic particle experiment P2 for coarse gravel.
The PE experiments resulted in 3.02 cm for the dispersivity of the coarse gravel while the fluorescent tracer experiments resulted in 2.58 cm for the same medium. These values are in the same decimal value, and they are quite similar in terms of assessing the dispersivity of a medium.
The ethanol–water-PE suspension was prepared for the injection in order to avoid the sedimentation of the PE particles in reservoir 2 and the column. The experimental setup was built as close as possible to minimize the evaporation of the ethanol to sustain the stable suspension of the injection. Yet, the experimental setup was open to the atmosphere during the sampling. This might have caused a certain level of evaporation of the ethanol which might change the suspension stability.
For the P2 experiment, the recovered mass was calculated by Equation 5 using the measured concentration of the samples. The recovered mass was 26.7 g. According to the Solver Add-in fitting, the injected PE amount was calculated as 23.1 g. It was known that the injected/pumped PE mass was 46.2 g. The coherence between the recovered mass and the Solver calculated mass indicates the consistency between the results. The difference between the known injected mass (46.2 g) and the calculated masses (26.7 and 23.1 g) points out that 58–50% of the PE particles must be retained in the porous medium. Also, the relative method for the measurements of the PE samples might have a certain level of error margin on the PE mass calculations even though the recession coefficient of the calibration was found to be 0.97.
The ADE (Eq. 6) employed for the PE tracer test results is often used for the investigation of the transport of very small particles like fluorescents. In the present study, the PE particle sizes were much bigger than those. The BTCs don’t fully/well overlapped/fitted may lead to a discussion of the appropriateness of the ADE for the PE transport.
The transport of the PE particles might have also been affected by the zeta potential (electric charge) between both PE–PE and PE-media. If the particle and porous media have the same electric charge (positive–positive or negative–negative), that would make the PE particles easier to move through the porous medium. The change in ionic strength and pH and the presence of humic acid in the environment are the factors that directly affect the zeta potential (Chu et al., 2019; Dong et al., 2021). The zeta potential of the particles and porous media was not examined within the scope of this research.
Conclusion
The investigation of the transport of MPs in groundwater is quite uninvestigated and thus new. According to the literature, the underlying fundamental consequence is that the vertical movement of microplastics may lead to the contamination of the groundwater.
In this study, fluorescent and MP tracers were used in 1D column experiments with different kinds of porous media. The PE particles of 200–500 µm size were expected to pass through the large silica whose 97% of the pore size is higher than 800 µm. However, the PE particles were not transported in the experiment of the large silica with various parameters. The small silica and sand media had smaller size pores and they were found to be not suitable for the PE particle transport. However, the fact that the porosity distribution graphs are not symmetrical, and the presence of small pores should be taken into account. When evaluating the pore size, it needs to be considered by using the maximum, minimum, and standard deviation values.
The coarse gravel with a much larger pore size was used with the same size PE particles. The results of fluorescent tracer and MP tracer were compared. The dispersivity results showed that the values were quite close. It is found that the mean velocity (u) is an important parameter for the transportation of the PE particles in a saturated porous medium. The experiments showed that the PE particles (200–500 µm size) cannot be transported if the mean velocity is lower than 2.02 cm/min. When natural conditions like groundwater in an actual aquifer are considered, the mean velocities are usually quite lower than those in the experiments performed in this study. So, the accumulation of the PE particles in aquifers might be an additional issue and requires further investigation.
For a future perspective, the retention parameters caused by electrical charge need to be studied. Different media, solution mixtures, changes in pH, the presence of organic material, and the size of plastic particles need to be taken into consideration in the transportation or accumulation of microplastics. The effect of the change in these factors on transport and accumulation should be considered individually or according to their co-existence. 1D tracer experiments using a smaller size of PE particles with artificial (large silica and small silica) and natural media (sand and gravel) will be performed to further understand the transport processes of the MPs in a saturated porous medium. The ratio between the PE particle size and the pore/grain size of the medium will be investigated to assess the suitable conditions for PE particle transport. Advanced numerical modeling will be implemented to better analyze the experimental data.
Data Availability Statement
The raw data supporting the conclusions of this article will be made available by the authors, without undue reservation.
Author Contributions
PL, MR, and BK contributed to conception, and design of the study. CF and BN contributed to the experiments. HO and CS performed the experiments, data analysis and writing the manuscript. All authors discussed the results and commented on the manuscript.
Conflict of Interest
The authors declare that the research was conducted in the absence of any commercial or financial relationships that could be construed as a potential conflict of interest.
Publisher’s Note
All claims expressed in this article are solely those of the authors and do not necessarily represent those of their affiliated organizations, or those of the publisher, the editors, and the reviewers. Any product that may be evaluated in this article, or claim that may be made by its manufacturer, is not guaranteed or endorsed by the publisher.
Supplementary Material
The Supplementary Material for this article can be found online at: https://www.frontiersin.org/articles/10.3389/fenvs.2022.885875/full#supplementary-material
References
Bear, J., and Cheng, A. H.-D. (2010). Modeling Groundwater Flow and Contaminant Transport. Dordrecht: Springer Netherlands. doi:10.1007/978-1-4020-6682-5
Bear, J. (1988). Dynamics of Fluids in Porous Media. New York: American Elsevier Publishing Company.
Bläsing, M., and Amelung, W. (2018). Science of the Total Environment Plastics in Soil : Analytical Methods and Possible Sources. Sci. Total Environ. 612, 422–435. doi:10.1016/j.scitotenv.2017.08.086
Chu, X., Li, T., Li, Z., Yan, A., and Shen, C. (2019). Transport of Microplastic Particles in Saturated Porous Media. Water 11, 2474. doi:10.3390/w11122474
DeNovio, N. M., Saiers, J. E., and Ryan, J. N. (2004). Colloid Movement in Unsaturated Porous Media: Recent Advances and Future Directions. Vadose Zo. J. 3, 338–351. doi:10.2113/3.2.338
Dong, S., Xia, J., Sheng, L., Wang, W., Liu, H., and Gao, B. (2021). Transport Characteristics of Fragmental Polyethylene Glycol Terephthalate (PET) Microplastics in Porous Media under Various Chemical Conditions. Chemosphere 276, 130214. doi:10.1016/j.chemosphere.2021.130214
Dong, Z., Qiu, Y., Zhang, W., Yang, Z., and Wei, L. (2018). Size-Sependent Transport and Retention of Micron-Sized Plastic Spheres in Natural Sand Saturated with Seawater. Water Res. 143, 518–526. doi:10.1016/j.watres.2018.07.007
GESAMP (2015). Sources, Fate and Effects of Microplastics in the Marine Environment: A Global Assessment. Editor P. J. Kershaw, London.
Goeppert, N., and Goldscheider, N. (2021). Experimental Field Evidence for Transport of Microplastic Tracers over Large Distances in an Alluvial Aquifer. J. Hazard. Mater. 408, 124844. doi:10.1016/j.jhazmat.2020.124844
Goldscheider, N., and Drew, D. (2007). Methods in Karst Hydrogeology: IAH: International Contributions to Hydrogeology. 1st Edition, 26. London: CRC Press. doi:10.1201/9781482266023
Hou, J., Xu, X., Lan, L., Miao, L., Xu, Y., You, G., et al. (2020). Transport Behavior of Micro Polyethylene Particles in Saturated Quartz Sand: Impacts of Input Concentration and Physicochemical Factors. Environ. Pollut. 263, 114499. doi:10.1016/j.envpol.2020.114499
Hüffer, T., Metzelder, F., Sigmund, G., Slawek, S., Schmidt, T. C., and Hofmann, T. (2019). Polyethylene Microplastics Influence the Transport of Organic Contaminants in Soil. Sci. Total Environ. 657, 242–247. doi:10.1016/j.scitotenv.2018.12.047
Ivar Do Sul, J. A., and Costa, M. F. (2014). The Present and Future of Microplastic Pollution in the Marine Environment. Environ. Pollut. 185, 352–364. doi:10.1016/j.envpol.2013.10.036
Kreft, A., and Zuber, A. (1978). On the Physical Meaning of the Dispersion Equation and its Solutions for Different Initial and Boundary Conditions. Chem. Eng. Sci. 33, 1471–1480. doi:10.1016/0009-2509(78)85196-3
Kumar, M., Xiong, X., He, M., Tsang, D. C. W., Gupta, J., Khan, E., et al. (2020). Microplastics as Pollutants in Agricultural Soils. Environ. Pollut. 265, 114980. doi:10.1016/j.envpol.2020.114980
Law, K. L., and Thompson, R. C. (2014). Microplastics in the Seas. Science 345, 144–145. doi:10.1126/science.1254065
Li, H., Lu, X., Wang, S., Zheng, B., and Xu, Y. (2021a). Vertical Migration of Microplastics along Soil Profile under Different Crop Root Systems. Environ. Pollut. 278, 116833. doi:10.1016/j.envpol.2021.116833
Li, J., Song, Y., and Cai, Y. (2020). Focus Topics on Microplastics in Soil: Analytical Methods, Occurrence, Transport, and Ecological Risks. Environ. Pollut. 257, 113570. doi:10.1016/j.envpol.2019.113570
Li, M., Zhang, X., Yi, K., He, L., Han, P., and Tong, M. (2021b). Transport and Deposition of Microplastic Particles in Saturated Porous Media: Co-effects of Clay Particles and Natural Organic Matter. Environ. Pollut. 287, 117585. doi:10.1016/j.envpol.2021.117585
Maaß, S., Daphi, D., Lehmann, A., and Rillig, M. C. (2017). Transport of Microplastics by Two Collembolan Species. Environ. Pollut. 225, 456–459. doi:10.1016/j.envpol.2017.03.009
Mintenig, S. M., Löder, M. G. J., Primpke, S., and Gerdts, G. (2019). Low Numbers of Microplastics Detected in Drinking Water from Ground Water Sources. Sci. Total Environ. 648, 631–635. doi:10.1016/j.scitotenv.2018.08.178
O'Connor, D., Pan, S., Shen, Z., Song, Y., Jin, Y., Wu, W.-M., et al. (2019). Microplastics Undergo Accelerated Vertical Migration in Sand Soil Due to Small Size and Wet-Dry Cycles. Environ. Pollut. 249, 527–534. doi:10.1016/j.envpol.2019.03.092
Ogata, A., and Banks, R. B. (1961). A Solution of the Differential Equation of Longitudinal Dispersion in Porous Media. Washington: United States Government Printing Office.
Panno, S. V., Kelly, W. R., Scott, J., Zheng, W., McNeish, R. E., Holm, N., et al. (2019). Microplastic Contamination in Karst Groundwater Systems. Groundwater 57, 189–196. doi:10.1111/gwat.12862
Raaijmakers, B. (2018). Solute Transport in Porous Media; An Experimental Pore-Scale Study Using Physical Micromodels. MSc Thesis. Utrecht: Utrecht University.
Ren, Z., Gui, X., Wei, Y., Chen, X., Xu, X., Zhao, L., et al. (2021a). Chemical and Photo-Initiated Aging Enhances Transport Risk of Microplastics in Saturated Soils: Key Factors, Mechanisms, and Modeling. Water Res. 202, 117407. doi:10.1016/j.watres.2021.117407
Ren, Z., Gui, X., Xu, X., Zhao, L., Qiu, H., and Cao, X. (2021b). Microplastics in the Soil-Groundwater Environment: Aging, Migration, and Co-transport of Contaminants - A Critical Review. J. Hazard. Mater. 419, 126455. doi:10.1016/j.jhazmat.2021.126455
Rillig, M. C., Ziersch, L., and Hempel, S. (2017). Microplastic Transport in Soil by Earthworms. Sci. Rep. 7, 1362. doi:10.1038/s41598-017-01594-7
Sarkar, B., Dissanayake, P. D., Bolan, N. S., Dar, J. Y., Kumar, M., Haque, M. N., et al. (2022). Challenges and Opportunities in Sustainable Management of Microplastics and Nanoplastics in the Environment. Environ. Res. 207, 112179. doi:10.1016/j.envres.2021.112179
Thompson, R. C., Olson, Y., Mitchell, R. P., Davis, A., Rowland, S. J., John, A. W. G., et al. (2004). Lost at Sea: Where is all the Plastic? Science 304, 838. doi:10.1126/science.1094559
World Health Organization (2006). in Protecting Groundwater for Health: Managing the Quality of Drinking-Water Sources. Editors O. Schmoll, G. Howard, J. Chilton, and I. Chorus (London: IWA Publishing).
Waldschläger, K., Lechthaler, S., Stauch, G., and Schüttrumpf, H. (2020). The Way of Microplastic through the Environment - Application of the Source-Pathway-Receptor Model (Review). Sci. Total Environ. 713, 136584. doi:10.1016/j.scitotenv.2020.136584
Windsor, F. M., Durance, I., Horton, A. A., Thompson, R. C., Tyler, C. R., and Ormerod, S. J. (2019). A Catchment‐Scale Perspective of Plastic Pollution. Glob. Change Biol. 25, 1207–1221. doi:10.1111/gcb.14572
Keywords: microplastics, pollution, transport, porous medium, one-dimension, tracer tests, column tests
Citation: Okutan HM, Sağir Ç, Fontaine C, Nauleau B, Kurtulus B, Le Coustumer P and Razack M (2022) One-Dimensional Experimental Investigation of Polyethylene Microplastic Transport in a Homogeneous Saturated Medium. Front. Environ. Sci. 10:885875. doi: 10.3389/fenvs.2022.885875
Received: 01 March 2022; Accepted: 20 May 2022;
Published: 08 July 2022.
Edited by:
Andrew Hursthouse, University of the West of Scotland, United KingdomReviewed by:
Manish Kumar, National Environmental Engineering Research Institute (CSIR), IndiaElvis Genbo Xu, University of Southern Denmark, Denmark
Copyright © 2022 Okutan, Sağir, Fontaine, Nauleau, Kurtulus, Le Coustumer and Razack. This is an open-access article distributed under the terms of the Creative Commons Attribution License (CC BY). The use, distribution or reproduction in other forums is permitted, provided the original author(s) and the copyright owner(s) are credited and that the original publication in this journal is cited, in accordance with accepted academic practice. No use, distribution or reproduction is permitted which does not comply with these terms.
*Correspondence: Hande Mahide Okutan, aG5keWVzaWxAZ21haWwuY29t