 Reza Tabish1,2
 Zefa Yang
94% of researchers rate our articles as excellent or good
Learn more about the work of our research integrity team to safeguard the quality of each article we publish.
Find out more
ORIGINAL RESEARCH article
Front. Environ. Sci., 30 May 2022
Sec. Environmental Informatics and Remote Sensing
Volume 10 - 2022 | https://doi.org/10.3389/fenvs.2022.885346
This article is part of the Research TopicInSAR Crustal Deformation Monitoring, Modeling and Error AnalysisView all 12 articles
The settlement (or subsidence) of mine waste dump is likely to cause landslides, thereby imposing threats on the safety of human beings and other local properties. Hence, it is essential to accurately predict the settlement for the early-warning of settlement-induced geohazards. Traditional mechanical methods require in situ mechanical parameters and the geological structure of mine waste dump, narrowing their practical applications. In this paper, we proposed a remote sensing-based method for predicting the settlement of mine waste dump without the requirement for field observations. Firstly, the historical settlement and thickness of mine waste dump were measured by space-borne interferometric synthetic aperture radar (InSAR) and photogrammetry techniques, respectively. Secondly, the temporal evolution of the settlement of mine waste dump was described by a secondary consolidation model. Thirdly, the parameters of the secondary consolidation model were inverted based on the InSAR-measured historical settlements and photogrammetry-estimated thickness. Finally, the evolution trend of the settlement of the mine waste dump was predicted with the secondary consolidation model and its inverted parameters. The proposed method was tested over a mine waste dump in Weijiamao open-pit mine, China. The result shows that the root mean square error of the predicted time-series settlement is about 0.8 cm. The presented method will be beneficial to the assessment and early-warning of the settlement-related geohazards of mine waste dumps over a large area.
For open-pit mining activities, earth materials (e.g., rock and soil) overlying ore deposits have to be mined. These materials are usually placed in heaps or fills (referred to as mine waste dump) over an area where they will not restrict the exploration of underground ore. Mine waste dump, especially associated with large open-pit mining activities, is possibly one type of the largest man-made structure in terms of volume and mass. For instance, a mine waste dump located in the Elk Valley region of British Columbia, Canada associated with a large coal open-pit mining has a cumulative height of up to 400 m and a mass of 8.5 billion tons of earth materials (Hawley and Cunning 2017). Since mine waste dump generally consists of soil and/or disaggregated rock (Lianhuan et al., 2018; Cho and Song 2014), the weak and loose structure of mine waste dump would cause settlement (or subsidence). The settlement potentially causes geohazards like landslides and further impose threats on the safety of human beings, mine’s equipment, and other infrastructures around the mine (Pinto et al., 2014). Therefore, it is essential to accurately predict the settlement of mine waste dump for assessing and controlling the settlement-related geohazards.
The numerical analysis is one of the most common methods for predicting the settlement of mine waste dump and further assessing the geohazard risks (Behera et al., 2016; Verma et al., 2013; Ashutosh et al., 2013). In the numerical analysis, the geotechnical parameters and material samples of the concerned mine waste dumps are firstly in situ collected. Then, the material properties of the collected samples (e.g., unit weight, cohesion, internal friction angle, and Young’s modulus) are analyzed by laboratory tests. Finally, numerical methods (e.g., finite element method and limit equilibrium method) are utilized to predict the potential settlement and assess the risk of settlement-related geohazards. The numerical analysis methods can take the complex and irregular geometries, various types of material properties of mine waste dumps into a model, thus it usually could reliably assess the geohazard risks, if the geotechnical and material parameters are accurate (Kainthola et al., 2013). However, this, in return, implies that the numerical analysis methods rely on the geotechnical properties and material parameters of mine waste dump that need to be field surveyed or laboratory tested. Limited by the high cost, labor-intensive, and time-consuming characteristics of field surveying or laboratory tests, the numerical analysis methods are usually used in a local mine waste dump, rather than in numerous dumps in a large area simultaneously.
Interferometric synthetic aperture radar (InSAR) is a useful remote sensing technique, which is able to monitor ground surface displacements over a wide coverage (e.g., with a swath width of 250 km for Sentinel-1) with a high spatial resolution (e.g., 0.25 m for TerraSAR-X) (Gabriel et al., 1989; Massonnet et al., 1993; Massonnet and Feigl 1998; Bürgmann et al., 2000). It has become an important alternative to terrestrial surveying techniques for monitoring surface deformation relating to various geohazard events, including landslides (Pierluigi et al., 2019; Carlà et al., 2019; Li et al., 2020), earthquakes (Atzori et al., 2019; Yu et al., 2020), volcanic eruptions (Suwarsono et al., 2019), land settlement associated with mining activities (Chen et al., 2020; Yuan et al., 2021; Qingsong et al., 2021), and consolidation processing over mine waste dumps (Gong et al., 2021; Williams et al., 2021; Juan et al., 2021). If we can predict the settlement trend of mine waste dump based on InSAR observations of historical settlement, the geotechnical and material parameters required by the numerical analysis methods will be unnecessary. In other words, the settlement of numerous mine waste dumps over a large area can be predicted without the requirement for field observations in theory. This cannot be achieved by numerical analysis methods. However, to the best of our knowledge, it is rather rare to do that to date Roland et al., 2020.
In this paper, we proposed a new method for predicting the settlement of mine waste dump based on multi-source remote sensing techniques and a secondary consolidation model. More specifically, the historical settlement and thickness of the concerned mine waste dump were then estimated by space-borne InSAR and high-resolution photogrammetry techniques. A secondary consolidation model was then utilized to model the settlement evolution of mine waste dump on a basis of pixel-by-pixel. Thirdly, the parameters of the secondary consolidation model were inverted in the least-square sense. Finally, the settlement trend of the concerned mine waste dump was predicted based on the inverted model parameters and the secondary consolidation model. The proposed method is theoretically able to predict ground surface settlement of mine waste dump in a long time due to soil consolidation without in situ surveying. Therefore, it offers a new tool for assessing the stability risk of waste dump over a wide area (e.g., thousands of square kilometers) that cannot be achieved by traditional numerical analysis methods.
In this study, a mine waste dump located in Weijiamao open-pit mine, China (marked by the red star in Figure 1), was selected to test the proposed method. The mine waste dump started to normally operate in the year of 2012 and ceased the operation in the year 2017. Since the mine waste dump is located above the loess plateau, and some infrastructures (e.g., industry buildings and roads) are nearby it (see Figure 1D). Therefore, it is essential to predict the settlement of the mine waste dump for assessing its stability and assessing geohazards (e.g., landslides).
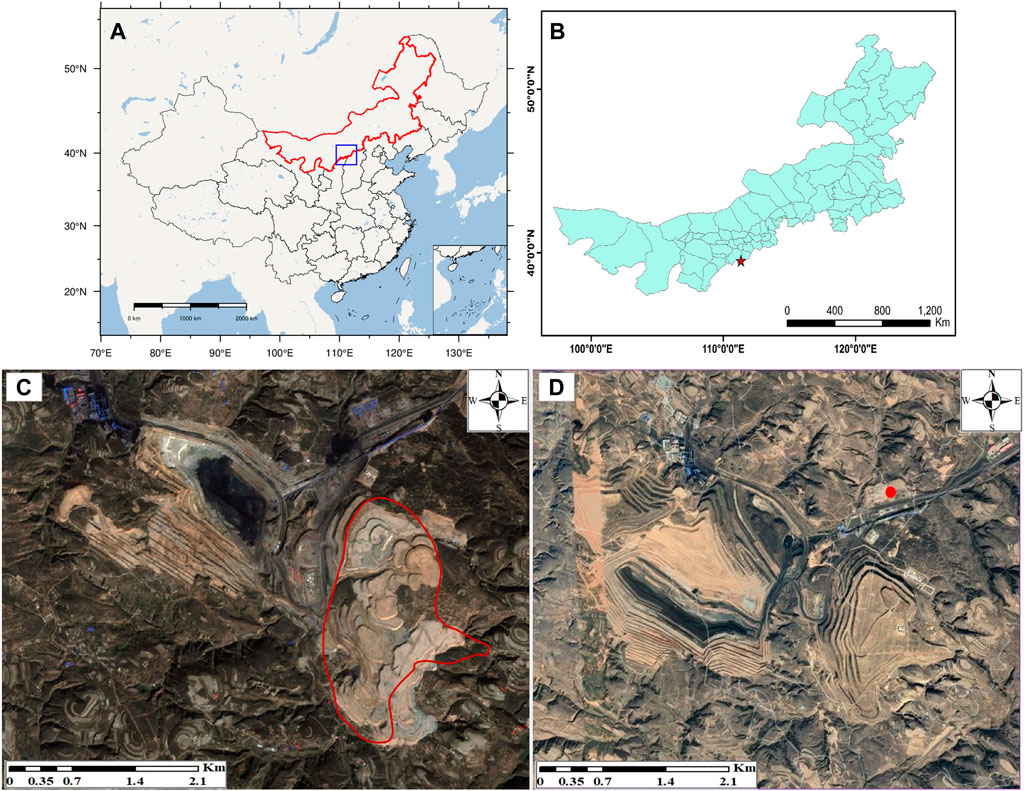
FIGURE 1. (A,B) Location of the study area; (C,D) are optical images of the focused mine waste dump in the years of 2012 and 2019, respectively. The red circle in (D) represents the location of the selected reference pixel for InSAR processing.
Ninety SAR images spanning from 30 May 2017 to 14 May 2020 over the study area were firstly collected for monitoring the historical settlement. These 90 SAR images were acquired by the Terrain Observation with Progressive Scan imaging mode of the C-band Sentinel-1A satellite in an ascending orbit (track 113 and frame 126). The pixel spacing of the collected Sentinel-1 SAR images is about 2.3 and 14.1 m in the range and azimuth directions, respectively. The mean temporal separation of the collected SAR images is about 12 days.
In addition, two pairs of ZiYuan-3 (ZY-3) stereo images were collected for extracting high-resolution digital elevation models (DEMs) and further estimating terrain elevation and its changes pattern in this study. The ZY-3 surveying satellite was launched on 9 January 2012, and it can acquire images from nadir, forward, and backward viewing angles with spatial resolutions of 2.5, 3.5, and 3.5 m, respectively (Zhang et al., 2014). In this study the collected ZY-3 image pairs were acquired on 10 October 2012 (close to the date of the normal operation of the concerned mine waste dump), and 5 May 2019 (after the cease date of dumping operation), respectively.
Time-series InSAR techniques can observe historical displacements of Earth’s surface over time based on a series of co-registered SAR acquisitions. In the past decades several algorithms or toolbox have been developed for time series InSAR processing (Osmanoğlu et al., 2016), e.g., Interferometric Point Target Analysis (IPTA) (Werner et al., 2003), Small Baseline Subset (SBAS) (Berardino et al., 2002), Permanent Scatterer InSAR (PSInSAR) (Ferretti et al., 2001), SqueeSAR (Ferretti et al., 2011), and so on. In this section, we take the IPTA toolbox as an example to briefly review the main processing steps to generate time-series displacements.
The IPTA processing begins with the stack of co-registered SAR images for the construction of interferometric pairs. Firstly, point targets are selected based on some indicators such as low temporal variability of the backscatter and high coherence. Then, the stacks of interferometric phases on those point targets are processed by traditional differential InSAR chains (e.g., differential interferogram generation, adaptive filtering, and phase unwrapping). Thirdly, a stepwise iteration is conducted to estimate linear deformation phases, height error phases, and non-linear deformation phases at those point targets. Finally, time-series displacements at those point targets along the line-of-sight (LOS) direction are obtained by transforming the linear and non-linear deformation phases. Since mine waste dump is primarily made of soft soil, and the settlement generally dominates the deformation; that is, the horizontal component of deformation is generally much smaller than the settlement. Consequently, we neglected the contribution of horizontal movements on InSAR LOS deformation and further convert the LOS deformation to settlement by:
where
The gradual reduction in the volume of soil under sustained load is called consolidation (Terzaghi et al., 1996). Commonly, the consolidation settlement is divided into the primary stage which is normally expected load applied on the soil by the dissipation of pore pressure, and the secondary consolidation stage which is continuing under constant effective stress (Hanrahan and Barden 1968). In soft soil such as mine waste dump clearly, the primary consolidation usually occurs in the operation period, and the secondary consolidation will continue after the operation. Consequently, InSAR-measured subsidence is mainly due to the secondary consolidation, if we neglect other factors potentially causing subsidence (e.g., rainfall) (Zhang et al., 2019). According to (EBMEG 2006), the secondary consolidation can be modeled by:
where
In Eq. 2, the
Where
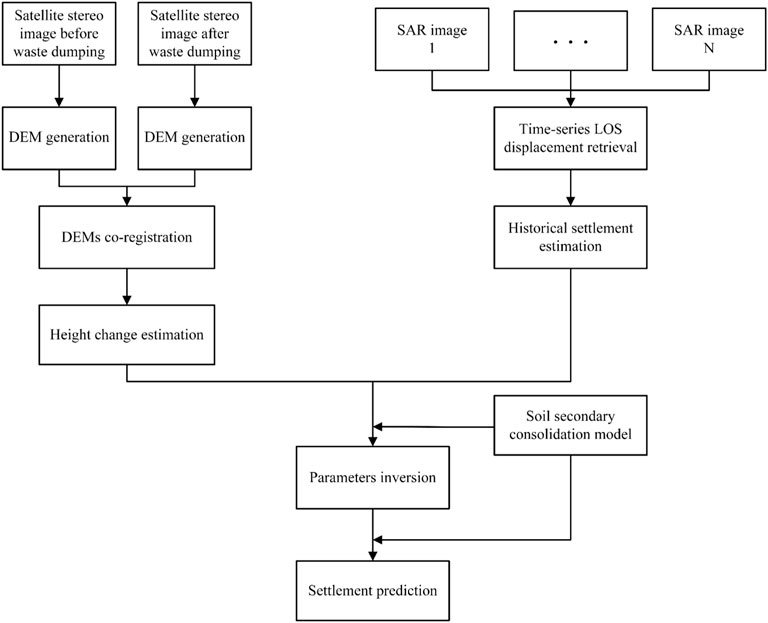
FIGURE 2. The workflow of the presented method.
In this study, the collected 90 C-band ascending Sentinel-1A images from 30 May 2017 to 14 May 2020, were processed using the IPTA InSAR toolbox. More specifically, the image acquired on December 10, 2019, was selected to be the master image, and the remaining images were co-registered with it. Then, a threshold of the maximum perpendicular baseline of 200 m and the longest temporal separation of 90 days was designated to select small baseline interferograms (whose temporal-spatial baselines are shown in Figure 3). Then, the IPTA was used to process the formed small baseline interferograms to generate time-series LOS displacements from 30 May 2017 and 14 May 2020 (see Supplementary Figure S1 in Supplementary Material). In which, a pixel located in a factory that is considered to be stable (marked by a red circle in Figure 1D) nearby the focused mine waste dump was selected to be the reference pixel, in order to reduce error propagation as much as possible (Cao et al., 2021). In addition, the phase errors due to uncertainties of the used external digital elevation model was iteratively estimated in the IPTA processing chain. Finally, the historical time-series settlement of the mine waste dump was estimated using Eq. 1.
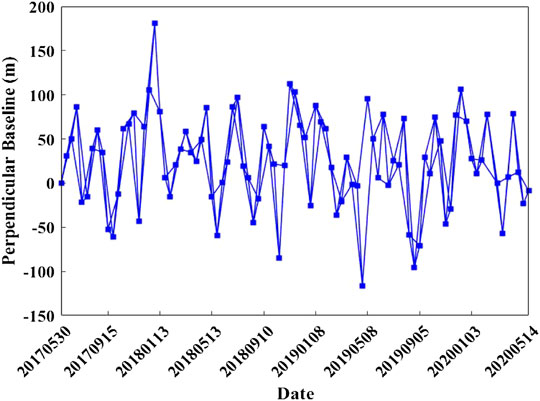
FIGURE 3. The temporal and perpendicular baseline of the formed small baseline interferograms.
Figure 4 shows the estimated accumulative settlement and the annual settlement velocity of the concerned mine waste dump from 30 May 2017 to 14 May 2020. Owing to the bare surface, the mine waste dump was monitored with dense InSAR observations (a total of 4658 coherent points). As is seen in Figure 4, the settlement on the edge of the mine waste dump is smaller than that on the central part. In addition, the maximum settlement rate and accumulative settlement in the mine waste dump, which occurred in the middle toward the south-west part of the mine waste dump, are −0.103 m/yr and −0.369 m, respectively. Such a large settlement is likely to cause geohazards. To analyze the temporal evolution of mine waste dump settlement intuitively, we plotted the time-series settlement at randomly selected three points (P1- P3, marked by black triangles in Figure 4A). The results are plotted in Figure 5. As is seen, the time-series settlement from 30 May 2017 to 14 May 2020 at these three points approximately follows an exponential growth. This is a typical pattern associated with secondary consolidation of soil.
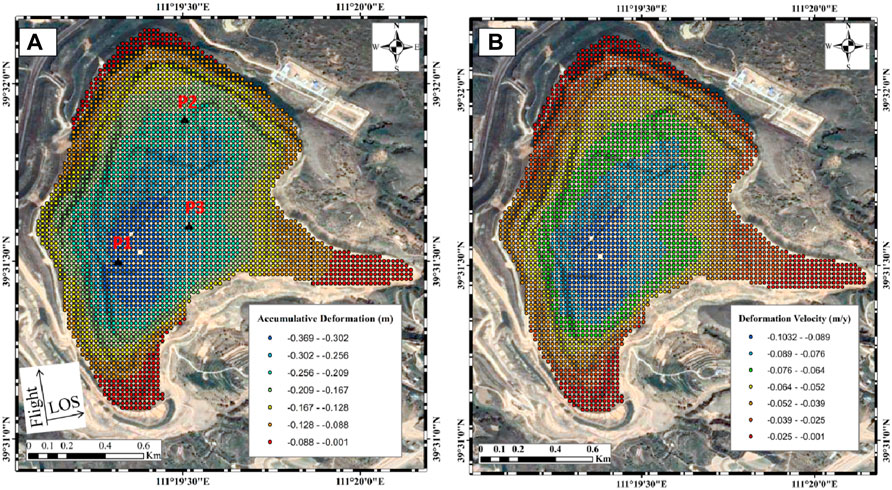
FIGURE 4. Accumulative settlement (A) and the annual settlement velocity (B) over the focused mine waste dump in the period from 30 May 2017 to 14 May 2020.
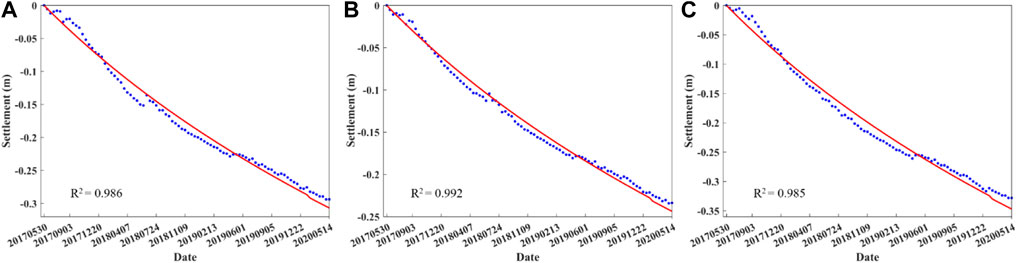
FIGURE 5. (A–C): Time-series settlement at the points P1-P3 whose locations are marked by black triangles in Figure 4.
Prior to the parameter estimation of the secondary consolidation model, the soil thickness of the mine waste dump was estimated using photogrammetry technique based on ZY-3 stereo images. The main procedure for generating DEMs with ZY-3 stereo pairs are three steps. Firstly, ground control points (GCPs) and tie points are manually and/or automatically be collected from a different image view. The block adjustment is then conducted based on the collected GCPs and tie points. Finally, DEM is generated based on the ZY-3 stereo pairs. Readers can refer to (Yanan et al., 2012; Guo et al., 2015) for the more detailed processing of DEM generation using stereo images. As stated in Datasets Section, the ZY-3 satellite can acquire stereo images from nadir, forward, and backward viewing angles. Generally, the accuracy of the generated DEMs using the stereo pair formed with the forward and backward viewing images is higher than that with other views (Cai et al., 2015; Liu et al., 2021). Thus, we generated DEMs of the mine waste dump using the ZY-3 forward and backward stereo pairs in the years of 2012 and 2019 for estimating the dump soil thickness.
More specifically, to associate projection coordinates with the location on a raw image, 20 well-distributed GCPs were manually collected. With the increase in the number of GCPs, it can improve the accuracy and quality of DEMs (Shen et al., 2017). The GCPs were selected on the stable area, such as road intersections, the corner of the road, the building, etc. The tie points were automatically obtained by the Fast Fourier Transform Phase matching method on overlap area in the stereo images and achieved sub-pixel accuracy. The block adjustment model was used based on the rational function model. Note that, before calculating the soil thickness of the mine waste dump, the slope and aspect-based method (Nuth and Kääb 2011) was used to co-register the two DEMs in the years 2012 and 2019 (shown in Figures 6A,B), in order to ensure that the corresponding pixels in the two DEMs represent the same geo-location.
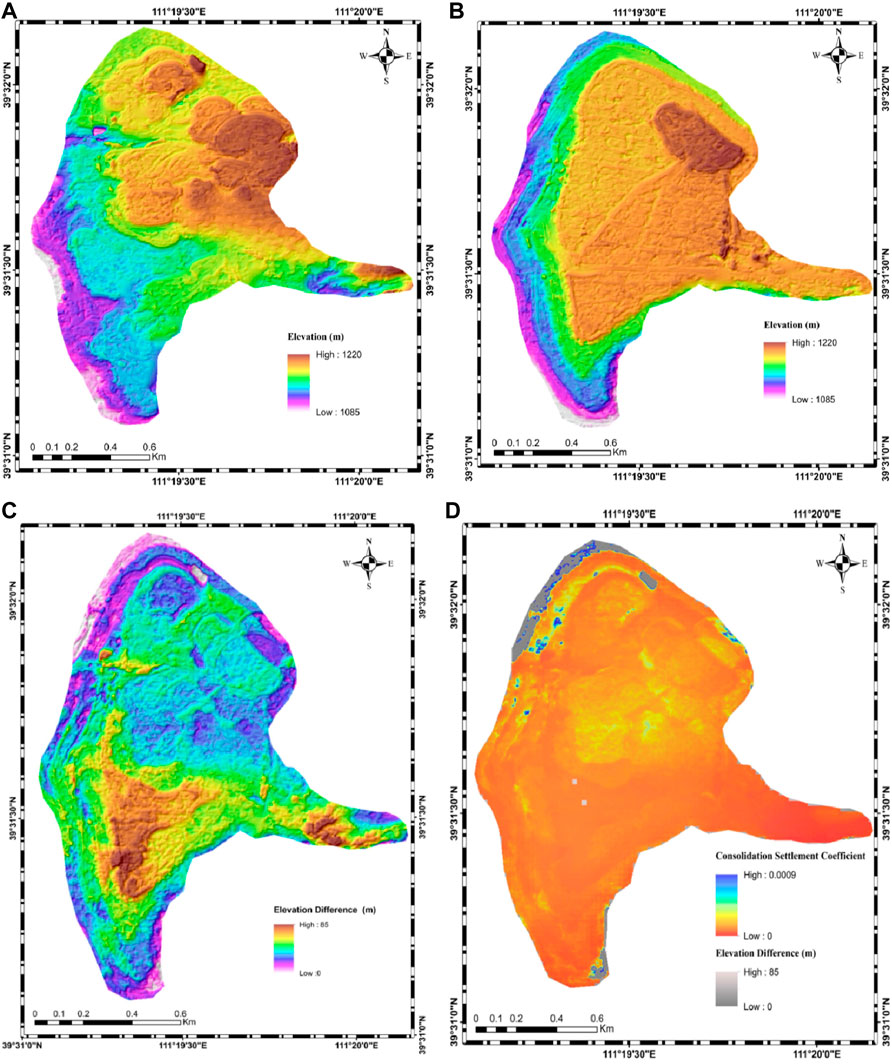
FIGURE 6. (A,B) are the generated DEMs in the years 2012 and 2019; (C) Soil thickness of the mine waste dump estimated by calculating the difference of the two co-registered ZY-3 DEMs in the years of 2012 and 2019, respectively; (D) Estimated parameters of the secondary consolidation model and its background is the elevation difference between the years 2012 and 2019.
Figure 6C shows the soil thickness of the mine waste dump estimated by calculating the difference of these two co-registered DEMs in the years of 2012 and 2019. In which, the positive value indicates increased elevation, and the negative value indicates decreased elevation. As can be seen from Figure 6C, the maximum thickness of the mine waste dump by May 2019 is about 85 m, which occurs in the center-south and west-east parts. The location of the maximum thickness that occurred is spatial coincidence with the maximum settlement occurred. This validates again that the settlement of mine waste dumps is related to soil thickness.
Since the coefficient of the secondary consolidation could be considered as constant at the same point, we could theoretically estimate it using the thickness of the mine waste dump and historical settlement in any period of the secondary consolidation. It should be pointed out that the mine waste would be tamped using tools like road rollers after putting them in the dump site, thus the primary consolidation of the mine waste dump has been completed during the tamping operation. This implies that the time-series settlement obtained by InSAR from 2017 to 2020 were mainly caused by soil secondary consolidation. Hence, we estimated the coefficient of the secondary consolidation model at each target point of the IPTA processing using Eq. 3 based on the estimated soil thickness and the InSAR observations of time-series settlement from 30 May 2017 to 5 May 2019 (near to the acquisition date of 14 May 2019 of the lastest ZY-3 images in this study). Note that the time-series InSAR observations of settlement from 5 May 2019 and 14 May 2020 were used to validate the accuracy of the predicted settlement due to the unavailability of in situ settlements. The estimated coefficients of the secondary consolidation model of the mine waste dump were plotted in Figure 6D.
Having obtained the coefficients of the mine waste dump, settlement in the future can be predicted using Eq. 2. Figure 7 shows the predicted settlement of the mine waste dump in the years 2025, 2030, and 2035 (i.e., after 5, 10, and 15 years). As can be seen, the secondary consolidation significantly increased with increasing the timescale. The maxim secondary consolidations after 5, 10, and 15 years of primary consolidations are –0.4575, –0.6045, and –0.7241 m, respectively. This, in return, suggests that the focused mine waste dump has not been stable by now, a significant large settlement may occur in the future, and the governor should pay more attention to the potential geohazards.
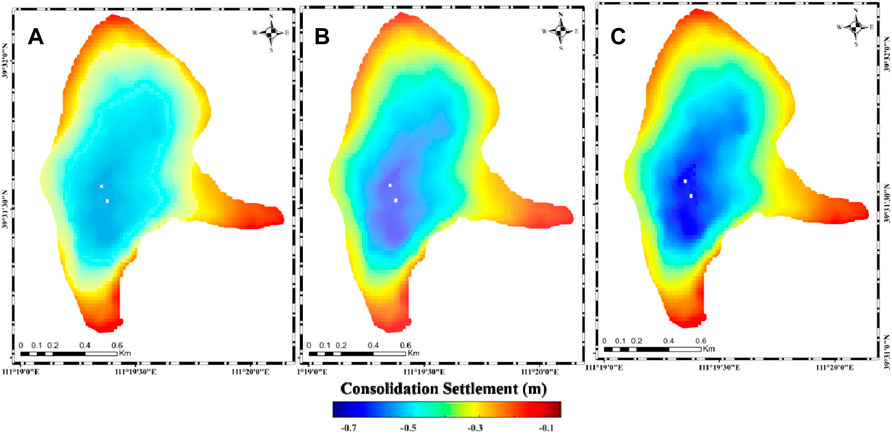
FIGURE 7. Predicted settlement of the mine waste dump in 2025 (A), 2030 (B), and 2035 (C), respectively, using the secondary consolidation model and its inverted parameters.
As stated previously, the InSAR observations of time-series settlement from 5 May 2019 and 14 May 2020, which did not be used to invert the parameters of the secondary consolidation, were used for accuracy evaluation in this section, due to the lack of the in situ settlement measurements. More specifically, we first predicted the time-series settlement at the acquisition dates of the collected Sentinel-1 images from 5 May 2019 to 14 May 2020 using the inverted coefficients and the secondary consolidation model. Then, the time-series InSAR settlements in the same epochs were considered as references for assessing the reliability of the predicted settlements.
Figure 8 shows a scatterplot between the InSAR-measured and the predicted settlements from 5 May 2019 and 14 May 2020. As is seen, most of them both settlements agree well with each other with a root mean square error (RMSE) of 0.008 m. In addition, we fitted the relationship between both of them with a linear function (marked by a red line in Figure 8). The results show that the slope and intercept of the fitted line are about 1.04 and 0.003, respectively, and the R-square is around 0.93. These results suggest that the predicted settlement using the presented method is reliable. In order to intuitively demonstrate the differences between the InSAR-measured and the predicted settlement of the mine waste dump, we added the predicted time-series settlements at the points P1, P2, and P3 in Figure 5, where the InSAR-measured time-series settlement between 30 May 2017 and 14 May 2020 are plotted. As is shown, the InSAR-measured and the predicted settlements (red line) have a good agreement with each other. This further indicates that the presented method in this study is feasible.
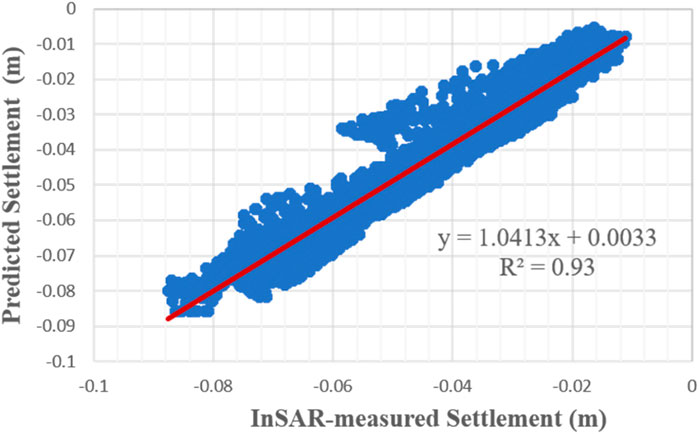
FIGURE 8. Scatter plot between the InSAR-measured and the predicted cumulative settlement from 5 May 2019 to 14 May 2020. The red line is the fitted linear trend between the both.
In this study, the coefficient of the secondary consolidation model was estimated with historical InSAR observations of time-series settlement and ZY-3 DEMs. Since errors are inevitably contained in InSAR observations and ZY-3 DEMs, the accuracy of the estimated coefficient of the secondary consolidation model would be degraded. Simulation analyses were conducted to illustrate this issue in detail in this section.
We firstly assumed a real coefficient of c = 0.008 (the mean of its common range from 0.004 to 0.012 for soil) and a dump thickness of △H = 40 m. Then, the real time-series settlement of secondary consolidation was simulated using Eq. 1 based on the real coefficient and dump thickness. Thirdly, InSAR observations of the settlement were generated by adding different level Gaussian noise (with the same mean of zero and different standard deviations (STDs) from zero to 25 mm) to the real time-series settlement. Finally, the InSAR observations with different error levels were used to estimate the coefficient of the secondary consolidation. To reduce the influence of the generation of Gaussian errors, the above steps were repeated 1000 times. The results are plotted in Figure 9A. Note that, Gaussian noise may well not simulate the real error of InSAR displacement observations due to its complex error sources (e.g., decorrelation noise, unwrapping errors, and atmospheric phase screen) (Zebker and Villasenor 1992; Li et al., 2019; Yunjun et al., 2019; Cao et al., 2021). However, the main aim of using Gaussian noise simulation in this section is to analyze the influence of InSAR error magnitude on the accuracy of the estimated coefficient. In this regard, it is unnecessary to simulate the errors of InSAR displacement observations accurately.
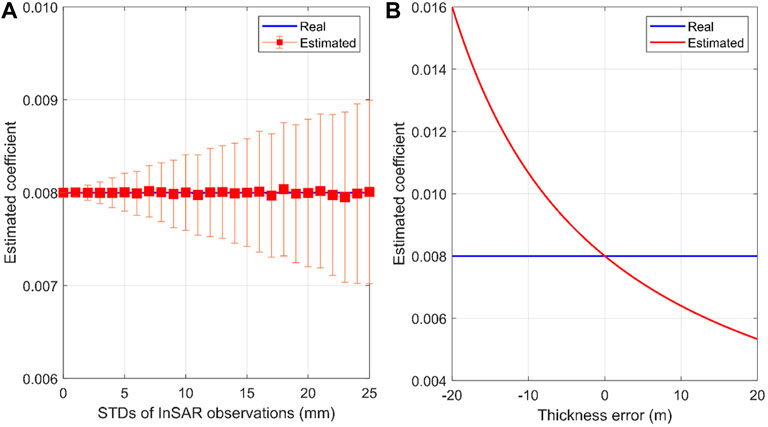
FIGURE 9. Influences of InSAR observation errors (A) and dump thickness errors on the estimated coefficients of secondary consolidation (B).
It can be seen from Figure 9A that, with the error increasing of InSAR observations, the STDs of the estimated coefficient (calculating with the results of the 1000 repeated simulation) are increased but below 0.001 in this simulated case. In addition, the mean of the coefficient estimate approximately equals the real one (i.e., 0.008), although the STD of InSAR observations increases from zero to 25 mm. This result indicates that the errors of InSAR observations have an insignificant influence on the coefficient estimation of the secondary consolidation. This conclusion is theoretically expectable. According to Eq. 3, the error propagation of InSAR observations into the estimated coefficient is inversely proportional to the thickness of the mine waste dump. Generally, the thickness of the mine waste dump is much larger than the error magnitude of InSAR observations. This implies that the errors of InSAR observations will be dramatically mitigated when they propagate into the estimated coefficient. Based on InSAR observation samples over a far-field and stable area nearby the focused mine waste dump in the real data experiment, we observed that the statistical mean and STD of the far-field InSAR observations were about –0.001 and 0.005 m. Such an error level has an insignificant influence on the estimated coefficient of the focused mine waste dump in this case.
A simulation analysis was carried out to show the influence of dump thickness errors on the parameter estimation in this section. More specifically, the parameters of the secondary consolidation model were the same as those in Influence of InSAR Errors on the Parameter Estimation Section. However, InSAR observations were assumed to be error-free and the estimation of dump thickness was designated by a range from 20 to 60 m (indicating a relative error to the real one from –50 to 50%). Then, the estimation of dump thickness with different error levels were used to inverted the model parameters using Eq. 3, respectively, and the result is plotted in Figure 9B.
As can be seen from Figure 9B, the dump thickness errors have a significant influence on the accuracy of the estimated coefficient of secondary consolidation. For instance, about 50% of errors would be caused when the uncertainty of the dump thickness reaches up to 50% (i.e., –20 m in this study). According to the comparison of the ZY-3-derived DEMs with ICESat-2 elevation observations (with error levels of centimeters, see Supplementary Figure S2 in Supplementary Material), the accuracies of the ZY-3 DEM products in the years 2012 and 2019 are about 6.4 and 5.3 m, respectively. Such an error level would cause a maximum error of about 0.0016 (occupying 20% of the real coefficient) in this simulation case.
The settlement of the mine waste dump was modeled and further predicted using the secondary consolidation model in Eq. 2 in this study. As can be seen from Eq. 2, besides the model inaccuracy, the reliability of the predicted settlement primarily depends on two factors, i.e., the errors of dump thickness and the estimated coefficient of secondary consolidation. In this section, simulation analyses were conducted to demonstrate the error influence of these two parameters on the accuracy of the predicted settlement.
Similar to the simulation in Influence of InSAR and DEM Errors on the Parameter Estimation of the Secondary Consolidation Model Section, we firstly simulated the real time-series settlement of the mine waste dump (see red line in Figure 10A) by assuming that c = 0.008 and △H = 40 m. Then, we assumed that the estimated coefficients were 0.004–0.012, which indicates error levels from −50 to 50%. Finally, the estimated coefficients with different error levels were used to predict time-series settlement, and the results are plotted in Figure 10A for comparison. It can be seen from Figure 10A that the error of the estimated coefficient significantly affects the reliability of the predicted settlement using the secondary consolidation model. The larger the error of the estimated coefficient is, the lower the reliability of the predicted settlement, and vice versa. Even for the same error in the estimated coefficient, the error magnitude of the predicted settlement would be increased with the increase of the predicted time.
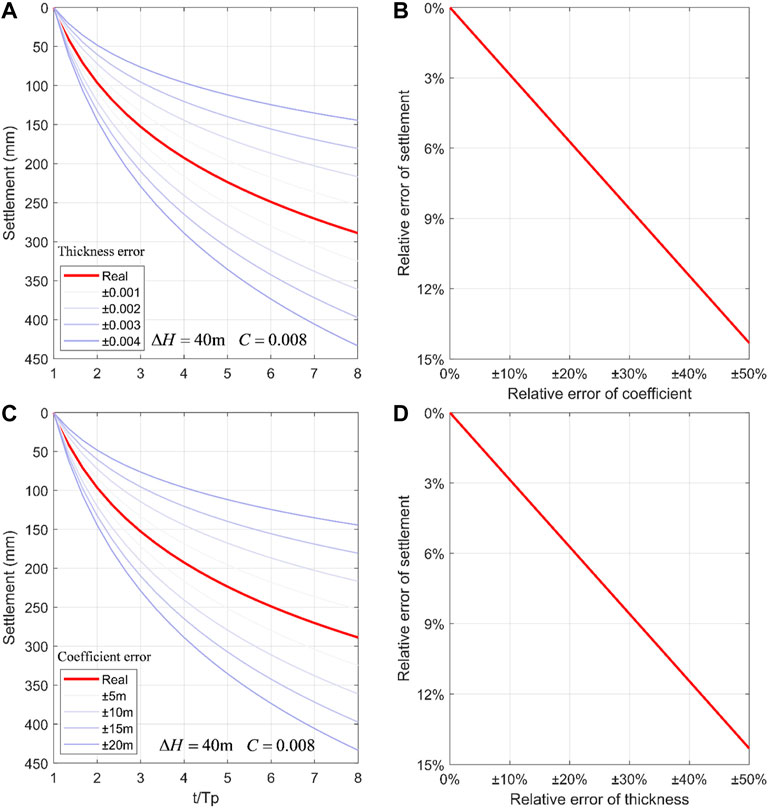
FIGURE 10. (A,C): Examples of the influence of thickness errors and coefficient errors on the predicted settlement, respectively; (B,D): Relationship of the predicted settlement relative errors with thickness and coefficient relative errors, respectively.
Figure 10B plots a comparison between the relative errors of the predicted settlement to the maximum predicted one (referred to as relative error of settlement) and the relative errors of the estimated coefficient to the real one (referred to as relative error of coefficient). As is shown, the settlement relative error is linearly proportional to the coefficient relative errors with an intercept of zero and a slope of about 16° in the simulation case. In addition, it can be seen from Figure 10B that the maximum relative error of the predicted settlement is about 14.3% when the maximum relative error of the coefficient reaches up to 50%.
Figure 10C shows a comparison of the dump thickness errors on the accuracy of the predicted settlement. In which, the real parameters of the secondary consolidation model were given as c = 0.008 and △H = 40 m, and the estimated dump thicknesses were 20–40 m (indicating relative errors of –50–50% of the real thickness). As can be seen from Figure 10C, the error of the estimated dump thickness imposes a significant effect on the accuracy of the predicted settlement. The larger the error is, the lower the accuracy is, and vice versa. In addition, as is shown in Figure 10D where the relationship between the relative errors of the predicted settlement and the dump thickness, both the relative errors are linearly proportional with each other. When the maximum relative error of the coefficient reaches up to 50%, the error of 14.3% of the maximum predicted settlement will be caused.
In this study, a remote sensing-based method was proposed to predict the time-series settlement of mine waste dump. The test over Weijiamao open-pit mine, China, shows that the presented method can reliably predict the time-series settlement of the mine waste dump, with an accuracy of 0.008 m. In this presented method the coefficient estimation of the secondary consolidation is sensitive to the error of thickness estimation but is insensitive to the error of InSAR observations. In addition, both the errors of thickness estimation and the estimated coefficient have a significant influence on the predicted settlement of mine waste dump using the secondary consolidation model. Therefore, it is important to obtain the thickness of the concerned mine waste dumps at a high accuracy level. In addition, it should be pointed out that the contribution of horizontal movements of mine waste dump was neglected when we estimated settlement from single-track InSAR observations of LOS displacements. Such a strategy would cause errors in the estimated settlement, and further degrading the accuracy of the predicted settlement. This issue will be our future research topic.
The original contributions presented in the study are included in the article/Supplementary Material, further inquiries can be directed to the corresponding author.
ZY contributed to conception and design of the study. ZX and ZC organized the database. TR, ZY, and LW performed the statistical analysis. TR wrote the first draft of the manuscript. TR and ZY wrote sections of the manuscript. All authors contributed to manuscript revision, read, and approved the submitted version.
This work was partly supported by the National Natural Science Foundation of China (Grant No. 41904005); the Basic Science Center of the National Natural Science Foundation of China (Grant No. 72088101); The Science and Technology Innovation Program of Hunan Province (2021RC3008); the Natural Science Foundation of Hunan Province, China (Grant No. 2020JJ4699); and the Research Foundation of Education Bureau of Hunan Province, China (Grant No. 20K134), the Science and Technology Plan of Department of Natural Resources of Hunan Province, China (2021-17).
KZ was employed by the company North Weijiamao Power and Coal Co., Ltd., and YZ was employed by the company North United Electric Power Co., Ltd.
The remaining authors declare that the research was conducted in the absence of any commercial or financial relationships that could be construed as a potential conflict of interest.
All claims expressed in this article are solely those of the authors and do not necessarily represent those of their affiliated organizations, or those of the publisher, the editors and the reviewers. Any product that may be evaluated in this article, or claim that may be made by its manufacturer, is not guaranteed or endorsed by the publisher.
We also thank the reviewers for the constructive suggestions. The Sentinel-1 data used in this study were provided by ESA/Copernicus (https://scihub.copernicus.eu).
The Supplementary Material for this article can be found online at: https://www.frontiersin.org/articles/10.3389/fenvs.2022.885346/full#supplementary-material
Supplementary Figure S1 | InSAR observations of time‐series displacements from 30 May 2017 (denoting by 20170530 in the figure) to 14 May 2020.
Supplementary Figure S2 | (A, B): ZY‐3 generated DEMs in the years of 2012 and 2019, respectively. The red circles denote the location of ICESat‐2 data which is used to validate the accuracy of the ZY‐3 DEMs.
Supplementary Table S1 | Accuracy of the ZY‐3 generated DEMs with respect to ICESat‐2.
Ashutosh, K., Verma, D., Thareja, R., and Singh, T. N. (2013). A Review on Numerical Slope Stability Analysis. Int. J. Sci. Eng. Tech. Res. 2, 1315–1320.
Atzori, S., Antonioli, A., Tolomei, C., De Novellis, V., De Luca, C., and Monterroso, F. (2019). InSAR Full-Resolution Analysis of the 2017-2018 M>6 Earthquakes in Mexico. Remote Sensing Environ. 234, 111461. doi:10.1016/j.rse.2019.111461
Behera, P. K., Sarkar, K., Singh, A. K., Verma, A. K., and Singh, T. N. (2016). Dump Slope Stability Analysis - A Case Study. J. Geol. Soc. India 88, 725–735. doi:10.1007/s12594-016-0540-4
Berardino, P., Fornaro, G., Lanari, R., and Sansosti, E. (2002). A New Algorithm for Surface Deformation Monitoring Based on Small Baseline Differential SAR Interferograms. IEEE Trans. Geosci. Remote Sensing 40, 2375–2383. doi:10.1109/tgrs.2002.803792
Bürgmann, R., Rosen, P., and Fielding, J. E. (2000). Synthetic Aperture Radar Interferometry to Measure Earth’s Surface Topography and its Deformation. Annu. Rev. Earth Planet. Sci. 28, 169–209. doi:10.1146/annurev.earth.28.1.16
Cai, G., Huan, J., Liu, Y., and Du, M. (2015). DEM Generation and Accuracy Assessment Using ZY-3 Stereo Image Pairs. Appl. Mech. Mater. 738–739, 613–617. doi:10.4028/www.scientific.net/AMM.738-739.613
Cao, Y., Jónsson, S., and Li, Z. (2021). Advanced InSAR Tropospheric Corrections from Global Atmospheric Models that Incorporate Spatial Stochastic Properties of the Troposphere. JGR Solid Earth 126, e2020JB020952. doi:10.1029/2020JB020952
Carlà, T., Intrieri, E., Raspini, F., Bardi, F., Farina, P., Ferretti, A., et al. (2019). Perspectives on the Prediction of Catastrophic Slope Failures from Satellite InSAR. Sci. Rep. 9, 14137. doi:10.1038/s41598-019-50792-y
Chen, Y., Tong, Y., and Tan, K. (2020). Coal Mining Deformation Monitoring Using SBAS-InSAR and Offset Tracking: A Case Study of Yu County, China. IEEE J. Sel. Top. Appl. Earth Observations Remote Sensing 13, 6077–6087. doi:10.1109/JSTARS.2020.3028083
Cho, Y.-C., and Song, Y.-S. (2014). Deformation Measurements and a Stability Analysis of the Slope at a Coal Mine Waste Dump. Ecol. Eng. 68, 189–199. doi:10.1016/j.ecoleng.2014.03.005
Confuorto, P., Diego, D. M., Infante, D., Novellino, A., Papa, R., Calcaterra, D., et al. (2019). Monitoring of Remedial Works Performance on Landslide-Affected Areas through Ground- and Satellite-Based Techniques. Catena 178, 77–89. doi:10.1016/j.catena.2019.03.005
Ferretti, A., Fumagalli, A., Novali, F., Prati, C., Rocca, F., and Rucci, A. (2011). A New Algorithm for Processing Interferometric Data-Stacks: SqueeSAR. IEEE Trans. Geosci. Remote Sensing 49 (9), 3460–3470. doi:10.1109/TGRS.2011.2124465
Ferretti, A., Prati, C., and Rocca, F. (2001). Permanent Scatterers in SAR Interferometry. IEEE Trans. Geosci. Remote Sensing 39, 8–20. doi:10.1109/36.898661
Gabriel, A. K., Goldstein, R. M., and Zebker, H. A. (1989). Mapping Small Elevation Changes over Large Areas: Differential Radar Interferometry. J. Geophys. Res. 94, 9183–9191. doi:10.1029/JB094iB07p09183
Gong, C., Lei, S., Bian, Z. F., Tian, Y., Zhang, Z., Guo, H., et al. (2021). Using Time Series InSAR to Assess the Deformation Activity of Open-Pit Mine Dump Site in Severe Cold Area. J. Soils Sediments 21, 3717–3732. doi:10.1007/S11368-021-03040-8
Guo, C., Huan, J., Liu, Y., and Du, M. (2015). DEM Generation and Accuracy Assessment Using ZY-3 Stereo Image Pairs. Appl. Mech. Mater. 738-739, 613–617. doi:10.4028/www.scientific.net/AMM.738-739.613
Hanrahan, E. T., and Barden, L. (1968). Primary and Secondary Consolidation of Clay and Peat. Géotechnique 183, 387–388. doi:10.1680/geot.1968.18.3.387
Hawley, P. M., and Cunning, J. (2017). Guidelines for Mine Waste Dump and Stockpile Design. Vic: ClaytonCSIRO.
Juan, L. V., Fernandez-Merodo, J. A., Ezquerro, P., López-Davalillo, J. C., Sarro, R., Reyes-Carmona, C., et al. (2021). Combining Satellite InSAR, Slope Units and Finite Element Modeling for Stability Analysis in Mining Waste Disposal Areas. Remote Sensing 13 (10), 2008. doi:10.3390/rs13102008
Kainthola, A., Verma, D., Thareja, R., and Singh, T. N. (2013). A Review on Numerical Slope Stability Analysis. Int. J. Sci. Eng. Tech. Res 2, 1315–1320. doi:10.3390/rs13102008
Li, M., Zhang, L., Ding, C., Li, W., Luo, H., Liao, M., et al. (2020). Retrieval of Historical Surface Displacements of the Baige Landslide from Time-Series SAR Observations for Retrospective Analysis of the Collapse Event. Remote Sensing Environ. 240, 111695. doi:10.1016/j.rse.2020.111695
Li, Z., Cao, Y., Wei, J., Duan, M., Wu, L., Hou, J., et al. (2019). Time-series InSAR Ground Deformation Monitoring: Atmospheric Delay Modeling and Estimating. Earth-Science Rev. 192, 258–284. doi:10.1016/j.earscirev.2019.03.008
Lianhuan, W., Zhang, Y., Zhao, Z., Zhong, X., Liu, S., Mao, Y., et al. (2018). Analysis of Mining Waste Dump Site Stability Based on Multiple Remote Sensing Technologies. Remote Sensing 10, 2025. doi:10.3390/rs10122025
Liu, Z., Han, L., Yang, Z., Cao, H., Guo, F., Guo, J., et al. (2021). Evaluating the Vertical Accuracy of DEM Generated from ZiYuan-3 Stereo Images in Understanding the Tectonic Morphology of the Qianhe Basin, China. Remote Sensing 13, 1203. doi:10.3390/rs13061203
Lopez-Vinielles, J. V., Fernandez-Merodo, J. A., Ezquerro, P., López-Davalillo, J. C., Sarro, R., Reyes-Carmona, C., et al. (2021). Combining Satellite InSAR, Slope Units and Finite ElementModeling for Stability Analysis in MiningWaste Disposal Areas. Remote Sensing 13 10, 2008. doi:10.3390/rs13102008
Massonnet, D., and Feigl, K. L. (1998). Radar Interferometry and its Application to Changes in the Earth's Surface. Rev. Geophys. 36 (4), 441–500. doi:10.1029/97RG03139
Massonnet, D., Rossi, M., Carmona, C., Adragna, F., Peltzer, G., Feigl, K., et al. (1993). The Displacement Field of the Landers Earthquake Mapped by Radar Interferometry. Nature 364 (6433), 138–142. doi:10.1038/364138a0
Nuth, C., and Kääb, A. (2011). Co-registration and Bias Corrections of Satellite Elevation Data Sets for Quantifying Glacier Thickness Change. The Cryosphere 5, 271–290. doi:10.5194/tc-5-271-2011
Osmanoğlu, B., Sunar, F., Wdowinski, S., and Cabral-Cano, E. (2016). Time Series Analysis of InSAR Data: Methods and Trends. ISPRS J. Photogrammetry Remote Sensing 115, 90–102. doi:10.1016/J.ISPRSJPRS.2015.10.003
Pierluigi, C., Diego, D. M., Infante, D., Novellino, A., Papa, R., Calcaterra, D., et al. (2019). Monitoring of Remedial Works Performance on Landslide-Affected Areas through Ground- and Satellite-Based Techniques. Catena 178, 77–89. doi:10.1016/j.catena.2019.03.005
Pinto, C., Paradella, W. R., Mura, J. C., Gama, F. F., Santos, A. D., and Silva, G. G. (2014). “Results of the Application of Persistent Scatterers Interferometry for Surface Displacements Monitoring in the Azul Open Pit Manganese Mine (Carajás Province, Amazon Region) Using TerraSAR-X Data,” in Proc. SPIE 9245, Earth Resources and Environmental Remote Sensing/GIS Applications V, Amsterdam, Netherlands (SPIE Remote Sensing), 92451K. doi:10.1117/12.2067233
Qingsong, Q., Li, G., Zhou, Y., Chai, M., Chen, D., Qi, S., et al. (2021). Deformation Monitoring in an Alpine Mining Area in the Tianshan Mountains Based on SBAS-InSAR Technology. Adv. Mater. Sci. Eng. 2021, 1–15. doi:10.1155/2021/9988017
Roland, B., Rosen, P., and Fielding, J. E. (2000). Synthetic Aperture Radar Interferometry to Measure Earth’s Surface Topography and its Deformation. Annu. Rev. Earth Planet. Sci. 28, 169–209. doi:10.1146/annurev.earth.28.1.169
Shen, X., Liu, B., and Li, Q.-Q. (2017). Correcting Bias in the Rational Polynomial Coefficients of Satellite Imagery Using Thin-Plate Smoothing Splines. ISPRS J. Photogrammetry Remote Sensing 125, 125–131. doi:10.1016/j.isprsjprs.2017.01.007
Suwarsono, S., Prasasti, I., Nugroho, J. T., Sitorus, J., Arief, R., Rahmi, K. I. N., et al. (2019). Detecting Deformation Due to the 2018 Merapi Volcano Eruption Using Interferometric Synthetic Aperture Radar (INSAR) From Sentinel-1 TOPS. IJReSES 16, 45. doi:10.30536/j.ijreses.2019.v16.a3145
Terzaghi, K., Peck, R. B., and Mesri, G. (1996). Soil Mechanics in Engineering Practice. New York: John Wiley & Sons, Inc.
Verma, D., Kainthola, A., Gupte, S. S., and Singh, T. N. (2013). A Finite Element Approach of Stability Analysis of Internal Dump Slope in Wardha Valley Coal Field, India, Maharashtra. Am. J. Mining Metall. 1, 1–6. doi:10.12691/ajmm-1-1-1
Wei, L., Zhang, Y., Zhao, Z., Zhong, X., Liu, S., Mao, Y., et al. (2018). Analysis of Mining Waste Dump Site Stability Based on Multiple Remote Sensing Technologies. Remote Sensing 10, 2025. doi:10.3390/rs10122025
Werner, C., Wegmuller, U., Strozzi, T., and Wiesmann, A. (2003). Interferometric point Target Analysis for Deformation Mapping. Proceedings (IEEE Cat. No.03CH37477) 7, 4362–4364. doi:10.1109/IGARSS.2003.1295516
Williams, C., Ross, B., Zebker, M., Leighton, J., Gaida, M., Morkeh, J., et al. (2021). Assessment of the Available Historic RADARSAT-2 Synthetic Aperture Radar Data Prior to the Manefay Slide at the Bingham Canyon Mine Using Modern InSAR Techniques. Rock Mech. Rock Eng. 54, 3469–3489. doi:10.1007/s00603-021-02483-2
Yanan, Z., Fuguang, D., and Changqing, Z. (2012). DEM Extraction and Accuracy Assessment Based on ZY-3 Stereo Images. IEEE, 1439–1442. doi:10.1109/iccsnt.2012.6526191
Yu, C., Li, Z., and Penna, N. T. (2020). Triggered Afterslip on the Southern Hikurangi Subduction Interface Following the 2016 Kaikōura Earthquake from InSAR Time Series with Atmospheric Corrections. Remote Sensing Environ. 251, 112097. doi:10.1016/j.rse.2020.112097
Yuan, M., Li, M., Liu, H., Lv, P., Li, B., and Zheng, W. (2021). Subsidence Monitoring Base on SBAS-InSAR and Slope Stability Analysis Method for Damage Analysis in Mountainous Mining Subsidence Regions. Remote Sensing 13 (16), 3107. doi:10.3390/rs13163107
Yunjun, Z., Fattahi, H., and Amelung, F. (2019). Small Baseline InSAR Time Series Analysis: Unwrapping Error Correction and Noise Reduction. Comput. Geosciences 133, 104331. doi:10.1016/j.cageo.2019.104331
Zebker, H. A., and Villasenor, J. (1992). Decorrelation in Interferometric Radar Echoes. IEEE Trans. Geosci. Remote Sensing 30, 950–959. doi:10.1109/36.175330
Zhang, Y., Huang, H., Liu, Y., Liu, Y., and Bi, H. (2019). Spatial and Temporal Variations in Subsidence Due to the Natural Consolidation and Compaction of Sediment in the Yellow River delta, china. Mar. Georesources Geotechnology 37, 152–163. doi:10.1080/1064119X.2017.1414903
Keywords: mine waste dump, InSAR, ground deformation analysis, consolidation settlement, secondary consolidation model
Citation: Tabish R, Yang Z, Wu L, Xu Z, Cao Z, Zheng K and Zhang Y (2022) Predicting the Settlement of Mine Waste Dump Using Multi-Source Remote Sensing and a Secondary Consolidation Model. Front. Environ. Sci. 10:885346. doi: 10.3389/fenvs.2022.885346
Received: 28 February 2022; Accepted: 12 April 2022;
Published: 30 May 2022.
Edited by:
Yu Chen, China University of Mining and Technology, ChinaReviewed by:
Yunmeng Cao, GNS Science, New ZealandCopyright © 2022 Tabish, Yang, Wu, Xu, Cao, Zheng and Zhang. This is an open-access article distributed under the terms of the Creative Commons Attribution License (CC BY). The use, distribution or reproduction in other forums is permitted, provided the original author(s) and the copyright owner(s) are credited and that the original publication in this journal is cited, in accordance with accepted academic practice. No use, distribution or reproduction is permitted which does not comply with these terms.
*Correspondence: Zefa Yang, eWFuZ3pmQGNzdS5lZHUuY24=
Disclaimer: All claims expressed in this article are solely those of the authors and do not necessarily represent those of their affiliated organizations, or those of the publisher, the editors and the reviewers. Any product that may be evaluated in this article or claim that may be made by its manufacturer is not guaranteed or endorsed by the publisher.
Research integrity at Frontiers
Learn more about the work of our research integrity team to safeguard the quality of each article we publish.