
95% of researchers rate our articles as excellent or good
Learn more about the work of our research integrity team to safeguard the quality of each article we publish.
Find out more
ORIGINAL RESEARCH article
Front. Environ. Sci. , 29 April 2022
Sec. Drylands
Volume 10 - 2022 | https://doi.org/10.3389/fenvs.2022.885070
This article is part of the Research Topic Understanding Soil Wind Erosion and Control Practices in Arid and Semiarid Environments View all 10 articles
The railways in the Gobi area have serious sand hazards. To prevent these hazards and ensure operational safety, plant-based sand prevention is a fundamental measure for the prevention and control of railway wind-sand hazards. This study considers the protective windbreak forest belts along the Lan-Xin Railway, Northwest China as the study area and evaluates its protective benefits from the perspectives of windproof efficiency and sand control efficiency using numerical simulations and wind tunnel testing. Our results show that the disrupting effect of the three shelterbelt rows on the airflow was significantly enhanced, and the wind velocity profile began to change at 2H. As the airflow continued to move forward, the wind velocity profile gradually deviated from the logarithmic law, and an obvious turning point appeared at 13H behind the forest belt. Under different incoming wind velocities, the maximum wind protection efficiency of the three shelterbelt rows appeared at 5H on the leeward side. The maximum wind protection efficiencies in the numerical simulation were 95.1, 90.4, and 88.6%, respectively. The minimum value appeared at 15H on the leeward side, and the minimum wind protection efficiencies were 58.3, 53.1, and 47.1%, respectively. The maximum wind protection efficiencies in the tunnel test were 94.3, 90.1, and 86.5%, and the minimum value appeared at 15H on the leeward side. As the wind velocity increased, the efficiency of wind protection tended to decrease. The sand control efficiencies of the shelterbelt were 93.8, 91.6, and 88.1%, and as the wind velocity increased, the sand control efficiency continued to decrease. In general, the forest belt had a significant effect on reducing the sand flux density, especially below the forest belt height, which can effectively control the wind and sand disasters in some Gobi areas along the Lan-Xin Railway.
Aeolian sand is a typical sand transport method in desert areas, which has a profound impact on desert topography and landform formations (Huang et al., 2020). Sand transported by wind is a process of lifting and spreading from the ground, and finally depositing back to the ground (Baniamerian and Mehdipour, 2019). Severe wind-sand hazards have brought great trouble to the construction, development, and safe operation of railways in sandy areas (Zhang et al., 2010; Wang et al., 2018; Zhang et al., 2020). In recent decades, scholars have summarized three types of sand control measures in the engineering practice of sand prevention and control: mechanical, chemical, and plant measures. Among them, plant measures are one of the most fundamental, economical, and effective methods for controlling sand disasters.
As an important part of plant-based sand prevention measures, windbreak forest belts are widely installed on the windward side of transportation facilities, such as railways and highways. By increasing the wind-sand flow resistance, enhancing energy consumption, and promoting sand deposition, they can intercept the passing wind-sand flows. Different types of protective windbreak forest belts have different effects in sand-wind prevention. For permeable protection forest belt, multiple “ventilation holes” are formed inside the forest belt, which make it easy for quicksand to penetrate the protection forest belt and cause sand damage. For tight protection forest belt, the quicksand is blocked as far as possible at the edge of the protection forest belt and cannot penetrate it, which is effective in preventing sandstorms. Field observations (Tuzet and Wilson, 2007; Amichev et al., 2015; Li et al., 2016), theoretical analyses (Takahashi et al., 1998; Ucar and Hall, 2001) and wind tunnel tests (Schwartz et al., 1995; Judd et al., 1996; Lee et al., 2002) have always been effective means to evaluate the benefits of the wind and sand resistance of forest belts. With recent advances in computer technology, numerical simulations have become widely used in the field of fluid dynamics owing to their high efficiency, accuracy, and convenience. For example, based on numerical simulation, Wang et al. (2003) developed the numerical model and simulation procedure systematically to describe the influence of the permeability, width, and direction of the incoming wind of the shelterbelt on the flow field, and to explain the relationship between the structure of the shelterbelt and the wind choke effect. Santiago et al. (2007) used three different turbulence models to analyze the flow characteristics of the airflow on the leeward side of the shelterbelt on a flat surface, and then selected an appropriate numerical model to analyze the optimum permeability of the shelterbelt as 35%. Zhan et al. (2017) using a two-dimensional Computational Fluid Dynamics (CFD) model numerically simulated and evaluated the impact of sand-fixing windbreak forests on wind-sand flows.
However, in these studies, there are two main limitations. First, the numerical simulations are limited to two spatial dimensions, ignoring the structural changes in the shelterbelt along the spanwise dimension. For windbreak forest belts composed of different tree species, the canopy has strong heterogeneity and complexity, making the spanwise dimension an important parameter that should not be neglected when describing the aerodynamic characteristics of the shelterbelt (Zhou et al., 2005; Bourdin and Wilson, 2008; Rosenfeld et al., 2010). Second, the research area is mostly concentrated on the sandy surface, with relatively little research under the Gobi surface. This has always been a weak link in this field. Compared with general desert areas, sand particles have a large initial velocity, large bounce angle, and high jump height under the Gobi surface. The sand particles can fully move due to the energy of the airflow, and the wind-sand flow often presents an unsaturated transport state (Dong et al., 2004; Zhang et al., 2011; Tan et al., 2016), making it difficult to fully visualize the wind-sand flow field around the vegetation using wind tunnel tests. Additionally, the Gobi area is uninhabited, with harsh natural conditions and heavy traffic restrictions, making field observations very difficult. Therefore, it is necessary to use three-dimensional numerical simulation technology to study the protective benefits of Gobi forest belts.
The Lan-Xin Railway crosses the Gobi Desert in Northwest China, with plant protection measures installed in some sections to prevent wind and sand hazards and ensure driving safety. Shelterbelts along the Lan-Xin Railway consist of trees and shrubs, which are Populus bolleana Lauche approximately 12 m high, and Haloxylon ammodendron approximately 3 m high, respectively, with a total of three rows and a row spacing of 72 m. In this study, numerical simulations are used to construct a three-dimensional physical model of the shelterbelt to study the change law of the wind velocity profile and wind resistance efficiencies at different positions of the shelterbelt. This study aims to make an effective scientific assessment of the wind and sand resistance effect of the shelterbelt. Additionally, the results of the numerical simulation were verified through wind tunnel tests, and the sand flux density and sand blocking effect of the shelterbelt were studied. The research results provide theoretical support for the wide application of windbreak forest belts and are of great significance to the application of plant protection measures along the railway in the Gobi area.
In the numerical simulation, a steady-state method was used to solve the problem. The solution model used the standard k–ε model, and the airflow at the inlet was an incompressible airflow. During the solution process, the continuity equation, RANS equation, and two standard k-ε turbulence closed equations were solved. The control equation is as follows:
where
Forest belts are usually composed of multiple rows of trees; thus, the shelterbelt area was regarded as a porous medium area in the numerical simulation. In ANSYS Fluent, the porous medium model adds a source term to the momentum equation to simulate the resistance of the porous area to the fluid flow. The governing equation is as follows:
Where
To ensure modeling accuracy, the SCDM 2019R3 software, which has an intelligible interface for Fluent, was used to establish a three-dimensional solid model of the shelterbelt plants. The layout method used was high in the front and low in the back, arranged in a “product” shape, with a belt spacing of 72 m (6HB, HB = 12 m). The overall layout consisted of regions with one belt and two rows (referred to as a row), two belts and four rows (referred to as two rows), and three belts and six rows (referred to as three rows). Through reasonable trial calculations, the size of the calculation domain was determined to be X × Y × Z = 360, 432, and 504 m (30, 36, and 42HB) × 84 m (7HB) × 72 m (6HB), and the model was set at 120 m (10HB) from the entrance. To avoid backflow, the distance from the model to the outlet was 240 m (20HB). In the model, the canopy was simplified into a truncated cone, and the trunk was simplified into a cylinder (Figure 1); a schematic diagram of the 3D finite element model of the three rows of windbreak forest belts in the numerical simulation is shown in Figure 2. The distance between A (B) plants is 6 m in spanwise dimension, and the distance between plant trunks is 9 m in X dimension. Table 1 shows the characteristic dimensions of the simplified model of the two plants in the numerical simulation simultaneously.
To ensure the full development of airflow in the flow field, the model was set 120 m (10HB) away from the entrance. Owing to the complex structure of the model, it is difficult to generate structured grids; therefore, the Tetrahedrons method in Workbench Mesh was used for unstructured meshing of the entire computational basin. To improve the calculation efficiency, the size control method is used to locally encrypt the cells near the model, and 10 boundary layers were set along the bottom wall and the surface of the model, and the growth rate was set to 1.2. In the end, the total number of single-, double-, and triple-row shelterbelt units were 2.58, 3.36, and 4.02 million, respectively. The maximum inclination rate of the grid was controlled below 0.7, and the quality of the grid was good, which could meet the accuracy requirements of the calculation.
The boundary conditions of the numerical simulations are listed in Table 2. A user-defined function (UDF) was used at the entrance and a C language self-compiled function was embedded, so that the wind velocity profile was in logarithmic form conforming to wind tunnel test, the wind velocity at the axis was 8, 12, 16 m s−1, respectively, and the wind velocity profile form was:
where v(z) represents the velocity at z height, in m·s−1;
The entire solution domain is a fluid domain, in which the canopy area of the shelterbelt plants was set as a porous medium area, with porosity set to 30.17%. The velocity in the simulation was much lower than that of sound, and air was regarded as an incompressible fluid. The pressure solver was used for the steady-state solution, the finite volume method was used for solution control, the solution method was SIMPLE (Wang and Takle, 1995; Mahgoub and Ghani, 2021), the momentum used the second-order upwind style, and the turbulence energy and turbulent dissipation rate used the first-order upwind style. The convergence standard of the residual was set to 10–6. When the residual was less than 10–6, the accuracy requirement was met, and the calculations were terminated.
The wind tunnel used in this test was a direct current downward blowing wind tunnel with a total length of 38.9 m, of which the test section was 16.0 m long, the cross-sectional size was 1.2 m × 1.2 m, the boundary layer thickness was 0.5 m, and the test wind velocity range was adjustable between approximately 4 and 35 m s−1. This test included two parts: a flow field test and a sediment transport test. The flow field test used a 10-channel Pitot tube to measure the wind velocity profile at different positions. The sand transport test was conducted at a position 1.0 m downwind from the entrance of the test section. A sand bed with a width of 1.2 m, a length of 4.0 m, and a thickness of 5.0 cm was laid. The particle size was between 0.075 and 0.500 mm, the sand source was supplemented, and the sand surface was leveled before each test to ensure sufficient sand source supply. The test site is shown in Figure 3.
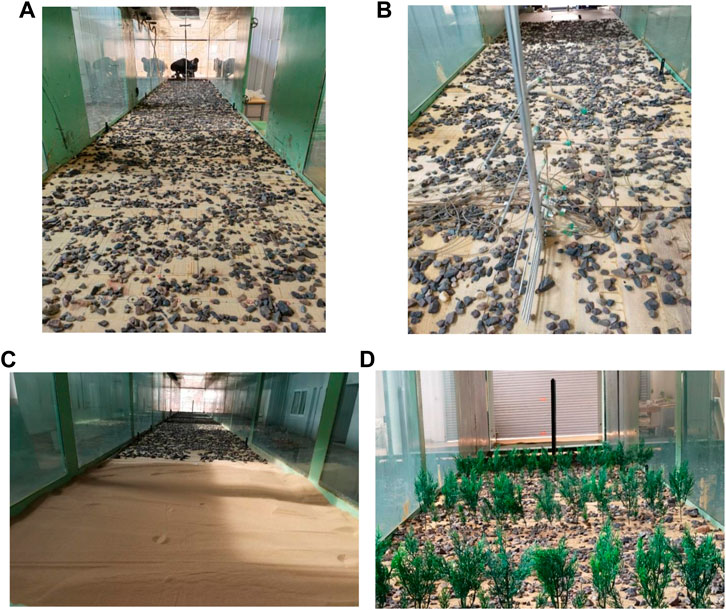
FIGURE 3. The layout of Gobi surface, sand beds, and plants in the wind tunnel test. (A): Gobi bed, (B): Flow field test, (C): Sand bed, (D): Sediment transport test.
In this wind tunnel test, two plants, A and B, were selected (Table 3 for detailed plant parameters). The arrangement method was high in the front and low in the back, arranged in the shape of “product,” with a total of three belts and six rows (referred to as three rows). The plant spacing was 10 cm (0.5H2, H2 = 20 cm), the belt spacing was 120 cm (6H2). The forest belt permeability was estimated by using an unsupervised classification analysis of crown photographs using the software ERDAS IMAGINE 9.2 (Tntergraph, United States). The forest belt permeability was 30.17% (Ma et al., 2019). To simulate the surface of the Gobi, a layer of gravel with a length of 12.0 m and a width of 1.2 m was laid in the wind tunnel. The gravel surface was composed of natural Gobi gravel with a diameter of 0.5–5.0 cm. Additionally, the selected test wind velocities were 8, 12, and 16 m s−1 in the wind tunnel test.
The reliability of wind tunnel test results primarily depends on the degree of similarity between experimental and field conditions. To ensure the accuracy of the test results, the wind tunnel test must meet three similarity conditions: geometric similarity, similar motion, and similar dynamics (White, 1996). For geometric similarity, to avoid wall interference, it is generally required that the ratio of the turbulent boundary layer of the wind tunnel to the ground-attached boundary layer does not exceed 6% of obstruction. In this experiment, the ratio of the plant model to the actual field was 1:60, which satisfied the geometric similarity. Motion similarity primarily considers two aspects: the flow state and the wind velocity profile form. The test verified that the wind velocity profile form conformed to the logarithmic distribution law (Figure 4), indicating that the wind tunnel test meets the motion similarity. As long as the Reynolds number in the wind tunnel is sufficiently large, a self-simulation zone independent of the Reynolds number can be formed (Ma et al., 2019). Three wind velocities of 8, 12, and 16 m s−1 were selected for this experiment. Under the three test wind velocities, the Reynolds number was 6.75 × 10⁵–1.35×10⁶ (Re = ρvl/μ1, ρ: air density, equal to 1.205 kg m−3; v: the characteristic velocity of the flow field; l: the characteristic length at 0.98 m; μ1: the kinematic viscosity of air, equal to 1.4 × 10⁻⁵ m2 s−1), which is much larger than 1 × 10⁵. The dynamic similarity is satisfied.
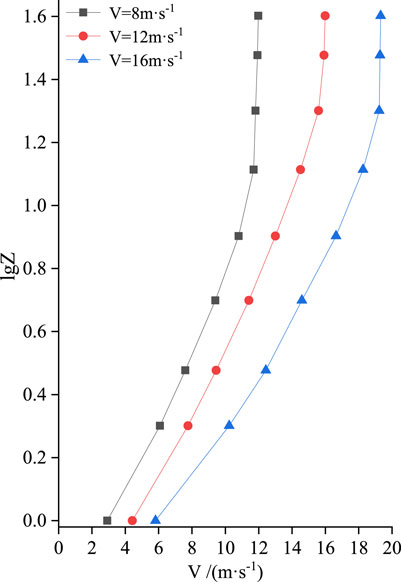
FIGURE 4. The change law of the wind velocity profile of the cavity under different test wind velocities.
In this wind tunnel test, a Pitot tube was used to measure the wind velocities at different locations in the forest belt (Figure 3B). The measured heights of the Pitot tube were 1, 2, 3, 5, 8, 13, 20, 30, and 40 cm, and the collection frequency was 0.5 s, the collection time of each wind velocity was 60 s, and the average value was taken as the actual wind velocity at that point. The wind protection efficiency near the forest belt was calculated using the following formula:
where
A vertical gradient sand collector was used to test sediment transport. The height of the sand collector was 50 cm, and the cross-sectional size of each sand collector was 2 cm × 2 cm. At test wind velocities of 8, 12, and 16 m s−1, the sand collection times were 3, 2, and 1 min, respectively. The collected sand was weighed in the sandbox at different heights with high-precision electronic peace, and its weight was represented with q. The sand flux density at different heights can be obtained by dividing the area and collection time of a single sand collection port by q. Q was the sand transport rate through unit spanwise scale (total sum of q*dz). The sand blocking efficiency near the forest belt was calculated using the following formula:
where
Figure 5 shows the distribution characteristics of the flow field near different rows of windbreak forest belts under different incoming wind velocities. It can be seen from the figure that under different incoming wind velocities, the distribution characteristics of the flow field near the windbreak forest belts were basically the same, and there were obvious partition characteristics near the forest belts. A zone of low airflow occurred. When the windbreak forest belts were arranged in multiple rows, the blocking effect on the airflow was more obvious, and an obvious low-speed airflow area occurred between the forest belts. Compared with the single-row forest belt, the area of the low-speed area on the leeward side of the double-row and three-row windbreak forest belts was significantly larger. When the windbreak forest belts were arranged in three rows, the area of the leeward side deceleration area was the largest, and the purification effect on the wind and sand flow was the strongest. In addition, it can also be found that when the windbreak forest belts were arranged in multiple rows, the low-speed area of airflow between the windbreak forest belts and that on the leeward side tended to be integrated.
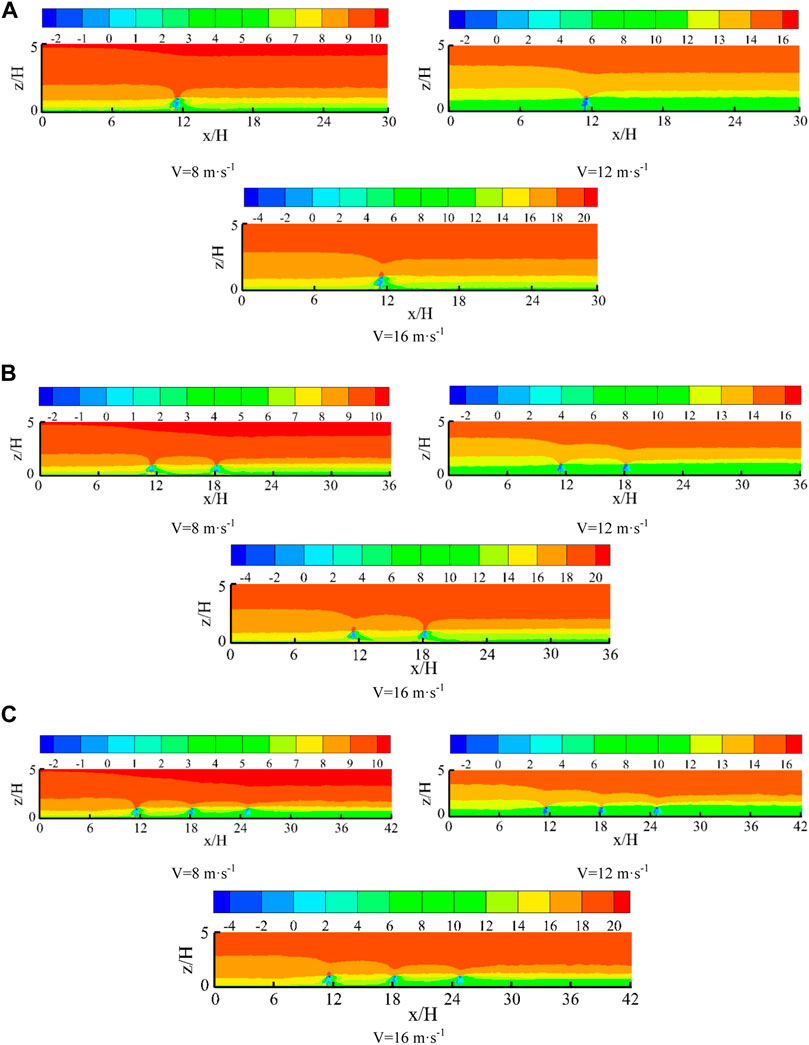
FIGURE 5. Distribution characteristics of flow field near forest belts. (A): Single row of forest belts, (B): Two rows of forest belts, (C): Three rows of forest belts.
Figures 6–8 show the broken line diagrams of the wind velocity profile changes under the single-, double-, and triple-row forest belts. The first row of windbreak forest belts is used as a reference point for each position on the figure. As seen in Figures 6–8, the wind velocity profile shows similar changes under different wind velocities. At 2HB and 5HB before the forest belt, the airflow was not disturbed by the forest belt, and the wind velocity profile changed logarithmically; however, the change pattern of the wind velocity profile at different positions inside the forest belt and on the leeward side was different from that in front of the forest belt. The wind velocity profiles under the single- and double-row windbreak forest belts were less disturbed, with relatively gentle changes, and no obvious turning point. When the forest belt was arranged in three rows, the disturbing effect on the airflow was enhanced, and variations in the wind velocity profile began at 2HB. As the airflow moved forward, the wind velocity profile gradually deviated from following a logarithmic law, with a turning point observed at 13HB behind the forest belt. Compared with the wind velocity profile at the front edge of the forest belt, the horizontal wind velocity decreased notable below the height of plant A. Additionally, there were two wind velocity turning points in the disturbed wind velocity profile, first at approximately 3 m high, which is the top of plant A, then at approximately 12 m high, which is the top of plant B. Between the two wind velocity turning points, the airflow velocity decreased significantly, and the attenuation amplitude of the airflow decreased as height increased. Above the height of plant B, the obstructive effect of the forest belt was lost, and the airflow velocity slowly recovered.
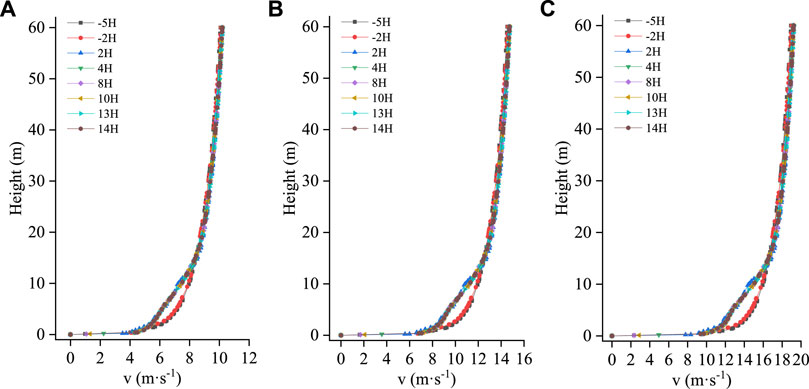
FIGURE 6. Wind velocity profile variations at different positions of single-row forest belt under different incoming wind velocities. (A):V = 8 m·s−1, (B): V = 12 m·s−1, (C): V = 16 m·s−1.
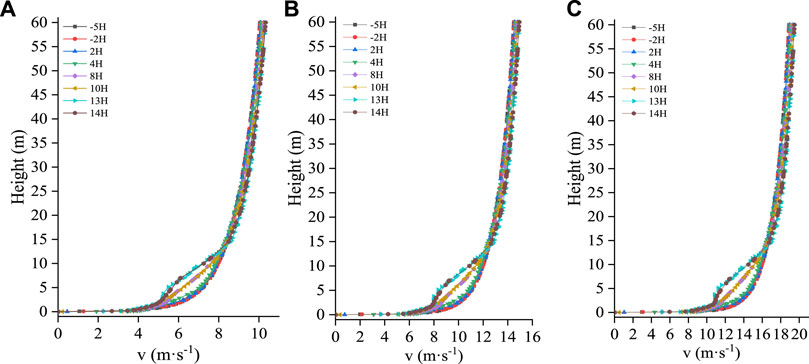
FIGURE 7. Wind velocity profile variations at different positions of double-row forest belt under different incoming wind velocities. (A):V = 8 m·s−1, (B): V = 12 m·s−1, (C): V = 16 m·s−1.
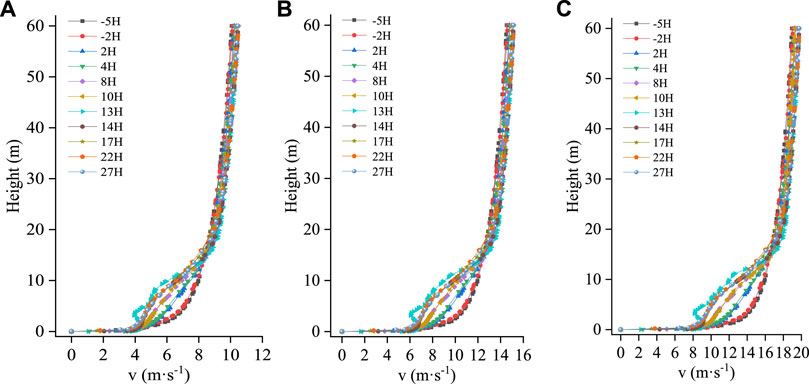
FIGURE 8. Wind velocity profile variations at different positions of three rows of windbreak forest belts under different incoming wind velocities. (A):V = 8 m·s−1, (B): V = 12 m·s−1, (C): V = 16 m·s−1.
Figure 9 shows the windbreak efficiencies at different positions at a height of 60 cm on the leeward side of the forest belt with different incoming wind velocities in the numerical simulation. Each position in the figure is based on the last row of forest belts, where DLT1HB is 1H away from the leeward side of the third row of forest belts. Overall, under different incoming wind velocities, the windbreak efficiencies of different windbreak forest belts rows showed a trend of increasing and then decreasing. Among them, at the DLT5HB position, the wind protection efficiency reached the maximum, then the wind protection efficiency decreased to a minimum at the DLT15HBposition behind the forest belt. As the number of windbreak forest belts increased, the windbreak efficiencies of the windbreak forest belts increased significantly. When the forest belt was arranged in three rows belt under the three inlet wind velocities, the wind protection efficiency was the best at the DLT5HB position, and the maximum wind protection efficiencies were 95.1, 90.4, and 88.6%, respectively. Compared with the single-row arrangement, the maximum wind protection efficiency increased by 23.7, 22.1, and 23.9%, respectively. Compared with the double-row arrangement, the maximum wind protection efficiency increased by 5.7, 4.2, and 3.0%, respectively. At the same time, as the incoming wind velocity continued to increase, the wind protection efficiency at the same location showed a decreasing trend.
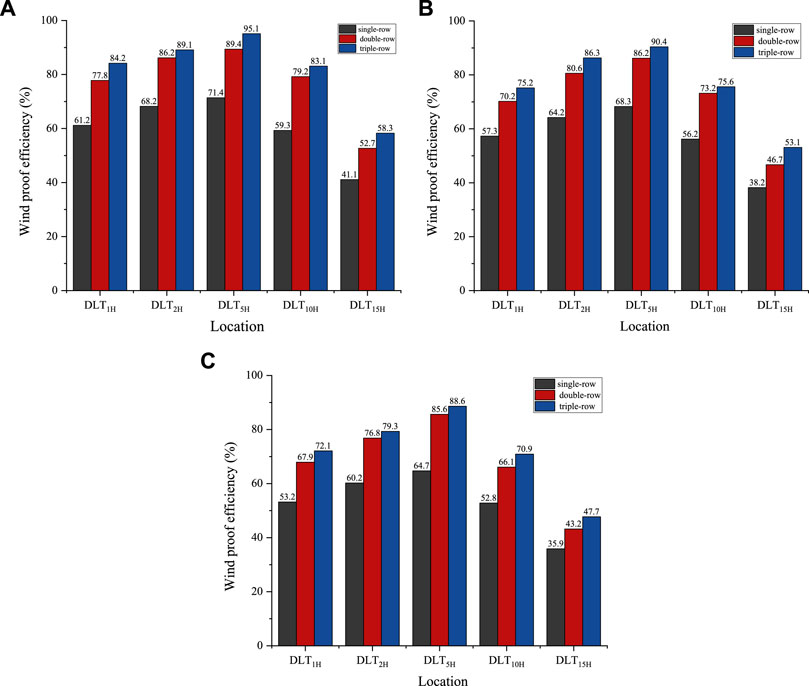
FIGURE 9. The relationship between windbreak efficiency and forest belt downwind distance under different incoming wind velocities. (A):V = 8 m·s−1, (B): V = 12 m·s−1, (C): V = 16 m·s−1.
The characteristics of the airflow field around the three rows of windbreak forest belts under different incoming wind velocities are shown in Figure 10. Each position in the figure is based on the first row of windbreak forest belts as a reference point. Generally, when the airflow encounters obstacles near the forest belt, airflow deceleration zones, acceleration zones, and vortex zones are formed. In this study, the airflow produced clear zoning characteristics near the forest belt, and the changes in the airflow field were basically the same under different airflows. When the airflow moved to the vicinity of the forest belt, it was blocked by the forest belt, and the airflow velocity decreased, forming a windward side deceleration zone at the front edge of the forest belt, and some sand particles in the sand-carrying airflow were deposited here. Part of the airflow crossed the tree canopy and rose when obstructed, forming a high-speed area of airflow between 0.5 and 1.5H2 above the canopy. The airflow continued to move forward and was hindered by the forest belt twice, continually decreasing the kinetic energy and forming a large deceleration zone on the leeward side of the forest belt. Ma et al. (2019) studied the flow field characteristics of windbreak forest belts through wind tunnel tests. The results show that under different incoming wind velocities, a local acceleration zone was formed above the shelterbelt, and there were large deceleration zones between the windbreak forest belts and on the leeward side. We drew the same conclusions as Ma et al. (2019) during our study; however, They mentioned that there was also a local acceleration area inside the forest belts, while almost all the windbreak forest belts were deceleration zones in this study, which was caused by the difference between the line and the belt spacing in the experiment. Finally, with the continuous increase in the incoming wind velocity, the range of the deceleration zone on the leeward side of the forest belt tended to gradually shrink, which agrees with the results of them.
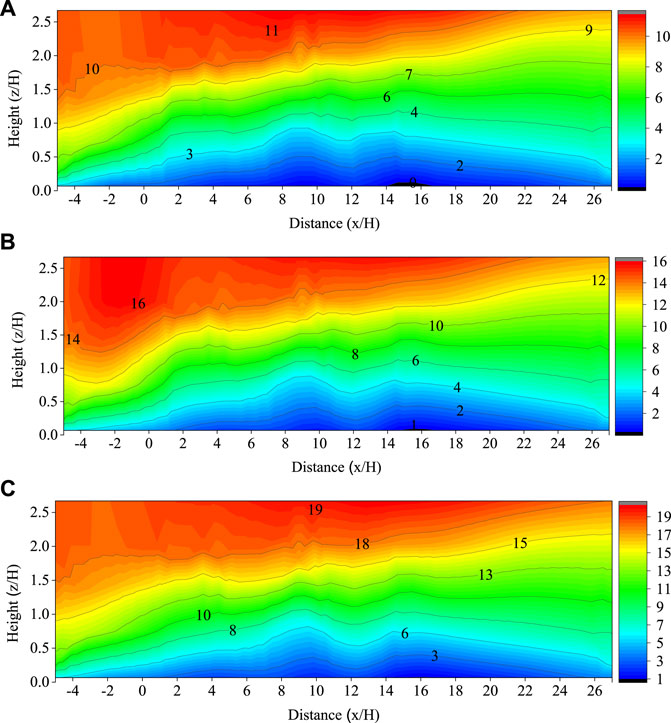
FIGURE 10. The characteristics of the airflow field around the three rows of windbreak forest belts under different incoming wind velocities. The units in parenthesis for all figures are m·s−1. (A):V = 8 m·s−1, (B): V = 12 m·s−1, (C): V = 16 m·s−1.
We also observed that the streamlines between the windbreak forest belts and on the leeward side of the windbreak forest belts were curved rather than smooth. The streamline showed an upward curve directly above the forest belt, and there was a downward bending trend between the forest belts, which showed that the airflow velocity between the windbreak forest belts was greatly attenuated, forming a low-speed airflow area (Dong et al., 2007). Here, the sand-carrying capacity of the airflow was greatly reduced, the velocity of sand particles was reduced below the starting wind velocity, and most of the sand particles were deposited in the forest belts.
The wind velocity profile changes at different positions of the three rows of windbreak forest belts in the wind tunnel test are shown in Figure 11. The first row of windbreak forest belts is used as a reference point for each position in the figure. As shown in Figure 11, at 2H2 and 5H2 up the forest belt, the forest belt has no clear influence on the wind velocity, and the wind velocity profile obeys the logarithmic distribution law; however the airflow disturbance by the forest belt stops following the logarithmic distribution in the lower wind direction of the forest belt. Below the forest belt height, the airflow resistance decreased, especially above the height of plant A and below the height of plant B, the air velocity was significantly reduced, and the decrease in the air velocity reached a maximum at approximately 22–27H2 in the downwind direction of the forest belt. Above the height of plant B, without the obstacle of the forest belt, the airflow velocity began to increase, and then the airflow slowly returned to the incoming wind velocity. The change law of the wind velocity profile in the wind tunnel test was basically the same as that of the three rows of windbreak forest belts in the numerical simulation; however, the air velocity of the forest belt downwind above the height of plant B in the wind tunnel test was slightly lower than that in the numerical simulation. This is because the wind tunnel test is a scaled test, which has certain restrictions compared with the prototype test. Additionally, the presence of collection equipment such as Pitot tubes in the wind tunnel test will also have a certain impact on the airflow. Therefore, it is necessary to compare the numerical simulation results and the wind tunnel test results with each other and verify each other to enhance the accuracy and rigor of the results.
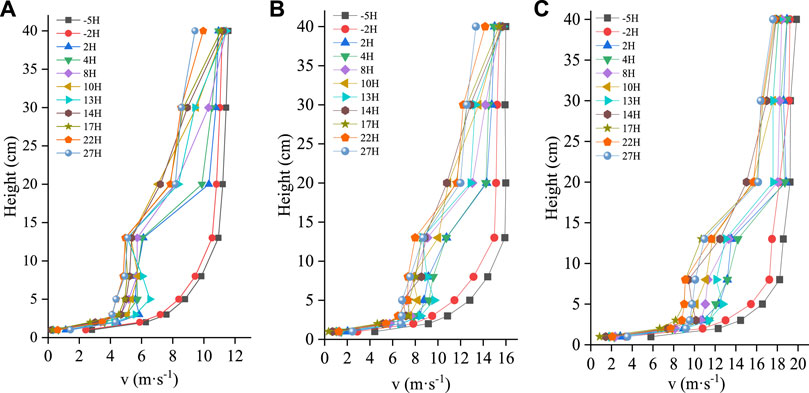
FIGURE 11. Variation law of wind velocity profile at different positions of three rows of windbreak forest belts under different incoming wind velocities. (A): V = 8 m·s−1, (B): V = 12 m·s−1, (C): V = 16 m·s−1.
Figure 12 shows the wind protection efficiencies at different locations at a height of 1 cm on the leeward side of the forest belt with different incoming wind velocities in the wind tunnel test. Each position in the figure is based on the last row of windbreak forest belts as a reference point, where DLT1H2 is 1H2 from the leeward side of the third row of forest belts. As shown in Figure 11, when the wind velocity was 8, 12, and 16 m s−1, the wind protection efficiency changed, respectively. As the wind velocity increased, the efficiency of wind protection tended to decrease. Additionally, when the wind velocity was 8, 12, and 16 m s−1, the maximum windbreak efficiencies of windbreak forest belts occurred at 5H2, which were 94.3, 90.1, and 86.5%, respectively, while the minimum windbreak efficiencies all occurred at 15H2, which were 54.6, 48.9, and 44.5%, respectively.
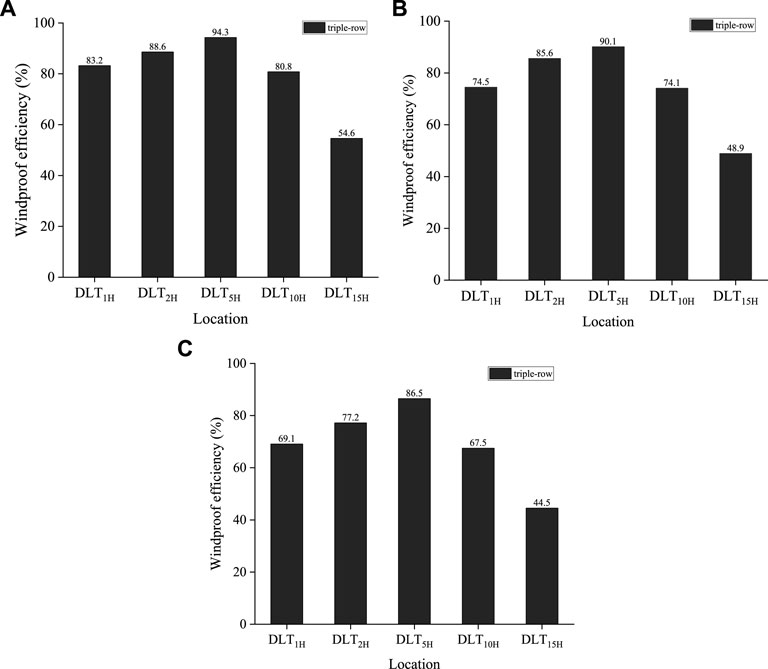
FIGURE 12. The relationship between windbreak efficiency and forest belt downwind distance under different incoming wind velocities. (A): V = 8 m·s−1, (B): V = 12 m·s−1, (C): V = 16 m·s−1.
Figure 13 shows a comparison of the horizontal wind velocities at different heights from the ground surface between the three rows of windbreak forest belts in the numerical simulation and wind tunnel test under different incoming wind velocities. The x-axis is normalized by plant height B, and the y-axis is normalized by the incoming wind velocity, V0. The curve represents the predicted value of the numerical simulation, and the data points represent the actual measured values of the wind tunnel test. As shown in Figure 13, at Z/H = 0.15 and Z/H = 0.25, when the airflow moved to the vicinity of the forest belt, it encountered resistance and decelerated, greatly reducing the velocity. Later, affected by the acceleration zone, three peaks were formed near the forest belt, and the airflow gradually stabilized after passing through the forest belt. At Z/H = 0.40 and Z/H = 0.65, the airflow decelerated when encountering obstacles, and the velocity quickly decayed to zero near the forest belt. Affected by the deceleration zone, three clear depressions were formed near the forest belt, and the airflow slowly reached equilibrium after passing through the forest belt.
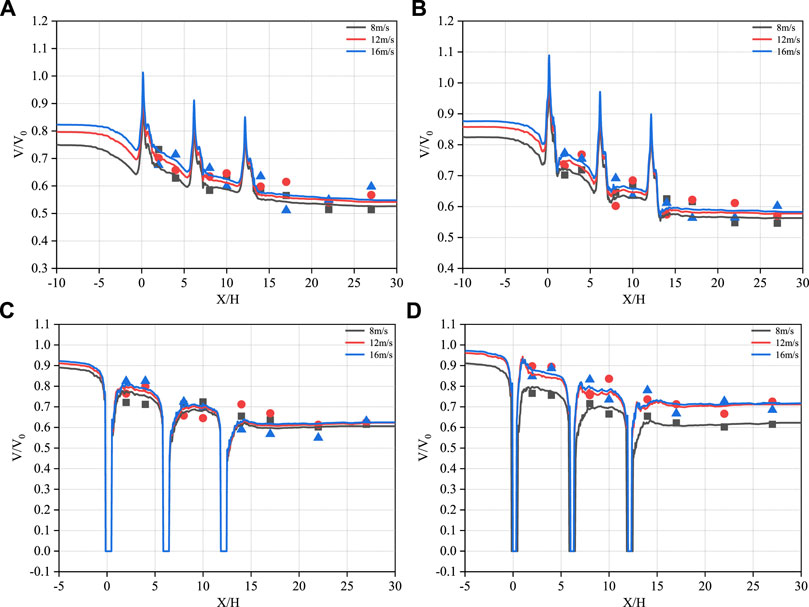
FIGURE 13. Comparison of numerical simulation and wind tunnel test results under different incoming wind velocities. (A): Z/H = 0.15, (B): Z/H = 0.25, (C): Z/H = 0.40, (D): Z/H = 0.65.
Additionally, Figure 13 shows that the numerical simulation results are in good agreement with the measured results in the wind tunnel test, which can prove the accuracy of the numerical simulation results to a certain extent. To quantify the error between the numerical simulation results and the wind tunnel test results, and enhance the accuracy and rigor of the numerical simulation results, the statistical model performance indicators proposed by Chang and Hanna (2004) were used to compare the results of the numerical simulation and the wind tunnel test, its calculation formulae are as follows:
where FB is the score deviation, MG is the geometric mean deviation, NMSE is the normalized mean square deviation, VG is the geometric variance, R is the correlation coefficient, Cp is the predicted value of the numerical simulation, Co is the measured value of the wind tunnel test,
Table 4 compares the results of the numerical simulation and wind tunnel test, and calculates the specific values of FB, MG, NMSE, VG, and R using Eqs 10–14. From the calculation results in Table 4, under the three incoming wind velocities, the maximum deviation of FB is 0.1244, the maximum deviation of MG is 0.1174, the maximum deviation of NMSE is 0.0181, the maximum deviation of VG is 0.0391, and the maximum deviation of the correlation coefficient R is 0.3860. Comprehensive analyses of these five statistical performance indicators show that the results of the numerical simulation and the wind tunnel test are in agreement, and the results of the numerical simulation are reliable.
Compared with the results of the three rows of windbreak forest belts in the numerical simulation, the windproof efficiency in the wind tunnel test was slightly lower. The position with the largest difference was 15H2 away from the forest belt, the deviation was 4.2%, and the deviation of the other positions was within 4%. Ma et al. (2019) studied the wind protection efficiency of windbreak forest belts composed of different plant types through the technical means of wind tunnel tests. The results show that when the incoming wind velocity was 7 m s−1, the maximum windproof efficiency of the product glyph shelterbelt was approximately 80%. In this study, when the incoming wind velocity was 8 m s−1, the maximum windproof efficiency of the shelterbelt was 95.1%. This difference was caused by the distance between forest belts. The distance between windbreak forest belts as reported by them was 40H, while the distance in this study was 6H, resulting in a higher windproof efficiency obtained in this study. Lin et al. (2020) conducted wind tunnel tests on Caragana korshinskii shrubs with different spacings, and the results showed that when the incoming wind velocity was 10 m s−1 and the forest belt spacing was 6H, the average windbreak efficiency on the leeward side of the forest belt was 73.3%. When the incoming wind velocity was 12 m s−1, the average windbreak efficiency on the leeward side of the forest belt was 76.1%. The results of them are consistent with those of this study.
Figures 14, 15 show the variations in the sand transport rate with height at 10H2 behind the Gobi gravel bed and three rows of windbreak forest belts under different incoming wind velocities, respectively. As shown in the figures, under the Gobi gravel bed, the sand flux density showed a negative exponential change with the height, and with an increase in the incoming wind velocity, the sand flux density continued to increase, similar to the results obtained by Wang et al. (2017), Wang et al. (2020). The results of the cave tests are consistent. The forest belt has a significant effect on reducing the sand flux density, especially below the height of the forest belt. Additionally, an interesting point is that when the incoming wind velocity was 12 and 16 m s−1, the sand flux density reached a maximum at 4 cm high, and then gradually decreased. This is the unique “elephant effect” of the wind-sand flow structure in the Gobi area proposed by Qu et al. (2005). On the surface of quicksand, the sand flux density generally reached its maximum at a height of 2 cm from the surface, while the peak sand flux density in this study appeared 4 cm from the surface. This is due to the high hardness, rich gravel, and large surface roughness of the Gobi surface. There was less energy loss due to sand-gravel collisions, and the bounce height of sand particles increased, so that the position of the saturation layer of the wind-sand flow moved up. Lv et al. (2016) studied the changing laws of sand flux density under different ground surfaces, and the results showed that the maximum sand flux density under the Gobi surface appeared at approximately 2–4 cm, which is the same as the results of this study. Notably, this unique elephant effect only occurs under the Gobi gravel bed, but is not present under the forest belt. This is because the forest belt has a strong interception effect on the sand particles in the sandstorm, so that the sandstorm on the leeward side of the forest belt is completely in a state of unsaturated transport. Therefore, there is no unique elephant effect under the forest belt.
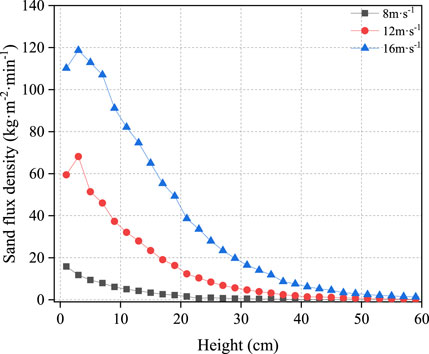
FIGURE 14. Variation law of sand flux density on Gobi gravel bed under different incoming wind velocities.
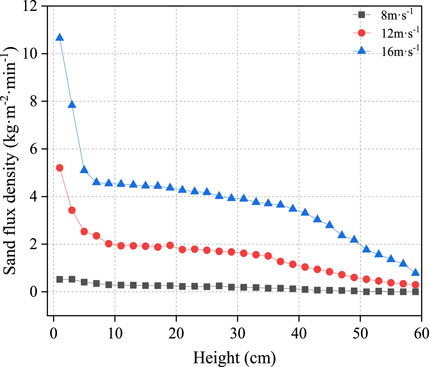
FIGURE 15. Changes of sand flux density at 10H2 after three rows of windbreak forest belts under different incoming wind velocities.
Figure 16 shows that when the incoming wind velocities are 8, 12 and 16 m s−1, the sand control efficiencies at 10H2 on the leeward side of the forest belt were 93.8, 91.6, and 88.1%, respectively. The efficiency of sand control was inversely proportional to the incoming wind velocity; that is, the higher the incoming wind velocity, the lower the corresponding sand control efficiency.
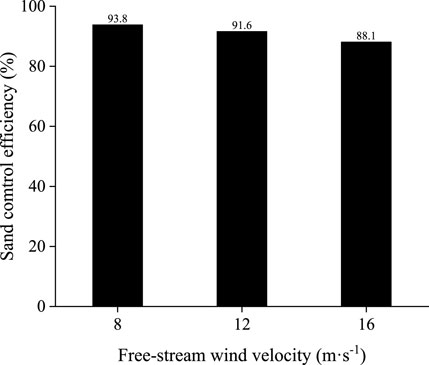
FIGURE 16. Histogram of sand control efficiency at 10H2 behind the three rows of windbreak forest belts under different incoming wind velocities.
Gillies et al. (2017) tested the sand control efficiencies of multiple sand barriers in California, United States. The results of the study show that when the distance between the sand barriers was 7H, the sand control efficiency reached a balance at 27H behind the barrier. At this time, the sand control efficiency at 50H on the leeward side of the sand barrier was reduced by 91.0%. When the distance between the sand barriers was 10H, the sand transport reached equilibrium at the 93H position, and the sand transport at the 50H position on the leeward side of the sand barrier was reduced by 50.0%. Zhang et al. (2020) set up three sand barriers, and when the distance between the sand barriers was 20H, the sand control efficiency was 89.6%. From this, it can be observed that when the incoming wind velocity was 8 and 12 m s−1, compared with the three sand barriers, the forest belt sand control efficiency in this study increased by 4.2 and 2.0%, respectively. The results show that the protection benefit of the forest belt is better than that of the three-row sand barriers with a spacing of 20H, which can effectively control the wind and sand hazards along the railway and is suitable for wind and sand protection in the Gobi area of the Lan-Xin Railway. Additionally, we found that when the incoming wind velocity was 16 m s−1, the sand control efficiency of the shelterbelt was 88.1%, which was slightly less than the sand control efficiency of the three sand barriers. This is because Gillies et al. (2017) studied the surface of quicksand, while this study focused on the surface of the Gobi. When the incoming wind velocity was too high, the initial velocity of the sand jump was high, the jump angle was high, and some of the sand jumped over the shelterbelt, which led to a decrease in the sand control efficiency of the shelterbelt.
To evaluate the protective benefits of the protective windbreak forest belts in the Gobi area of some sections of the Lan-Xin Railway, this study used numerical simulations and wind tunnel tests to study the protective windbreak forest belts composed of different numbers of belts. It analyzed the change characteristics of the flow field around the shelterbelt and the change law of the wind velocity profile, and conducted a comprehensive evaluation of its protection benefits from the perspectives of windproof efficiency and sand control efficiency. The following conclusions were obtained:
1) Affected by the forest belt, the wind velocity profile on the leeward side of the forest belt no longer followed a logarithmic change. Below the height of plant B, the airflow velocity was significantly reduced, and above the B plant height, the airflow velocity was slowly restored without the obstacle of the forest belt.
2) Under different incoming wind velocities, the maximum windproof efficiency on the leeward side of the forest belt appeared at 5H2. The maximum windproof efficiency was approximately 90%, and the minimum windproof efficiency was approximately 50%. With an increase in wind velocity, the wind windproof efficiency showed a decreasing trend.
3) In the vicinity of the forest belt, airflow encountered obstacles to generate velocity zones, forming airflow deceleration zones and airflow high-speed zones. The streamlines between the windbreak forest belts bent downwards, the airflow decreased significantly, and the sand velocity dropped below the starting wind velocity, causing most of the sand falls and deposits.
4) The forest belt had a significant effect on reducing the sand flux density. When the incoming wind velocity was 12 and 16 m s−1, a unique “elephant effect” appeared at a height of 4 cm on the Gobi gravel bed. As the wind-sand flow on the leeward side of the forest belt was in a saturated transport state, the “trunk effect” disappeared.
5) Under the three test wind velocities, the sand control efficiency of the forest belt was approximately 90%, which can effectively alleviate the wind and sand hazards along the railway. The protection forest belt can play an important role in the prevention and control of wind and sand disasters along railways.
The original contributions presented in the study are included in the article/Supplementary Material, further inquiries can be directed to the corresponding author.
KZ, JQ, XZ, LZ, and SL contributed to conception and design of the study. KZ organized the database. XZ performed the statistical analysis. KZ wrote the first draft of the manuscript. JQ, XZ, LZ, and SL wrote sections of the manuscript. All authors contributed to manuscript revision, read, and approved the submitted version.
This research was financially supported by the fellowship of the China Postdoctoral Science Foundation (2021M703466), the Basic Research Innovation Group Project of Gansu Province, China (21JR7RA347), the Natural Science Foundation of Gansu Province, China (20JR10RA231).
The authors declare that the research was conducted in the absence of any commercial or financial relationships that could be construed as a potential conflict of interest.
All claims expressed in this article are solely those of the authors and do not necessarily represent those of their affiliated organizations, or those of the publisher, the editors and the reviewers. Any product that may be evaluated in this article, or claim that may be made by its manufacturer, is not guaranteed or endorsed by the publisher.
Amichev, B. Y., Bentham, M. J., Cerkowniak, D., Kort, J., Kulshreshtha, S., Laroque, C. P., et al. (2015). Mapping and Quantification of Planted Tree and Shrub Shelterbelts in Saskatchewan, Canada. Agroforest Syst. 89, 49–65. doi:10.1007/s10457-014-9741-2
Baniamerian, Z., and Mehdipour, R. (2019). A New Approach in Reducing Sand Deposition on Railway Tracks to Improve Transportation. Aeolian Res. 41, 100537. doi:10.1016/j.aeolia.2019.07.003
Bourdin, P., and Wilson, J. D. (2008). Windbreak Aerodynamics: Is Computational Fluid Dynamics Reliable? Bound. Lay. Meteorol. 126 (2), 181–208. doi:10.1007/s10546-007-9229-y
Chang, J. C., and Hanna, S. R. (2004). Air Quality Model Performance Evaluation. Meteorol. Atmos. Phys. 87 (1-3), 167–196. doi:10.1007/s00703-003-0070-7
Dong, Z. B., Luo, W. Y., Qian, G. Q., and Wang, H. T. (2007). A Wind Tunnel Simulation of the Mean Velocity Fields Behind Upright Porous Fences. Agric. For. Meteorol. 146 (1–2), 82–93. doi:10.1016/j.agrformet.2007.05.009
Dong, Z., Wang, H., Liu, X., and Wang, X. (2004). A Wind Tunnel Investigation of the Influences of Fetch Length on the Flux Profile of a Sand Cloud Blowing Over a Gravel Surface. Earth Surf. Process. Landforms 29, 1613–1626. doi:10.1002/esp.1116
Gillies, J. A., Etyemezian, V., Nikolich, G., Glick, R., Rowland, P., Pesce, T., et al. (2017). Effectiveness of an Array of Porous Fences to Reduce Sand Flux: Oceano Dunes, Oceano CA. J. Wind Eng. Ind. Aerodyn. 168, 247–259. doi:10.1016/j.jweia.2017.06.015
Huang, N., He, P., and Zhang, J. (2020). Large-Eddy Simulation of Sand Transport under Unsteady Wind. Geomorphology 358, 107105. doi:10.1016/j.geomorph.2020.107105
Judd, M. J., Raupach, M. R., and Finnigan, J. J. (1996). A Wind Tunnel Study of Turbulent Flow Around Single and Multiple Windbreaks, Part I: Velocity fields. Bound. Lay. Meteorol. 80 (1), 127–165. doi:10.1007/bf00119015
Lee, S.-J., Park, K.-C., and Park, C.-W. (2002). Wind Tunnel Observations about the Shelter Effect of Porous Fences on the Sand Particle Movements. Atmos. Environ. 36 (9), 1453–1463. doi:10.1016/s1352-2310(01)00578-7
Li, F.-R., Liu, J.-L., Sun, T.-S., Ma, L.-F., Liu, L.-L., and Yang, K. (2016). Impact of Established Shrub Shelterbelts Around Oases on the Diversity of Ground Beetles in Arid Ecosystems of Northwestern China. Insect Conserv. Divers. 9 (2), 135–148. doi:10.1111/icad.12152
Lin, X. G. (2020). Study on Windproofing Effect of Korshinskii Shrub with Different Distribution Patterns. Master Dissertation. Beijing, China: Beijing Forestry University.
Lv, P., Dong, Z. B., and Ma, X. M. (2016). Aeolian Sand Transport above Three Desert Surfaces in Northern China with Different Characteristics (Shifting Sand, Straw Checkerboard, and Gravel): Field Observations. Environ. Earth Sci. 75 (7), 577. doi:10.1007/s12665-016-5361-7
Ma, R., Li, J. R., Ma, Y. J., Shan, L. S., Li, X. L., and Wei, L. Y. (2019). A Wind Tunnel Study of the Airflow Field and Shelter Efficiency of Mixed Windbreaks. Aeolian Res. 41 (3), 80–88. doi:10.1016/j.aeolia.2019.100544
Mahgoub, A. O., and Ghani, S. (2021). Numerical and Experimental Investigation of Utilizing the Porous media Model for Windbreaks CFD Simulation. Sustain. Cities Soc. 65, 102648. doi:10.1016/j.scs.2020.102648
Qu, J. J., Huang, N., Tuo, W. Q., Lei, J. Q., Dong, Z. B., Liu, X. W., et al. (2005). Structural Characteristics of Gobi Sand-Drift and its Significance. Adv. Earth Sci. 20 (01), 19–23. doi:10.11867/j.issn.1001-8166.2005.01.0019
Rosenfeld, M., Marom, G., and Bitan, A. (2010). Numerical Simulation of the Airflow across Trees in a Windbreak. Boun. Lay. Meteorol. 135 (1), 89–107. doi:10.1007/s10546-009-9461-8
Santiago, J. L., Martín, F., Cuerva, A., Bezdenejnykh, N., and Sanz-Andrés, A. (2007). Experimental and Numerical Study of Wind Flow Behind Windbreaks. Atmos. Environ. 41 (30), 6406–6420. doi:10.1016/j.atmosenv.2007.01.014
Schwartz, R. C., Fryrear, D. W., Harris, B. L., Bilbro, J. D., and Juo, A. S. R. (1995). Mean Flow and Shear Stress Distributions as Influenced by Vegetative Windbreak Structure. Agric. For. Meteorol. 75 (1-3), 1–22. doi:10.1016/0168-1923(94)02206-y
Takahashi, S., Du, M., Wu, P., Maki, T., and Kawashima, S. (1998). Three Dimensional Numerical Simulation of the Flow over Complex Terrain with Windbreak Hedge. Environ. Model. Softw. 13 (3/4), 257–265. doi:10.1016/s1364-8152(98)00026-7
Tan, L., Zhang, W., Qu, J., Wang, J., An, Z., and Li, F. (2016). Aeolian Sediment Transport over Gobi: Field Studies Atop the Mogao Grottoes, China. Aeolian Res. 21, 53–60. doi:10.1016/j.aeolia.2016.03.002
Tuzet, A., and Wilson, J. D. (2007). Measured Winds about a Thick Hedge. Agric. For. Meteorol. 145 (3-4), 195–205. doi:10.1016/j.agrformet.2007.04.013
Ucar, T., and Hall, F. R. (2001). Windbreaks as a Pesticide Drift Mitigation Strategy: a Review. Pest Manag. Sci. 57 (8), 663–675. doi:10.1002/ps.341
Wang, H., and Takle, E. S. (1995). A Numerical Simulation of Boundary-Layer Flows Near forest Belts. Bound. Lay. Meteorol. 75 (1-2), 141–173. doi:10.1007/bf00721047
Wang, H., Takle, E. S., and Shen, J. M. (2003). Forest Belts and Windbreaks: Mathematical Modeling and Computer Simulations of Turbulent Flows. Annu. Rev. Fluid Mech. 33 (1), 549–586. doi:10.1146/annurev.fluid.33.1.549
Wang, T., Qu, J., Ling, Y., Liu, B., and Xiao, J. (2018). Shelter Effect Efficacy of Sand Fences: A Comparison of Systems in a Wind Tunnel. Aeolian Res. 30 (30), 32–40. doi:10.1016/j.aeolia.2017.11.004
Wang, T., Qu, J., Ling, Y., Xie, S., and Xiao, J. (2017). Wind Tunnel Test on the Effect of Metal Net Fences on Sand Flux in a Gobi Desert, China. J. Arid Land 9 (6), 888–899. doi:10.1007/s40333-017-0068-5
Wang, T., Qu, J., and Niu, Q. (2020). Comparative Study of the Shelter Efficacy of Straw Checkerboard Barriers and Rocky Checkerboard Barriers in a Wind Tunnel. Aeolian Res. 43, 100575. doi:10.1016/j.aeolia.2020.100575
White, B. R. (1996). Laboratory Simulation of Aeolian Sand Transport and Physical Modeling of Flow Around Dunes. Ann. Arid Zone 35 (3), 187–213.
Zhan, K., Liu, S., Yang, Z., Fang, E., Zhou, L., and Huang, N. (2017). Effects of Sand-Fixing and Windbreak Forests on Wind Flow: a Synthesis of Results from Field Experiments and Numerical Simulations. J. Arid Land 9, 1–12. doi:10.1007/s40333-016-0058-z
Zhang, K. C., Qu, J. J., Liao, K. T., Niu, Q. H., and Han, Q. J. (2010). Damage by Wind-Blown Sand and its Control along Qinghai-Tibet Railway in China. Aeolian Res. 1 (3), 143–146. doi:10.1016/j.aeolia.2009.10.001
Zhang, K., Zhao, P. W., Zhao, J. C., and Zhang, X. X. (2020). Protective Effect of Multi-Row HDPE Board Sand Fences: A Wind Tunnel Study. Int. Soil Water Conservation Res. 9 (2), 103–115. doi:10.1016/j.iswcr.2020.08.006
Zhang, W., Wang, T., Wang, W., and Liu, B. (2011). Wind Tunnel Experiments on Vertical Distribution of Wind-Blown Sand Flux and Change of the Quantity of Sand Erosion and Deposition above Gravel Beds under Different Sand Supplies. Environ. Earth Sci. 64 (4), 1031–1038. doi:10.1007/s12665-011-0921-3
Keywords: railway, gobi, wind-blown sand, shelterbelt, protective benefit
Citation: Zhang K, Qu J, Zhang X, Zhao L and Li S (2022) Protective Efficiency of Railway Arbor-Shrub Windbreak Forest Belts in Gobi Regions: Numerical Simulation and Wind Tunnel Tests. Front. Environ. Sci. 10:885070. doi: 10.3389/fenvs.2022.885070
Received: 27 February 2022; Accepted: 11 April 2022;
Published: 29 April 2022.
Edited by:
Bailiang Li, Xi’an Jiaotong-Liverpool University, ChinaCopyright © 2022 Zhang, Qu, Zhang, Zhao and Li. This is an open-access article distributed under the terms of the Creative Commons Attribution License (CC BY). The use, distribution or reproduction in other forums is permitted, provided the original author(s) and the copyright owner(s) are credited and that the original publication in this journal is cited, in accordance with accepted academic practice. No use, distribution or reproduction is permitted which does not comply with these terms.
*Correspondence: Jianjun Qu, cXVqaWFuakBsemIuYWMuY24=
Disclaimer: All claims expressed in this article are solely those of the authors and do not necessarily represent those of their affiliated organizations, or those of the publisher, the editors and the reviewers. Any product that may be evaluated in this article or claim that may be made by its manufacturer is not guaranteed or endorsed by the publisher.
Research integrity at Frontiers

Learn more about the work of our research integrity team to safeguard the quality of each article we publish.